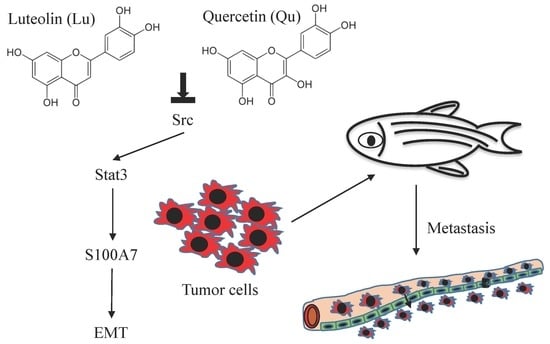
Dietary Flavonoids Luteolin and Quercetin Inhibit Migration and Invasion of Squamous Carcinoma through Reduction of Src/Stat3/S100A7 Signaling
Abstract
1. Introduction
2. Materials and Methods
2.1. Chemicals and Reagents
2.2. Cell Culture
2.3. Cell Viability Assay
2.4. Preparation of Cell Lysates
2.5. Western Blotting
2.6. Cloning of Full-Length cDNA of S100A7
2.7. Luciferase Assay
2.8. Cell Migration Assay
2.9. Cell Invasion Assay
2.10. Knockdown of S100A7 by Short Hairpin (sh) RNA
2.11. Zebrafish Metastasis Model
2.12. Statistical Analysis
3. Results
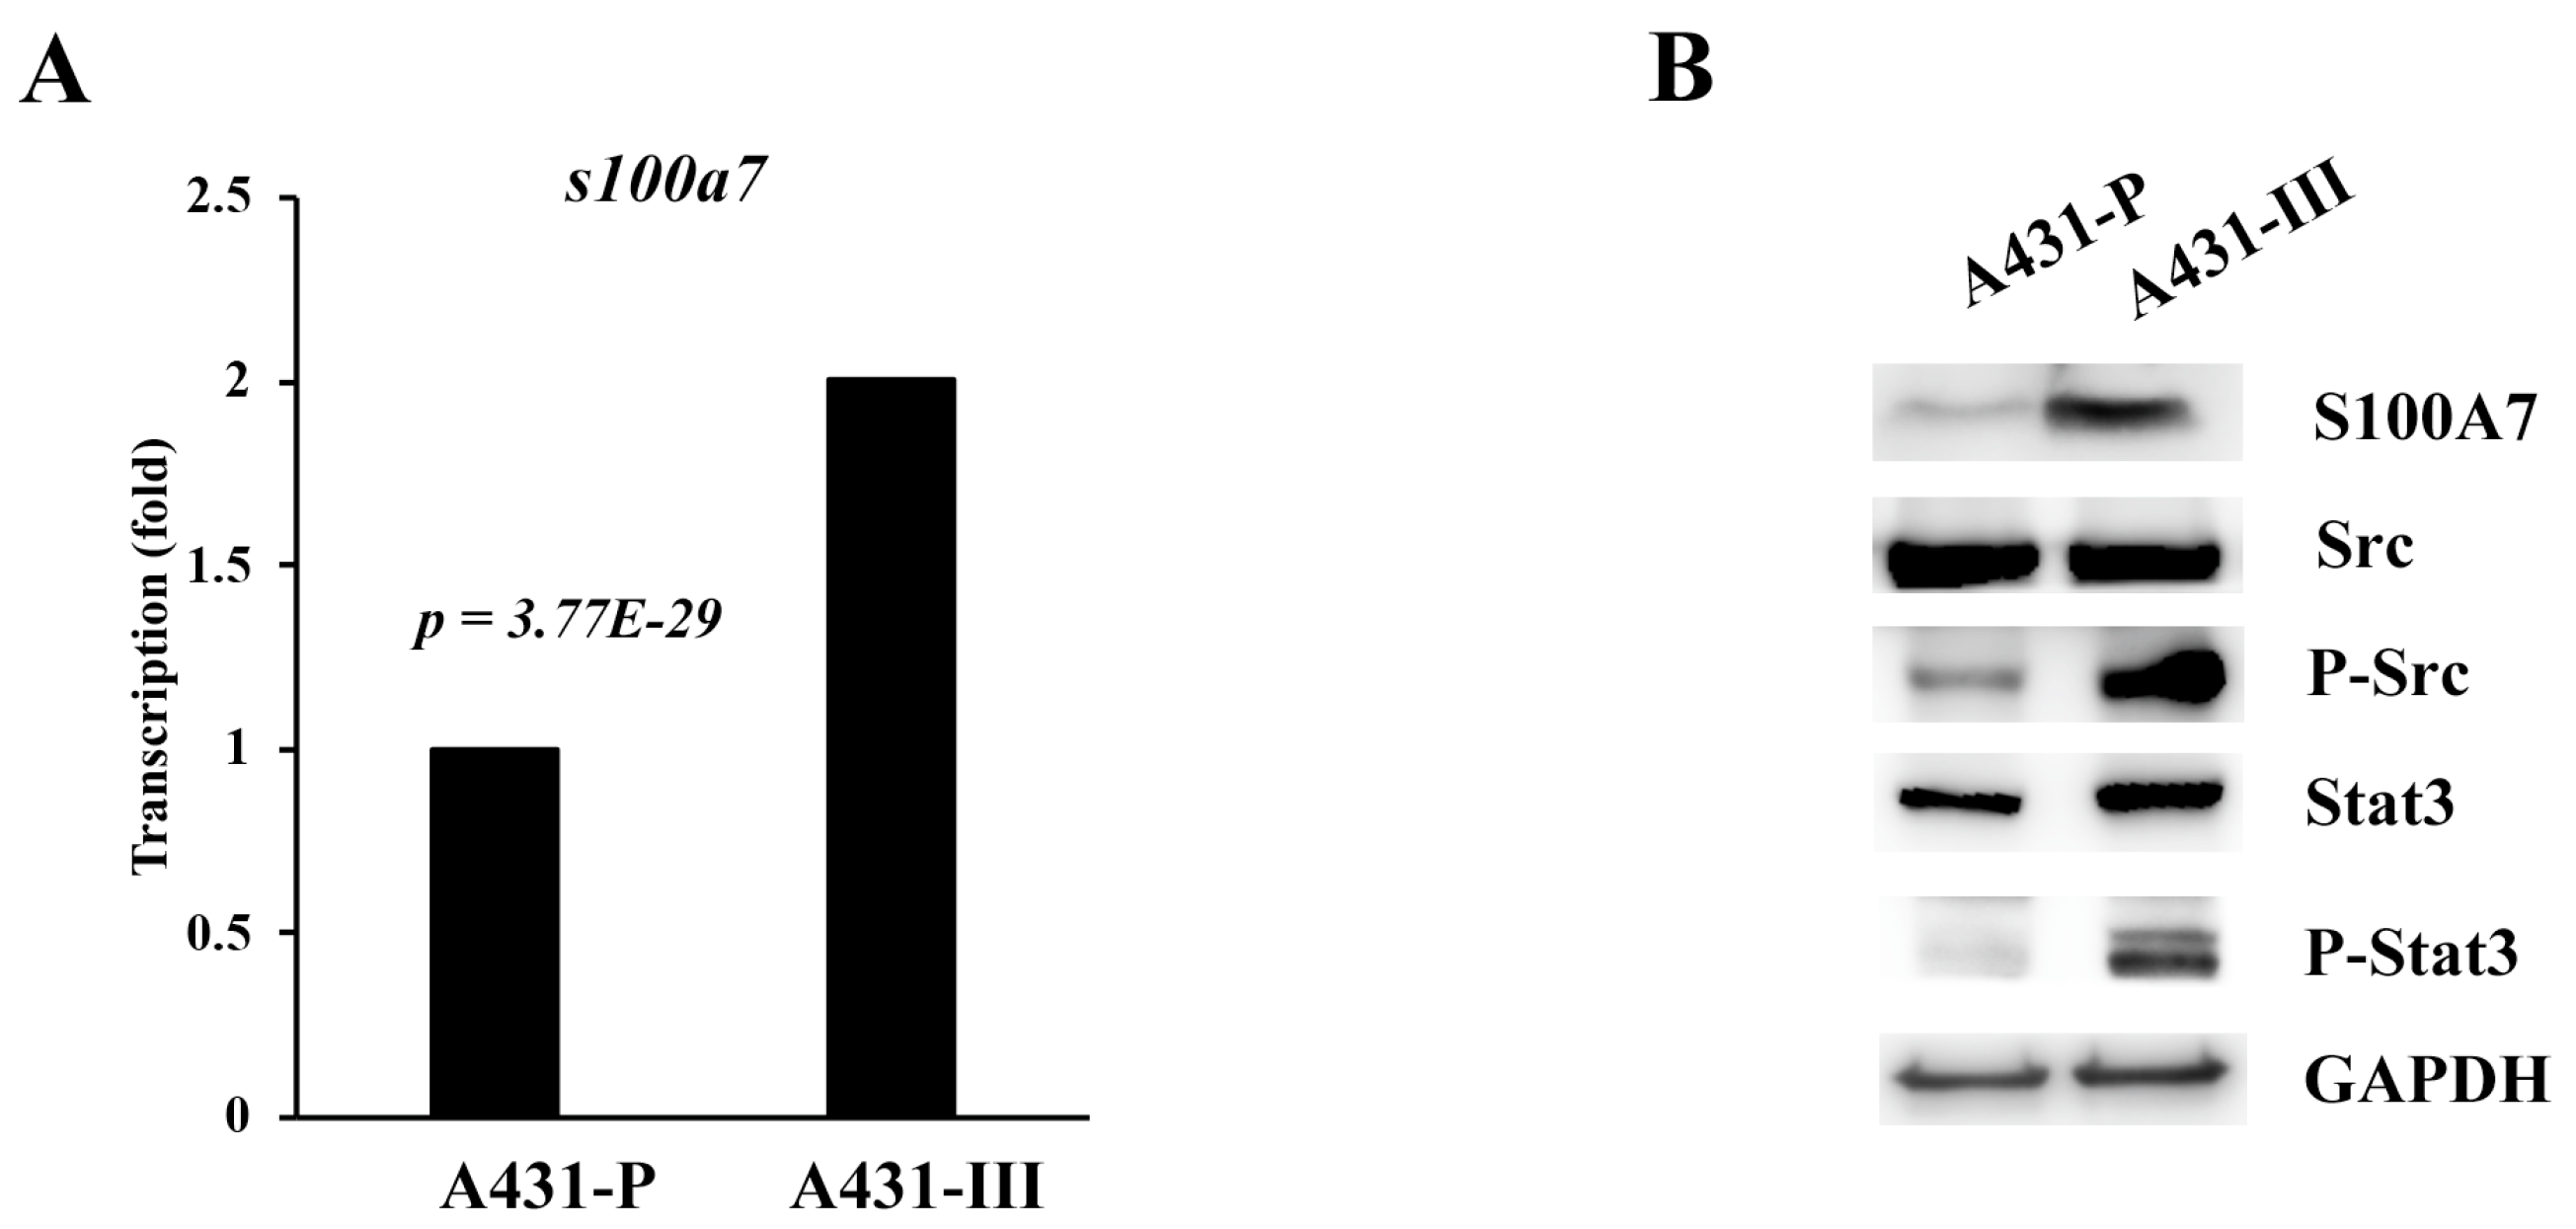
3.1. S100A7 is more Highly Expressed in Cervical Cancer Patients and A431-III Cells Accompanied by Activation of Src/Stat3 Signaling
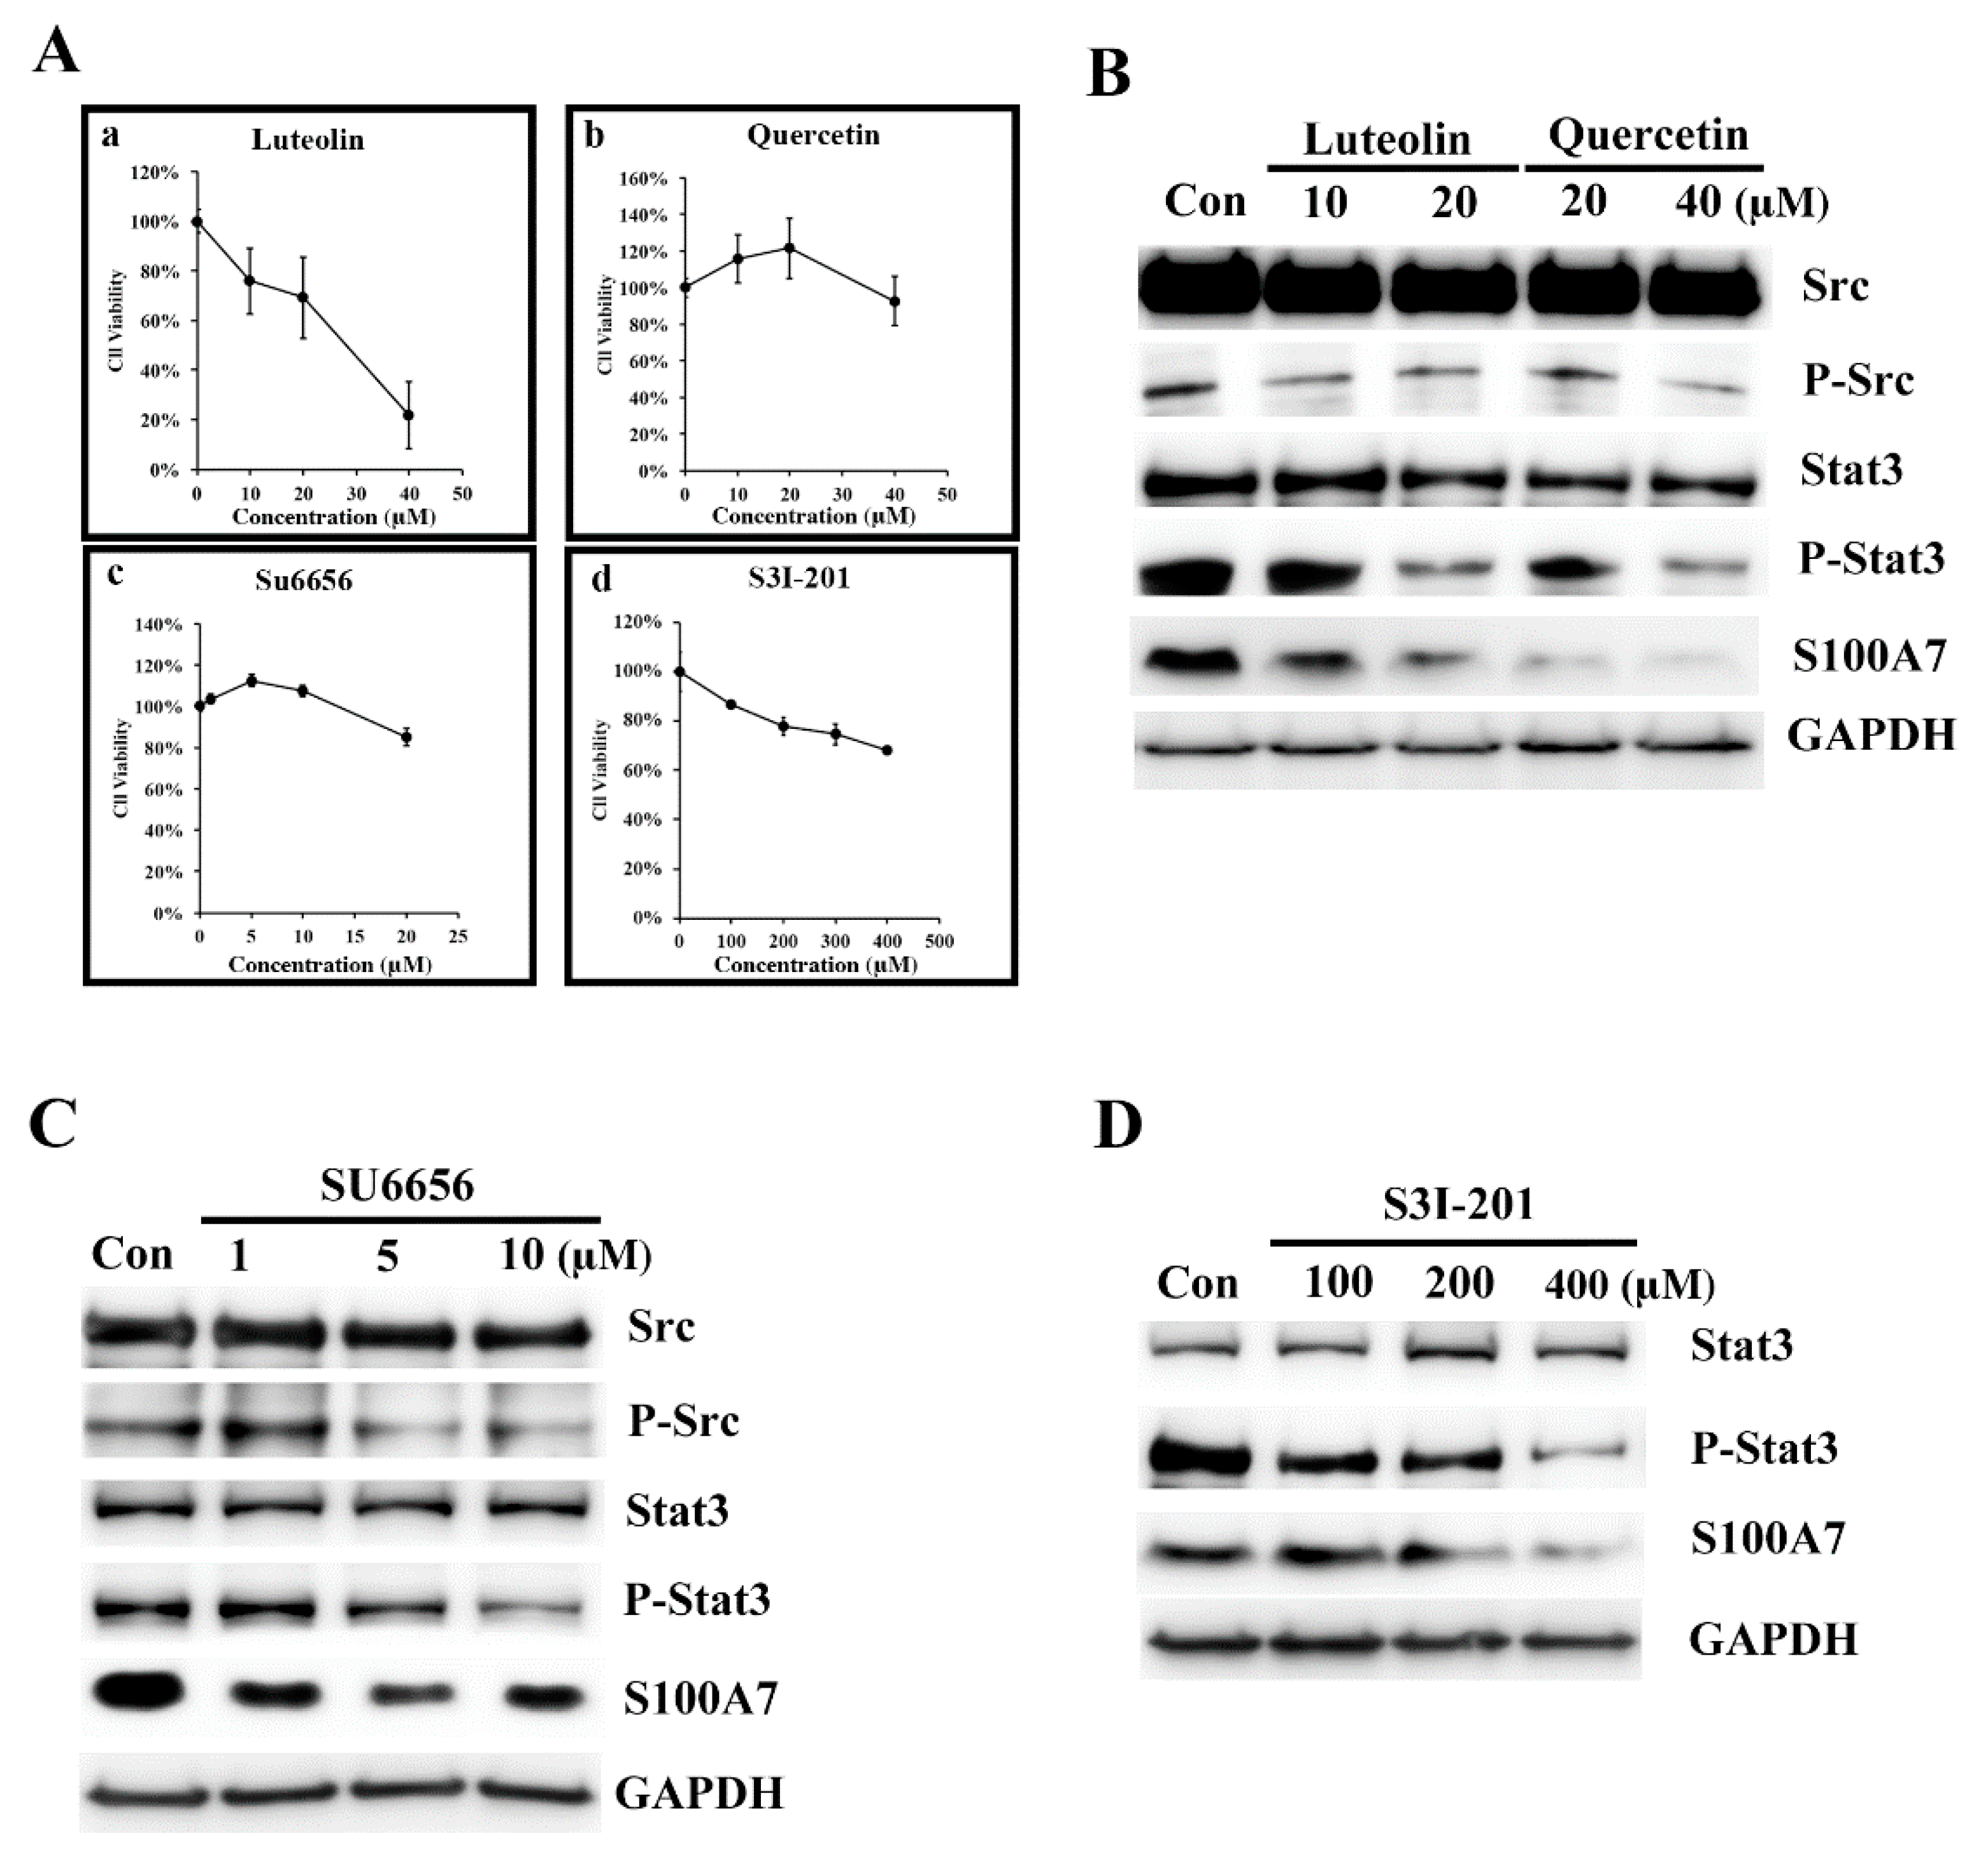
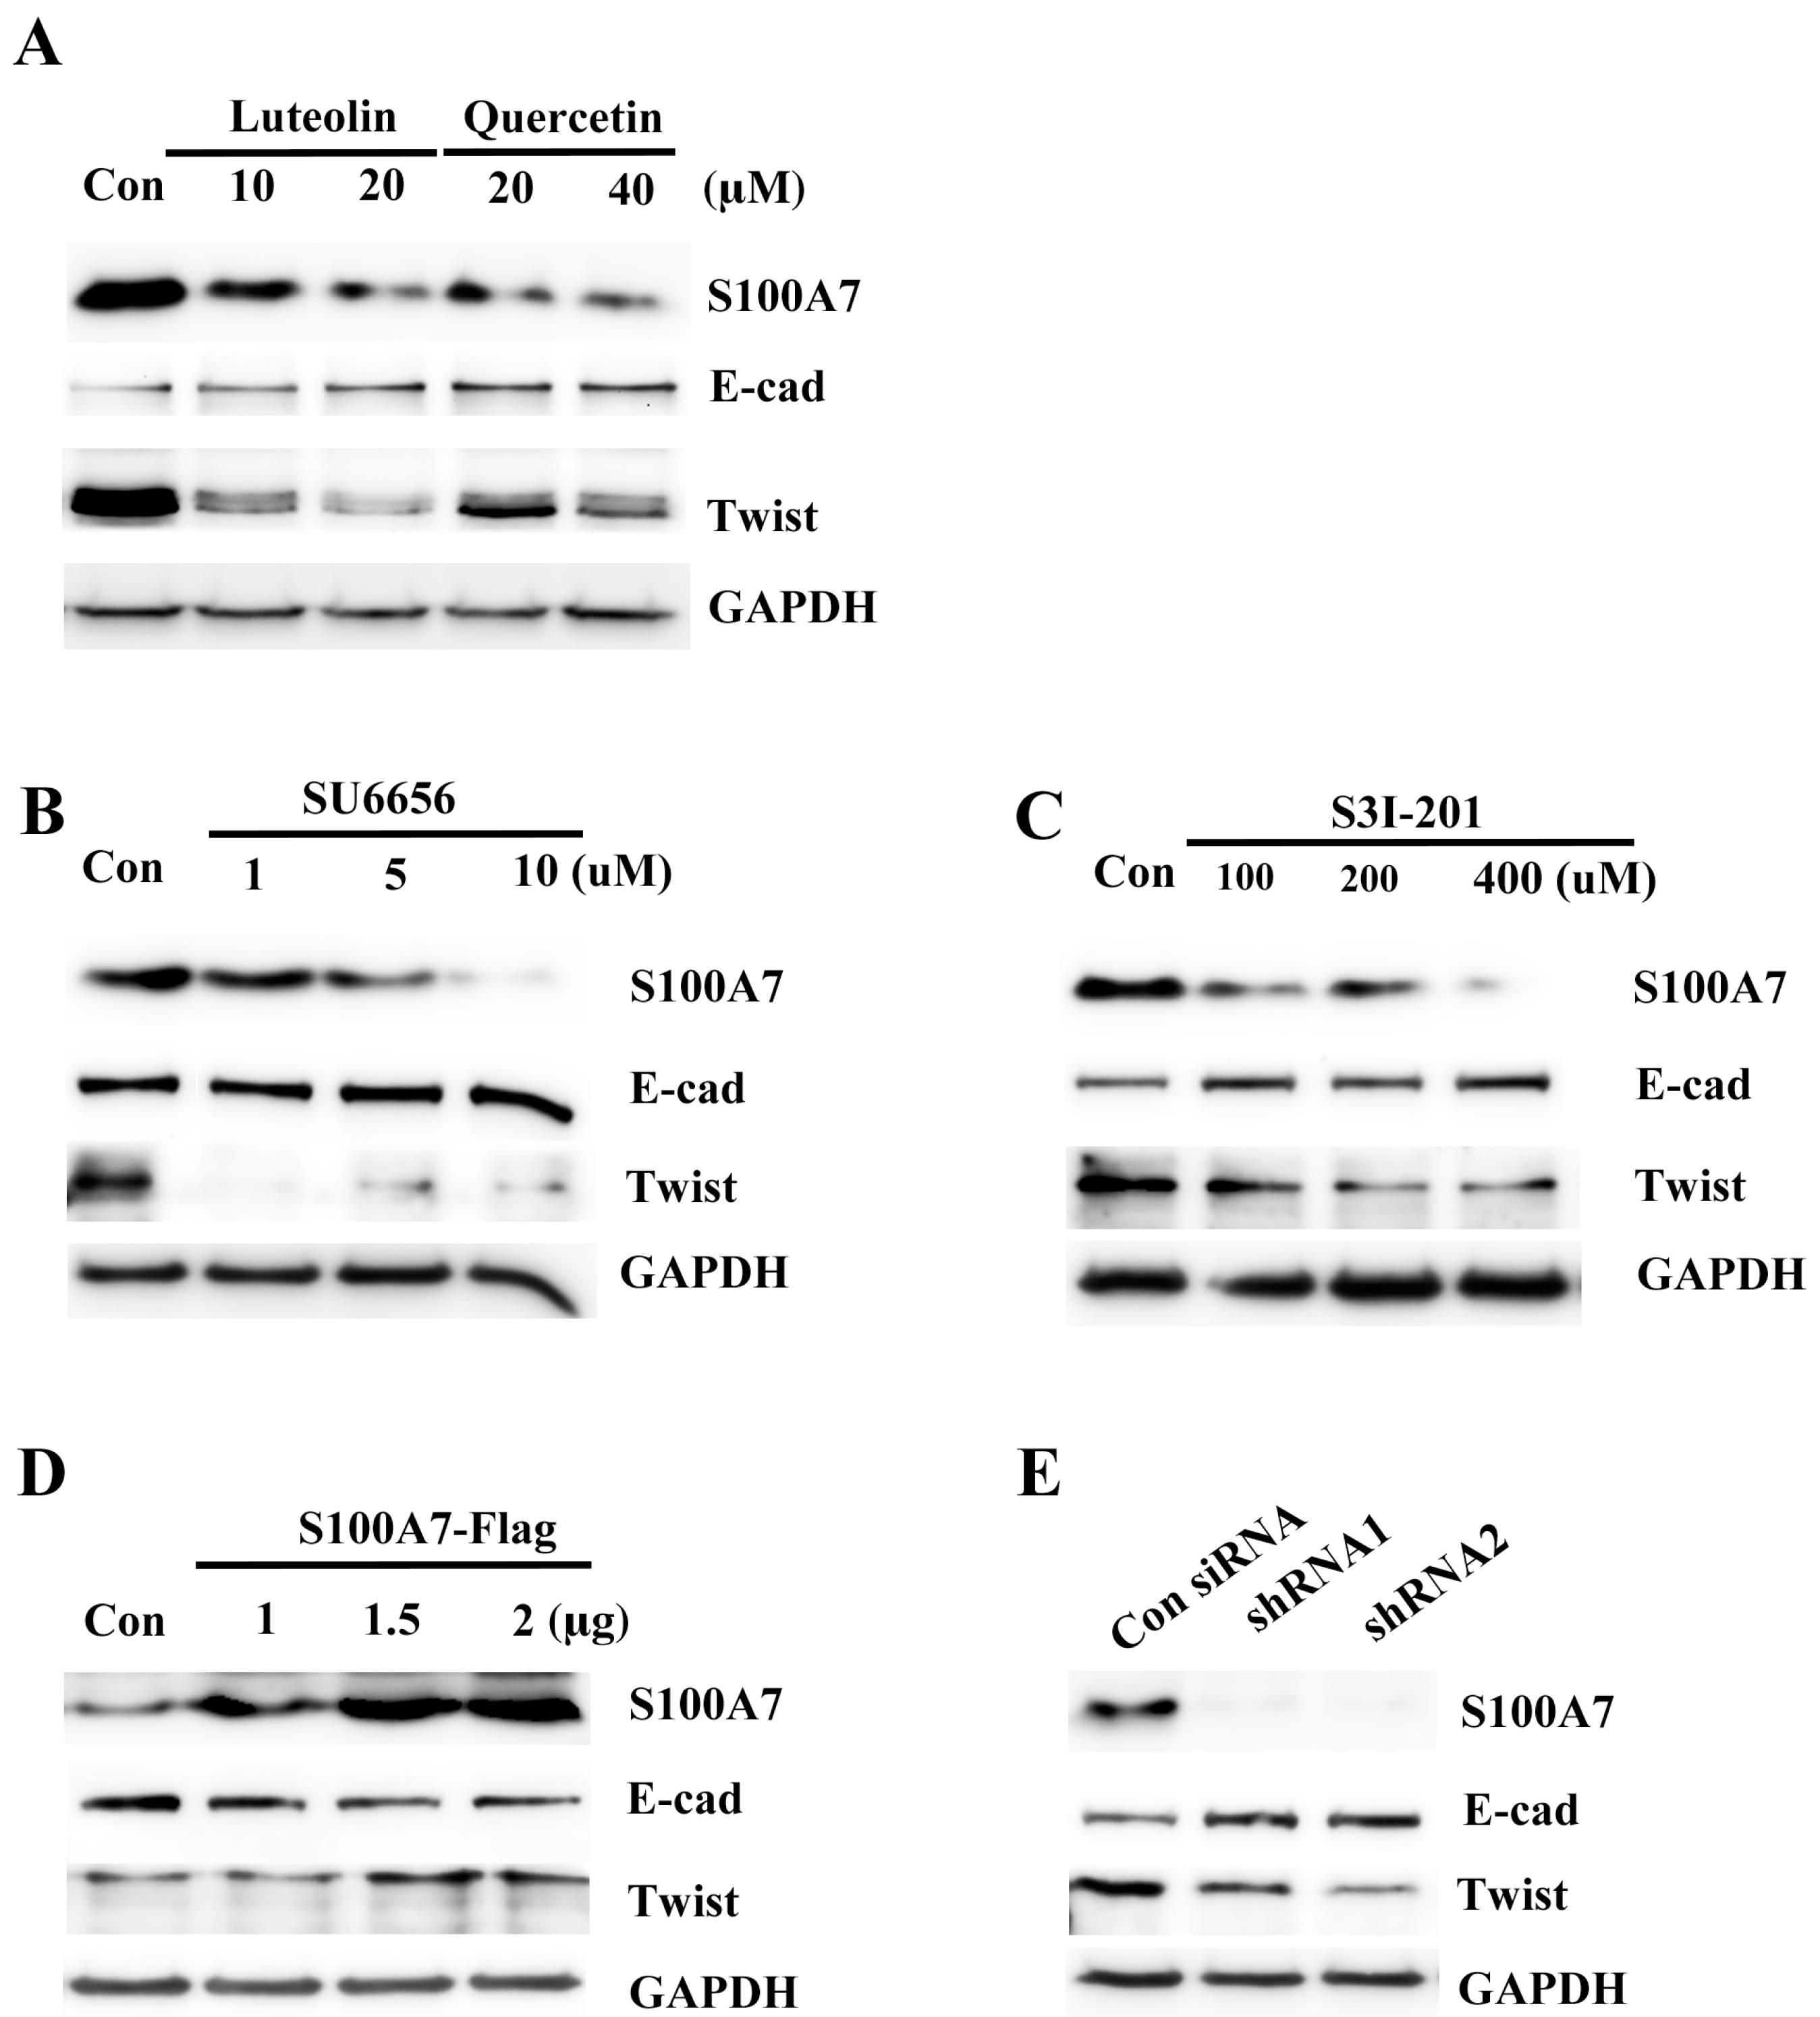
3.2. Luteolin (Lu) and Quercetin (Qu) Inhibit S100A7 in A431-III Cells by Suppressing Src/Stat3 Signaling
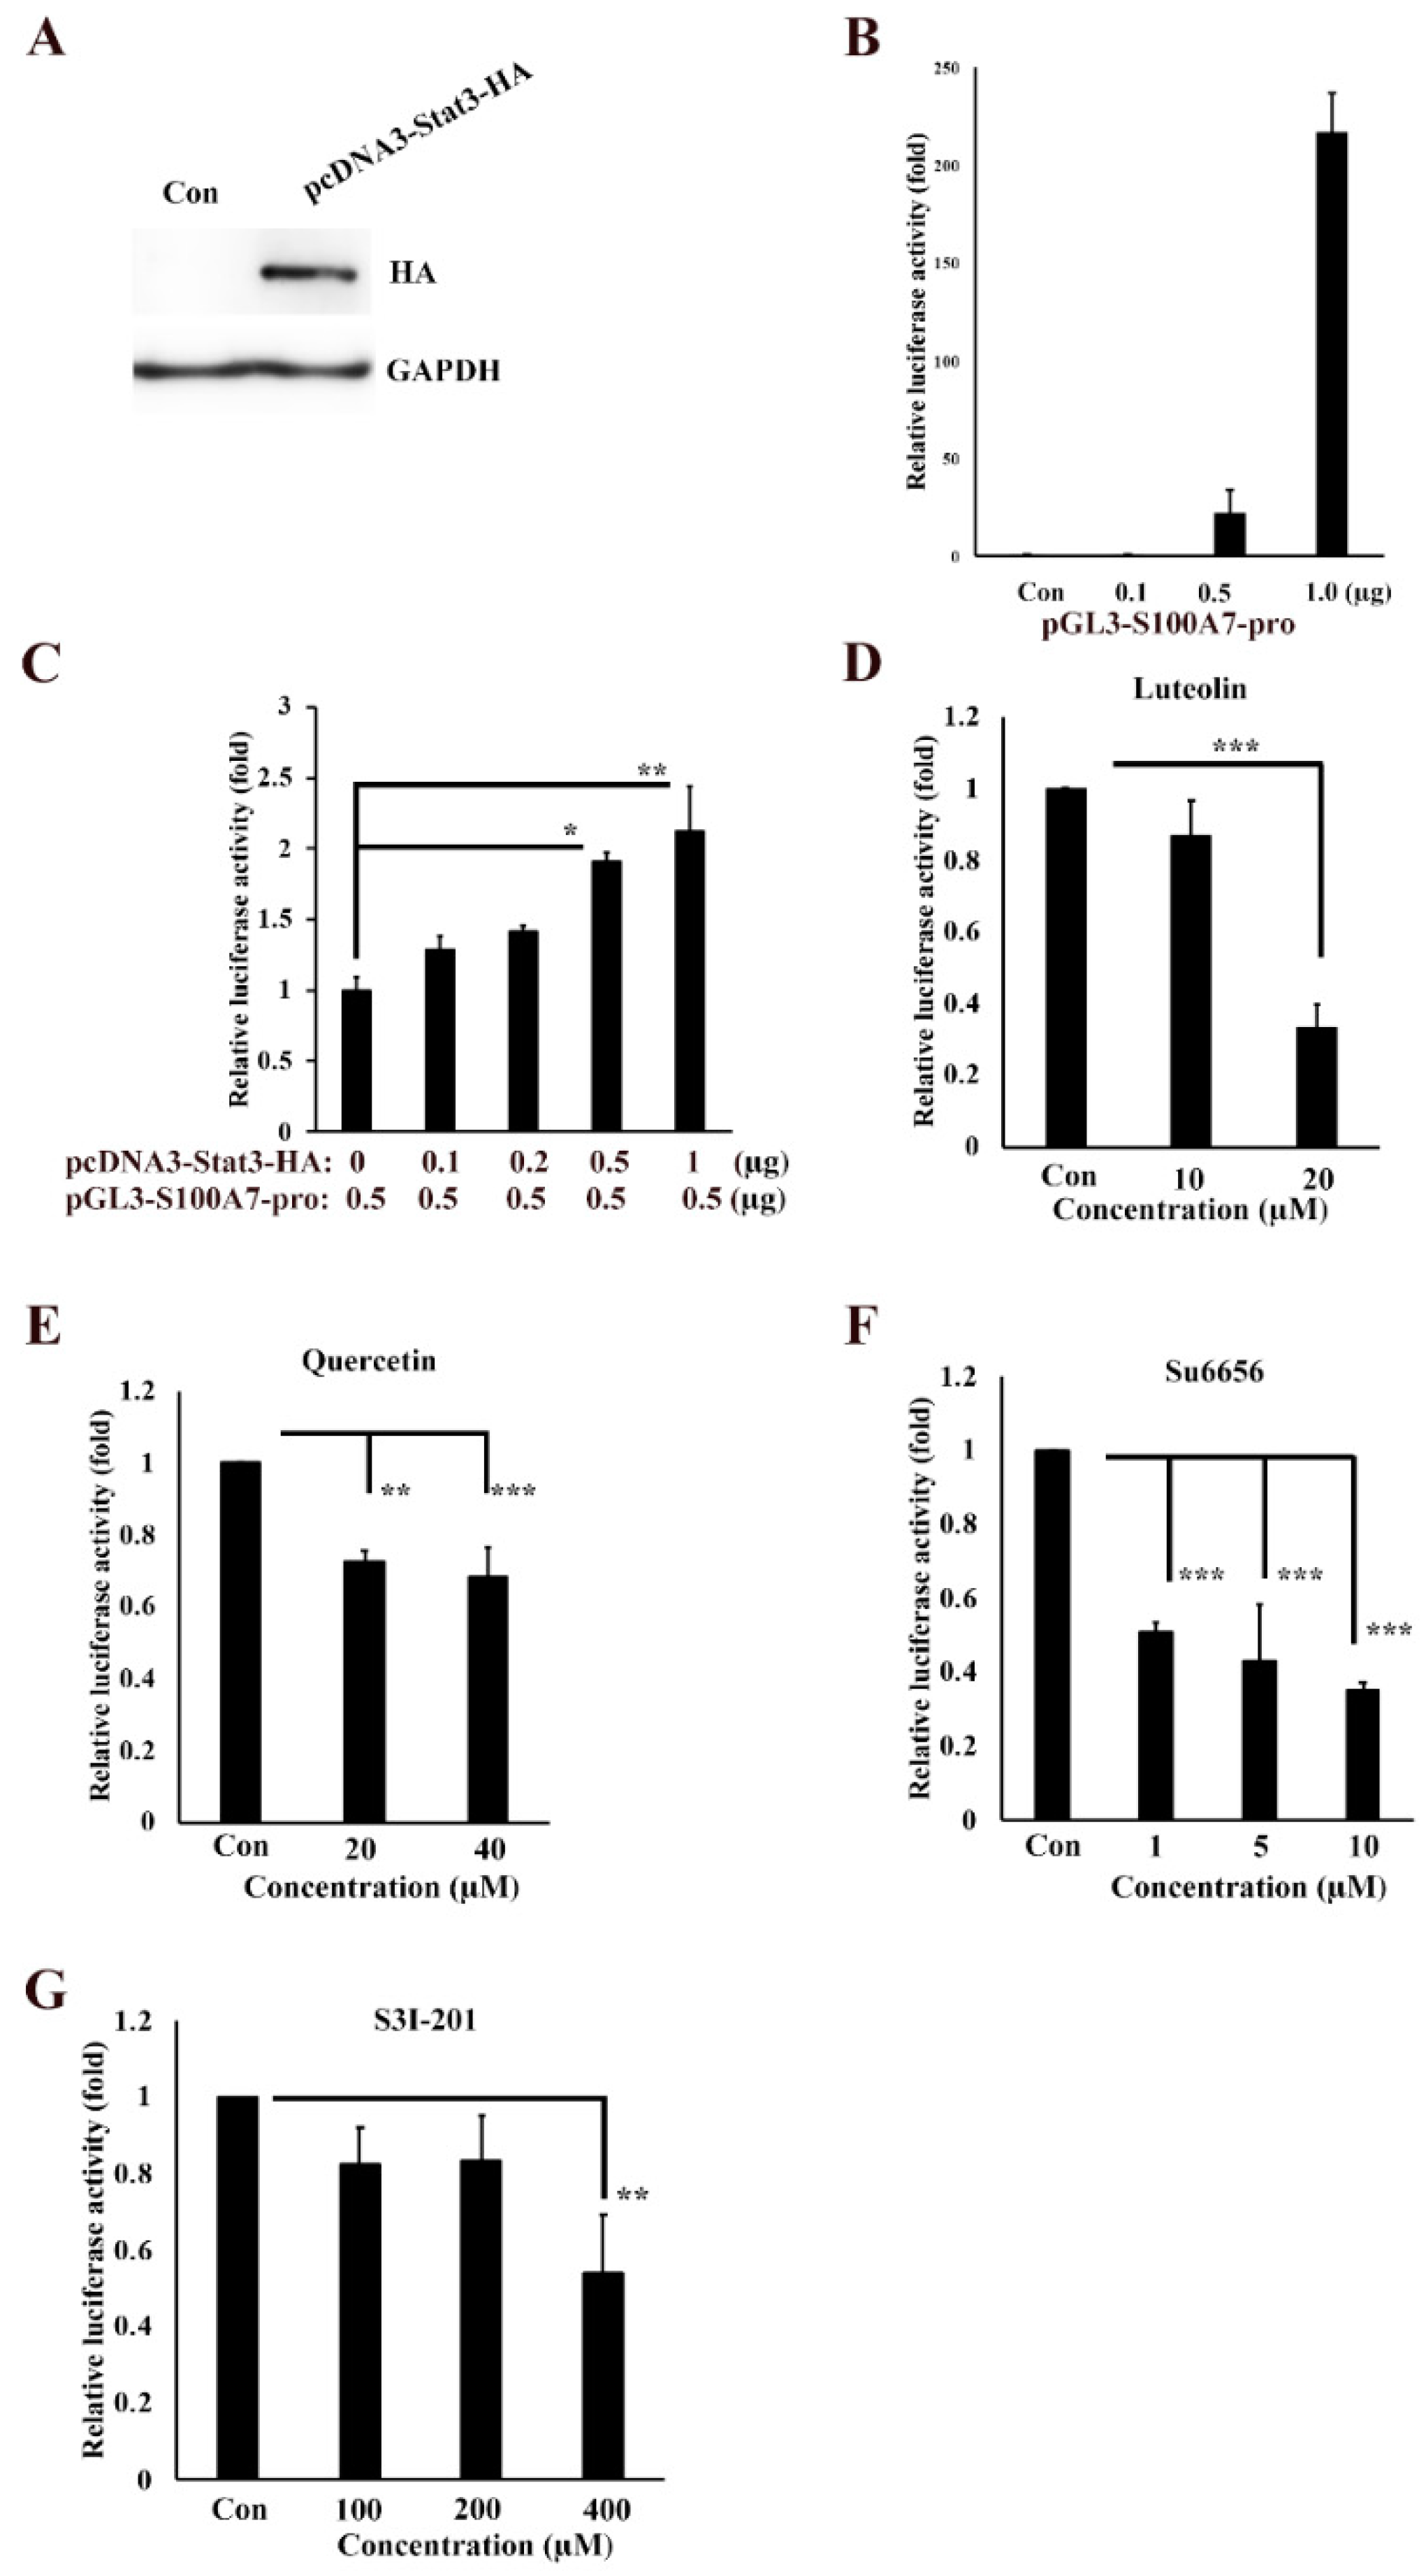
3.3. Transactivation Activity of S100A7 is Regulated by Src/Stat3 Signaling
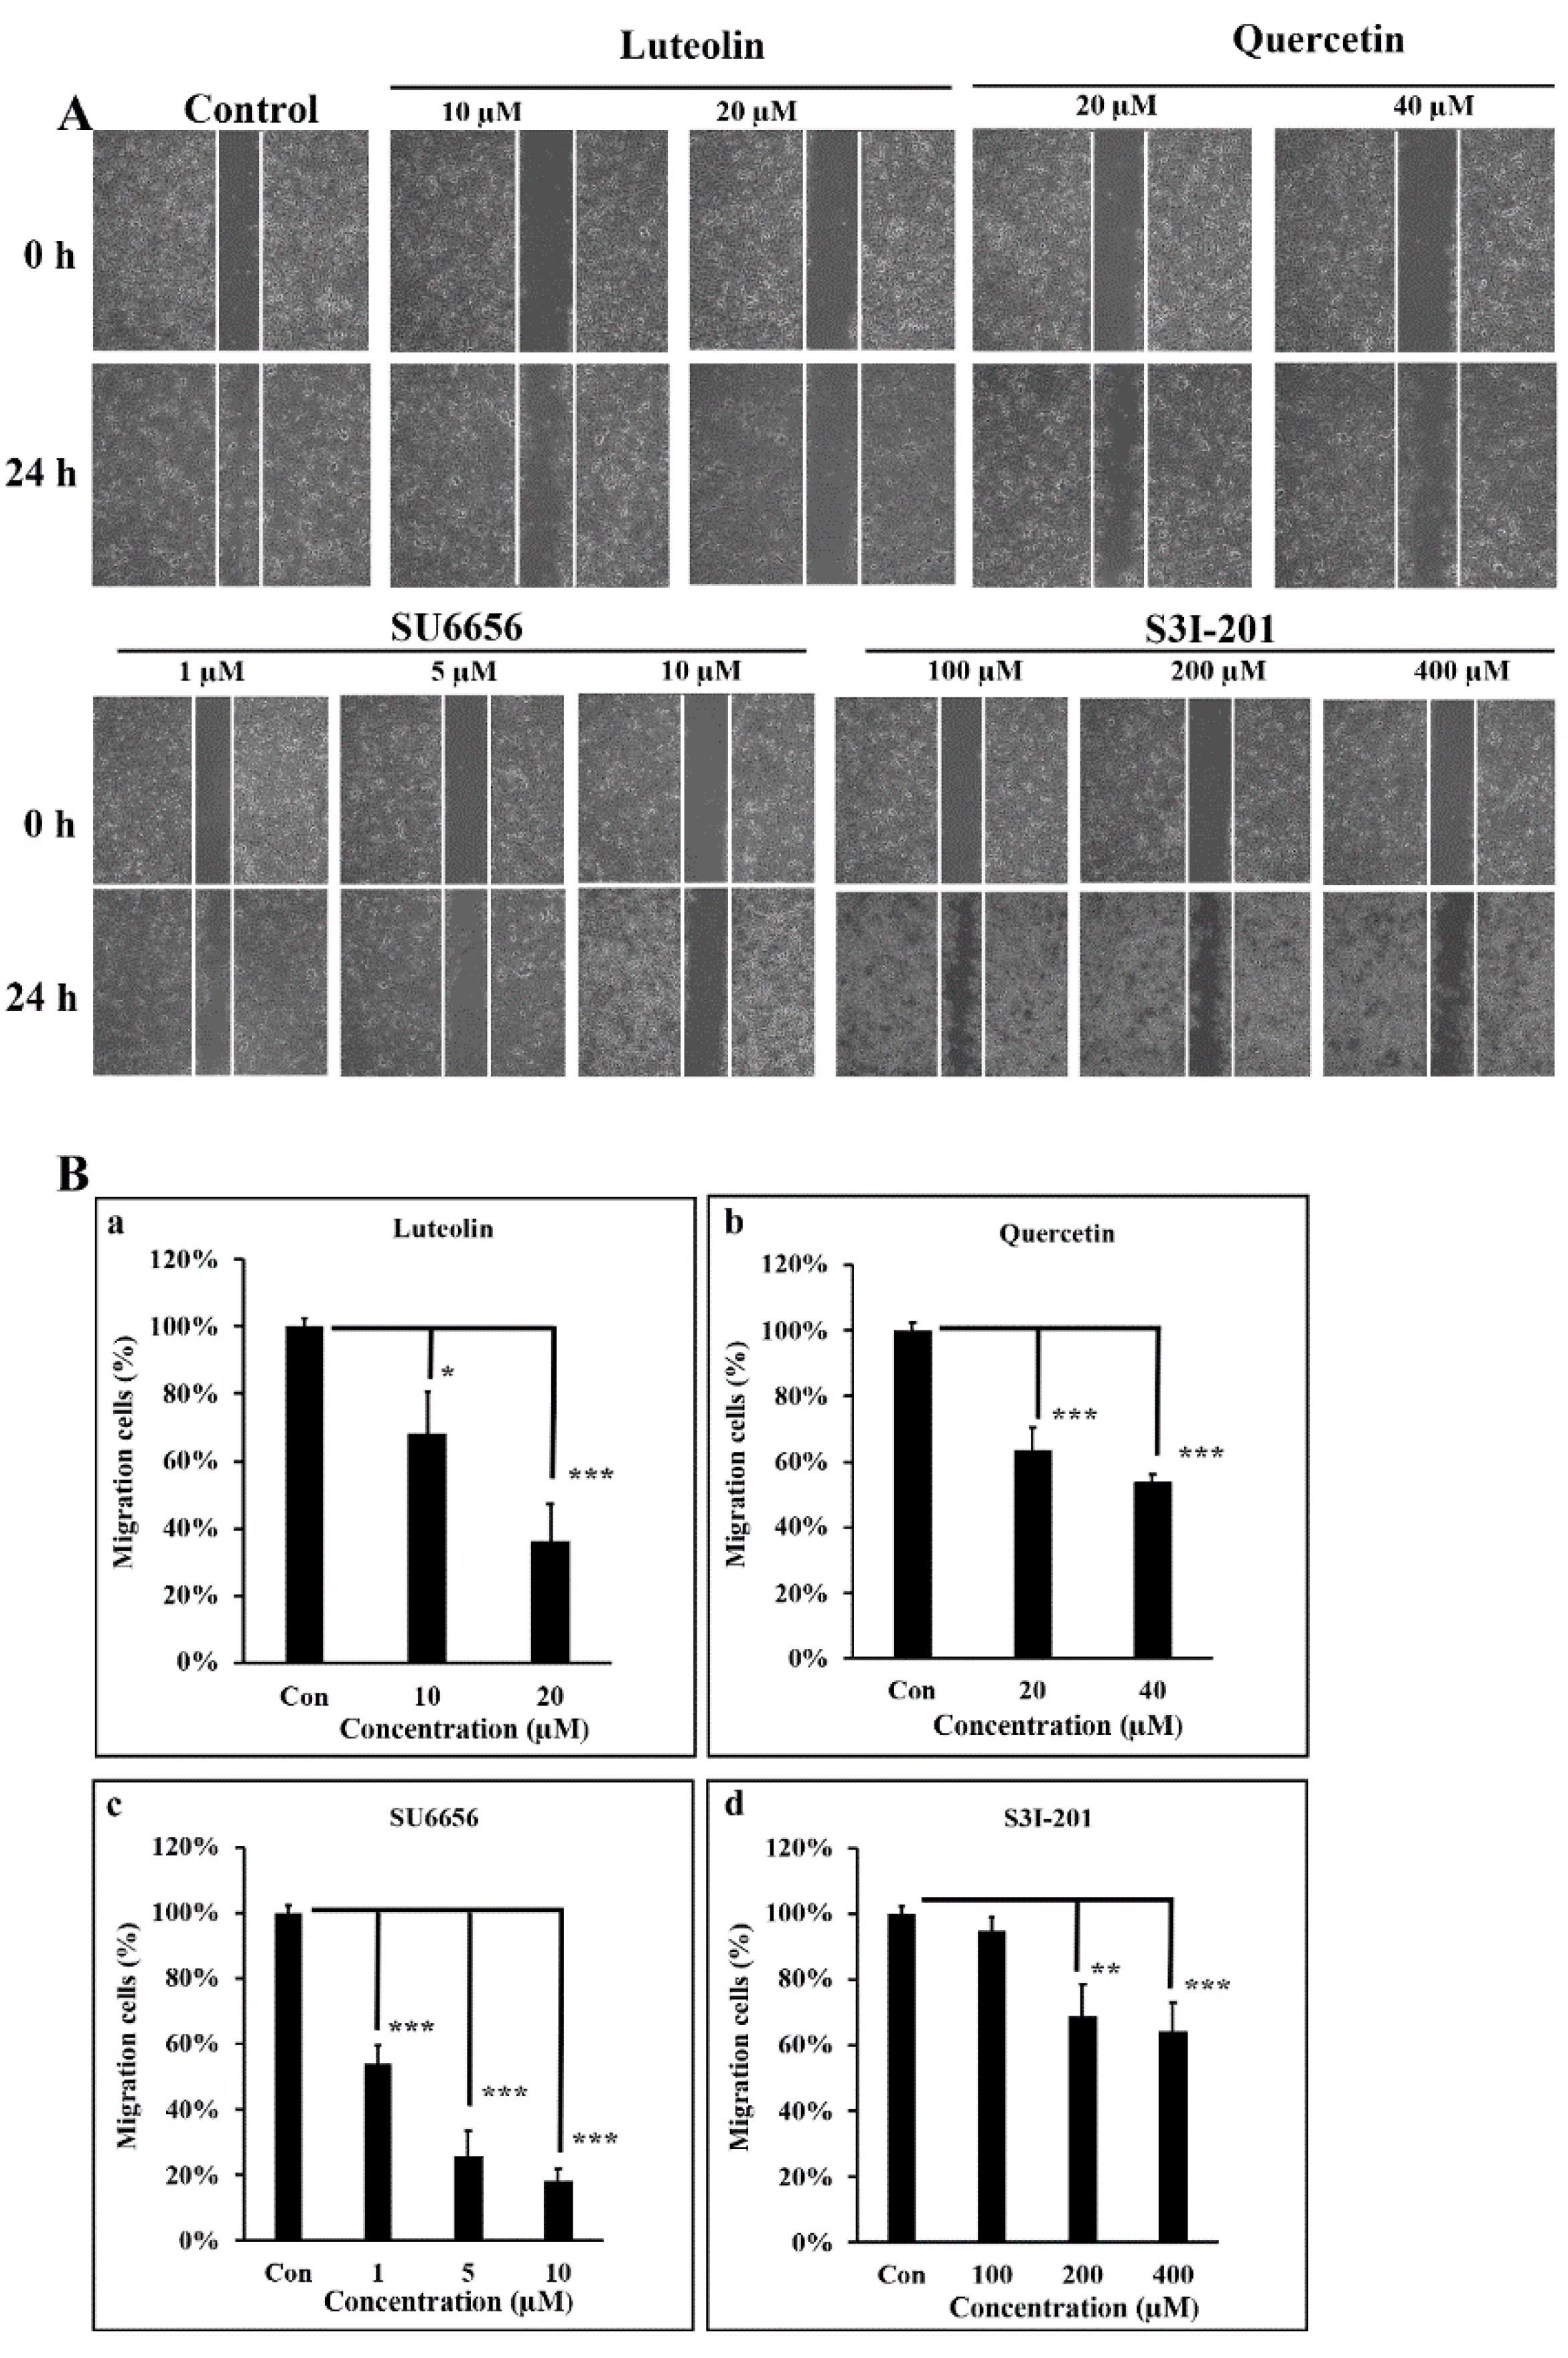
3.4. Src/Stat3 Signaling Regulates the Migratory Ability of A431-III, which is Reduced by Lu and Qu
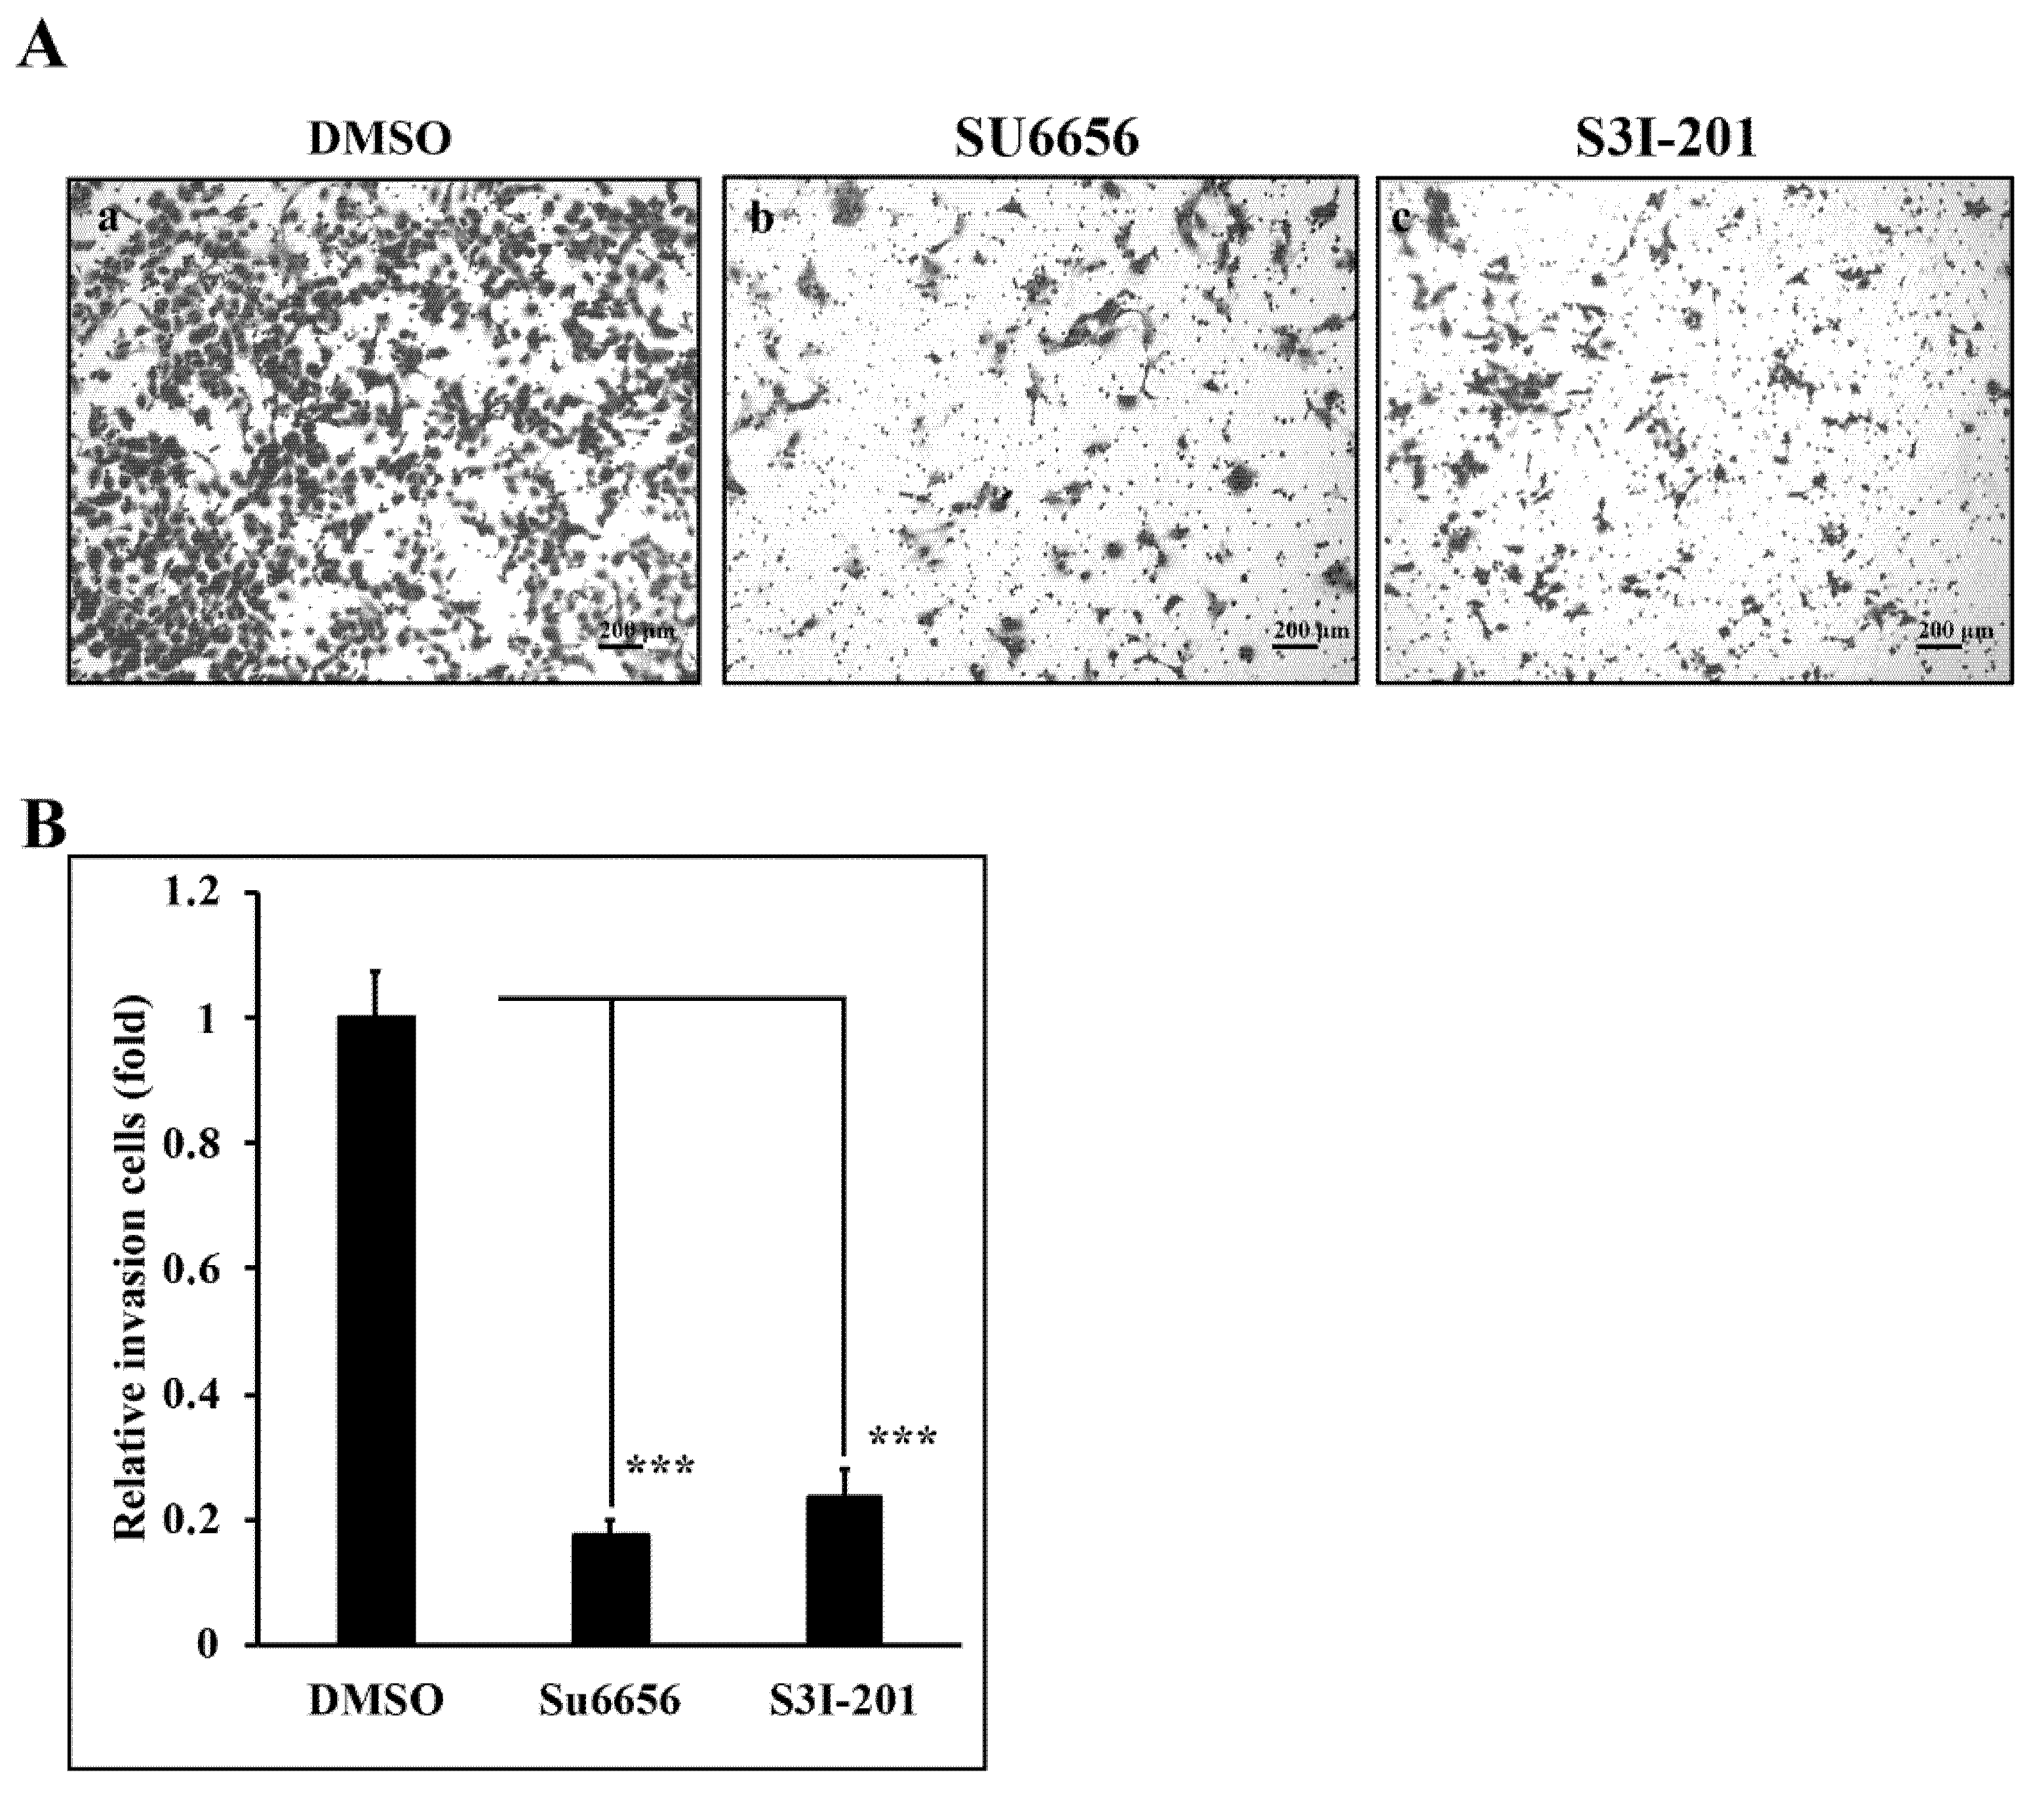
3.5. Reduction of Src/Stat3 Signaling Inhibits the Invasive Ability of A431-III Cells
3.6. Src/Stat3/S100A7 Signaling Activates the EMT Signaling in A431-III Cells
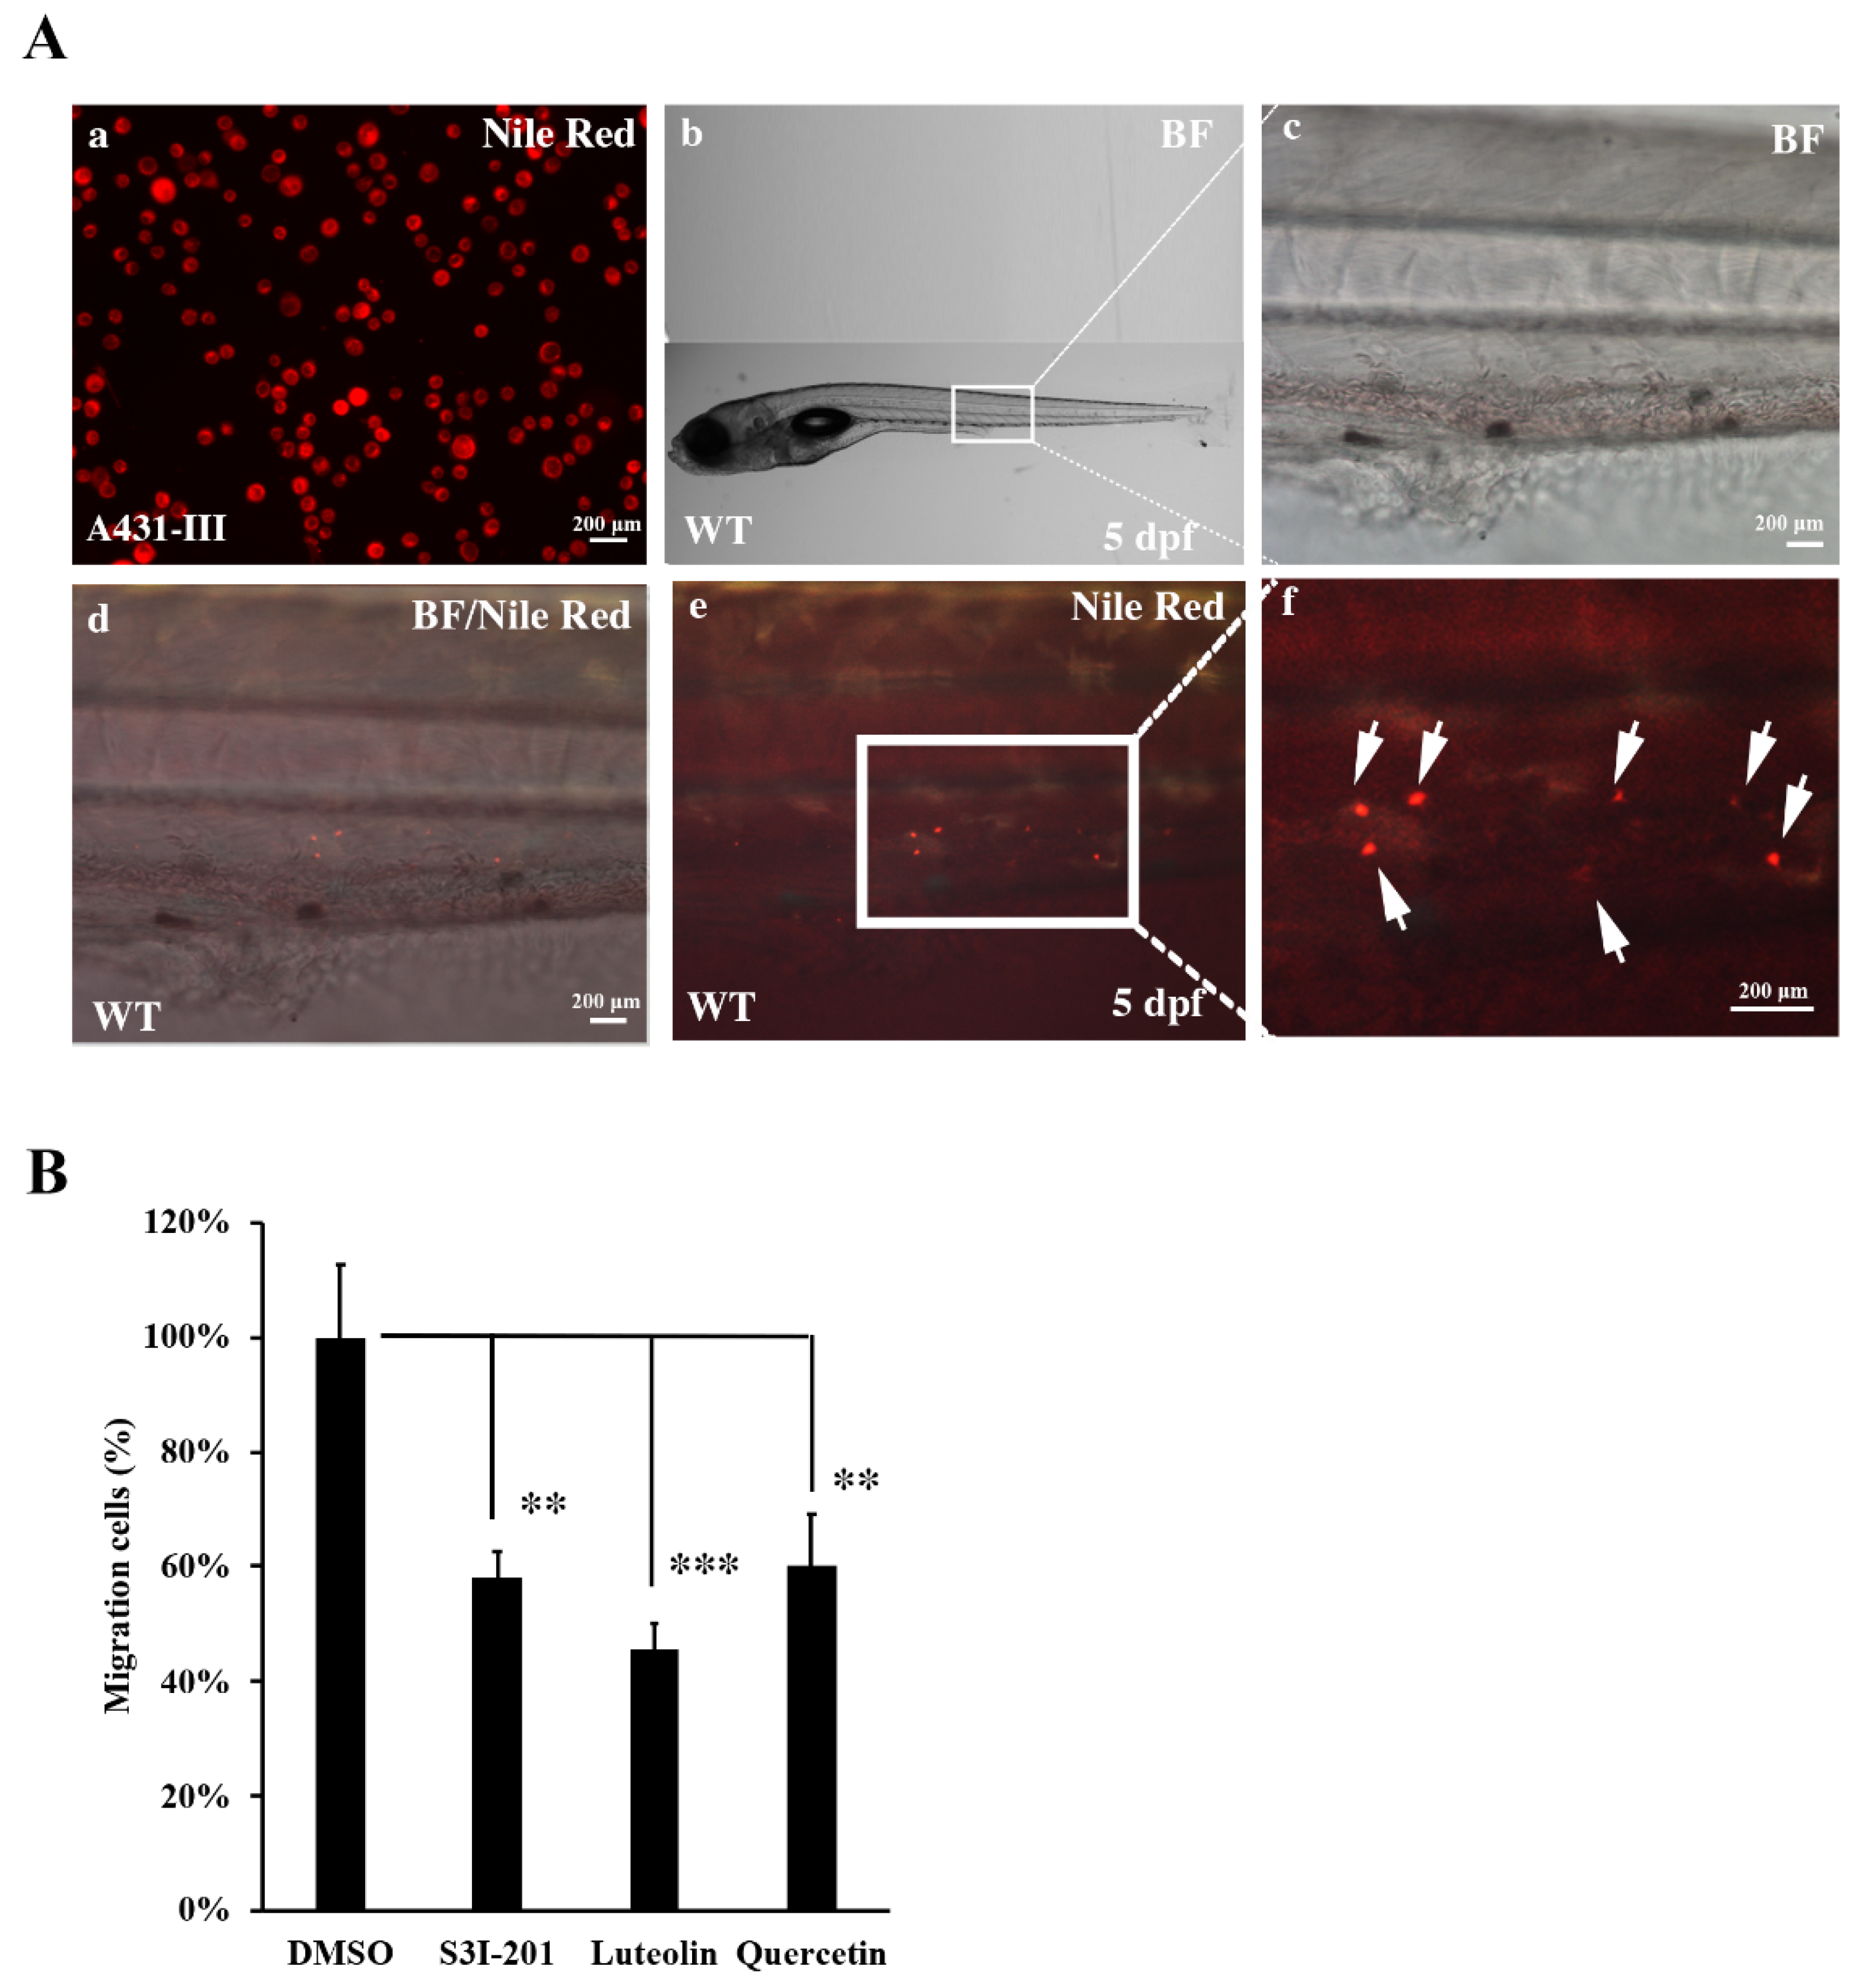
3.7. Metastasis of A431-III Cells was Reduced by Suppression of Src/Stat3/S100A7 Signaling in Zebrafish
4. Discussion
5. Conclusions
Author Contributions
Funding
Conflicts of Interest
References
- Do, Q.D.; Angkawijaya, A.E.; Tran-Nguyen, P.L.; Huynh, L.H.; Soetaredjo, F.E.; Ismadji, S.; Ju, Y.H. Effect of extraction solvent on total phenol content, total flavonoid content, and antioxidant activity of Limnophila aromatica. J. Food Drug Anal. 2014, 22, 296–302. [Google Scholar] [CrossRef] [PubMed]
- Fan, J.; Hsu, W.; Hung, H.; Zhang, W.; Lee, Y.A.; Chen, K.; Chu, C.; Ko, T.; Lee, M.; Lin, C.; et al. Reduction in MnSOD promotes the migration and invasion of squamous carcinoma cells. Int. J. Oncol. 2019, 54, 1639–1650. [Google Scholar] [CrossRef] [PubMed]
- Liao, D.Y.; Chai, Y.C.; Wang, S.H.; Chen, C.W.; Tsai, M.S. Antioxidant activities and contents of flavonoids and phenolic acids of Talinum triangulare extracts and their immunomodulatory effects. J. Food Drug Anal. 2015, 23, 294–302. [Google Scholar] [CrossRef] [PubMed]
- Shimizu, M. Multifunctions of dietary polyphenols in the regulation of intestinal inflammation. J. Food Drug Anal. 2017, 25, 93–99. [Google Scholar] [CrossRef]
- Wang, C.C.; Ho, C.T.; Lee, S.C.; Way, T.D. Isolation of eugenyl β-primeveroside from Camellia sasanqua and its anticancer activity in PC3 prostate cancer cells. J. Food Drug Anal. 2016, 24, 105–111. [Google Scholar] [CrossRef]
- Li, W.; He, N.; Tian, L.; Shi, X.; Yang, X. Inhibitory effects of polyphenol-enriched extract from Ziyang tea against human breast cancer MCF-7 cells through reactive oxygen species-dependent mitochondria molecular mechanism. J. Food Drug Anal. 2016, 24, 527–538. [Google Scholar] [CrossRef]
- Peng, C.H.; Lin, H.T.; Chung, D.J.; Huang, C.N.; Wang, C.J. Mulberry Leaf Extracts prevent obesity-induced NAFLD with regulating adipocytokines, inflammation and oxidative stress. J. Food Drug Anal. 2018, 26, 778–787. [Google Scholar] [CrossRef]
- Hsu, J.D.; Wu, C.C.; Hung, C.N.; Wang, C.J.; Huang, H.P. Myrciaria cauliflora extract improves diabetic nephropathy via suppression of oxidative stress and inflammation in streptozotocin-nicotinamide mice. J. Food Drug Anal. 2016, 24, 730–737. [Google Scholar] [CrossRef]
- Liu, C.J.; Lin, J.Y. Protective effects of strawberry and mulberry fruit polysaccharides on inflammation and apoptosis in murine primary splenocytes. J. Food Drug Anal. 2014, 22, 210–219. [Google Scholar] [CrossRef]
- Mantso, T.; Trafalis, D.T.; Botaitis, S.; Franco, R.; Pappa, A.; Rupasinghe, H.P.V.; Panayiotidis, M.I. Novel Docosahexaenoic Acid Ester of Phloridzin Inhibits Proliferation and Triggers Apoptosis in an in Vitro Model of Skin Cancer. Antioxidants 2018, 7, 188. [Google Scholar] [CrossRef]
- Rodríguez-García, C.; Sánchez-Quesada, C.; Gaforio, J.J. Dietary Flavonoids as Cancer Chemopreventive Agents: An Updated Review of Human Studies. Antioxidants 2019, 8, 137. [Google Scholar] [CrossRef]
- Sudhakaran, M.; Sardesai, S.; Doseff, A.I. Flavonoids: New Frontier for Immuno-Regulation and Breast Cancer Control. Antioxidants 2019, 8, 103. [Google Scholar] [CrossRef]
- Pietta, P.G. Flavonoids as antioxidants. J. Nat. Prod. 2000, 63, 1035–1042. [Google Scholar] [CrossRef] [PubMed]
- Huang, Y.T.; Hwang, J.J.; Lee, P.P.; Ke, F.C.; Huang, J.H.; Huang, C.J.; Kandaswami, C.; Middleton, E.; Lee, M.T. Effects of luteolin and quercetin, inhibitors of tyrosine kinase, on cell growth and metastasis-associated properties in A431 cells overexpressing epidermal growth factor receptor. Br. J. Pharmacol. 1999, 128, 999–1010. [Google Scholar] [CrossRef] [PubMed]
- Andarwulan, N.; Batari, R.; Sandrasari, D.A.; Bolling, B.; Wijaya, H. Flavonoid content and antioxidant activity of vegetables from Indonesia. Food Chem. 2010, 121, 1231–1235. [Google Scholar] [CrossRef] [PubMed]
- Jang, C.H.; Moon, N.; Oh, J.; Kim, J.S. Luteolin Shifts Oxaliplatin-Induced Cell Cycle Arrest at G(0)/G(1) to Apoptosis in HCT116 Human Colorectal Carcinoma Cells. Nutrients 2019, 11, 770. [Google Scholar] [CrossRef] [PubMed]
- Kang, K.; Piao, M.; Ryu, Y.; Hyun, Y.; Park, J.; Shilnikova, K.; Zhen, A.; Kang, H.; Koh, Y.; Jeong, Y.; et al. Luteolin induces apoptotic cell death via antioxidant activity in human colon cancer cells. Int. J. Oncol. 2017, 51, 1169–1178. [Google Scholar] [CrossRef]
- Kang, K.P.; Park, S.K.; Kim, D.H.; Sung, M.J.; Jung, Y.J.; Lee, A.S.; Lee, J.E.; Ramkumar, K.M.; Lee, S.; Park, M.H.; et al. Luteolin ameliorates cisplatin-induced acute kidney injury in mice by regulation of p53-dependent renal tubular apoptosis. Nephrol. Dial. Transplant. 2011, 26, 814–822. [Google Scholar] [CrossRef]
- Kim, G.N.; Jang, H.D. Protective mechanism of quercetin and rutin using glutathione metabolism on HO-induced oxidative stress in HepG2 cells. Ann. N. Y. Acad. Sci. 2009, 1171, 530–537. [Google Scholar] [CrossRef]
- Leung, H.W.C.; Kuo, C.L.; Yang, W.H.; Lin, C.H.; Lee, H.Z. Antioxidant enzymes activity involvement in luteolin-induced human lung squamous carcinoma CH27 cell apoptosis. Eur. J. Pharmacol. 2006, 534, 12–18. [Google Scholar] [CrossRef]
- Robaszkiewicz, A.; Balcerczyk, A.; Bartosz, G. Antioxidative and prooxidative effects of quercetin on A549 cells. Cell Biol. Int. 2007, 31, 1245–1250. [Google Scholar] [CrossRef] [PubMed]
- Ni, F.; Gong, Y.; Li, L.; Abdolmaleky, H.M.; Zhou, J.R. Flavonoid Ampelopsin Inhibits the Growth and Metastasis of Prostate Cancer in Vitro and in Mice. PLoS ONE 2012, 7, e38802. [Google Scholar] [CrossRef] [PubMed]
- Piantelli, M.; Rossi, C.; Iezzi, M.; La Sorda, R.; Iacobelli, S.; Alberti, S.; Natali, P.G. Flavonoids inhibit melanoma lung metastasis by impairing tumor cells endothelium interactions. J. Cell. Physiol. 2006, 207, 23–29. [Google Scholar] [CrossRef] [PubMed]
- Weng, C.J.; Yen, G.C. Flavonoids, a ubiquitous dietary phenolic subclass, exert extensive in vitro anti-invasive and in vivo anti-metastatic activities. Cancer Metastasis Rev. 2012, 31, 323–351. [Google Scholar] [CrossRef] [PubMed]
- Yen, G.C.; Tsai, C.M.; Lu, C.C.; Weng, C.J. Recent progress in natural dietary non-phenolic bioactives on cancers metastasis. J. Food Drug Anal. 2018, 26, 940–964. [Google Scholar] [CrossRef] [PubMed]
- Kao, W.T.; Lin, C.Y.; Lee, L.T.; Lee, P.P.; Hung, C.C.; Lin, Y.S.; Chen, S.H.; Ke, F.C.; Hwang, J.J.; Lee, M.T. Investigation of MMP-2 and-9 in a highly invasive A431 tumor cell sub-line selected from a Boyden chamber assay. Anticancer Res. 2008, 28, 2109–2120. [Google Scholar]
- Lin, C.W.; Lai, G.M.; Chen, K.C.; Lin, T.H.; Fan, J.J.; Hsu, R.L.; Chou, C.M.; Lin, C.M.; Kandaswami, C.C.; Lee, M.T.; et al. RPS12 increases the invasiveness in cervical cancer activated by c-Myc and inhibited by the dietary flavonoids luteolin and quercetin. J. Funct. Foods 2015, 19, 236–247. [Google Scholar] [CrossRef]
- Lin, T.H.; Hsu, W.H.; Tsai, P.H.; Huang, Y.T.; Lin, C.W.; Chen, K.C.; Tsai, I.H.; Kandaswami, C.C.; Huang, C.J.; Chang, G.D.; et al. Dietary flavonoids, luteolin and quercetin, inhibit invasion of cervical cancer by reduction of UBE2S through epithelial–mesenchymal transition signaling. Food Funct. 2017, 8, 1558–1568. [Google Scholar] [CrossRef]
- Lin, Y.S.; Tsai, P.H.; Kandaswami, C.C.; Cheng, C.H.; Ke, F.C.; Lee, P.P.; Hwang, J.J.; Lee, M.T. Effects of dietary flavonoids, luteolin, and quercetin on the reversal of epithelial-mesenchymal transition in A431 epidermal cancer cells. Cancer Sci. 2011, 102, 1829–1839. [Google Scholar] [CrossRef]
- Chen, K.C.; Hsu, W.H.; Ho, J.Y.; Lin, C.W.; Chu, C.Y.; Kandaswami, C.C.; Lee, M.T.; Cheng, C.H. Flavonoids Luteolin and Quercetin Inhibit RPS19 and contributes to metastasis of cancer cells through c-Myc reduction. J. Food Drug Anal. 2018, 26, 1180–1191. [Google Scholar] [CrossRef]
- Lee, H.; Ryu, W.I.; Kim, H.J.; Bae, H.C.; Ryu, H.J.; Shin, J.J.; Song, K.H.; Kim, T.W.; Son, S.W. TSLP Down-Regulates S100A7 and ß-Defensin 2 Via the JAK2/STAT3-Dependent Mechanism. J. Investig. Dermatol. 2016, 136, 2427–2435. [Google Scholar] [CrossRef] [PubMed][Green Version]
- Lapeire, L.; Hendrix, A.; Lambein, K.; Van Bockstal, M.; Braems, G.; Broecke, R.V.D.; Limame, R.; Mestdagh, P.; Vandesompele, J.; Vanhove, C.; et al. Cancer-Associated Adipose Tissue Promotes Breast Cancer Progression by Paracrine Oncostatin M and Jak/STAT3 Signaling. Cancer Res. 2014, 74, 6806–6819. [Google Scholar] [CrossRef] [PubMed]
- West, N.R.; Watson, P.H.; West, N. S100A7 (psoriasin) is induced by the proinflammatory cytokines oncostatin-M and interleukin-6 in human breast cancer. Oncogene 2010, 29, 2083–2092. [Google Scholar] [CrossRef] [PubMed]
- Kennedy, R.D.; Gorski, J.J.; Quinn, J.E.; Stewart, G.E.; James, C.R.; Moore, S.; Mulligan, K.; Emberley, E.D.; Lioe, T.F.; Morrison, P.J.; et al. BRCA1 and c-Myc Associate to Transcriptionally Repress Psoriasin, a DNA Damage–Inducible Gene. Cancer Res. 2005, 65, 10265–10272. [Google Scholar] [CrossRef]
- Jung, S.H.; Lee, K.; Kong, D.H.; Kim, W.J.; Kim, Y.M.; Ha, K.S. Integrative proteomic profiling of protein activity and interactions using protein arrays. Mol. Cell. Proteom. 2012, 11, 1167–1176. [Google Scholar] [CrossRef]
- Leygue, E.; Snell, L.; Hiller, T.; Dotzlaw, H.; Hole, K.; Murphy, L.C.; Watson, P.H. Differential expression of psoriasin messenger RNA between in situ and invasive human breast carcinoma. Cancer Res. 1996, 56, 4606–4609. [Google Scholar]
- Emberley, E.D.; Murphy, L.C.; Watson, P.H. S100A7 and the progression of breast cancer. Breast Cancer Res. 2004, 6, 153–159. [Google Scholar] [CrossRef]
- Liu, H.; Wang, L.; Wang, X.; Cao, Z.; Yang, Q.; Zhang, K. S100A7 enhances invasion of human breast cancer MDA-MB-468 cells through activation of nuclear factor-kappaB signaling. World J. Surg. Oncol. 2013, 11, 93. [Google Scholar] [CrossRef]
- Royse, K.E.; Zhi, D.; Conner, M.G.; Clodfelder-Miller, B.; Srinivasasainagendra, V.; Vaughan, L.K.; Skibola, C.F.; Crossman, D.K.; Levy, S.; Shrestha, S. Differential Gene Expression Landscape of Co-Existing Cervical Pre-Cancer Lesions Using RNA-seq. Front. Oncol. 2014, 4, 339. [Google Scholar] [CrossRef]
- Tian, T.; Li, X.; Hua, Z.; Ma, J.; Wu, X.; Liu, Z.; Chen, H.; Cui, Z. S100A7 promotes the migration, invasion and metastasis of human cervical cancer cells through epithelial–mesenchymal transition. Oncotarget 2017, 8, 24964–24977. [Google Scholar] [CrossRef]
- Lin, Y.C.; Tsai, P.H.; Lin, C.Y.; Cheng, C.H.; Lin, T.H.; Lee, K.P.H.; Huang, K.Y.; Chen, S.H.; Hwang, J.J.; Kandaswami, C.C.; et al. Impact of Flavonoids on Matrix Metalloproteinase Secretion and Invadopodia Formation in Highly Invasive A431-III Cancer Cells. PLoS ONE 2013, 8, e71903. [Google Scholar] [CrossRef] [PubMed]
- Ren, J.; Liu, S.; Cui, C.; Dijke, P.T. Invasive Behavior of Human Breast Cancer Cells in Embryonic Zebrafish. J. Vis. Exp. 2017. [Google Scholar] [CrossRef] [PubMed]
- Lin, C.Y.; Tsai, P.H.; Kandaswami, C.C.; Chang, G.D.; Cheng, C.H.; Huang, C.J.; Lee, P.P.; Hwang, J.J.; Lee, M.T. Role of tissue transglutaminase 2 in the acquisition of a mesenchymal-like phenotype in highly invasive A431 tumor cells. Mol. Cancer 2011, 10, 87. [Google Scholar] [CrossRef] [PubMed]
- Lin, C.Y.; Tsai, P.H.; Kandaswami, C.C.; Lee, P.P.; Huang, C.J.; Hwang, J.J.; Lee, M.T. Matrix metalloproteinase-9 cooperates with transcription factor Snail to induce epithelial-mesenchymal transition. Cancer Sci. 2011, 102, 815–827. [Google Scholar] [CrossRef] [PubMed]
- Zhou, G.; Xie, T.X.; Zhao, M.; Jasser, S.A.; Younes, M.N.; Sano, D.; Lin, J.; Kupferman, M.E.; Santillan, A.A.; Patel, V.; et al. Reciprocal negative regulation between S100A7/psoriasin and β-catenin signaling plays an important role in tumor progression of squamous cell carcinoma of oral cavity. Oncogene 2008, 27, 3527–3538. [Google Scholar] [CrossRef] [PubMed]
- Padilla, L.; Dakhel, S.; Adan, J.; Masa, M.; Martinez, J.M.; Roque, L.; Coll, T.; Hervas, R.; Calvis, C.; Llinas, L.; et al. S100A7: From mechanism to cancer therapy. Oncogene 2017, 36, 6749–6761. [Google Scholar] [CrossRef]
- Turkson, J.; Bowman, T.; Garcia, R.; Caldenhoven, E.; De Groot, R.P.; Jove, R. Stat3 Activation by Src Induces Specific Gene Regulation and Is Required for Cell Transformation. Mol. Cell. Biol. 1998, 18, 2545–2552. [Google Scholar] [CrossRef]
- Barriuso, J.; Nagaraju, R.; Hurlstone, A. Zebrafish: A new companion for translational research in oncology. Clin. Cancer Res. 2015, 21, 969–975. [Google Scholar] [CrossRef]
- Brown, H.K.; Schiavone, K.; Tazzyman, S.; Heymann, D.; Chico, T.J. Zebrafish xenograft models of cancer and metastasis for drug discovery. Expert Opin. Drug Discov. 2017, 12, 379–389. [Google Scholar] [CrossRef]
- Chen, L.; Groenewoud, A.; Tulotta, C.; Zoni, E.; Julio, M.K.D.; Van Der Horst, G.; Van Der Pluijm, G.; Snaar-Jagalska, B.E. A zebrafish xenograft model for studying human cancer stem cells in distant metastasis and therapy response. Methods Cell Biol. 2017, 138, 471–496. [Google Scholar]
- Liu, C.; Zhang, Y.; Lim, S.; Hosaka, K.; Yang, Y.; Pavlova, T.; Alkasalias, T.; Hartman, J.; Jensen, L.; Xing, X.; et al. A Zebrafish Model Discovers a Novel Mechanism of Stromal Fibroblast-Mediated Cancer Metastasis. Clin. Cancer Res. 2017, 23, 4769–4779. [Google Scholar] [CrossRef] [PubMed]
- Novoa, B.; Figueras, A. Zebrafish: Model for the study of inflammation and the innate immune response to infectious diseases. Adv. Exp. Med. Biol. 2012, 946, 253–275. [Google Scholar] [PubMed]
- Chapman, A.; Del Ama, L.F.; Ferguson, J.; Kamarashev, J.; Wellbrock, C.; Hurlstone, A. Heterogeneous tumor subpopulations cooperate to drive invasion. Cell Rep. 2014, 8, 688–695. [Google Scholar] [CrossRef] [PubMed]
- Eden, C.J.; Ju, B.; Murugesan, M.; Phoenix, T.N.; Nimmervoll, B.; Tong, Y.; Ellison, D.W.; Finkelstein, D.; Wright, K.; Boulos, N.; et al. Orthotopic models of pediatric brain tumors in zebrafish. Oncogene 2015, 34, 1736–1742. [Google Scholar] [CrossRef] [PubMed]
© 2019 by the authors. Licensee MDPI, Basel, Switzerland. This article is an open access article distributed under the terms and conditions of the Creative Commons Attribution (CC BY) license (http://creativecommons.org/licenses/by/4.0/).
Share and Cite
Fan, J.-J.; Hsu, W.-H.; Lee, K.-H.; Chen, K.-C.; Lin, C.-W.; Lee, Y.-L.A.; Ko, T.-P.; Lee, L.-T.; Lee, M.-T.; Chang, M.-S.; et al. Dietary Flavonoids Luteolin and Quercetin Inhibit Migration and Invasion of Squamous Carcinoma through Reduction of Src/Stat3/S100A7 Signaling. Antioxidants 2019, 8, 557. https://doi.org/10.3390/antiox8110557
Fan J-J, Hsu W-H, Lee K-H, Chen K-C, Lin C-W, Lee Y-LA, Ko T-P, Lee L-T, Lee M-T, Chang M-S, et al. Dietary Flavonoids Luteolin and Quercetin Inhibit Migration and Invasion of Squamous Carcinoma through Reduction of Src/Stat3/S100A7 Signaling. Antioxidants. 2019; 8(11):557. https://doi.org/10.3390/antiox8110557
Chicago/Turabian StyleFan, Jhen-Jia, Wen-Hsien Hsu, Kuen-Haur Lee, Ku-Chung Chen, Cheng-Wei Lin, Yu-Lin A Lee, Tzu-Ping Ko, Lang-Ta Lee, Ming-Ting Lee, Mau-Sun Chang, and et al. 2019. "Dietary Flavonoids Luteolin and Quercetin Inhibit Migration and Invasion of Squamous Carcinoma through Reduction of Src/Stat3/S100A7 Signaling" Antioxidants 8, no. 11: 557. https://doi.org/10.3390/antiox8110557
APA StyleFan, J.-J., Hsu, W.-H., Lee, K.-H., Chen, K.-C., Lin, C.-W., Lee, Y.-L. A., Ko, T.-P., Lee, L.-T., Lee, M.-T., Chang, M.-S., & Cheng, C.-H. (2019). Dietary Flavonoids Luteolin and Quercetin Inhibit Migration and Invasion of Squamous Carcinoma through Reduction of Src/Stat3/S100A7 Signaling. Antioxidants, 8(11), 557. https://doi.org/10.3390/antiox8110557


