1. Introduction
Currently, the self-sufficiency rate of edible oil in China is only approximately 30%, and a severe imbalance exists between supply and demand [
1]. Rapeseed (
Brassica napus) serves as the primary source of domestically produced vegetable oil in China, accounting for nearly 50% of the total oil production from domestic oil-bearing crops [
2]. Consequently, increasing the planting area of rapeseed is considered a crucial pathway to enhance oil yield and ensure edible oil security in China. However, arable land resources in China are currently limited. Approximately 6.67 million hectares of saline-alkali land suitable for rapeseed production [
3] have emerged as a critical resource for exploiting the potential of rapeseed cultivation expansion [
1]. Nevertheless, saline-alkali soils are complex environments and are frequently accompanied by surface salt accumulation. Rapeseed seeds are highly sensitive to salt stress during the germination and seedling stages [
4]. Salt stress induces difficulties in water absorption, ion toxicity, and metabolic disorders, directly inhibiting germination potential and seedling establishment, which subsequently affects later growth and development and ultimately leads to significant yield reduction [
5,
6]. At present, a strategic orientation for the comprehensive utilization of saline-alkali land in China has been established, namely shifting from “remediating saline-alkali land to suit crops” to “breeding salt-tolerant plants to suit saline-alkali land” [
7]. Therefore, the screening of elite salt-tolerant germplasm and the breeding of new salt-tolerant rapeseed varieties are of great strategic significance for the effective utilization of saline-alkali land resources, the improvement of rapeseed yield, and the assurance of national edible oil security.
The damage caused by salt stress in plants is mainly manifested as ion toxicity, osmotic stress, and oxidative damage [
8]. Under saline conditions, excessive reactive oxygen species (ROS) accumulate in plant cells, resulting in membrane lipid peroxidation and disruption of cell membrane integrity [
9]. To alleviate oxidative damage, plants have evolved an antioxidant defense system composed of superoxide dismutase (SOD), peroxidase (POD), catalase (CAT), and other enzymes [
10]. Previous studies have shown that salt-tolerant rapeseed varieties can maintain relatively high antioxidant enzyme activities under salt stress, thereby effectively scavenging ROS and reducing malondialdehyde (MDA) accumulation [
11,
12]. In addition, osmotic adjustment substances such as proline and soluble sugars contribute to the maintenance of cell turgor and normal physiological metabolism under salt stress [
11].
Endogenous hormones also play important roles in plant responses to salt stress. Abscisic acid (ABA) is a core stress-responsive hormone, and its accumulation under salt stress can activate SnRK2 protein kinases and regulate downstream stress responses, including stomatal closure and water-loss control [
13]. Salicylic acid (SA) has also been reported to participate in stress resistance regulation. Exogenous SA treatment can reduce Na
+ accumulation and elevate endogenous SA levels in plants, thereby enhancing salt tolerance [
14].
Several genes have been confirmed to participate in the regulation of salt tolerance in rapeseed. For example, the overexpression of
OsLTP or
BADH significantly improves salt tolerance in rapeseed [
15]. Meanwhile,
BnaMPK6 has been verified to play a positive regulatory role in salt tolerance mechanisms [
16,
17]. In addition, the NHX family and transcription factors such as bZIP, WRKY, and AP2/EREBP have been reported to play important roles in the response to salt stress [
18,
19]. With the development of high-throughput sequencing technologies, absolute quantitative transcriptome sequencing has been increasingly applied in studies of crop stress resistance, functional gene identification, and molecular breeding improvement because of its high sensitivity and accuracy in transcript quantification [
20,
21,
22]. However, most previous studies on rapeseed salt tolerance have mainly focused on physiological responses or transcriptomic changes alone, whereas relatively few studies have integrated large-scale germplasm screening, physiological traits, and functional validation of key genes.
In addition to the classical salt stress response pathways, increasing evidence suggests that nutrient signaling may also interact with abiotic stress adaptation. Proteins containing the SYG1/Pho81/XPR1 (SPX) domain are recognized as important regulators of phosphate sensing and homeostasis in plants [
23]. In
Arabidopsis,
SPX1 has been identified as an important component of phosphate signaling [
23]. Moreover, enhanced expression of
OsSPX1 has been reported to improve stress tolerance in transgenic plants, suggesting that SPX-domain proteins may also participate in broader stress-response networks [
24].
Based on the above background, we hypothesized that integrated evaluation of salt tolerance at the phenotypic, physiological, and transcriptomic levels could facilitate the identification of elite salt-tolerant germplasm and candidate salt-responsive genes in Brassica napus. Therefore, the objectives of this study were to: (1) screen salt-tolerant germplasm from a large collection of B. napus accessions; (2) characterize the physiological responses of the selected material under different salt treatments; and (3) identify and preliminarily validate candidate salt-responsive genes associated with salt tolerance.
3. Results and Analysis
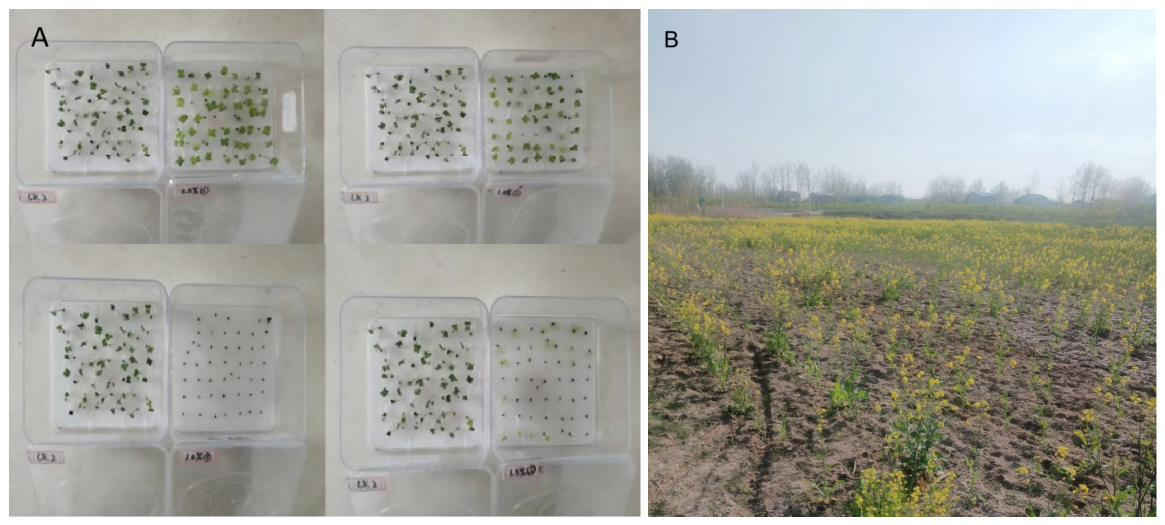
The salt tolerance of 1609 accessions was evaluated during the germination stage using the method described in the
Section 2. Based on the overall performance of each accession under salt stress (
Figure 1A), 50 accessions were preliminarily screened into high, medium, and low salt-tolerant groups (
Supplementary Table S2).
As shown in
Figure 1B, the selected accession exhibited favorable growth performance in saline-alkali soil at Sunfuji Township, Liangyuan District, Shangqiu City, Henan Province (34.5920° N, 115.4983° E), where the total soluble salt content of the soil was 52.36 g· kg
−1. This screening identified the highly salt-tolerant material ‘Xiangnong Saline-Alkali Oil No. 1’, hereafter abbreviated as XNSA01. Subsequent analysis confirmed that XNSA01 is a high-oil (49.33%), double-low material, with 0% erucic acid and 31.79 µmol· g
−1 glucosinolates. Furthermore, XNSA01 exhibits excellent agronomic traits, including 221.6 pods per plant and a thousand-seed weight of 4.60 g.
3.1. Phenotypic and Physiological Responses Under Different NaCl Treatments
3.1.1. Growth Phenotypic Characteristics
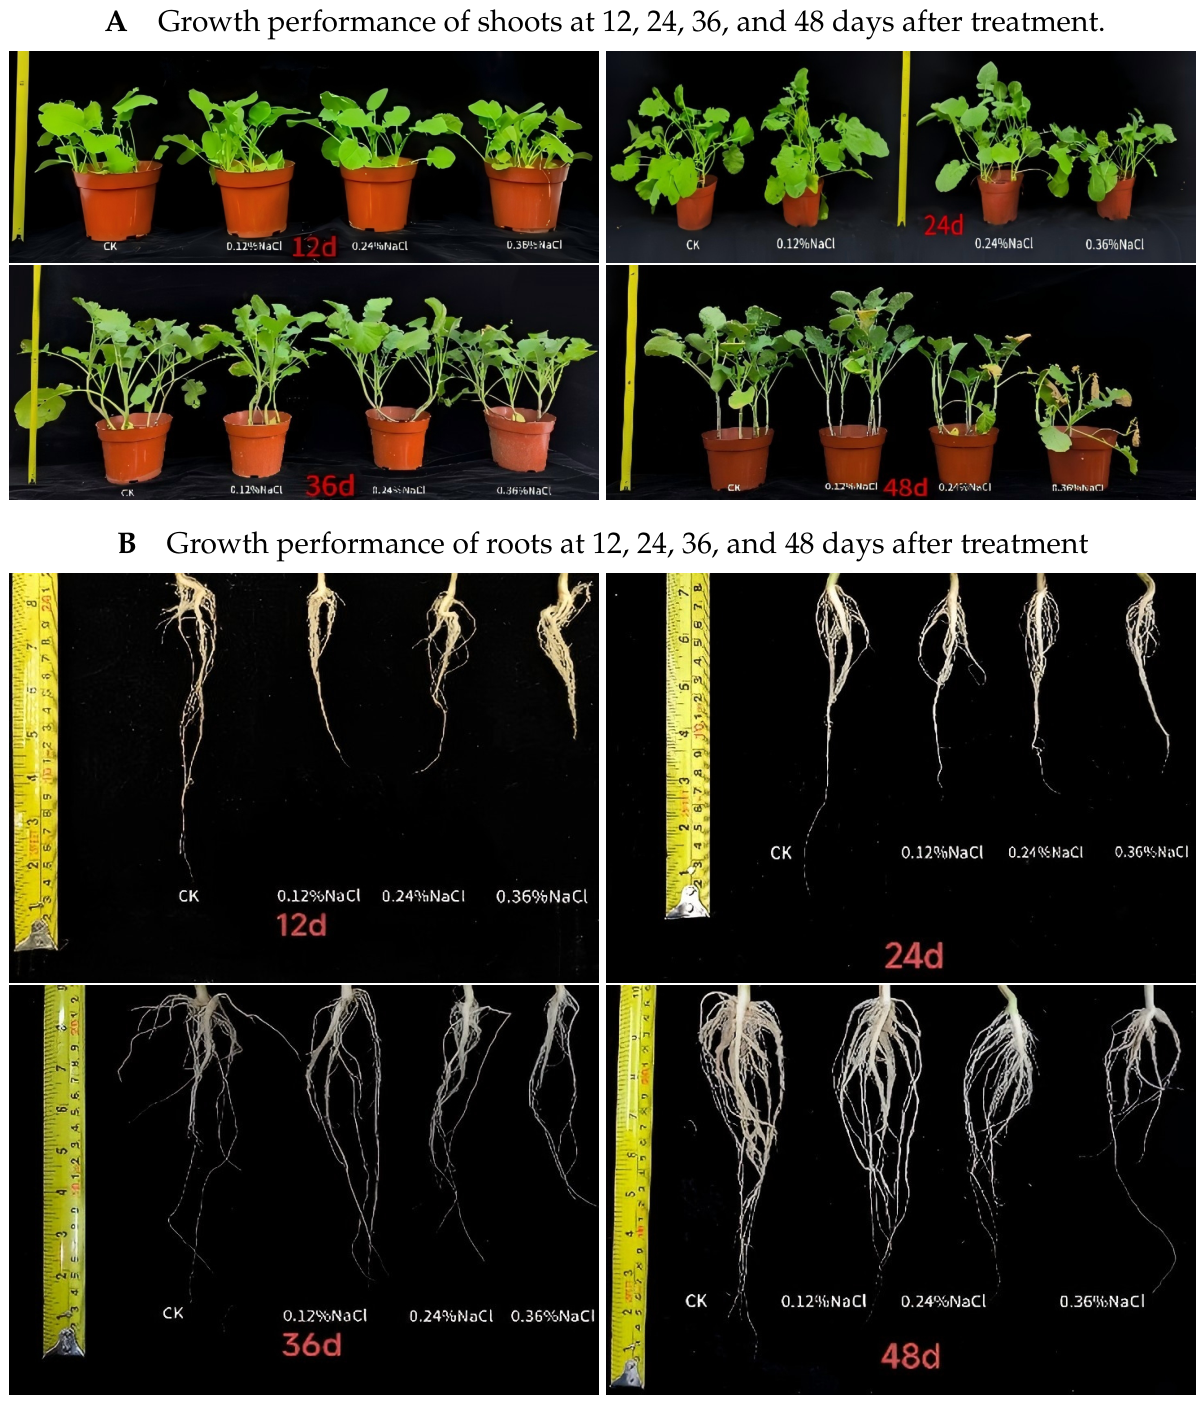
Growth phenotypes of XNSA01 under different salt concentrations are shown in
Figure 2. Strong adaptability was exhibited by the plants under the Y1 treatment. Plants showed only slight growth inhibition at 12 d. As the adaptation period prolonged, the growth rate gradually recovered. Slight leaf chlorosis was noted only under long-term stress (48 d). However, under Y2 and Y3 treatments, plant growth was significantly inhibited, and the onset of inhibition occurred earlier. In the Y3 treatment group, growth retardation was exhibited as early as 12 d. By 48 d, the whole plant showed severe chlorosis, leaf margin scorching, and even wilting. Primary root development was significantly hindered with increasing salt concentrations. Lateral root density increased during the initial stress stage (12–24 d). This suggests that root system architecture was remodeled to enhance absorption capacity for stress adaptation [
27]. However, lateral root growth was also severely inhibited during the late stage of long-term high-salt stress (36–48 d), ultimately resulting in irreversible damage. Under long-term salt stress, partial adaptation may be achieved by plants under low salt concentrations. Conversely, irreversible damage may be induced by high salt concentrations [
32].
3.1.2. Differences in Physiological Indicators Under Different Salt Treatments
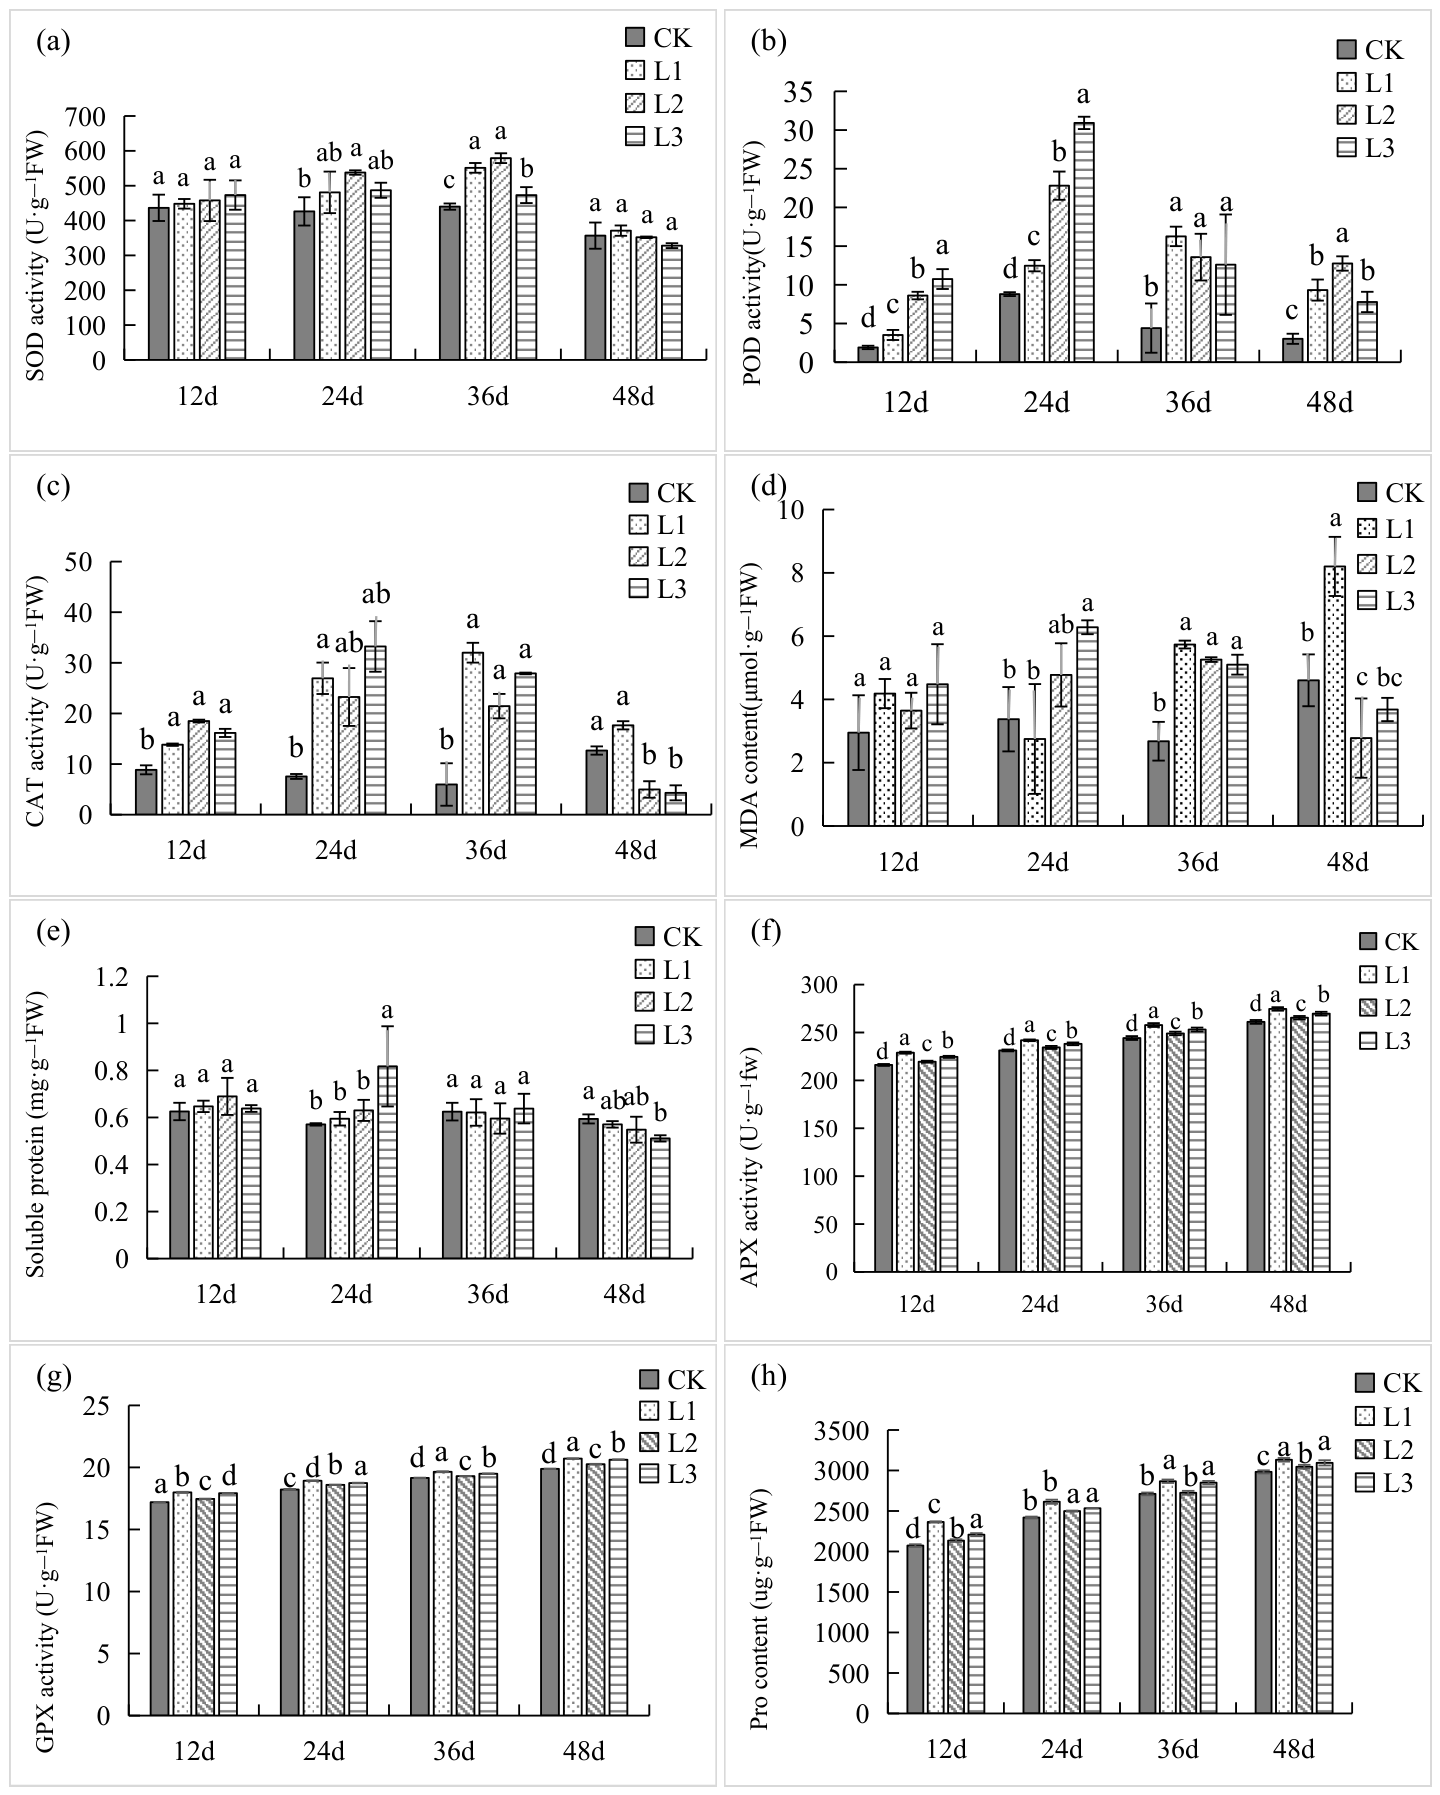
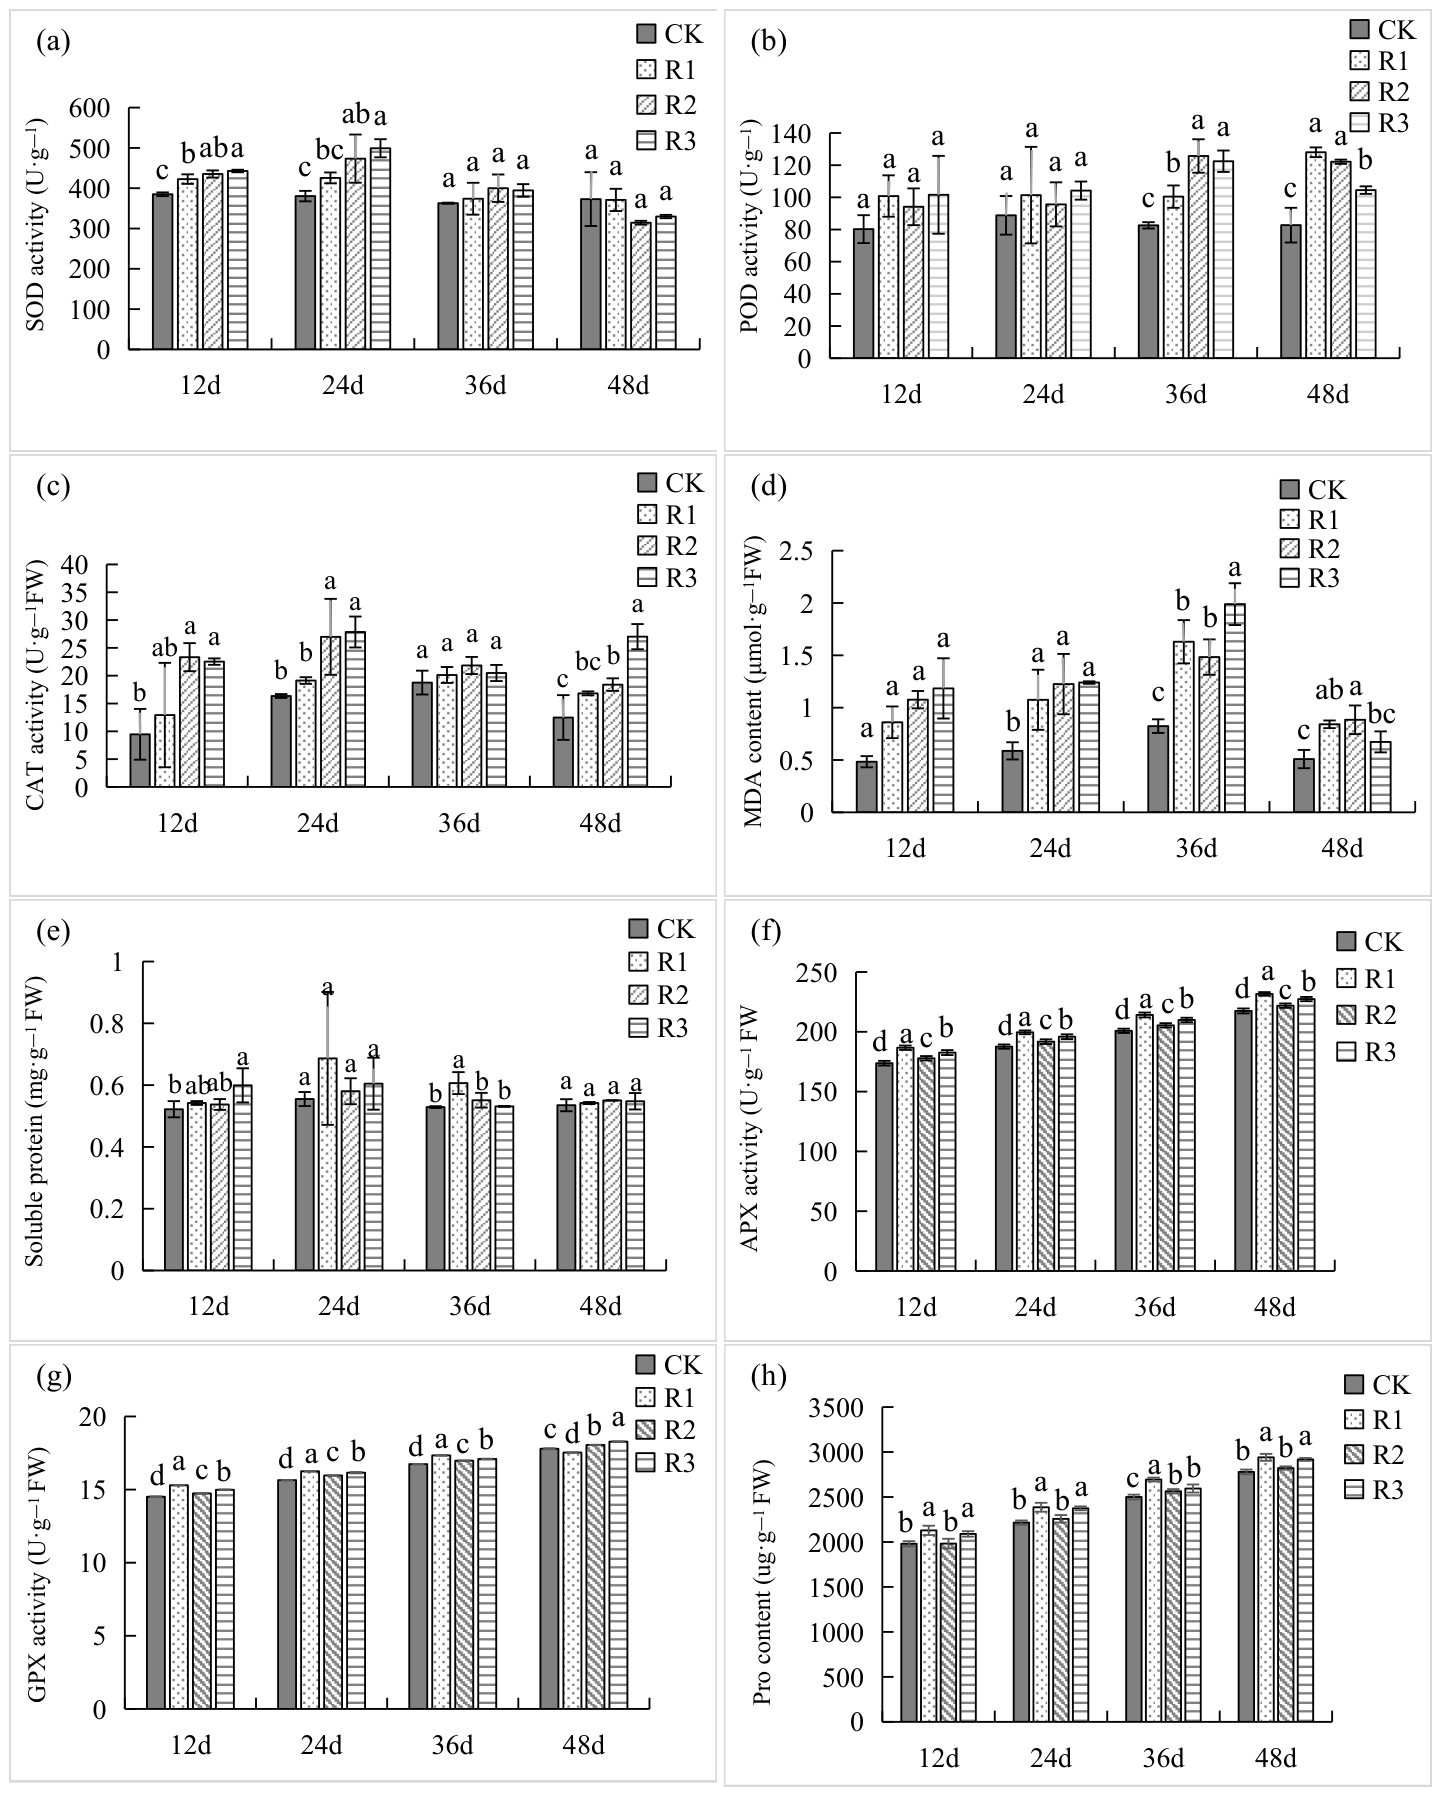
Root and leaf physiological parameter contents under different salt concentration treatments are shown in
Figure 3 and
Figure 4, respectively.
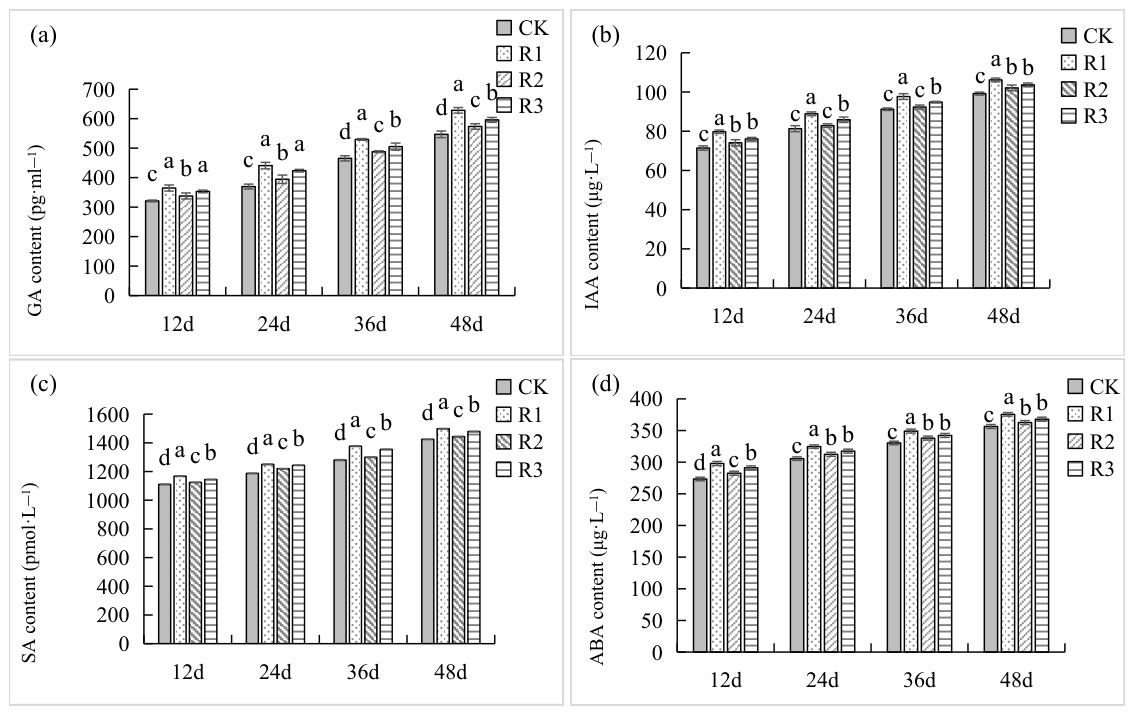
As shown in
Figure 5, the concentrations of all four hormones exhibited an overall upward trend with increasing salt concentration and treatment duration. Among the four hormones, abscisic acid (ABA), a core signaling molecule in plant responses to abiotic stress, showed an overall increase under salt treatment, particularly at the later stage (48 d). Compared with the control, ABA levels remained relatively high in all salt-treated groups, indicating that salt stress induced ABA accumulation to help plants cope with adverse conditions [
33]. This response may contribute to stomatal regulation and the activation of stress-responsive genes [
13]. Salicylic acid (SA) content was significantly higher in the Y2 and Y3 treatment groups than in the control, and continued to accumulate over time. At 48 days, SA content reached 1498.58 pmol·
in the Y1 treatment group, 1442.99 pmol·
in the Y2 treatment group, and 1478.68 pmol·
in the Y3 treatment group, all of which were higher than the CK value (1424.31 pmol·
). These results indicate that salt stress stimulated SA accumulation, especially under salt-treated conditions, thereby enhancing stress resistance [
27]. Although auxin (IAA) and gibberellin (GA) levels generally increased, their growth slowed or even slightly decreased in the later stages of Y3 treatment. At 48 days, GA content in the Y1 treatment group reached 628 pg·
, which was 14.8% higher than that of CK (547 pg·
) at the same time point. The Y3 treatment group recorded 596 pg· mL
−1, which was higher than CK but significantly lower than Y1. Auxin (IAA) peaked at 106 µg·
in the Y1 treatment group at 48 days, markedly exceeding CK (99 µg·
) and both Y2 and Y3 groups. This suggests that low-concentration salt stress may promote root growth to adapt to adverse conditions by maintaining higher levels of GA and IAA, whereas higher salt concentrations may exert a certain inhibitory effect on plants [
13].
3.2. Screening of Key Salt-Tolerant Genes Based on Quantitative Transcriptome Sequencing
3.2.1. Screening of Key Salt-Tolerant Genes Based on Transcriptome Sequencing
Transcriptome sequencing with absolute quantification was performed on root samples of XNSA01 after 12 days of treatment under different salt concentrations. A total of 2380, 2737, and 8715 differentially expressed genes (DEGs) were identified across the three treatments, respectively. Among these, 713 core differentially expressed genes (DEGs) were identified across the comparisons, including 483 upregulated genes and 230 downregulated genes.
Previous research has shown that plants activate a series of complex metabolic pathways under salt stress to maintain cellular homeostasis [
34]. For instance, the phenylpropanoid biosynthesis pathway has been demonstrated to enhance plant salt tolerance by synthesizing secondary metabolites such as lignin and flavonoids, thereby increasing cell wall rigidity and scavenging reactive oxygen species [
35]; plant hormone signal transduction, particularly the abscisic acid (ABA) and ethylene signaling pathways, plays a crucial role in regulating stomatal closure and stress gene expression [
36]; the MAPK signaling pathway also serves as a key hub in plant responses to salt stress, participating in the regulation of downstream stress-resistant gene expression [
37]. Based on the above research background, functional enrichment analysis was performed on the differentially expressed genes, and the enrichment results are presented in
Supplementary Figure S1. Results indicate that the identified DEGs in this study were significantly enriched in pathways such as ‘phenylpropanoid biosynthesis’, ‘plant hormone signal transduction’ and ‘metabolic pathways’. Notably, under Y3 treatment, substantial gene expression changes occurred in pathways related to oxidoreductase activity and transmembrane transporter activity. These findings indicate that XNSA01 primarily adapts to saline stress through multiple mechanisms, including activation of phenylpropanoid metabolism, hormone signaling, and regulation of ion transport. Therefore, candidate genes responding to salt stress were prioritized from these significantly enriched key pathways.
A preliminary screening of expression levels was conducted on 713 core genes, using the criteria of absolute logFC > 1.5 and
p-value < 0.05 to focus on genes exhibiting the most intense responses to salt stress. Subsequently, functional annotation screening was performed based on GO and KEGG enrichment analysis results, prioritizing genes closely associated with plant salt tolerance mechanisms. The specific screening criteria included: (1) genes annotated as transcription factors (e.g., AP2/ERF, MYB, WRKY), which may initiate the entire salt tolerance response as upstream regulators; (2) genes involved in antioxidant systems (e.g., peroxidase, glutathione S-transferase); (3) genes participating in ion transport and osmotic adjustment (e.g., SPX domain-containing proteins); and (4) genes involved in hormone signal transduction (e.g., auxin-responsive proteins). Twenty differential genes were identified by combining gene annotations and NCBI database screening (
Supplementary Table S4).
Under salt stress, the excessive uptake of
competitively inhibits the absorption of other nutrient ions, rendering plants unable to grow normally [
8]. Previous studies have investigated ion osmotic adjustment, antioxidant enzyme regulation, and the impact on phosphate transporters under salt stress [
38]. Based on these findings, genes with functional annotations related to salt tolerance were screened from the differentially expressed genes. Further screening was conducted by integrating gene function information from the NCBI database. Consequently, five key differential genes were identified:
BnaA07g33310D,
BnaA10g15320D,
BnaA02g04730D,
BnaC03g23980D, and
BnaC07g08360D. Among the five candidate genes,
BnaA10g15320D,
BnaA02g04730D, and
BnaC07g08360D were selected for subsequent functional validation based on their combined expression responsiveness under salt stress, correlation with physiological indicators, functional annotation, and experimental feasibility. The remaining two genes, including
BnaC03g23980D and
BnaA07g33310D, also showed potential relevance to salt stress and warrant further investigation in future studies.
3.2.2. Expression Patterns of Candidate Key Genes Under Different Salt Treatments
The root system is a key site for salt stress response [
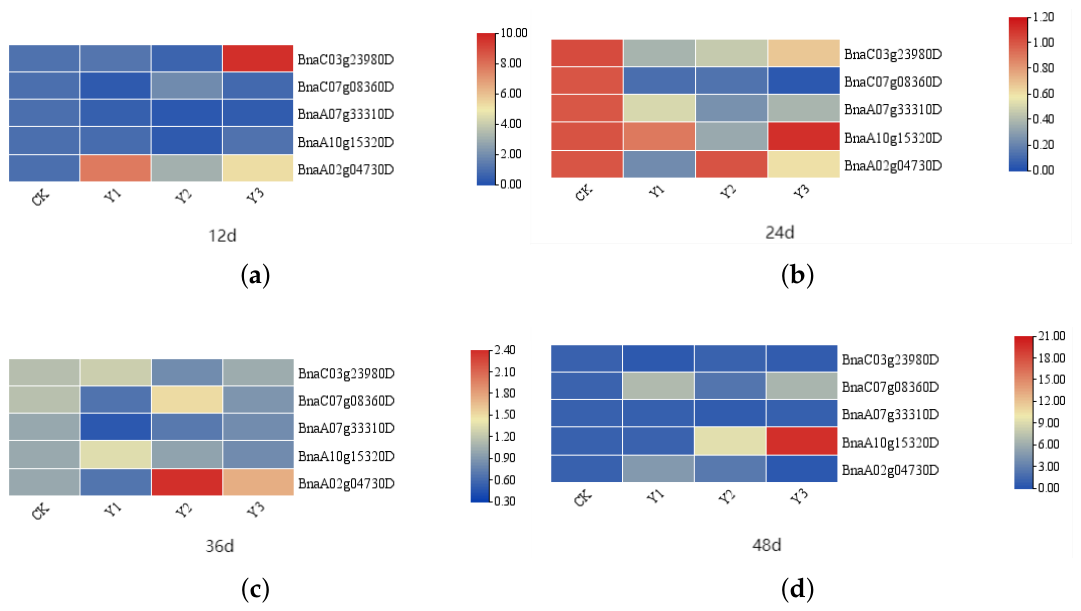
39]. Expression patterns of the five candidate genes under different salt concentrations were analyzed by qRT-PCR (
Figure 6).
As shown in
Figure 6, all five genes were significantly induced by salt stress, though their response patterns differed. Specifically,
BnaA02g04730D exhibited suppressed expression during the early stages of Y1 treatment. Under Y2 and Y3 treatments, although initially downregulated, its expression showed an adaptive recovery trend over time. In contrast,
BnaA10g15320D exhibited a sharp increase in expression after 48 days of treatment. Similarly,
BnaC03g23980D reached 19.67-fold expression relative to the control at 48 days under Y3 treatment. These results confirm that the selected candidate genes indeed participate in the molecular response of rapeseed to salt stress.
BnaC07g08360D showed significant upregulation only during the early stage of Y1 treatment, exhibiting substantial fluctuations under other conditions, suggesting this gene may be associated with specific responses.
BnaA10g15320D exhibited extreme expression variations in both Y1 and Y3 treatments, suggesting potential regulatory roles in acute stress responses. Based on these expression patterns, genes like
BnaA02g04730D are hypothesized to occupy central positions in the rapeseed salt tolerance regulatory network.
3.2.3. Correlation Analysis of Key Gene Expression Levels with Physiological Indicators and Hormone Content
Correlation analysis was performed between the expression levels of five key genes and root physiological indicators as well as endogenous hormone content (
Table 1).
As shown in
Table 1, the expression level of
BnaA02g04730D showed significant or highly significant negative correlations with SOD activity, CAT activity, and MDA content at the early stages of treatment (12 d and 24 d), suggesting a close association of this gene with antioxidant regulation and membrane lipid peroxidation under salt stress. In addition, the expression of
BnaA02g04730D showed highly significant negative correlations with ABA and GA contents at 36 d (
Table 2), indicating that this gene may also be involved in hormone-related regulatory pathways. The expression of gene
BnaA10g15320D showed a significant negative correlation with multiple antioxidant indicators at 24 days of treatment, but turned into a highly significant positive correlation with APX activity and Pro content at 48 days (r > 0.9). The expression of gene
BnaC07g08360D showed a very significant positive correlation with GPX, APX activity and Pro content on the 12th day of treatment, and a very significant negative correlation with GPX, APX activity and Pro content on the 24th day. In the early stage, it showed a very significant positive correlation with the content of hormones (IAA, ABA, etc.), but the correlation turned to a negative correlation as time went by.
Therefore, the significant expression changes and strong correlations with physiological and biochemical indicators observed in the BnaA02g04730D, BnaA10g15320D, and BnaC07g08360D genes suggest that these may be key genes influencing rapeseed salt tolerance.
3.3. Identification and Functional Validation of Key Salt-Tolerance Genes
3.3.1. Yeast Phenotyping of Key Salt Tolerance Genes
Yeast expression vectors (pYES2-NTB) carrying
BnaA10g15320D,
BnaA02g04730D, and
BnaC07g08360D were constructed and transformed into the
Saccharomyces cerevisiae INVSc1 strain (
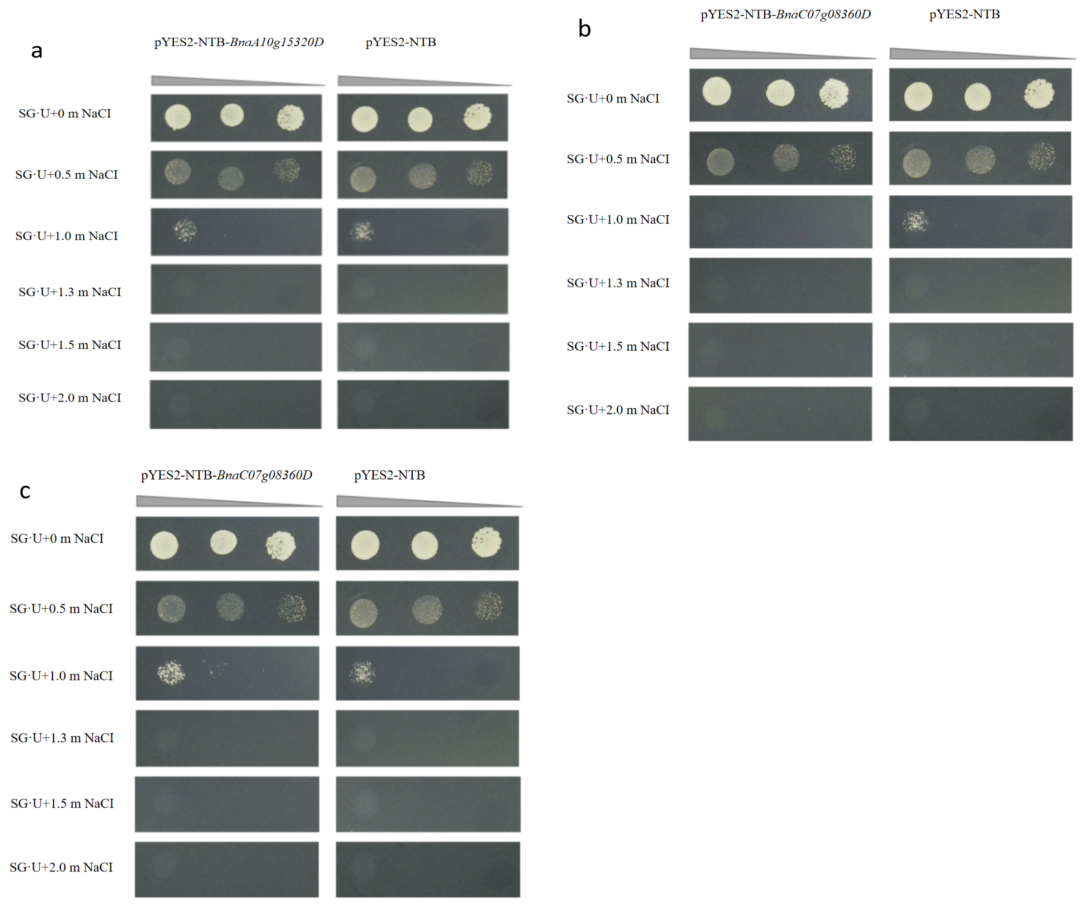
Figure 7).
As shown in
Figure 7, all strains exhibited uniform growth phenotypes on the normal medium (SC-U). In contrast, significant growth differences were exhibited on the stress medium containing 1.0 mol·
NaCl. The strongest growth vigor was displayed by the strain expressing
BnaA02g04730D, which was significantly superior to the empty vector control (
pYES2-NTB). This indicates that the salt tolerance of yeast cells is substantially enhanced by this gene. Conversely, growth inhibition was observed in the strain expressing
BnaA10g15320D, where no significant difference was found compared to the control. Furthermore, the growth vigor of the strain expressing
BnaC07g08360D was even weaker than that of the control. Consequently,
BnaA02g04730D was identified as a key positive regulator of salt tolerance in
Brassica napus.
3.3.2. Identification and Expression Analysis of Transgenic Plants
Using agrobacterium-mediated transformation of Brassica napus ‘Zhongshuang 11’, BnaA02g04730D-overexpressing regenerated plants were obtained. Genomic DNA extracted from regenerated plant leaves was subjected to PCR using specific primers targeting the hygromycin resistance gene (HYG). The results showed that a specific band of approximately 557 bp was amplified using the recombinant plasmid as a positive control, while no amplification bands were detected in negative controls (wild-type plants and water). Among the 16 regenerated plants tested, 14 amplified a target band identical to the positive control, yielding a positive rate of 87.5%. These results confirm the successful integration of the exogenous gene into the genomes of these transgenic plants.
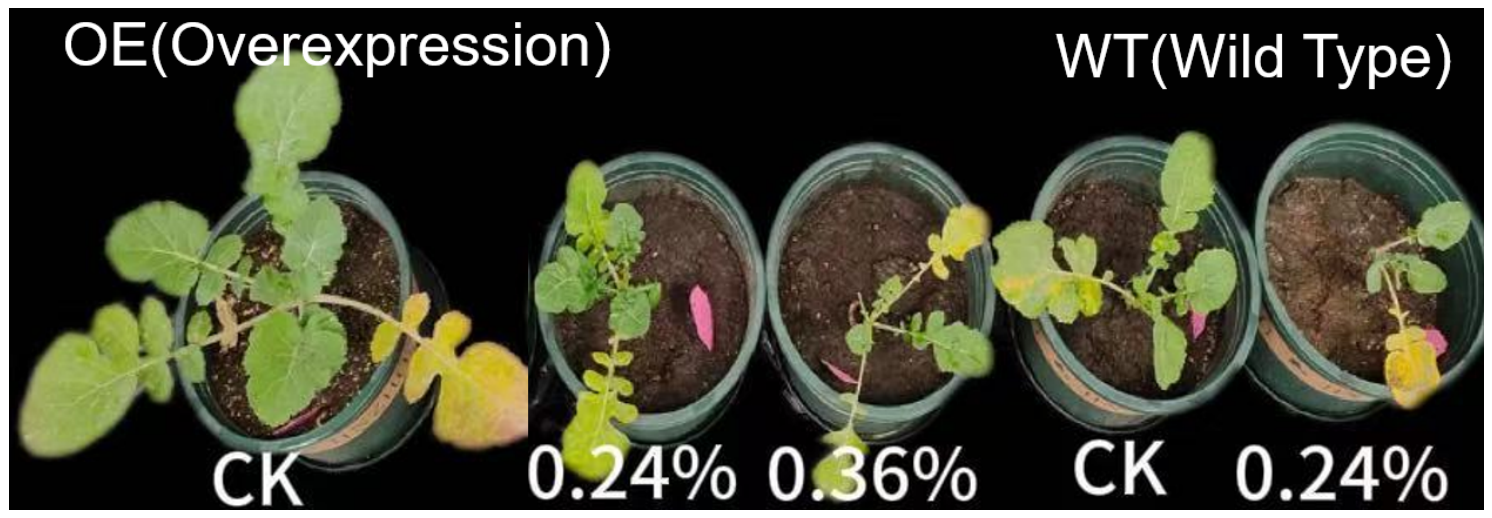
As shown in
Figure 8, under control conditions (CK), the OE lines displayed normal growth comparable to that of the WT plants, indicating that overexpression of
BnaA02g04730D did not cause obvious growth penalties under non-stress conditions. After 12 d of Y2 treatment, WT plants exhibited visible growth inhibition, including stunted growth and leaf chlorosis. In contrast, the OE plants showed relatively milder stress symptoms and maintained better overall growth status under the same treatment. These phenotypic observations suggest that overexpression of
BnaA02g04730D may alleviate salt-stress damage in rapeseed.
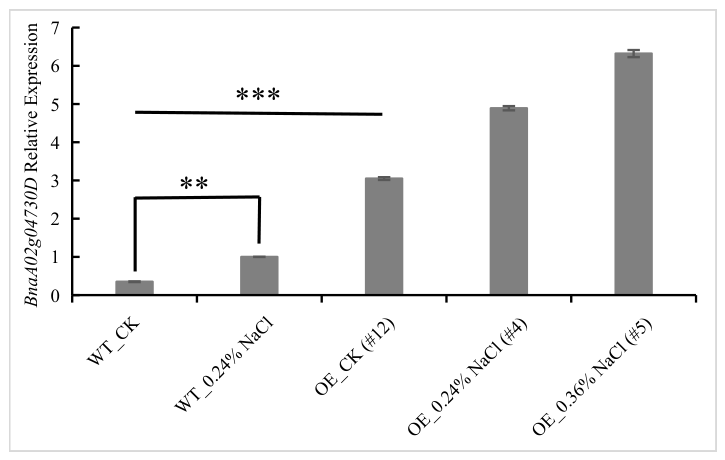
Three PCR-positive lines (OE #12, #4, #5) and the wild-type (WT) were selected for qRT-PCR analysis.
As shown in
Figure 9, the relative expression levels of
BnaA02g04730D in the three transgenic lines under normal growth conditions (CK) were significantly higher than those in the wild type (WT). The highest expression was observed in the OE #12 line, which was approximately 8.7-fold higher than that of the WT. This confirms that effective constitutive high-level expression of the gene was achieved in the transgenic plants. Furthermore, in the WT, gene expression was upregulated by approximately 2.9-fold under the Y2 treatment, indicating that
BnaA02g04730D is a salt stress-inducible gene. Higher transcript abundance of
BnaA02g04730D was observed in the tested overexpression lines than in the WT under both control and salt treatment conditions. However, because independent transgenic lines were used in different treatment groups, caution is required when interpreting treatment-dependent differences in expression intensity among these lines. Under the Y2 treatment, expression levels in the OE #4 and OE #5 lines were higher than those under CK conditions and substantially exceeded the levels in the WT under salt stress. Integrating the PCR and qRT-PCR results, transgenic materials with high
BnaA02g04730D expression were successfully obtained for subsequent functional analysis of salt tolerance.
3.3.3. Analysis of Physiological and Biochemical Differences Under Different Salt Concentrations
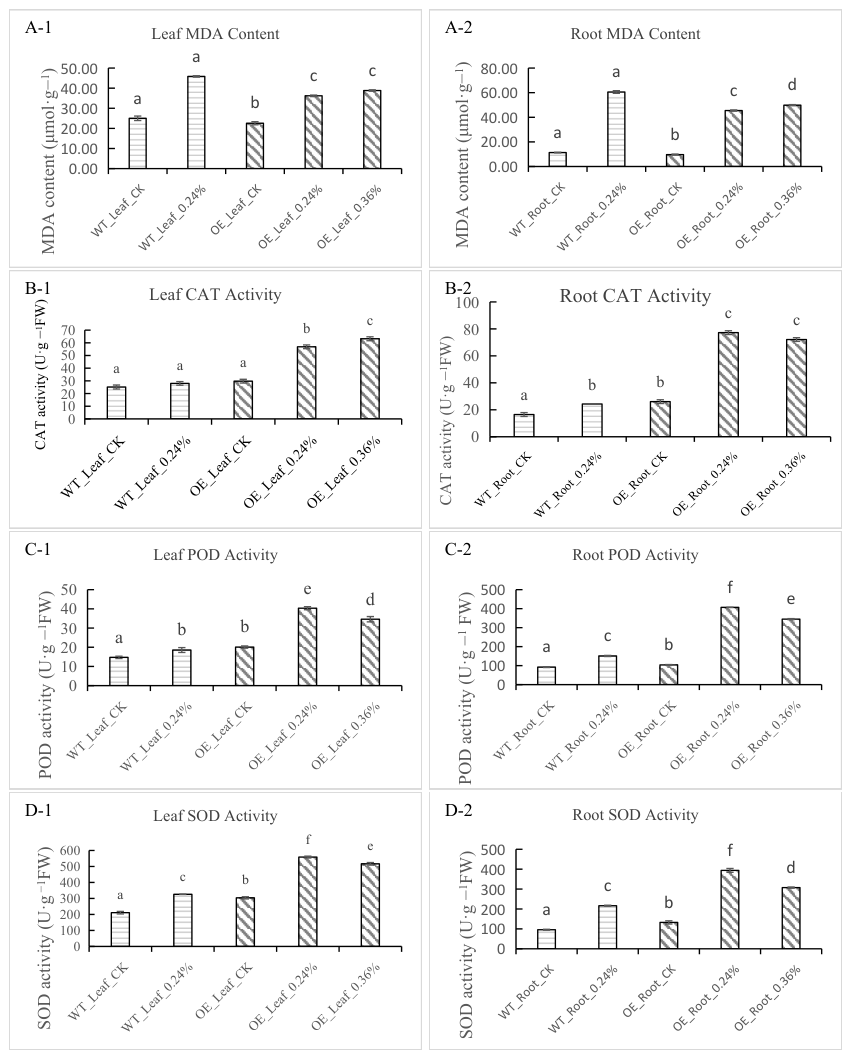
Physiological and biochemical parameters in roots and leaves of WT and OE plants under salt stress were analyzed, and the results are presented in
Figure 10.
As shown in
Figure 10(A-1,A-2), MDA levels do not differ significantly between WT and OE plants under CK conditions. After Y2 treatment, MDA content increases sharply in WT roots and leaves, whereas its accumulation is significantly suppressed in OE plants. In contrast, MDA accumulation in OE plants was significantly suppressed. Particularly in roots, MDA content in OE plants was significantly lower than in WT (
p < 0.05), indicating that
BnaA02g04730D overexpression effectively maintained cell membrane integrity.
Further analysis of the antioxidant enzyme system revealed that
BnaA02g04730D significantly upregulated SOD, CAT, and POD activities (
Figure 10(B-1–D-2)). Under salt stress, OE plants exhibited a more rapid and robust antioxidant response than WT. Under Y2 treatment, the SOD, CAT, and POD activities in the leaves increased to approximately 1.7-fold, 2.0-fold, and 2.1-fold those of the wild-type (WT), respectively; in the roots, the corresponding enzyme activities reached 1.8-fold, 3.1-fold, and 2.7-fold those of the WT, respectively. Even under the higher salt concentration Y3 treatment, OE plants maintained exceptionally high enzyme activity levels. Thus,
BnaA02g04730D enhances the synergistic activity of SOD, CAT, and POD to establish an efficient reactive oxygen species (ROS) scavenging network. This significantly mitigates oxidative damage to the cell membrane system caused by salt stress, ultimately conferring enhanced salt tolerance to
Brassica napus.
4. Discussion
4.1. Screening of Superior Salt-Tolerant Breeding Materials
The selected salt-tolerant accession XNSA01 exhibited superior growth vigor under salt stress. Physiological analysis indicated that the core mechanism of its salt tolerance lies in its efficient and persistent reactive oxygen species (ROS) scavenging capability. Homeostasis under salt stress is maintained through the synergistic regulation of an efficient antioxidant enzyme system and hormones. Field results demonstrated that even under severe saline-alkali conditions (total soluble salt 52.36 g· ), the growth period was successfully completed, and robust growth was maintained by this variety, exhibiting favorable agronomic traits. XNSA01 is a high-oil (49.33%), double-low (0% erucic acid and 31.79 µmol· glucosinolates) variety with yellow seeds, which also boasts excellent yield components (221.6 pods per plant). This elite germplasm can facilitate the breeding of new salt-tolerant rapeseed varieties. It should also be noted that evaluation at the germination stage has certain limitations, because early seedling performance is influenced not only by intrinsic salt tolerance but also by seed reserves. Therefore, traits such as germination rate and fresh weight at this stage may not fully reflect the physiological salt tolerance of the genotype. In the present study, this limitation was addressed by combining germination-stage screening with field validation, physiological analyses, transcriptome profiling, and functional verification, thereby improving the reliability of the selected salt-tolerant material.
4.2. Molecular Mechanisms of Salt Tolerance in Rapeseed
Salt stress triggered rapid antioxidant responses in both roots and leaves of Brassica napus, indicating that ROS scavenging is an important component of salt tolerance in XNSA01. Under prolonged stress, roots appeared to maintain stronger tolerance than leaves, which was associated with sustained antioxidant enzyme activity and osmotic adjustment. In particular, proline accumulation reached 2918 µg· FW under the Y3 treatment, suggesting an important role of osmotic regulation in alleviating salt- induced damage.
Hormonal responses also differed under different salt stress levels. Low-salinity stress was associated with relatively higher levels of growth-related hormones such as GA and IAA, suggesting that mild salt stress may help maintain root growth adaptation. In contrast, high-salinity stress promoted the accumulation of stress-related hormones such as SA and ABA, indicating activation of systemic stress defense pathways.
Through transcriptome screening, yeast assays, and transgenic verification,
BnaA02g04730D, which contains an SPX domain, was identified as a key salt-tolerance-related gene in rapeseed. SPX-domain proteins are mainly known for their roles in phosphate signaling [
23], but increasing evidence suggests that they may also participate in broader abiotic stress responses [
24]. In the present study,
BnaA02g04730D was strongly induced by salt stress and improved salt tolerance in overexpressing plants. Physiological analyses further showed that overexpression of
BnaA02g04730D enhanced antioxidant enzyme activities and reduced MDA accumulation, indicating that this gene may contribute to salt tolerance by strengthening antioxidant defense and maintaining membrane stability. These findings are consistent with previous studies showing that efficient antioxidant systems are critical for cellular homeostasis under salt stress [
11,
40].
It should also be noted that the transgenic evaluation in this study was conducted using T0 plants, and independent overexpression lines were used in some expression comparisons. Therefore, the potential influence of line-to-line variation cannot be completely excluded. Further validation using stable homozygous lines in later generations will be necessary. In addition, the phenotypic comparison of transgenic plants in this study was mainly based on representative images. Further quantitative evaluation using growth-related traits such as plant height and biomass would strengthen the phenotypic evidence for salt tolerance.
4.3. Integrated Analysis for Screening Salt-Tolerant Rapeseed Materials
Based on transcriptome analysis, a comprehensive screening strategy was established by integrating plant phenotypes, physiological indicators, and gene expression patterns. Particular attention was given to genes showing strong expression changes under salt stress and close associations with antioxidant enzyme activities and membrane damage indicators. The analysis revealed that BnaA02g04730D exhibited strong correlations with SOD, CAT, and MDA at multiple time points, suggesting its important role in antioxidant regulation and membrane stability under salt stress. Therefore, integrating transcriptomic data with physiological and biochemical indicators represents an effective approach for identifying candidate salt-tolerance genes. In this study, BnaA02g04730D was further validated as a positive regulator of salt tolerance in rapeseed. These results provide a useful basis for the early identification of salt-tolerant germplasm and for the efficient screening of salt-tolerance-related genes in Brassica napus.
5. Conclusions
A salt tolerance screening of 1609 Brassica napus accessions was conducted during the germination stage using a 1.5% NaCl solution. Combined with field validation in saline-alkali soil, the highly salt-tolerant accession XNSA01 was identified. During the early stage of salt stress (24 d), both roots and leaves rapidly activated antioxidant defenses, with significant increases in SOD, CAT, and POD activities reaching peak levels. In the late stage of prolonged stress (48 d), roots exhibited greater tolerance than leaves by maintaining high antioxidant enzyme activities and continuously accumulating proline, while MDA content in roots was effectively controlled. Under low salinity stress, plants primarily promoted root growth adaptation by maintaining elevated levels of growth hormones GA and IAA. In contrast, high salinity stress significantly induced the accumulation of stress hormones SA and ABA, with ABA sustaining high levels during the late stress phase to initiate systemic defense responses. Absolute quantitative transcriptomic analysis revealed that the expression levels of the identified key genes were closely correlated with physiological and biochemical indicators: the expression levels of three candidate genes showed significant correlations (|r| > 0.70) with antioxidant enzyme activities (SOD, CAT, POD) and endogenous hormone contents (ABA, SA). Among these, the key gene BnaA02g04730D exhibited a highly significant negative correlation with MDA content (), identifying it as a critical candidate gene responding to salt stress. Both yeast assays and transgenic rapeseed validation confirmed that BnaA02g04730D positively regulates salt tolerance in rapeseed. Under the Y2 treatment, SOD, CAT, and POD activities in overexpressing plants were 1.8-, 3.1-, and 2.7-fold higher, respectively, than in the wild type, while MDA content was significantly reduced by approximately 25%. This study identified the salt-tolerant Brassica napus cultivar XNSA01 (‘Xiangnong Saline-Alkali Oil No. 1’) and uncovered the key salt-tolerance gene BnaA02g04730D. These findings provide a useful basis and valuable genetic resources for screening salt-tolerant germplasm and for further investigating the molecular mechanisms of salt tolerance in rapeseed.