Systematic Review

Effects of Coenzyme Q10 Supplementation on Muscle Health and Physical Capacity in Middle-Aged and Older Adults: A Systematic Review and Meta-Analysis of Randomized Controlled Trials

1
Sports Coaching College, Beijing Sport University, Beijing 100084, China
2
School of Strength and Conditioning Training, Beijing Sport University, Beijing 100084, China
3
College of Education, Beijing Sport University, Beijing 100084, China
4
School of Sports Training, Tianjin University of Sport, Tianjin 301617, China
5
Sports Department, Tianjin University, Tianjin 300354, China
6
Division of Sport Anatomy, School of Sport Science, Beijing Sport University, Beijing 100084, China
7
Laboratory of Sports Stress and Adaptation of General Administration of Sport, Beijing 100084, China
*
Author to whom correspondence should be addressed.
†
These authors contributed equally to this work.
Antioxidants 2026, 15(10), 1219; https://doi.org/10.3390/antiox15101219
Submission received: 20 August 2026 / Revised: 8 September 2026 / Accepted: 15 September 2026 / Published: 22 September 2026
(This article belongs to the Special Issue Unveiling the Essential Role of Coenzyme Q in Health)

Abstract

Age-related declines in physical capacity may partly reflect impaired mitochondrial bioenergetics and oxidative stress. This systematic review and meta-analysis evaluated the effects of oral coenzyme Q10 (CoQ10) supplementation on muscle health and physical capacity in adult populations with a study-level mean or median age ≥ 40 years. MEDLINE, Embase, Web of Science, Scopus, and CENTRAL were searched through July 2026 for randomized controlled trials lasting ≥2 weeks. Directly usable evidence formed primary random-effects models, whereas assumption-dependent estimates were included only in sensitivity analyses. Effect measures were expressed as mean differences (MDs) or Hedges’ g, as appropriate. Thirty-three trials involving 3317 randomized participants were included, and 21 contributed to meta-analysis. The relative VO2peak/VO2max estimate was small and imprecise (5 studies, n = 172; MD 0.73 mL·kg−1·min−1, 95% CI −0.07 to 1.54; I2 = 0%; low certainty) and remained compatible with no benefit. Primary estimates were also uncertain for 6-min walking distances, handgrip strength, lower-limb strength, chair-rise performance, exercise duration, and muscle/lean-tissue quantity. Sensitivity analyses did not materially alter the overall interpretation. Evidence certainty was low or very low for all key outcomes. Current evidence does not establish clinically meaningful benefits of CoQ10 supplementation for aerobic capacity, muscle health, or physical function.

1. Introduction

Population ageing has increased the number of adults living with progressive losses of skeletal muscle strength, muscle quantity and quality, and cardiorespiratory fitness. These changes may begin during middle age and become increasingly pronounced in later life, particularly in the presence of chronic disease, physical inactivity, inadequate nutrition, or long-term pharmacological treatment. The revised European consensus on sarcopenia identifies low muscle strength as the primary characteristic of sarcopenia, with reduced muscle quantity or quality used to confirm the diagnosis and impaired physical performance indicating greater severity [1]. This diagnostic framework is relevant to the present review because it distinguishes muscle strength, muscle quantity or quality, and physical performance as related but non-interchangeable domains that map directly onto the outcomes evaluated here; it was used to organize the review outcomes rather than to imply that all included participants had clinically diagnosed sarcopenia. Longitudinal evidence further suggests that muscle strength declines more rapidly than lean mass, indicating that age-related functional deterioration cannot be explained by muscle loss alone [2]. Aerobic capacity also decreases throughout adulthood, with an accelerated decline in peak oxygen uptake during later decades of life [3]. Together, these functional losses provide the clinical rationale for evaluating CoQ10, a mitochondrial electron carrier and antioxidant, as a potential intervention for preserving mobility, exercise tolerance, and independent living during middle and older age.
Age-related deterioration in physical function has been associated with alterations in skeletal-muscle mitochondrial energetics, oxidative capacity, and quality control, although these relationships are also influenced by habitual physical activity and cardiometabolic health [4]. Coenzyme Q10 (CoQ10), present mainly as ubiquinone and its reduced form ubiquinol, is an endogenously synthesized lipid-soluble electron carrier and redox-active molecule involved in mitochondrial energy production and cellular antioxidant defence [5]. Altered CoQ10 status has been reported in some age-related and chronic clinical conditions [6].
Despite this mechanistic rationale, the clinical effects of CoQ10 supplementation on muscle and physical outcomes remain uncertain. Randomized trials have investigated CoQ10 across heterogeneous populations, including healthy adults, older individuals, physically trained participants, statin users, and patients with cardiovascular, metabolic, or neuromuscular conditions. Reported outcomes have included maximal or peak oxygen uptake, walking capacity, exercise duration, maximal workload, time to exhaustion, handgrip strength, lower-limb strength, chair-rise performance, mobility, fatigue, and indices of muscle quantity. However, the direction and magnitude of the reported effects have not been consistent. Potential sources of variation include differences in baseline CoQ10 status, age and health status, supplementation dose, ubiquinone or ubiquinol formulation, intervention duration, concomitant exercise training, and the sensitivity of the physical-performance tests employed. Recent evidence indicates that supplementation reliably increases circulating CoQ10 concentrations, whereas improvements in exercise performance are generally smaller, less consistent, and dependent on the population and outcome examined [7,8]. Evidence concerning exercise-induced oxidative stress and muscle damage also does not necessarily translate into measurable improvements in aerobic capacity, muscle strength, or habitual physical function [7]. Consequently, biochemical responsiveness should not be assumed to represent clinically meaningful functional benefit.
Several previous systematic reviews have examined nutritional supplementation and physical function in older people or the effects of CoQ10 on exercise-related outcomes. A broad review of nutritional interventions in older adults evaluated multiple nutrients rather than isolating the effects of CoQ10 [9]. More recent CoQ10 meta-analyses have predominantly combined adults across a wide age range, focused on healthy or physically active populations, or emphasized exercise-induced oxidative stress, biomarkers of muscle damage, and short-term exercise performance [7,8]. Although these studies provide important evidence, they do not specifically resolve whether CoQ10 supplementation improves clinically relevant domains of muscle health and physical capacity in middle-aged and older adults across both healthy and clinical populations. In addition, previous syntheses have not always clearly distinguished directly reported results from estimates that required additional statistical assumptions. This limits assessment of whether pooled conclusions are robust to data-recovery decisions and provides a rationale for separating primary evidence from assumption-dependent sensitivity evidence in the present review.
Therefore, the present systematic review and meta-analysis aimed to evaluate the effects of oral CoQ10 supplementation on muscle health and physical capacity in adult populations with a study-level mean or median age of ≥40 years, or in separately extractable subgroups meeting this threshold. Only randomized controlled trials comparing CoQ10 with placebo, no supplementation, or an otherwise equivalent control condition were considered. Outcomes of interest encompassed aerobic capacity, walking and functional capacity, exercise performance, muscle strength and function, muscle quantity, and validated clinician-rated disease-specific motor function. Evidence was organized into clinically coherent outcome domains, with directly supported estimates used in primary analyses and assumption-dependent estimates reserved for sensitivity analyses. Disease-specific motor scales were summarized within their clinical context and were not combined across neurological disorders. By examining effect magnitude, precision, heterogeneity, risk of bias, robustness, and certainty, this review sought to clarify the potential role of CoQ10 supplementation in preserving muscle and physical function during middle and older age and to identify priorities for future randomized trials.

2. Methods

2.1. Protocol, Registration, and Reporting

This systematic review and meta-analysis were reported according to PRISMA 2020 [10] and registered in PROSPERO (CRD420261469564). An internal statistical analysis plan (SAP) was finalized before completion of the final outcome-level extraction, final effect-size calculations, and pooled modelling. The SAP prespecified the A/B/C evidence-routing framework, outcome-selection and data-recovery rules, and planned sensitivity and subgroup analyses. Routing was based on quantitative recoverability, required assumptions, and clinical comparability, independently of effect magnitude, direction, statistical significance, RoB 2 judgment, or GRADE certainty. Post-SAP changes were documented in an amendment log, and a completed PRISMA 2020 checklist is provided separately. Consistent with contemporary transparency principles for systematic-review reporting [11] and established approaches to the statistical recovery of incomplete summary data [12,13], this operational routing framework makes the influence of data-recovery decisions auditable: directly supported estimates determine the primary analyses, whereas estimates requiring statistical reconstruction or unverifiable assumptions are confined to prespecified sensitivity analyses. The A/B/C labels are review-specific operational categories rather than a formally endorsed classification system.

2.2. Eligibility Criteria

Eligible populations were adults from studies with a reported study-level mean or median age ≥ 40 years, or separately extractable subgroups meeting this threshold; both nonclinical and chronic-disease populations were eligible. Interventions comprised oral CoQ10 (including ubiquinone, ubiquinol, ubidecarenone, and clearly identified enhanced-bioavailability formulations) at any dose for ≥2 weeks. Balanced co-interventions were permitted, and multi-ingredient, factorial, or multi-arm trials were eligible only when the independent CoQ10 effect could be isolated. Comparators included placebo, no supplementation, usual care, or an otherwise equivalent background intervention.
Eligible outcomes were objective measures of aerobic capacity, walking or functional capacity, exercise performance, muscle strength or function, muscle/lean-tissue quantity, or validated clinician-rated disease-specific motor or functional outcomes. Biochemical markers, subjective fatigue, quality of life, pain, and other patient-reported outcomes alone were insufficient for eligibility. Randomized parallel-group, crossover, and factorial designs were eligible when random allocation was verifiable; crossover trials additionally required randomized treatment sequence. Non-randomized and quasi-randomized studies, single-arm or observational studies, acute non-supplementation experiments, protocols, reviews, case reports, and animal or in vitro studies were excluded.
Systematic-review eligibility was assessed separately from quantitative usability: otherwise eligible trials were retained when numerical results required conversion, imputation, graphical recovery, crossover assumptions, or narrative synthesis. Multiple reports from one randomized trial were linked and treated as a single study. Detailed PICOS criteria and boundaries are provided in Supplementary Methods S1.

2.3. Information Sources and Search Strategy

MEDLINE via PubMed (20 July 2026), Embase (21 July 2026), Web of Science Core Collection (21 July 2026), Scopus (21 July 2026), and CENTRAL (21 July 2026) were searched from inception without language or publication-year restrictions, following PRISMA-S reporting principles [11]. PubMed used a broad CoQ10-plus-randomized-trial strategy without mandatory age or outcome terms; Embase added age and outcome blocks, Web of Science and Scopus added outcome terms, and CENTRAL combined CoQ10 and outcome concepts within the Trials collection. The final executed strategies were retained as run rather than reconstructed retrospectively. After study selection was complete, a post hoc known-item recovery audit used the 33 final included reports as the benchmark set. Reports were matched against the original, unmodified database exports by DOI when available and by normalized title otherwise; recovery was calculated separately for each database and for their union. Because the benchmark comprised studies identified within the completed review, this audit assessed recovery of known eligible reports and was not interpreted as proof of absolute sensitivity for unidentified or unindexed studies. Reference lists of eligible trials and relevant reviews were also checked. Exact executed strategies, limits, search dates, and pre-deduplication yields are reproduced in Supplementary Methods S1.

2.4. Study Selection

Search records were imported into EndNote and deduplicated using bibliographic identifiers and manual verification. Two reviewers independently screened titles/abstracts and then full texts against the prespecified criteria. At title/abstract screening, records were excluded only when both reviewers agreed that they clearly represented a non-randomized design, an ineligible age population without a separately extractable subgroup, an intervention from which the independent CoQ10 effect could not be isolated, an intervention lasting less than 2 weeks, or a study without an eligible objective muscle, physical-performance, physiological, or disease-specific motor outcome. Any uncertainty or a potentially eligible judgment by either reviewer triggered full-text assessment. One primary reason for exclusion was recorded for each excluded full text. Screening disagreements were resolved by consensus or, when necessary, third-reviewer adjudication. Multiple reports from the same trial were linked using study and intervention characteristics to prevent double counting. No records were excluded solely through automated screening tools.

2.5. Data Extraction and Outcome Hierarchy

Data were extracted with a standardized, piloted form by Xundian Liu and independently verified against the source reports by Jingxuan Bao. The two reviewers jointly rechecked the original report and resolved discrepancies through discussion; if a discrepancy remained unresolved, Xiuying Jiang served as the third reviewer for adjudication. Extracted information covered study and participant characteristics, intervention and comparator details, eligible outcomes, numerical data required for effect-size calculation, and attrition. Main results tables were preferred, followed by Supplementary Materials, companion reports, registries, and figures. Intention-to-treat and direct between-group estimates were preferred when available. Prespecified adjusted estimates were used when appropriate; otherwise, change scores with usable variance or post-intervention values were selected. Extracted and derived values were checked against sample sizes, confidence intervals, test statistics, and direction of benefit.
Outcomes were organized into clinically coherent domains: relative VO2peak/VO2max, walking and functional capacity, exercise duration and maximum workload, chair-rise performance, handgrip and lower-limb strength, muscle/lean-tissue quantity, and validated disease-specific motor or functional outcomes. Disease-specific scales were interpreted within their disorder and instrument context and were not pooled across neurological disorders or combined with instrumented physical-performance outcomes. Pooling therefore depended on outcome-level construct comparability rather than diagnosis alone.
Only one effect estimate from each independent study comparison entered a given meta-analysis. When multiple estimates represented the same domain, selection followed a concise hierarchy: the trial-designated primary outcome was preferred, followed by the most direct validated and cross-study-comparable measure based on the largest eligible analysis sample. Bilateral strength values were preferred or combined where possible. The end of the randomized intervention was the primary follow-up; when several assessments occurred during active treatment, the longest prespecified time point before discontinuation or crossover was used. Results requiring additional assumptions or recovery were routed to Class B sensitivity or standalone analysis rather than entering primary models. Class A primary inputs and the full operational selection rules are reported in Supplementary Table S2 and the statistical analysis plan.

2.6. Evidence Routing: Core, Sensitivity, and Narrative Synthesis

Each eligible outcome result was assigned an outcome-specific evidence class and analytic route according to the prespecified statistical analysis plan. Class A comprised directly reported or deterministically recoverable between-group estimates with usable variance and no unverifiable assumptions; clinically comparable Class A results formed the primary models, while non-exchangeable results were reported as A-standalone. Class B comprised estimates requiring a prespecified statistical assumption or recovery procedure, including median-to-mean conversion, assumed within-participant correlation, crossover reconstruction, or verified digitization; compatible Class B estimates entered A + B sensitivity models, while others were reported as B-standalone. Class B estimates were considered acceptable for sensitivity analysis because the recovery procedures were prespecified, transparent, based on conventional statistical relationships, and examined across plausible alternative assumptions. They were not allowed to determine the primary conclusions or formal GRADE ratings. Class C comprised eligible results for which no defensible quantitative estimate or variance could be recovered and was synthesized narratively.
Routing was independent of observed effect magnitude, direction, p-value, RoB 2, and GRADE. Evidence class therefore described quantitative recoverability rather than internal validity or certainty. At study level, each trial was counted once according to its highest class (A > B > C), whereas Supplementary Tables S2 and S3 provide the authoritative outcome-level routes.

2.7. Risk-of-Bias Assessment

Risk of bias was assessed with Cochrane RoB 2 [14] for the effect of assignment to intervention. Parallel-group trials were evaluated with the standard RoB 2 tool for individually randomized parallel-group trials (version 22 August 2019). Randomized crossover trials were evaluated with the dedicated RoB 2 variant for randomized crossover trials (version 18 March 2021), which adds Domain S for risk of bias arising from period and carryover effects. Domain S considered whether participants were allocated to treatment sequences in equal or nearly equal proportions, whether period effects were accounted for when required, and whether sufficient time elapsed for carryover to disappear before subsequent outcome measurement. Period and carryover concerns were therefore adjudicated in Domain S rather than being reassigned to Domain 2. Two reviewers assessed judgments independently and resolved disagreements by discussion or third-reviewer adjudication. Domain and overall judgments were categorized as low risk, some concerns, or high risk and were not converted to numerical scores or used for automatic exclusion. Because outcome-specific meta-analyses generally contained few studies, separate high-risk-study exclusion models were not considered sufficiently stable; risk of bias instead informed GRADE and interpretation, with individual-study influence examined through leave-one-out analyses when at least three studies were available.

2.8. Effect Measures and Statistical Synthesis

Continuous outcomes measured on a common scale were summarized as mean differences (MDs) with 95% confidence intervals: mL·kg−1·min−1 for relative VO2peak/VO2max, metres for 6-min walking distance, watts for maximum workload, kilograms for handgrip strength, and newton-metres for lower-limb strength. Hedges’ g was used for common constructs assessed with non-exchangeable scales or protocols, specifically exercise duration, chair-rise performance, and muscle/lean-tissue quantity. Disease-specific scales remained on their original scale and were combined only within the same disease, instrument, and comparable follow-up context. All effects were oriented so that positive values favoured CoQ10; estimates for outcomes in which lower values were better were sign-reversed accordingly.
Clinical poolability was determined before statistical synthesis from the outcome construct, measurement scale and protocol, assessment context, and interpretability of a common effect. Diagnosis alone did not preclude pooling when studies assessed the same underlying objective construct using sufficiently comparable measurement procedures and interpretable effect scales. Accordingly, relative VO2peak/VO2max, 6-min walking distance, handgrip strength, and comparable lower-limb strength measures could be pooled across eligible clinical and nonclinical populations when these criteria were met. In contrast, outcomes whose clinical meaning depended on a specific disorder or instrument, such as UPDRS, UHDRS, UMSARS, and PSP Rating Scale scores, were retained as disease-specific standalone evidence and were not pooled across disorders. Meta-analysis was performed only when at least two independent studies were sufficiently comparable.
Random-effects models used restricted maximum likelihood estimation with Hartung–Knapp inference [15]. Heterogeneity was described using Cochran’s Q, τ2, and I2 [16], considering study-specific effects and clinical or methodological differences rather than fixed I2 thresholds. Prediction intervals were reported when at least five studies contributed [17]. Compatible Class A results formed primary models; Class B results were added only in A + B sensitivity models. Inference emphasized effect magnitude, precision, consistency, and certainty rather than statistical significance alone.

2.9. Crossover, Factorial, and Multi-Arm Trials

Crossover trials were analysed as paired comparisons targeting the within-participant end-of-period difference, with each participant counted once. Reported paired effects and variances were used directly when available. When paired variance was unavailable, the within-participant correlation was assumed to be r = 0.50 for the primary Class B sensitivity estimate and varied to 0.25 and 0.75 in sensitivity analyses; such correlation-dependent estimates did not enter Class A primary models. A washout of at least 4 weeks was prespecified as a conservative design threshold to reduce the plausibility of carryover between randomized treatment periods. This threshold was used as an analytic safeguard rather than as a claim that 4 weeks represents a universal pharmacokinetic washout period across all CoQ10 doses and formulations. Crossover results with shorter, absent, or unclear washout were therefore routed to Class B sensitivity or standalone analysis when otherwise quantitatively recoverable.
For factorial trials, a CoQ10 main effect was used only when the randomized contrast was isolatable, co-interventions were balanced, and no important interaction invalidated the marginal effect. For multi-arm trials, comparable CoQ10 arms were combined, or a prespecified clinically relevant contrast was selected, and shared controls were not reused within a meta-analysis. First-period crossover data were used only when unbiased and separately available.

2.10. Missing Data, Digitization, and Statistical Conversions

When numerical data were incomplete, all available reports, supplements, protocols, and registrations were checked, and authors were contacted with one reminder after approximately 2 weeks. Standard errors, confidence intervals, exact test statistics, and exact p values were converted using conventional relationships only when the tested contrast and degrees of freedom were unambiguous; non-exact significance statements were not converted. When change-score variance was unavailable, eligible post-intervention comparisons were preferred rather than reconstructing change variance.
Means and SDs were estimated from medians and interquartile ranges using Wan and Luo methods [12,13] only when distributional assumptions were considered defensible; converted results were Class B. Graphical recovery required duplicate independent calibration and reconciliation, and no graph-only result passed all verification and comparability criteria. Units and effect directions were harmonized before pooling, while absolute oxygen uptake was not combined with relative-unit models without valid body-mass data. Original values, transformations, assumptions, and Class B inputs are documented in Supplementary Table S3.

2.11. Sensitivity and Influence Analyses

Robustness was assessed by comparing each Class A primary model with its compatible A + B model. Correlation-dependent crossover estimates used r = 0.50 with r = 0.25 and 0.75 as sensitivity bounds; VO2 analyses also excluded the no-washout study [18,19]. A separate high-risk-study exclusion analysis was prespecified but was not performed because the final Class A meta-analyses contained only 2–5 studies per outcome. Excluding high-risk trials would therefore have further reduced already sparse evidence bases and, for several outcomes, yielded unstable or non-informative pooled estimates. This was treated as a documented deviation from the planned analysis rather than replaced by an unplanned confirmatory model. Risk-of-bias concerns were instead incorporated into GRADE, and individual-study influence was examined using leave-one-out analyses when at least three studies were available. Leave-one-out analyses were conducted for A and A + B models with at least three studies, recording changes in pooled effects, 95% CIs, τ2, and I2; full results are in Supplementary Table S4.
The prespecified clinical-versus-nonclinical VO2 subgroup analysis was not performed because only five Class A studies were available, below the six-study threshold. The planned age comparison for 6-min walking distances was also infeasible because of limited study count and confounding with clinical population. Meta-regression was not undertaken because no outcome contained 10 comparable studies.

2.12. Reporting Bias and Certainty of Evidence

Funnel plots and regression-based asymmetry tests were planned only for outcomes with at least 10 comparable studies and meaningful size variation; no outcome met this threshold. Trim-and-fill was not used. Risk of bias due to missing evidence was assessed qualitatively at the meta-analysis-result level using ROB-ME-informed principles [20]. For each meta-analytic outcome, we considered whether eligible outcome results were known to have been measured but were unavailable for quantitative synthesis, whether trial protocols or registrations suggested selective non-reporting, and whether linked reports, reference-list checks, or author correspondence indicated additional unreported eligible results. Downgrading for publication bias was considered when these signals collectively suggested that missing evidence was plausibly related to the direction or magnitude of the observed effect.
GRADE was applied to seven key Class A outcomes: relative VO2peak/VO2max, 6-min walking distance, exercise duration, handgrip strength, lower-limb strength, chair-rise performance, and muscle/lean-tissue quantity [21]; maximum workload received a supplementary rating. Randomized evidence started at high certainty and could be downgraded for risk of bias, inconsistency, indirectness, imprecision, or publication bias. The prespecified target population encompassed adult study populations with a study-level mean or median age ≥ 40 years across both nonclinical and clinical settings. Indirectness was judged at the outcome level against this prespecified review question. Diagnosis alone was not considered sufficient for downgrading when the intervention, comparator, and underlying outcome construct remained clinically comparable. A downgrade was considered when the contributing evidence materially departed from the prespecified population, intervention, comparator, or outcome construct. Clinical heterogeneity within the eligible population was nevertheless considered when interpreting the applicability of pooled estimates to specific patient groups. Imprecision considered CI width, total information, and whether intervals spanned materially different interpretations. Formal GRADE ratings applied only to Class A primary evidence; A + B models were sensitivity analyses and were not rated.

2.13. Software and Reproducibility

Analyses were conducted in R 4.6.1 on Windows 11, primarily using metafor 5.0–1 for effect-size calculation, random-effects modelling, Hartung–Knapp inference, heterogeneity, correlation scenarios, and leave-one-out analyses. RoB 2 and GRADE judgments were stored in structured outcome-level files and were not inferred automatically from single statistics or plots. The locked dataset retained original values, transformations, evidence classes, assumptions, washout status, and analytic routes under stable identifiers; scripts generated the reported models, tables, and figures from these data. The reproducibility package contains the protocol and amendments, original database exports, executed searches, the known-item recovery audit, screening decisions, extraction dictionary, locked dataset, conversion records, scripts, source data, session information, and generated outputs and is available from the corresponding author on reasonable request.

3. Results

3.1. Study Selection

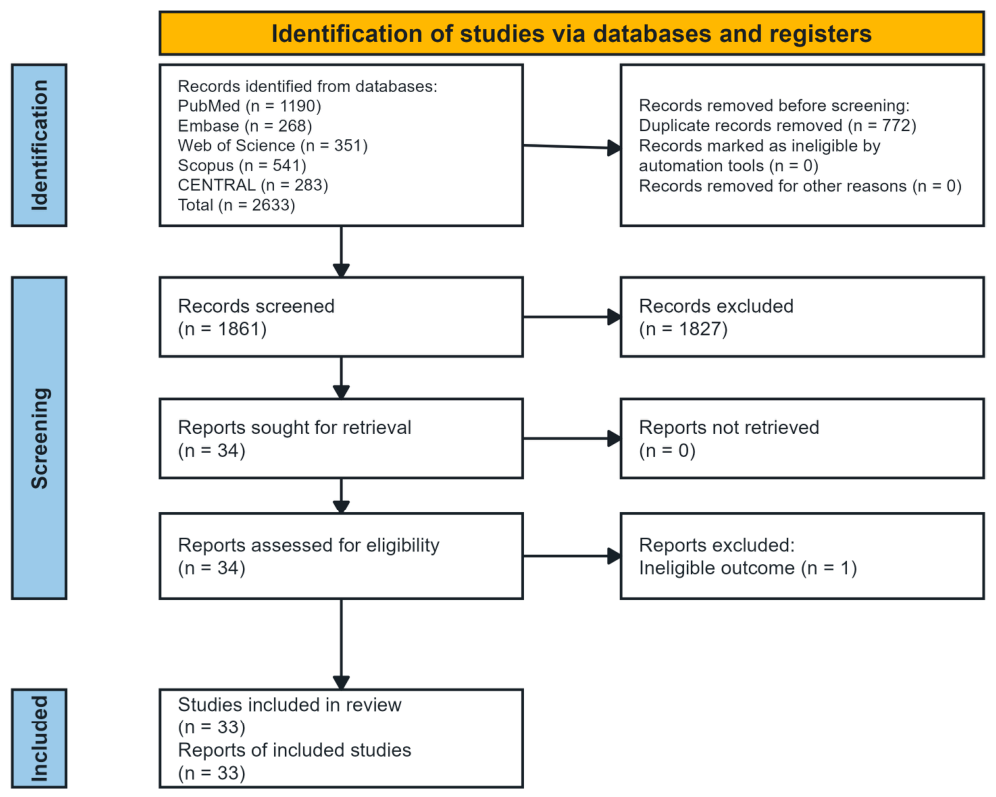
The database searches identified 2633 records, comprising 1190 records from PubMed, 268 from Embase, 541 from Scopus, 351 from Web of Science and 283 from CENTRAL. No records were removed by automation tools or for reasons other than duplication. After removal of 772 duplicate records, 1861 unique records underwent title and abstract screening, of which 1827 were excluded because they did not meet the prespecified eligibility criteria. In the post-hoc known-item audit, PubMed retrieved 32/33 final included reports, Embase 19/33, Web of Science 28/33, Scopus 29/33, and CENTRAL 31/33. The union of the five original exports retrieved all 33 final included reports (100%), although no single database was complete.
Thirty-four reports were sought for retrieval, all of which were successfully obtained and assessed in full text. One report, by Ramezani et al. [22], was excluded because it evaluated global neurological impairment and disability after acute ischaemic stroke but did not report a prespecified performance-based, physiological, or disease-specific motor outcome that directly measured muscle health or physical capacity. Consequently, 33 reports representing 33 eligible randomized studies were included in the systematic review. The complete study-selection process is presented in Figure 1.

3.2. Characteristics of Included Studies

The 33 randomized studies included were published between 1985 and 2026 and randomized a total of 3317 participants. Individual study sample sizes ranged from 12 to 609 randomized participants, although the number of participants available for eligible outcome analyses ranged from 7 to 609 because some crossover studies reported only complete-case data or separately extractable age-eligible subgroups. Twenty-three studies used parallel-group designs, including multi-arm and factorial trials from which an isolated CoQ10 comparison could be obtained, whereas 10 used randomized crossover designs. The studies were conducted across Europe, North America, Asia, and Australia and included both single-country and multinational trials.
The study populations were clinically heterogeneous. Six studies enrolled healthy or otherwise nonclinical participants, 10 enrolled participants with cardiovascular disease, four investigated statin-treated or statin-intolerant populations, seven enrolled participants with neurological or movement disorders, and six examined other clinical populations, including chronic kidney disease, maintenance haemodialysis, chronic obstructive pulmonary disease, mitochondrial cytopathy, Gulf War illness, and post-polio syndrome. Mean or median participant ages in the overall study samples generally ranged from approximately 40 to 75 years; one mixed-age crossover trial contributed only its separately reported subgroup aged 60–74 years.
CoQ10 was administered as conventional ubiquinone or CoQ10, ubiquinol, or an enhanced-bioavailability formulation, including phytosome, gel, nanoparticulate, and other solubilized preparations. Fixed daily doses ranged from 60 to 2400 mg/day, while one study used a weight-based dose of 5 mg/kg/day. Intervention periods ranged from 17 days to 60 months; in crossover trials, this range refers to the duration of each randomized treatment period. Most studies used a matched placebo comparator. Other eligible comparisons included no supplementation or an isolated no-CoQ10 factorial contrast. Several studies administered exercise training, statin treatment or standard disease-specific therapy equally to both randomized groups.
Eligible outcomes included aerobic capacity, walking capacity, exercise duration, maximum workload, strength, chair-rise performance, muscle quantity, and disease-specific clinician-rated motor function. Under the mutually exclusive A > B > C hierarchy, 19 studies were Class A, 10 Class B, and four Class C. Twelve Class A studies contributed to primary pooling, and seven were standalone only. Nine Class B studies contributed to sensitivity models, with Deichmann also providing a standalone result, and Moghadam was standalone only. Kuhlman was counted once in Class A despite additional Class C graph-only outcomes. Outcome-level routing remained authoritative (Table 1; Supplementary Tables S1–S3).

3.3. Risk of Bias

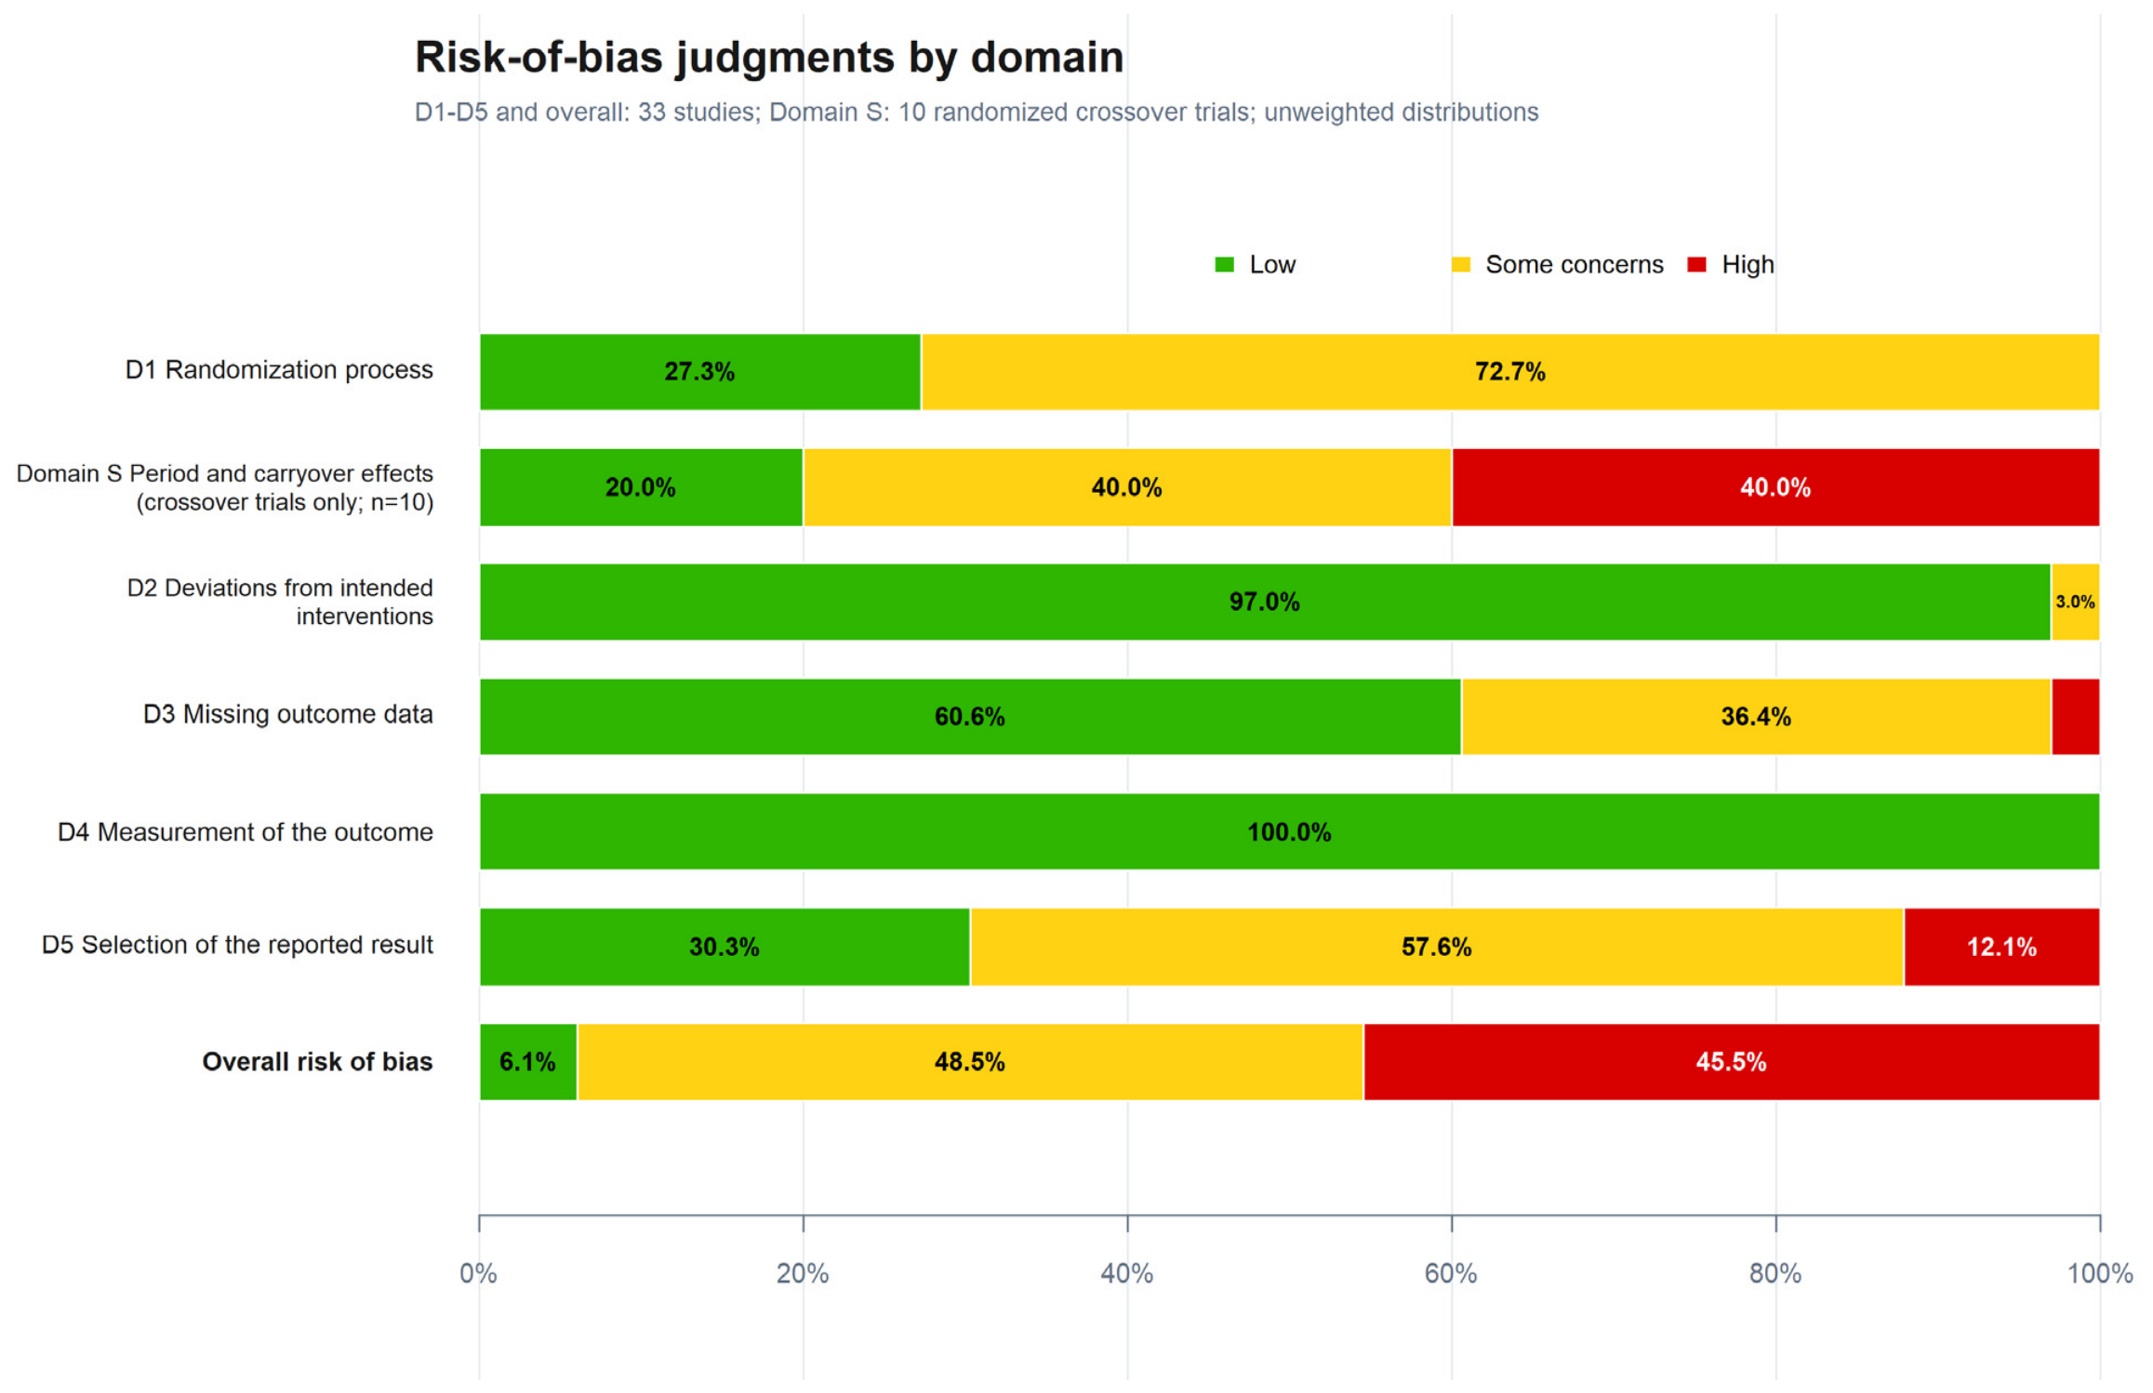
Risk-of-bias assessments were completed for all 33 included randomized trials using the design-appropriate RoB 2 tool. Overall, two trials (6.1%) were judged to be at low risk of bias, 16 (48.5%) raised some concerns, and 15 (45.5%) were judged to be at high risk of bias. The distribution of domain-level and overall judgments is presented in Figure 2.
For the randomization process, nine trials (27.3%) were low risk and 24 (72.7%) raised some concerns, mainly because sequence generation or allocation concealment was underreported. Dedicated Domain S was applied only to the 10 randomized crossover trials: two (20.0%) were low risk, four (40.0%) raised some concerns, and four (40.0%) were high risk. High Domain S judgments primarily reflected consecutive treatment periods without an adequate clearance interval and a plausible risk of residual CoQ10 or training effects. For deviations from intended interventions, 32 trials (97.0%) were low risk and one (3.0%) raised some concerns; no trial was high risk in Domain 2.
For missing outcome data, 20 trials (60.6%) were low risk, 12 (36.4%) raised some concerns, and one (3.0%) was high risk. All 33 trials were low risk for outcome measurement because outcomes were objectively measured or used standardized, validated performance, or motor-function assessments.
For selective reporting, 10 trials (30.3%) were low risk, 19 (57.6%) raised some concerns, and four (12.1%) were high risk. Concerns reflected unavailable prospective protocols, multiple eligible outcomes or time points, and occasionally inconsistent reporting. Overall high risk arose from a high-risk domain or accumulated concerns. Study-level judgments are provided in Supplementary Figure S8 and the completed RoB 2 audit workbooks.

3.4. Aerobic Capacity

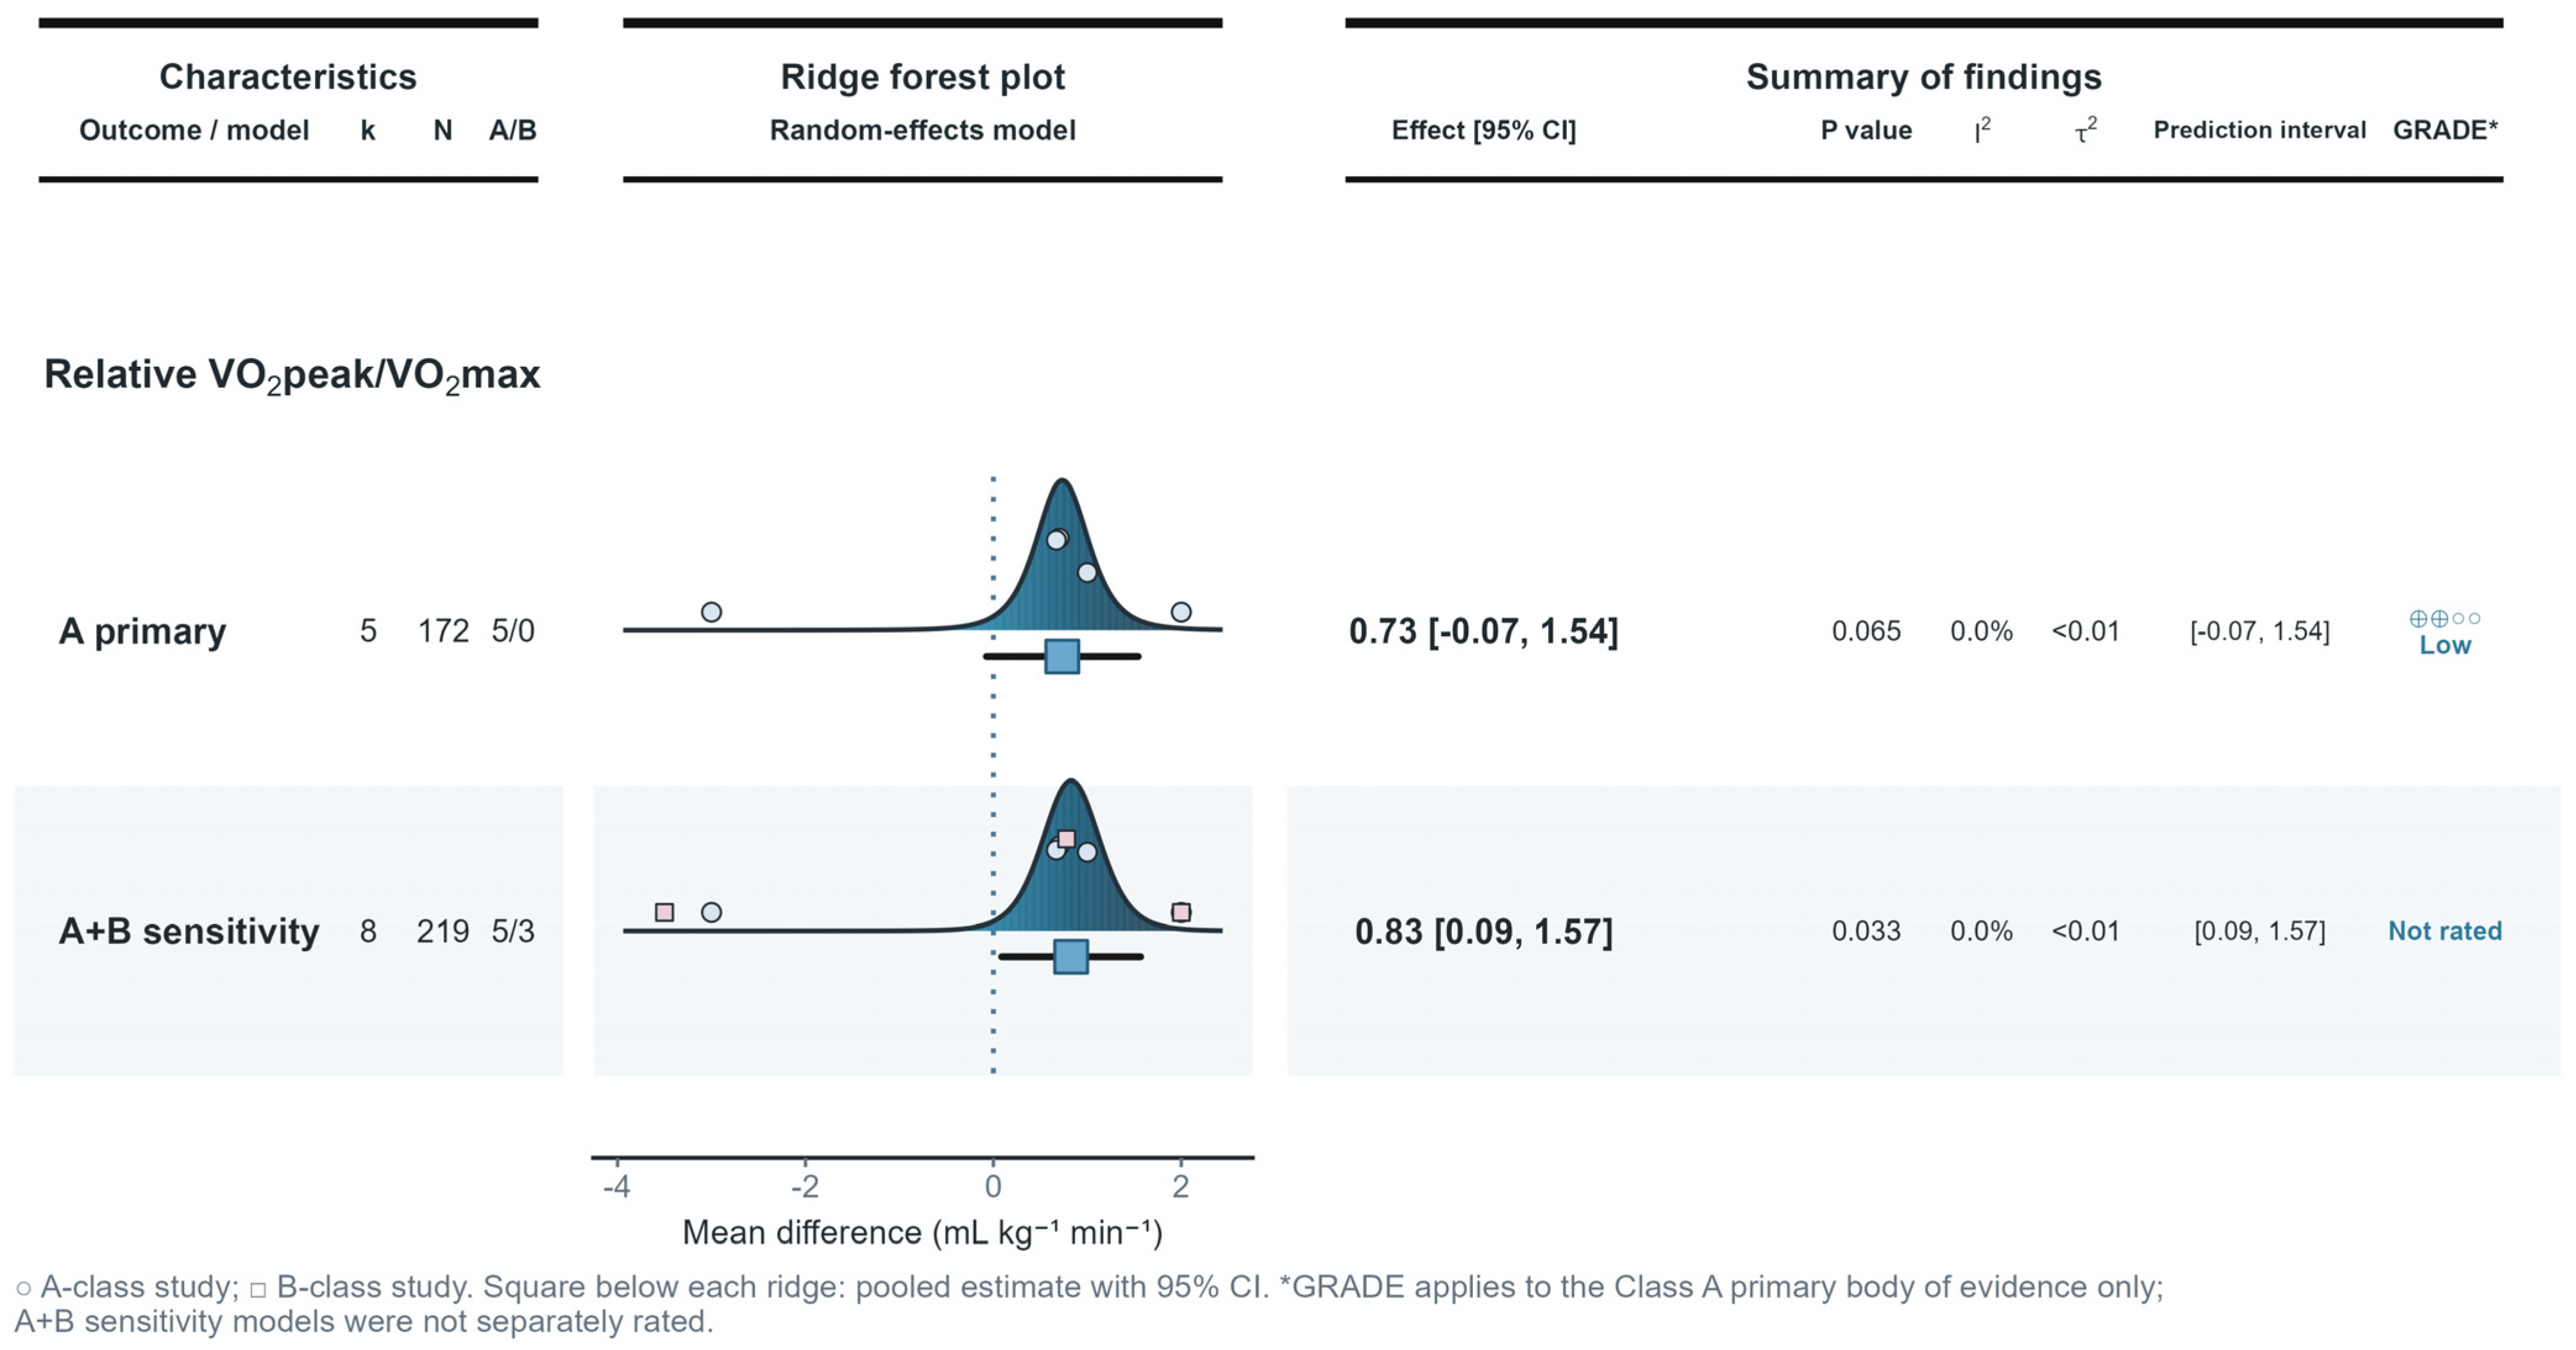
The Class A analysis included five studies and 172 participants. The pooled relative VO2peak/VO2max effect was MD 0.73 mL·kg−1·min−1 (95% CI −0.07 to 1.54; p = 0.065), with τ2 = 0, I2 = 0%, and a prediction interval of −0.07 to 1.54. The estimate was small and compatible with little or no effect.
Adding three Class B studies yielded eight studies and 219 participants. The A + B estimate was MD 0.83 mL·kg−1·min−1 (95% CI 0.09 to 1.57; p = 0.033), with τ2 < 0.01, I2 < 0.01%, and a prediction interval of 0.09 to 1.57. The 0.09-unit change supported directional stability (Figure 3; Supplementary Figure S3).
The Class A evidence was low certainty because of risk of bias and imprecision. The A + B model was not separately graded because it included assumption-dependent estimates; it supported robustness but did not replace the Class A conclusion (Table 2).
GRADE downgrading reasons: a, serious risk of bias; b, very serious risk of bias; c, serious inconsistency; d, serious imprecision; e, very serious imprecision. CI, confidence interval; MD, mean difference. Hedges’ g is expressed in standard-deviation units. No outcome met the prespecified criterion for serious indirectness. Contributing populations were within the broad prespecified target population and pooled outcomes were considered comparable at the construct level; however, clinical heterogeneity limits subgroup-specific applicability.

3.5. Physical Capacity

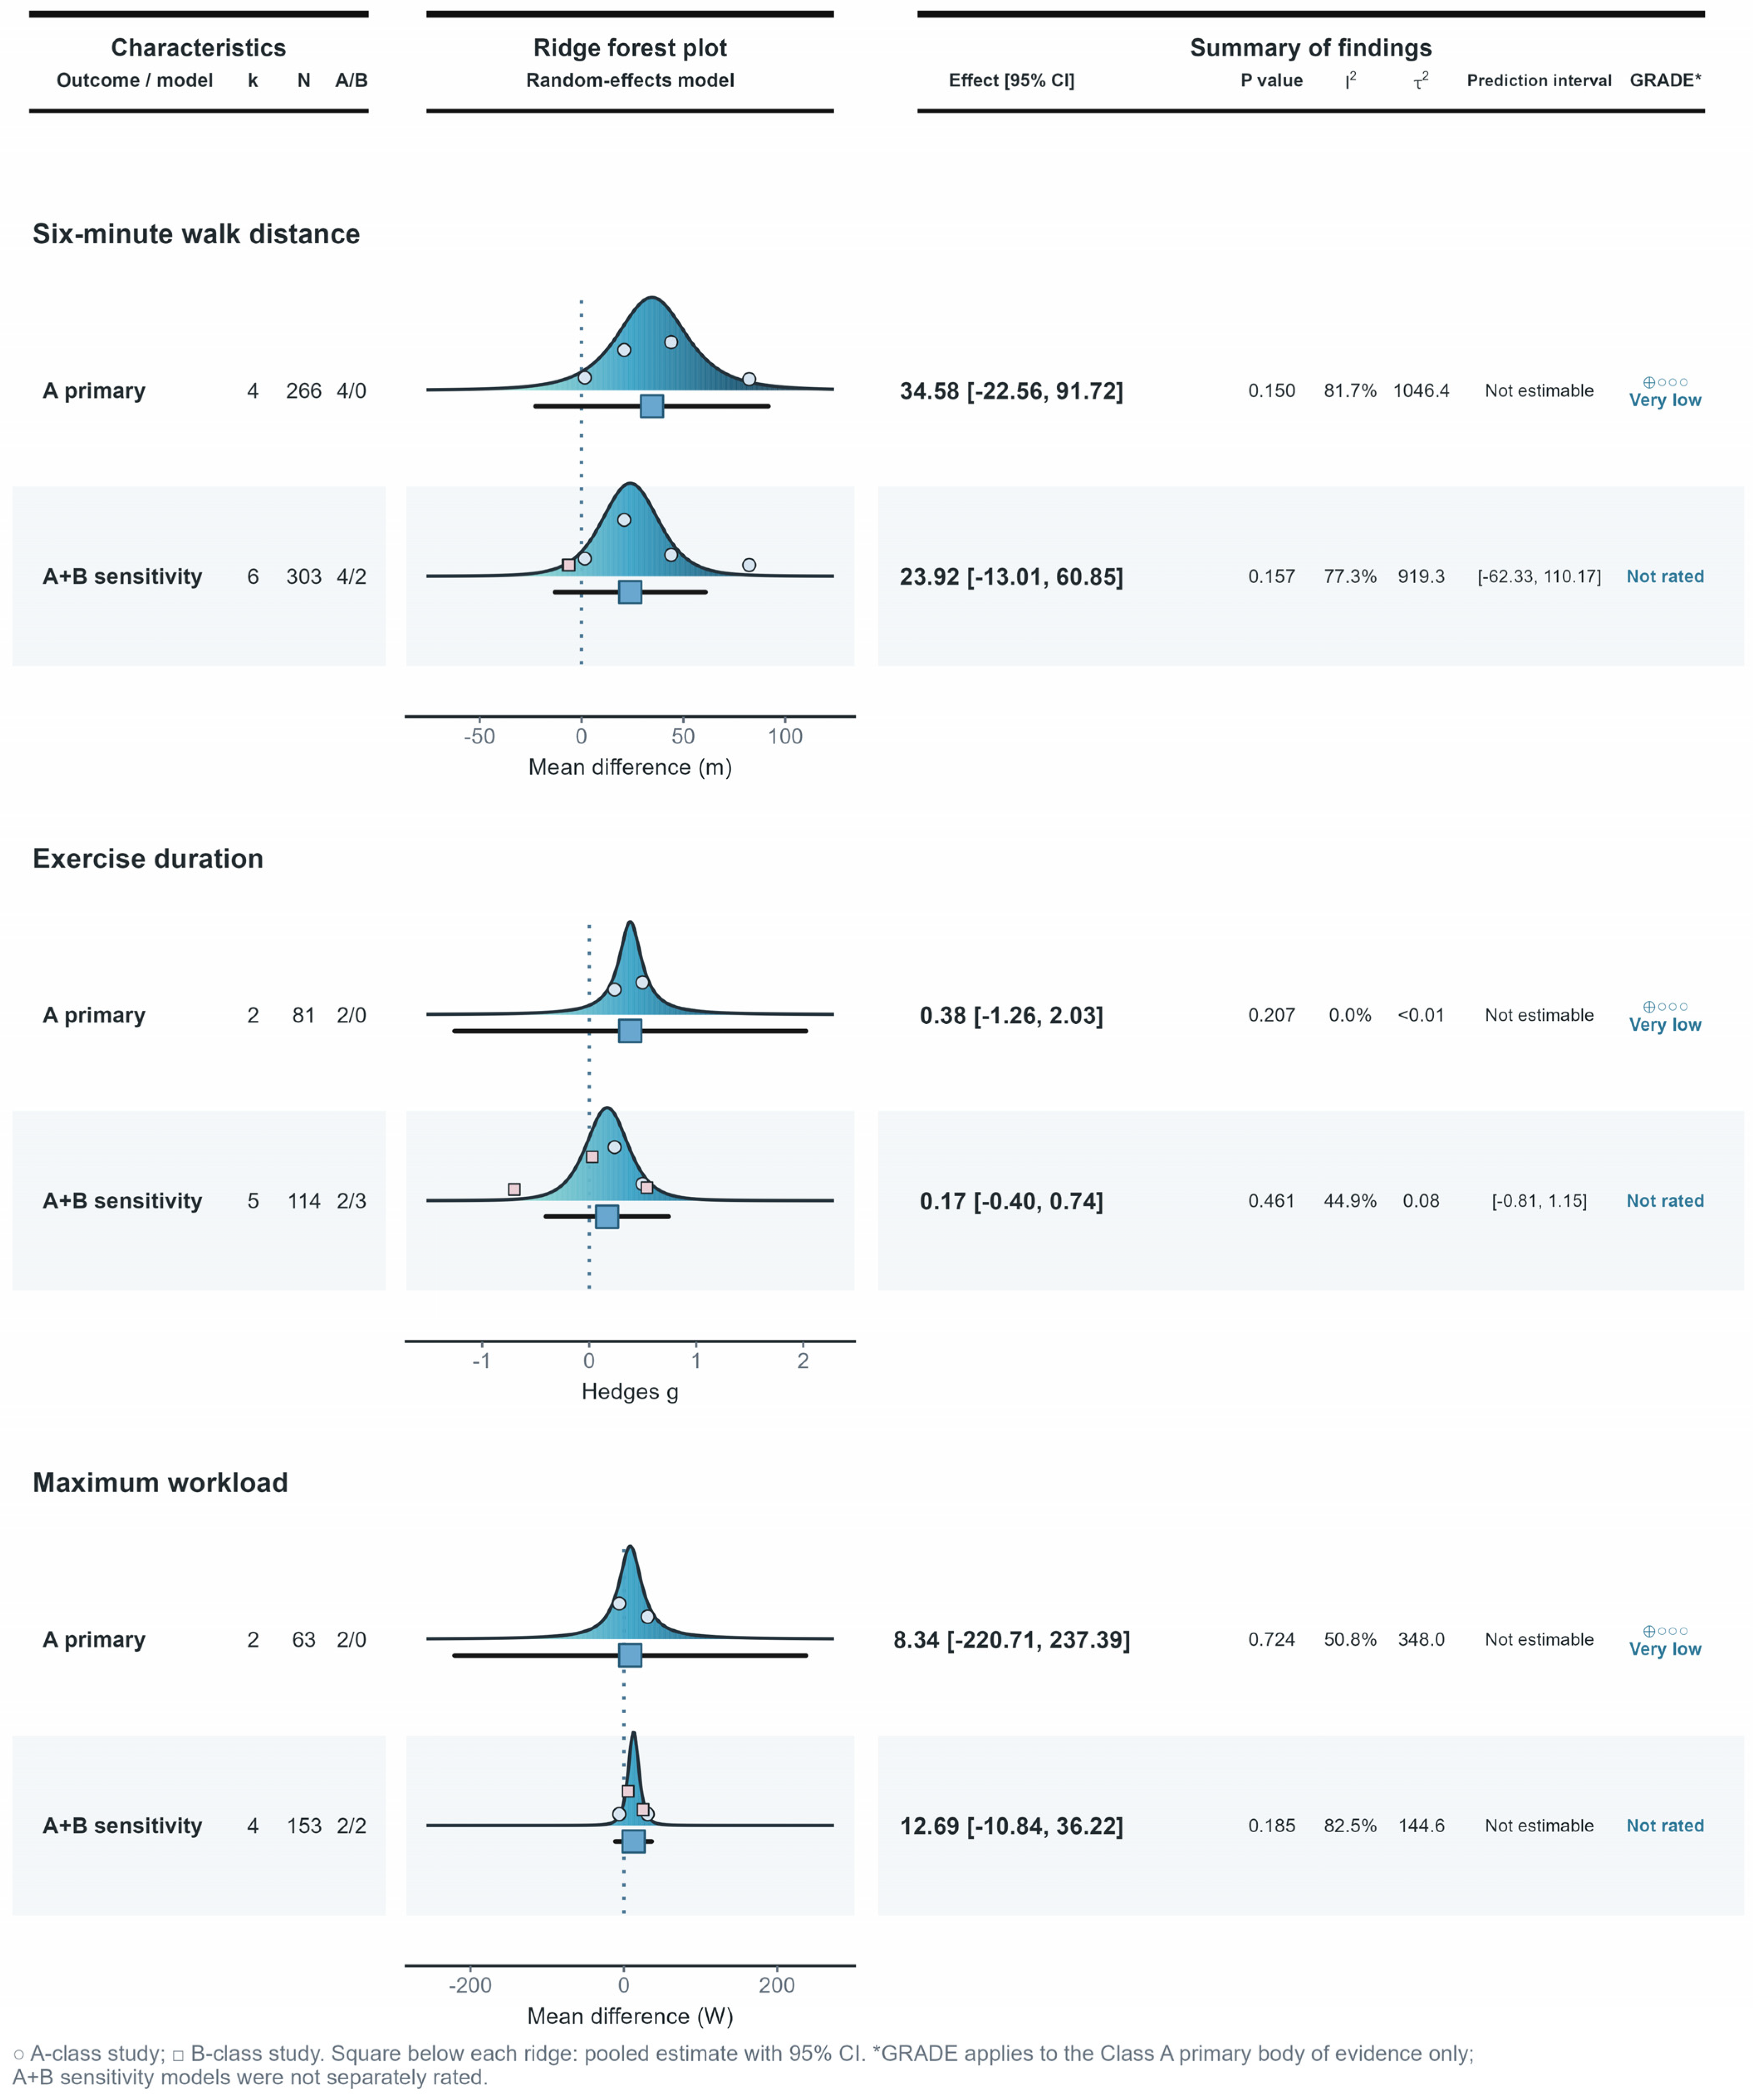
For 6-min walking distance, four Class A studies (266 participants) yielded MD 34.58 m (95% CI −22.56 to 91.72; p = 0.150; τ2 = 1046.40; I2 = 81.7%). Adding two Class B studies produced MD 23.92 m across six studies (303 participants; 95% CI −13.01 to 60.85; p = 0.157; τ2 = 919.33; I2 = 77.3%), with a prediction interval of −62.33 to 110.17 m. Direction remained positive, but certainty was very low and both models were highly uncertain.
For exercise duration, two Class A studies (81 participants) produced Hedges’ g = 0.38 (95% CI −1.26 to 2.03; p = 0.207; τ2 = 0; I2 = 0%). Adding three Class B studies gave g = 0.17 across five studies (114 participants; 95% CI −0.40 to 0.74; p = 0.461; τ2 = 0.08; I2 = 44.9%), with a prediction interval of −0.81 to 1.15. Correlation scenarios yielded g = 0.13–0.21, all with CIs crossing the null. Class A certainty was very low.
Maximum workload was assessed in two Class A studies (63 participants), yielding MD 8.34 W (95% CI −220.71 to 237.39; p = 0.724; τ2 = 347.95; I2 = 50.8%). Adding two Class B studies produced MD 12.69 W across four studies (153 participants; 95% CI −10.84 to 36.22; p = 0.185; τ2 = 144.58; I2 = 82.5%). Class A certainty was very low.
Adding Class B evidence did not reverse any physical-capacity estimate, but every CI included the null. Class A certainty was very low for 6-min walking distance, exercise duration, and maximum workload (Figure 4; Table 2).

3.6. Muscle Health

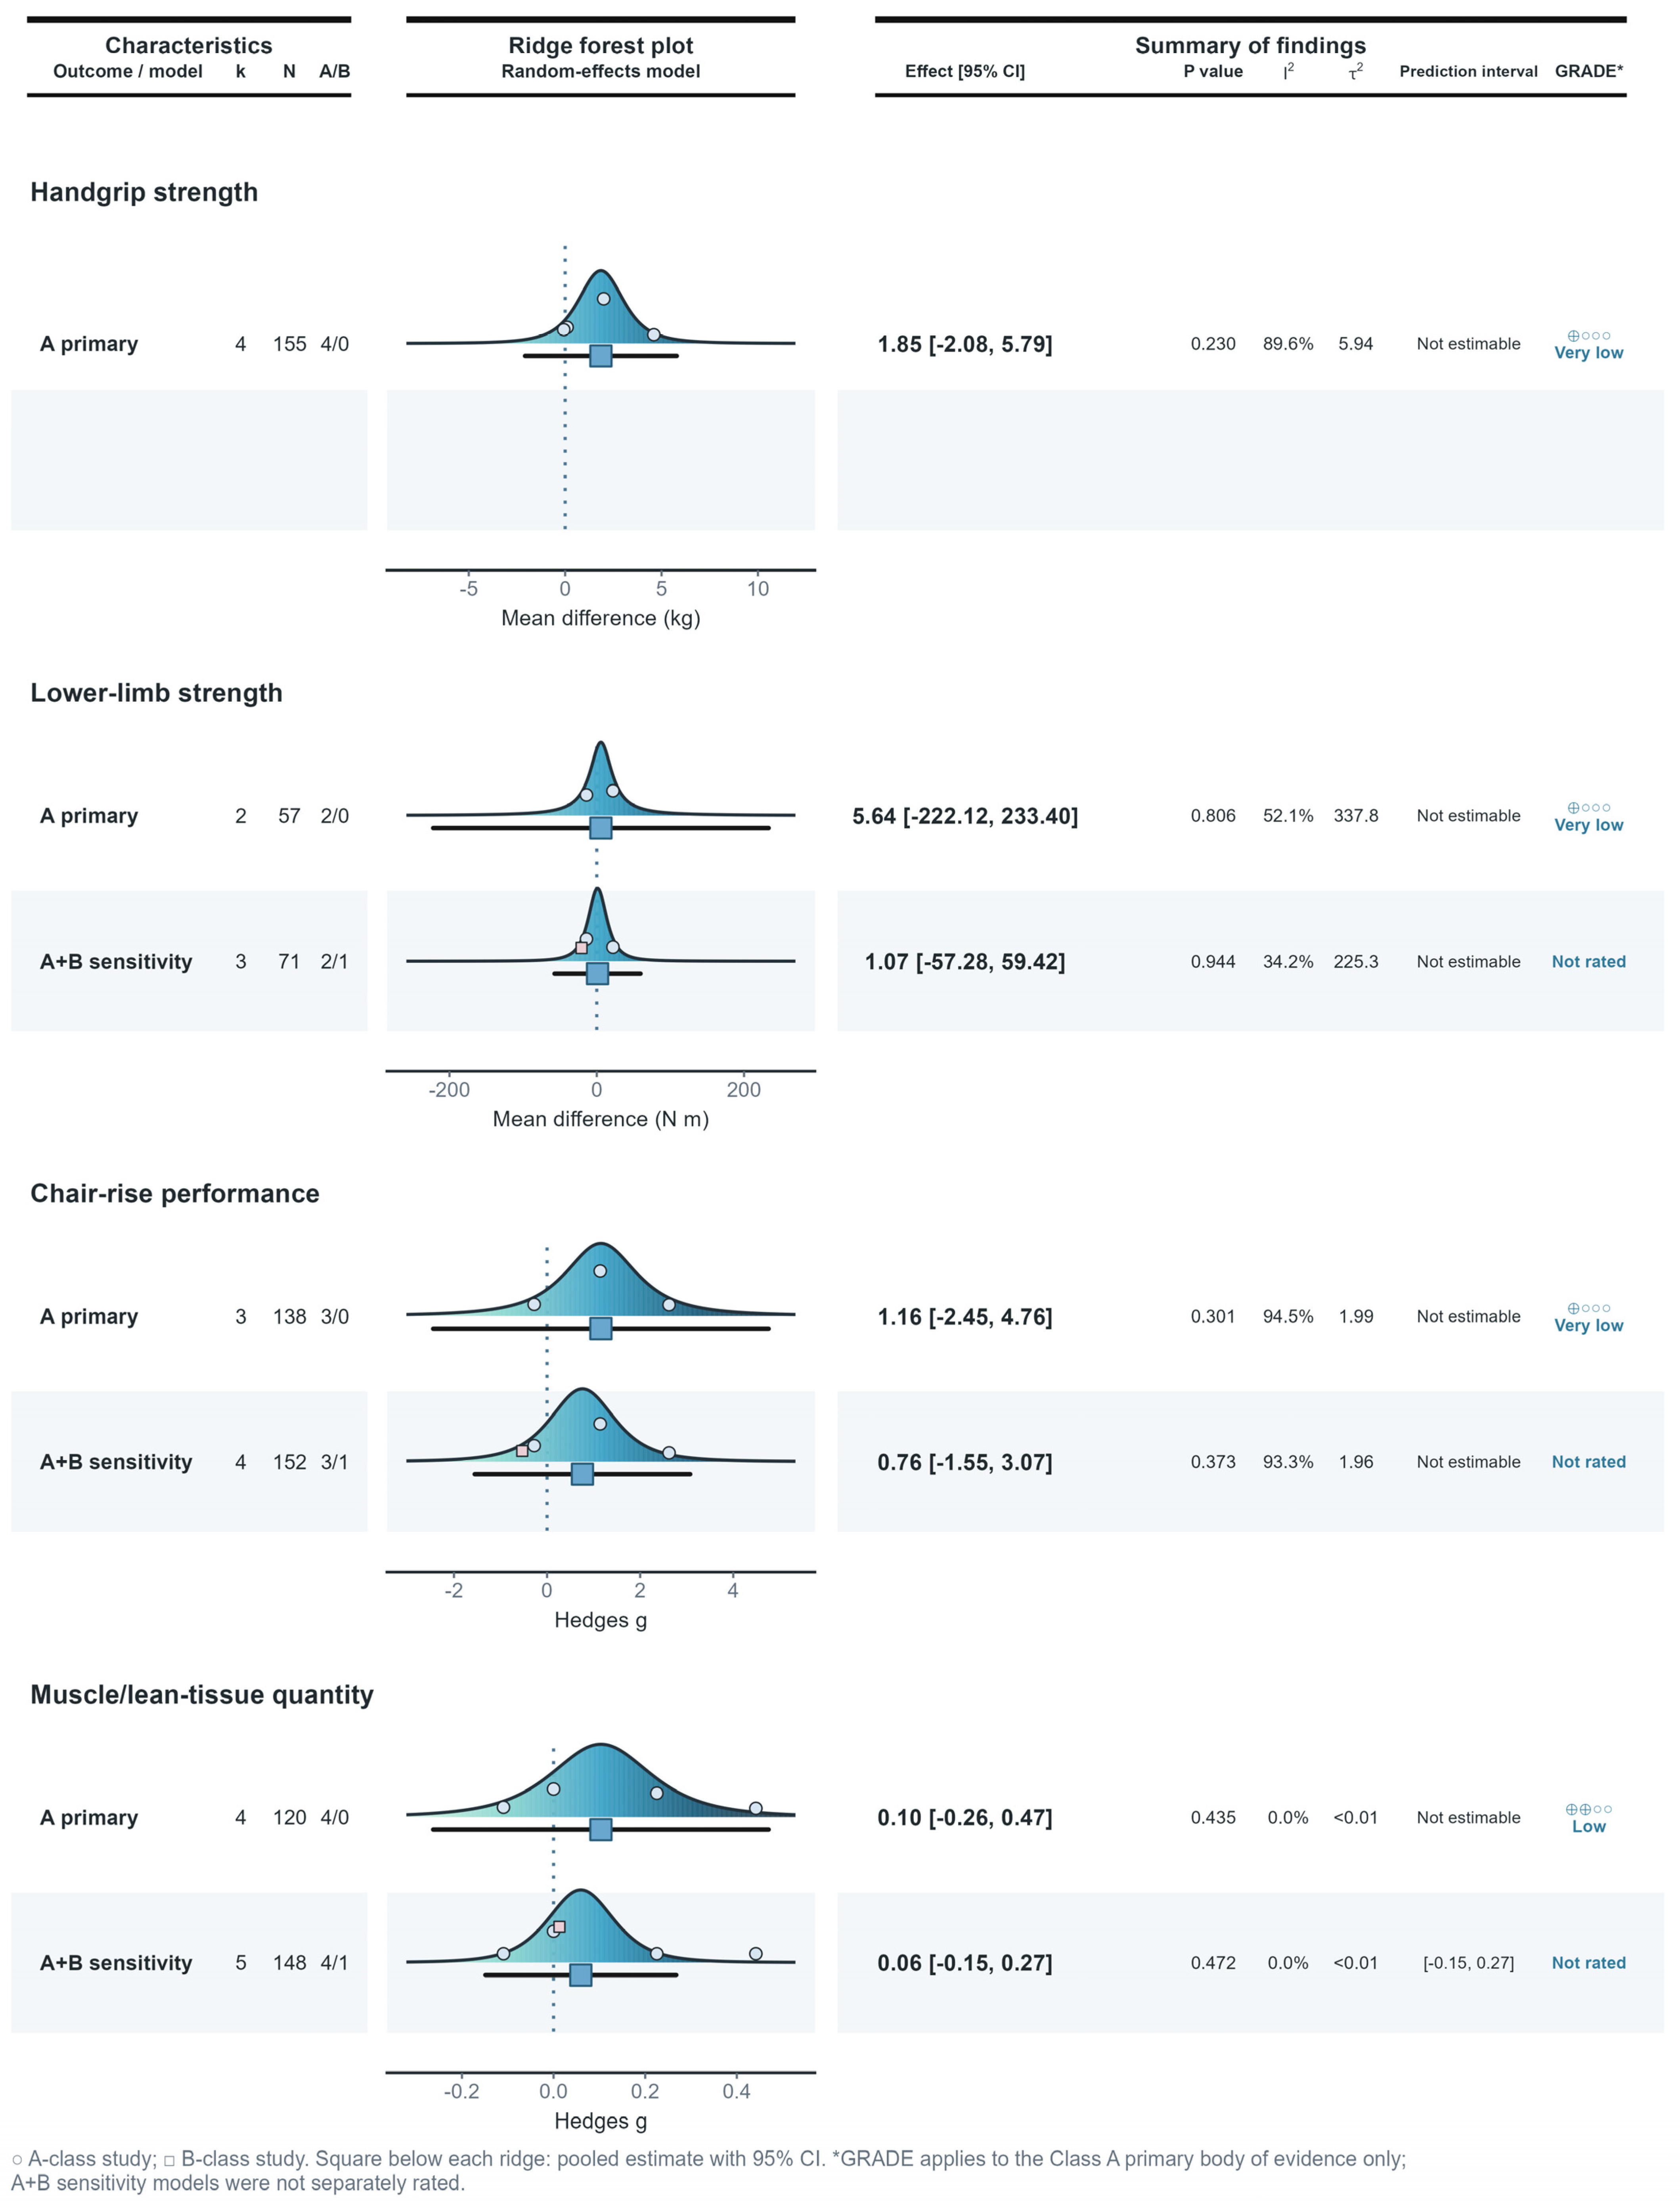
For handgrip strength, four Class A studies (155 participants) yielded MD 1.85 kg (95% CI −2.08 to 5.79; p = 0.230; τ2 = 5.94; I2 = 89.6%). No compatible Class B handgrip result was available; Glover 2010 measured forearm torque in N·m and remained standalone. Class A certainty was very low.
Lower-limb strength in two Class A studies (57 participants) yielded MD 5.64 N·m (95% CI −222.12 to 233.40; p = 0.806; τ2 = 337.83; I2 = 52.1%). Adding one Class B study produced MD 1.07 N·m across three studies (71 participants; 95% CI −57.28 to 59.42; p = 0.944; τ2 = 225.29; I2 = 34.2%). Class A certainty was very low.
Chair-rise performance was pooled as Hedges’ g, with positive values indicating better performance. Three Class A studies (138 participants) yielded g = 1.16 (95% CI −2.45 to 4.76; p = 0.301; τ2 = 1.99; I2 = 94.5%). Adding one Class B study produced g = 0.76 across four studies (152 participants; 95% CI −1.55 to 3.07; p = 0.373; τ2 = 1.96; I2 = 93.3%). Class A certainty was very low.
For muscle/lean-tissue quantity, four Class A studies (120 participants) yielded g = 0.10 (95% CI −0.26 to 0.47; p = 0.435; τ2 = 0; I2 = 0%). Adding one Class B crossover study produced g = 0.06 across five studies (148 participants; 95% CI −0.15 to 0.27; p = 0.472; I2 = 0%), with the same prediction interval. Correlation scenarios yielded g = 0.04–0.07. Class A certainty was low.
All four muscle-health estimates were directionally positive, but every CI included the null. Strength and chair-rise findings were especially uncertain; muscle quantity was consistent but imprecise. Distinct constructs and metrics were not combined into one overall effect (Figure 5; Table 2).

3.7. Disease-Specific, Standalone, and Narrative Synthesis

Eight trials reported extractable prespecified outcomes that were not represented in the principal pooled physical-performance or muscle-health models: seven used disease-specific clinician-rated motor or functional scales and one used a capped walking time-to-exhaustion test. These outcomes were reported separately because their disease context, scale meaning, follow-up, or measurement properties precluded clinically appropriate pooling across disorders or with the principal objective-performance models.
Parkinson-disease findings were mixed. Beal et al. [25] found little or no separation from placebo on UPDRS Part III. Müller et al. [46] likewise reported no significant between-group benefit in UPDRS Part III despite modest improvements in total UPDRS and colour-vision performance, whereas Yoritaka et al. [53] reported directionally favourable but imprecise differences at 48 and 96 weeks. In Huntington disease, both CARE-HD [37] and 2CARE [42] produced confidence intervals compatible with little or no benefit on UHDRS motor or Total Functional Capacity outcomes. Mitsui et al. [43] reported a modest benefit on UMSARS Part II in multiple system atrophy at 48 weeks (MD −1.70 points, 95% CI −3.20 to −0.20), while the 10 m walk-time estimate was imprecise. Stamelou et al. [51] reported directionally favourable 6-week changes in progressive supranuclear palsy, but only 20 participants provided follow-up data. These neurological findings were therefore retained as disease-specific standalone evidence.
In chronic obstructive pulmonary disease, Moghadam et al. [44] reported greater improvement in capped walking time to exhaustion with CoQ10. Median-to-mean conversion yielded an approximate between-group difference of 2.00 min (95% CI 1.68 to 2.32), but the 6-min ceiling and distributional conversion made the estimate assumption-dependent and non-exchangeable with open-ended exercise-duration tests; it was therefore retained as B-standalone evidence.
Four additional randomized trials remained narrative only because no defensible effect estimate and variance could be reconstructed. Berman et al. and Mortensen et al. reported 6-min walking outcomes in heart failure without sufficient compatible variance or follow-up data; Golomb et al. reported a ceiling-limited lower-extremity composite that was not exchangeable with continuous performance outcomes; and Permanetter et al. reported maximum workload from a crossover trial with unresolved washout, sequence, and variance limitations. Their narrative disposition and reasons for non-pooling are summarized in Table 3.

3.8. Sensitivity and Influence Analyses

Adding compatible Class B evidence did not reverse any pooled effect direction. Relative VO2peak/VO2max changed from MD 0.73 to 0.83 mL·kg−1·min−1, with negligible heterogeneity. Other A + B estimates were directionally consistent with Class A estimates, but their CIs included the null. Handgrip had no compatible Class B result. Complete comparisons are in Supplementary Table S4.
For relative VO2peak/VO2max, r = 0.25 and 0.75 produced MDs of 0.80 (95% CI 0.11 to 1.50) and 0.88 mL·kg−1·min−1 (95% CI 0.07 to 1.69). Excluding the no-washout study yielded 0.67 (95% CI −0.08 to 1.42). Omitting Deichmann 2012 or Laaksonen 1995 yielded 0.84 (95% CI −0.07 to 1.74) and 0.89 (95% CI 0.25 to 1.53), respectively. Direction remained positive, but precision varied.
Leave-one-out VO2 estimates remained positive, although several A + B CIs crossed the null. Removing Bodea 2025 reduced 6-min walking I2 from 81.7% to 5.3% for Class A and from 77.3% to 21.4% for A + B. Thus, potentially influential high-risk studies were identified transparently through study-level influence analyses rather than through a separate exclusion model that would have left several outcome-specific evidence bases too sparse for stable inference. Removing Belardinelli 2006 reduced maximum-workload I2 from 82.5% to approximately 0%. Handgrip was sensitive to Fogacci 2024, whereas exercise duration, lower-limb strength, and chair rise remained imprecise. Muscle-quantity estimates were stable with I2 = 0%. Complete results are in Supplementary Table S4 and Figures S6 and S7.
No efficacy subgroup analysis was conducted because the five-study Class A model did not meet the six-study threshold. Age subgroup and meta-regression analyses were also not performed because feasibility and comparability criteria were unmet.

3.9. Certainty of Evidence

No Class A primary body of evidence was of high or moderate certainty. Certainty was low for relative VO2peak/VO2max and muscle/lean-tissue quantity, and very low for 6-min walking distances, exercise duration, handgrip strength, lower-limb strength, and chair-rise performance (Table 2). A + B models were not separately graded.
All seven outcomes were downgraded for risk of bias and imprecision. Risk of bias was very serious for walking distance and exercise duration, and serious otherwise. Imprecision was very serious for exercise duration and lower-limb strength. Walking distance, handgrip, lower-limb strength, and chair rise were also downgraded for inconsistency. No Class A outcome was downgraded for serious indirectness. The review question deliberately encompassed adult populations with a study-level mean or median age of ≥40 years across both nonclinical and clinical settings, and quantitative synthesis was restricted to outcomes judged to represent sufficiently comparable constructs. Accordingly, variation in underlying diagnosis was considered clinical heterogeneity within the prespecified target population rather than indirectness by itself. Disease-specific motor outcomes were not pooled across neurological disorders.
No Class A body of evidence was downgraded for publication bias. Across the primary outcomes, the qualitative ROB-ME-informed assessment did not identify a consistent pattern of known missing eligible results, protocol or registry discrepancies, or selective non-reporting that was judged likely to materially distort the pooled effect estimates. Eligible but non-quantifiable results were retained in the review and reported narratively rather than being excluded from consideration. Because no meta-analysis contained at least 10 comparable studies, formal funnel-plot or regression-based asymmetry analyses were not performed. Accordingly, the absence of a GRADE downgrade should not be interpreted as evidence that publication or selective-reporting bias was absent. A + B models preserved direction but did not change formal GRADE ratings. Maximum workload was supportive, very-low-certainty evidence and was excluded from the principal Summary of Findings table.

4. Discussion

4.1. Principal Findings

This systematic review of 33 randomized studies involving 3317 participants did not establish a clinically meaningful benefit of CoQ10 supplementation for muscle health or physical capacity. Relative VO2peak/VO2max was the pooled outcome with the least detected statistical heterogeneity, but it should not be interpreted as convincing evidence of benefit. The Class A estimate was small (0.73 mL·kg−1·min−1), based on only five studies, and imprecise, with a confidence interval that included no effect; the evidence was of low certainty. With so few studies, I2 = 0% does not demonstrate that the underlying effects are homogeneous. This result should therefore be interpreted as an imprecise directional estimate rather than evidence of a consistent or clinically meaningful benefit.
Effects on walking distance, exercise duration, maximum workload, handgrip strength, lower-limb strength, chair-rise performance, and muscle/lean-tissue quantity also remained uncertain, but the reasons differed across domains. For 6-min walking distances, handgrip strength, and chair-rise performance, wide confidence intervals, substantial heterogeneity, and risk-of-bias concerns limited interpretation. Exercise duration, maximum workload, and lower-limb strength were supported by particularly sparse evidence and could not distinguish benefit, no effect, or harm with adequate precision. Muscle/lean-tissue quantity had a point estimate close to the null and little detected heterogeneity, making little or no average effect more plausible than for the other domains, although the small evidence base, imprecision, and low certainty still precluded a definitive conclusion.
Separating directly supported Class A evidence from statistically recovered Class B evidence affected interpretation at the domain level. For relative VO2peak/VO2max, adding Class B estimates moved the confidence interval marginally above the null, but the expanded model remained assumption-dependent and did not replace the low-certainty Class A conclusion. For walking distance, exercise duration, lower-limb strength, chair-rise performance, and muscle/lean-tissue quantity, A + B models did not materially change the overall interpretation; no compatible Class B handgrip estimate was available. The pooled values are averages across clinically diverse populations and should not be extrapolated as uniform effects in trained adults, frail older people with sarcopenia, or patients with heart failure, chronic kidney disease, statin-associated symptoms, or neurological disorders.

4.2. Interpretation and Potential Mechanisms

The directionally favourable but inconclusive aerobic-capacity estimate is biologically plausible because CoQ functions as an electron carrier in the mitochondrial respiratory chain and contributes to cellular redox regulation and membrane antioxidant defence [5,54]. A recent meta-analysis of randomized trials reported an improvement in flow-mediated dilation following CoQ10 supplementation, suggesting a possible vascular contribution to peripheral oxygen delivery [55]. However, such vascular or biochemical effects do not establish a corresponding improvement in skeletal-muscle function or exercise performance, and mechanistic plausibility should not be equated with demonstrated tissue-level action. In robust older adults, 12 weeks of supplementation markedly increased plasma CoQ10 without increasing skeletal-muscle or mitochondrial CoQ10, improving mitochondrial respiration, or changing VO2max [49]. This biochemical-to-functional translation gap may explain why circulating responsiveness can coexist with small or absent performance effects.
The pattern of an inconclusive aerobic-capacity estimate without convincing gains in muscle quantity or strength could reflect systemic cardiovascular or endothelial effects rather than skeletal-muscle hypertrophy, although the included trials did not permit formal mediation analysis. Population context may also influence responsiveness. A randomized crossover trial in chronic kidney disease found no improvement in physical endurance following CoQ10 supplementation [23], whereas a trial in older adults with statin-associated asthenia reported improvements in several performance tests [31]. These contrasting observations raise, but do not prove, the hypothesis that baseline CoQ10 status, disease-related energetic limitation, formulation, treatment duration, tissue bioavailability, and concomitant exercise modify the functional response to supplementation.

4.3. Relation to Previous Evidence

The present findings help to resolve, rather than eliminate, earlier disagreement. A 2003 systematic review identified modest improvements in exercise capacity in six studies but no effect in five others [56]. More recently, Deng et al. concluded that CoQ10 reliably raises circulating concentrations but produces, at most, modest and context-dependent improvements in exercise performance among healthy adults, with low-to-very-low certainty [8]. Talebi et al. reported reductions in biomarkers of exercise-induced muscle damage and oxidative stress [7]; however, biomarker improvement does not necessarily translate into better strength, mobility, or aerobic capacity.
In heart failure, a Cochrane review found that the evidence for exercise-capacity improvement was inconclusive and downgraded the outcome primarily because of risk of bias and imprecision [57], closely paralleling the uncertainty observed in the present analysis of 6-min walking distance. Evidence concerning statin-associated muscle symptoms is similarly conflicting: one meta-analysis reported improvements in pain, weakness, cramps, and fatigue [58], whereas another found no benefit for myalgia or adherence to statin therapy [59]. Importantly, subjective muscle symptoms are not interchangeable with objectively measured strength, muscle quantity, or physical performance.
The present review extends previous syntheses by focusing on adult populations with a study-level mean or median age ≥ 40 years, separating clinically distinct outcome domains and distinguishing directly usable results from estimates requiring paired-correlation or distributional assumptions. Compatible recovered estimates were used only in A + B sensitivity models, while non-exchangeable A or B results were reported separately and unverified graph-only results received no quantitative weight. This framework shows that a favourable direction can remain stable under reasonable recovery assumptions without becoming high-certainty evidence. Separating robustness from certainty is therefore a central methodological and interpretive contribution of the review.

4.4. Clinical and Research Implications

The pooled aerobic-capacity effect should be interpreted cautiously. In a randomized trial involving patients with heart failure with preserved ejection fraction, 2.5 mL·kg−1·min−1 was prespecified as the minimum clinically important difference for peak oxygen uptake [60], which is larger than the point estimate observed in the present review. However, this threshold cannot be generalized across all populations included here. Published estimates of clinically meaningful change in the 6-min walking distance also vary according to the clinical population, outcome anchor, and follow-up interval. An earlier systematic review in chronic heart failure proposed a change of approximately 45 m [61], whereas a more recent anchor-based analysis in patients with heart failure with reduced ejection fraction and iron deficiency estimated approximately 14–15 m for a small but clinically meaningful improvement [62]. The Class A estimate of 34.58 m therefore lies within the range of published heart-failure-specific thresholds. Nevertheless, its wide confidence interval encompassed possible worsening, little or no effect, and larger benefits, and neither threshold can be directly extrapolated to healthy trained adults, community-dwelling older adults, or patients with neurological disorders. The 6-min walking finding should therefore be regarded as clinically uncertain rather than definitively meaningful or non-meaningful. The clinically important threshold may differ between healthy trained participants, who have higher baseline fitness and different performance variability, and clinical cohorts, in whom baseline impairment, prognosis, and therapeutic goals differ; 2.5 mL·kg−1·min−1 should therefore be treated as a contextual benchmark rather than a universal cutoff.
The current evidence therefore does not support routine CoQ10 supplementation solely to improve physical capacity or muscle health. Future trials should be adequately powered, prospectively registered, and stratified according to clinical population and baseline CoQ10 status. They should use formulations with documented bioavailability; measure plasma and, where feasible, skeletal-muscle exposure; and prespecify standardized VO2peak/VO2max, 6-min walking distance, strength, chair-rise, and muscle-quantity outcomes. Exact group estimates, change-score variances, and within-participant correlations should be reported to prevent otherwise eligible crossover and repeated-measures data from becoming assumption-dependent. Factorial trials combining CoQ10 with exercise should also be designed to estimate whether supplementation provides an incremental benefit beyond exercise alone.

4.5. Strengths and Limitations

This review combined a reproducible five-database search with outcome-level evidence routing, structured RoB 2 assessments and a ROB-ME-informed appraisal, Hartung–Knapp random-effects models, leave-one-out analyses, and outcome-specific GRADE ratings. Separating directly supported Class A evidence from Class B estimates is an important methodological strength because it preserves potentially informative data without allowing unverifiable assumptions to determine the primary conclusion.
Several limitations remain. Outcome-specific meta-analyses contained few studies, preventing reliable meta-regression, subgroup analysis, dose-response modelling, and formal assessment of small-study effects. Accordingly, the ROB-ME-informed assessment was qualitative, and residual publication or selective-reporting bias cannot be excluded. This was a deliberately conservative choice because funnel plots and regression-based asymmetry tests can be unstable and misleading when based on fewer than 10 comparable studies. Search strategies were database-specific, and known-item recovery was lower for searches that used additional precision blocks, particularly Embase. Nevertheless, the union of the five original exports recovered all 33 final included reports, and the permissive dual-review screening rule advanced any uncertain or potentially eligible record to full-text assessment. This post-hoc audit strengthens confidence that the executed search set captured the known eligible evidence, but its benchmark was derived from the completed review and therefore could not identify eligible reports absent from both the benchmark and the database results. Residual retrieval bias from incomplete indexing, uninformative titles or abstracts, or non-indexed studies consequently cannot be excluded. Populations, formulations, doses, durations, co-interventions, and measurement protocols varied substantially. Although pooling was restricted to outcomes judged to represent sufficiently comparable clinical constructs, residual clinical heterogeneity remains because the same performance measure may reflect different physiological limitations across healthy, cardiovascular, metabolic, renal, and neuromuscular populations. Random-effects modelling addresses statistical heterogeneity but cannot eliminate these differences in clinical context. The relative VO2peak/VO2max signal was also disproportionately informed by studies of physically trained or athletic participants. Their baseline fitness, training adaptations, and physiological reserve differ from those of frail older adults with sarcopenia, who were not specifically represented as a target population. Accordingly, this aerobic-capacity signal should not be extrapolated directly to older sarcopenic populations. Therefore, pooled estimates should be interpreted as average effects for a shared outcome construct across the prespecified population rather than as evidence of an identical treatment effect across diagnostic groups. These differences did not warrant a GRADE downgrade for indirectness because they occurred within the prespecified broad target population and the pooled outcomes represented comparable constructs; nevertheless, they restrict the extent to which the average pooled effects can be assumed to apply uniformly to any specific clinical subgroup. Risk-of-bias concerns were frequent. The dedicated randomized-crossover RoB 2 variant was applied to all 10 crossover trials; however, older reports often incompletely described sequence allocation, period adjustment, or the rationale for washout duration. Four crossover trials were consequently judged to be at high risk in Domain S because an adequate clearance interval could not be established, and four raised some concerns. Use of the design-specific tool therefore improved characterization of period and carryover bias but could not remove uncertainty created by incomplete reporting. Confidence intervals were generally wide, and some A + B estimates required correlation or distributional assumptions. Unverified graph-only outcomes were not quantified, and incomplete reporting confined several eligible trials to narrative synthesis. Finally, the age criterion was based primarily on the study-level mean or median age rather than an individual-level minimum age. Some eligible studies therefore included participants younger than 40 years, and the available evidence did not permit reliable assessment of whether effects differed across middle-aged, older, and very old populations. Collectively, these limitations make the observed aerobic-capacity signal hypothesis-supporting rather than practice-changing.

5. Conclusions

Current randomized evidence does not establish that CoQ10 supplementation improves relative VO2peak/VO2max, walking capacity, exercise performance, muscle strength, chair-rise performance, or muscle/lean-tissue quantity in adult populations meeting the study-level mean or median age criterion of ≥40 years. The relative VO2peak/VO2max estimate was directionally favourable but small, imprecise, compatible with no benefit, and supported by low-certainty evidence; it should not be interpreted as a clinically meaningful effect. Disease-specific clinician-rated motor and functional outcomes were mixed and should not be interpreted as one transferable neurological effect. Adding assumption-dependent evidence generally preserved effect directions but did not increase the certainty of the primary evidence. Current evidence therefore does not support routine CoQ10 supplementation solely to improve muscle health or physical capacity. Future trials should be adequately powered and preregistered, use standardized performance-based, physiological, and clinician-rated motor-function outcomes, and report complete variance data. Randomized crossover trials should use a washout of at least 4 weeks when biologically appropriate, justify any alternative interval for the selected dose and formulation, and report paired analyses and within-participant correlations.

Supplementary Materials

The following supporting information can be downloaded at: https://www.mdpi.com/article/10.3390/antiox15101219/s1.

Author Contributions

X.L.: Data curation, Software, Formal analysis, Investigation, Visualization, Methodology, Writing—original draft. J.B.: Validation, Investigation, Visualization, Writing—original draft, Writing—review and editing. Z.Y.: Validation, Writing—review and editing. W.Z.: Validation, Writing—review and editing. Y.H.: Validation, Writing—review and editing. Y.Z.: Validation, Writing—review and editing. X.J.: Conceptualization, Formal analysis, Supervision, Validation, Methodology, Writing—review and editing, Project administration. All authors have read and agreed to the published version of the manuscript.

Funding

This research was funded by the Fundamental Research Funds for the Central Universities, grant numbers 2026KYPT05 and 2026KYPT06.

Institutional Review Board Statement

Ethics approval and informed consent were not required because this systematic review and meta-analysis used only previously published aggregate data and involved no direct contact with human participants or access to identifiable individual-level information.

Informed Consent Statement

Not applicable. This systematic review and meta-analysis used only previously published aggregate data and involved no direct contact with human participants.

Data Availability Statement

All study-level and outcome-level data supporting the findings of this review are included in the article and its Supplementary Information. Extracted study characteristics, core quantitative data, assumption-dependent data and sensitivity-analysis results are reported in Supplementary Tables S1–S4, and the associated study-level, influence and risk-of-bias graphics are provided in Supplementary Figures S1–S8. No individual participant data were obtained; the source trial reports are cited in the reference list. The R scripts used for data processing, statistical synthesis, sensitivity and influence analyses, and figure generation are available from the corresponding author upon reasonable request.

Acknowledgments

During preparation of this work, the authors used OpenAI Codex (OpenAI) for language refinement, formatting assistance, R-code drafting, and graphical workflow support. No artificial intelligence system made decisions about study eligibility, data extraction, risk-of-bias judgments, certainty-of-evidence ratings, or interpretation of the findings. The authors independently reviewed the source publications, verified all extracted data, and code and analytical outputs and take full responsibility for the accuracy and integrity of the work.

Conflicts of Interest

The authors declare no conflicts of interest.

References

  1. Cruz-Jentoft, A.J.; Bahat, G.; Bauer, J.; Boirie, Y.; Bruyère, O.; Cederholm, T.; Cooper, C.; Landi, F.; Rolland, Y.; Sayer, A.A.; et al. Sarcopenia: Revised European Consensus on Definition and Diagnosis. Age Ageing 2019, 48, 16–31, Correction in Age Ageing 2019, 48, 601. https://doi.org/10.1093/ageing/afz046. [Google Scholar] [CrossRef] [Scilit] [PubMed]
  2. Goodpaster, B.H.; Park, S.W.; Harris, T.B.; Kritchevsky, S.B.; Nevitt, M.; Schwartz, A.V.; Simonsick, E.M.; Tylavsky, F.A.; Visser, M.; Newman, A.B. The Loss of Skeletal Muscle Strength, Mass, and Quality in Older Adults: The Health, Aging and Body Composition Study. J. Gerontol. A Biol. Sci. Med. Sci. 2006, 61, 1059–1064. [Google Scholar] [CrossRef] [Scilit] [PubMed]
  3. Fleg, J.L.; Morrell, C.H.; Bos, A.G.; Brant, L.J.; Talbot, L.A.; Wright, J.G.; Lakatta, E.G. Accelerated Longitudinal Decline of Aerobic Capacity in Healthy Older Adults. Circulation 2005, 112, 674–682. [Google Scholar] [CrossRef] [Scilit] [PubMed]
  4. Broome, S.C.; Whitfield, J.; Karagounis, L.G.; Hawley, J.A. Mitochondria as Nutritional Targets to Maintain Muscle Health and Physical Function during Ageing. Sports Med. 2024, 54, 2291–2309. [Google Scholar] [CrossRef] [Scilit] [PubMed]
  5. Wang, Y.; Lilienfeldt, N.; Hekimi, S. Understanding Coenzyme Q. Physiol. Rev. 2024, 104, 1533–1610. [Google Scholar] [CrossRef] [Scilit] [PubMed]
  6. Hernández-Camacho, J.D.; Bernier, M.; López-Lluch, G.; Navas, P. Coenzyme Q10 Supplementation in Aging and Disease. Front. Physiol. 2018, 9, 44. [Google Scholar] [CrossRef] [Scilit] [PubMed]
  7. Talebi, S.; Shahi, M.H.P.; Zeraattalab-Motlagh, S.; Asoudeh, F.; Ranjbar, M.; Hemmati, A.; Talebi, A.; Wong, A.; Mohammadi, H. The Effects of Coenzyme Q10 Supplementation on Biomarkers of Exercise-Induced Muscle Damage, Physical Performance, and Oxidative Stress: A Grade-Assessed Systematic Review and Dose-Response Meta-Analysis of Randomized Controlled Trials. Clin. Nutr. ESPEN 2024, 60, 122–134. [Google Scholar] [CrossRef] [Scilit]
  8. Deng, H.; Song, T.; Yin, M.; Xu, K.; Zhong, Y.; Mohd, N.B.; Naharudin, M.N.B.; Yusof, A.; Fan, X. Coenzyme Q10 Supplementation Increases Blood Concentrations but Shows Limited and Inconsistent Effects on Exercise Performance: A Systematic Review and Meta-Analysis. Br. J. Nutr. 2025, 135, 674–694. [Google Scholar] [CrossRef] [Scilit] [PubMed]
  9. Veronese, N.; Stubbs, B.; Punzi, L.; Soysal, P.; Incalzi, R.A.; Saller, A.; Maggi, S. Effect of Nutritional Supplementations on Physical Performance and Muscle Strength Parameters in Older People: A Systematic Review and Meta-Analysis. Ageing Res. Rev. 2019, 51, 48–54. [Google Scholar] [CrossRef] [Scilit] [PubMed]
  10. Page, M.J.; McKenzie, J.E.; Bossuyt, P.M.; Boutron, I.; Hoffmann, T.C.; Mulrow, C.D.; Shamseer, L.; Tetzlaff, J.M.; Akl, E.A.; Brennan, S.E.; et al. The Prisma 2020 Statement: An Updated Guideline for Reporting Systematic Reviews. BMJ 2021, 372, n71. [Google Scholar] [CrossRef] [Scilit] [PubMed]
  11. Rethlefsen, M.L.; Kirtley, S.; Waffenschmidt, S.; Ayala, A.P.; Moher, D.; Page, M.J.; Koffel, J.B. Prisma-S: An Extension to the Prisma Statement for Reporting Literature Searches in Systematic Reviews. Syst. Rev. 2021, 10, 39. [Google Scholar] [CrossRef] [Scilit] [PubMed]
  12. Luo, D.; Wan, X.; Liu, J.; Tong, T. Optimally Estimating the Sample Mean from the Sample Size, Median, Mid-Range, and/or Mid-Quartile Range. Stat. Methods Med. Res. 2018, 27, 1785–1805. [Google Scholar] [CrossRef] [Scilit] [PubMed]
  13. Wan, X.; Wang, W.; Liu, J.; Tong, T. Estimating the Sample Mean and Standard Deviation from the Sample Size, Median, Range and/or Interquartile Range. BMC Med. Res. Methodol. 2014, 14, 135. [Google Scholar] [CrossRef] [Scilit] [PubMed]
  14. Sterne, J.A.C.; Savović, J.; Page, M.J.; Elbers, R.G.; Blencowe, N.S.; Boutron, I.; Cates, C.J.; Cheng, H.Y.; Corbett, M.S.; Eldridge, S.M.; et al. Rob 2: A Revised Tool for Assessing Risk of Bias in Randomised Trials. BMJ 2019, 366, l4898. [Google Scholar] [CrossRef] [Scilit] [PubMed]
  15. IntHout, J.; Ioannidis, J.P.; Borm, G.F. The Hartung-Knapp-Sidik-Jonkman Method for Random Effects Meta-Analysis Is Straightforward and Considerably Outperforms the Standard Dersimonian-Laird Method. BMC Med. Res. Methodol. 2014, 14, 25. [Google Scholar] [CrossRef] [Scilit] [PubMed]
  16. Higgins, J.P.; Thompson, S.G.; Deeks, J.J.; Altman, D.G. Measuring Inconsistency in Meta-Analyses. BMJ 2003, 327, 557–560. [Google Scholar] [CrossRef] [Scilit] [PubMed]
  17. IntHout, J.; Ioannidis, J.P.; Rovers, M.M.; Goeman, J.J. Plea for Routinely Presenting Prediction Intervals in Meta-Analysis. BMJ Open 2016, 6, e010247. [Google Scholar] [CrossRef] [Scilit] [PubMed]
  18. Deichmann, R.E.; Lavie, C.J.; Dornelles, A.C. Impact of Coenzyme Q-10 on Parameters of Cardiorespiratory Fitness and Muscle Performance in Older Athletes Taking Statins. Phys. Sportsmed. 2012, 40, 88–95. [Google Scholar] [CrossRef] [Scilit] [PubMed]
  19. Laaksonen, R.; Fogelholm, M.; Himberg, J.J.; Laakso, J.; Salorinne, Y. Ubiquinone Supplementation and Exercise Capacity in Trained Young and Older Men. Eur. J. Appl. Physiol. Occup. Physiol. 1995, 72, 95–100. [Google Scholar] [CrossRef] [Scilit] [PubMed]
  20. Page, M.J.; Sterne, J.A.C.; Boutron, I.; Hróbjartsson, A.; Kirkham, J.J.; Li, T.; Lundh, A.; Mayo-Wilson, E.; McKenzie, J.E.; Stewart, L.A.; et al. Rob-Me: A Tool for Assessing Risk of Bias Due to Missing Evidence in Systematic Reviews with Meta-Analysis. BMJ 2023, 383, e076754. [Google Scholar] [CrossRef] [Scilit] [PubMed]
  21. Guyatt, G.; Oxman, A.D.; Akl, E.A.; Kunz, R.; Vist, G.; Brozek, J.; Norris, S.; Falck-Ytter, Y.; Glasziou, P.; DeBeer, H.; et al. Grade Guidelines: 1. Introduction-Grade Evidence Profiles and Summary of Findings Tables. J. Clin. Epidemiol. 2011, 64, 383–394. [Google Scholar] [CrossRef] [Scilit] [PubMed]
  22. Ramezani, M.; Sahraei, Z.; Simani, L.; Heydari, K.; Shahidi, F. Coenzyme Q10 Supplementation in Acute Ischemic Stroke: Is It Beneficial in Short-Term Administration? Nutr. Neurosci. 2020, 23, 640–645. [Google Scholar] [CrossRef] [Scilit] [PubMed]
  23. Ahmadi, A.; Begue, G.; Valencia, A.P.; Norman, J.E.; Lidgard, B.; Bennett, B.J.; Van Doren, M.P.; Marcinek, D.J.; Fan, S.; Prince, D.K.; et al. Randomized Crossover Clinical Trial of Coenzyme Q10 and Nicotinamide Riboside in Chronic Kidney Disease. JCI Insight 2023, 8, e167274. [Google Scholar] [CrossRef] [Scilit] [PubMed]
  24. Bagheri, N.; Kargarfard, M.; Bagheri, R.; Dutheil, F. Effects of Coenzyme Q10 Supplementation on Physical Function Adaptations to High-Intensity Interval Training in Older Adults. Nutrients 2025, 17, 3959. [Google Scholar] [CrossRef] [Scilit] [PubMed]
  25. Beal, M.F.; Oakes, D.; Shoulson, I.; Henchcliffe, C.; Galpern, W.R.; Haas, R.; Juncos, J.L.; Nutt, J.G.; Voss, T.S.; Ravina, B.; et al. A Randomized Clinical Trial of High-Dosage Coenzyme Q10 in Early Parkinson Disease: No Evidence of Benefit. JAMA Neurol. 2014, 71, 543–552. [Google Scholar] [CrossRef] [Scilit] [PubMed]
  26. Belardinelli, R.; Muçaj, A.; Lacalaprice, F.; Solenghi, M.; Seddaiu, G.; Principi, F.; Tiano, L.; Littarru, G.P. Coenzyme Q10 and Exercise Training in Chronic Heart Failure. Eur. Heart J. 2006, 27, 2675–2681. [Google Scholar] [CrossRef] [Scilit] [PubMed]
  27. Berman, M.; Erman, A.; Ben-Gal, T.; Dvir, D.; Georghiou, G.P.; Stamler, A.; Vered, Y.; Vidne, B.A.; Aravot, D. Coenzyme Q10 in Patients with End-Stage Heart Failure Awaiting Cardiac Transplantation: A Randomized, Placebo-Controlled Study. Clin. Cardiol. 2004, 27, 295–299. [Google Scholar] [CrossRef] [Scilit] [PubMed]
  28. Bloomer, R.J.; Canale, R.E.; McCarthy, C.G.; Farney, T.M. Impact of Oral Ubiquinol on Blood Oxidative Stress and Exercise Performance. Oxid. Med. Cell Longev. 2012, 2012, 465020. [Google Scholar] [CrossRef] [Scilit] [PubMed]
  29. Bodea, O.; Boia, E.R.; Craciun, L.M.; Valcovici, M.D.; Motofelea, A.C.; Munteanu, A.M.; Streian, C.G.; Pop, G.N.; Dragan, S.R. Effect of Coenzyme Q10 Supplementation on Cardiac Function and Quality of Life in Patients with Heart Failure: A Randomized Controlled Trial. J. Clin. Med. 2025, 14, 3675. [Google Scholar] [CrossRef] [Scilit] [PubMed]
  30. Bonetti, A.; Solito, F.; Carmosino, G.; Bargossi, A.M.; Fiorella, P.L. Effect of Ubidecarenone Oral Treatment on Aerobic Power in Middle-Aged Trained Subjects. J. Sports Med. Phys. Fit. 2000, 40, 51–57. [Google Scholar]
  31. Fogacci, F.; Giovannini, M.; Tocci, G.; Imbalzano, E.; Borghi, C.; Cicero, A.F.G. Effect of Coenzyme Q10 on Physical Performance in Older Adults with Statin-Associated Asthenia: A Double-Blind, Randomized, Placebo-Controlled Clinical Trial. J. Clin. Med. 2024, 13, 3741. [Google Scholar] [CrossRef] [Scilit] [PubMed]
  32. Glover, E.I.; Martin, J.; Maher, A.; Thornhill, R.E.; Moran, G.R.; Tarnopolsky, M.A. A Randomized Trial of Coenzyme Q10 in Mitochondrial Disorders. Muscle Nerve 2010, 42, 739–748. [Google Scholar] [CrossRef] [Scilit] [PubMed]
  33. Gokbel, H.; Turk, S.; Okudan, N.; Atalay, H.; Belviranli, M.; Gaipov, A.; Solak, Y. Effects of Coenzyme Q10 Supplementation on Exercise Performance and Markers of Oxidative Stress in Hemodialysis Patients: A Double-Blind Placebo-Controlled Crossover Trial. Am. J. Ther. 2016, 23, e1736–e1743. [Google Scholar] [CrossRef] [Scilit] [PubMed]
  34. Golomb, B.A.; Allison, M.; Koperski, S.; Koslik, H.J.; Devaraj, S.; Ritchie, J.B. Coenzyme Q10 Benefits Symptoms in Gulf War Veterans: Results of a Randomized Double-Blind Study. Neural Comput. 2014, 26, 2594–2651. [Google Scholar] [CrossRef] [Scilit] [PubMed]
  35. Hofman-Bang, C.; Rehnqvist, N.; Swedberg, K.; Wiklund, I.; Astrom, H. Coenzyme Q10 as an Adjunctive in the Treatment of Chronic Congestive Heart Failure. The Q10 Study Group. J. Card. Fail. 1995, 1, 101–107. [Google Scholar] [CrossRef] [Scilit] [PubMed]
  36. Holloway, C.J.; Murray, A.J.; Mitchell, K.; Martin, D.S.; Johnson, A.W.; Cochlin, L.E.; Codreanu, I.; Dhillon, S.; Rodway, G.W.; Ashmore, T.; et al. Oral Coenzyme Q10 Supplementation Does Not Prevent Cardiac Alterations during a High Altitude Trek to Everest Base Camp. High Alt. Med. Biol. 2014, 15, 459–467. [Google Scholar] [CrossRef] [Scilit] [PubMed]
  37. Huntington Study Group. A Randomized, Placebo-Controlled Trial of Coenzyme Q10 and Remacemide in Huntington’s Disease. Neurology 2001, 57, 397–404. [Google Scholar] [CrossRef] [Scilit] [PubMed]
  38. Kamikawa, T.; Kobayashi, A.; Yamashita, T.; Hayashi, H.; Yamazaki, N. Effects of Coenzyme Q10 on Exercise Tolerance in Chronic Stable Angina Pectoris. Am. J. Cardiol. 1985, 56, 247–251. [Google Scholar] [CrossRef] [Scilit] [PubMed]
  39. Keogh, A.; Fenton, S.; Leslie, C.; Aboyoun, C.; Macdonald, P.; Zhao, Y.C.; Bailey, M.; Rosenfeldt, F. Randomised Double-Blind, Placebo-Controlled Trial of Coenzyme Q10 Therapy in Class Ii and Iii Systolic Heart Failure. Heart Lung Circ. 2003, 12, 135–141. [Google Scholar] [CrossRef] [Scilit] [PubMed]
  40. Khatta, M.; Alexander, B.S.; Krichten, C.M.; Fisher, M.L.; Freudenberger, R.; Robinson, S.W.; Gottlieb, S.S. The Effect of Coenzyme Q10 in Patients Congestive Heart Failure. Ann. Intern. Med. 2000, 132, 636–640. [Google Scholar] [CrossRef] [Scilit] [PubMed]
  41. Kuhlman, A.B.; Mikkelsen, L.B.; Regnersgaard, S.; Heinrichsen, S.; Nielsen, F.H.; Frandsen, J.; Orlando, P.; Silvestri, S.; Larsen, S.; Helge, J.W.; et al. The Effect of 8 Weeks of Physical Training on Muscle Performance and Maximal Fat Oxidation Rates in Patients Treated with Simvastatin and Coenzyme Q10 Supplementation. J. Physiol. 2022, 600, 569–581. [Google Scholar] [CrossRef] [Scilit] [PubMed]
  42. McGarry, A.; McDermott, M.; Kieburtz, K.; de Blieck, E.A.; Beal, F.; Marder, K.; Ross, C.; Shoulson, I.; Gilbert, P.; Mallonee, W.M.; et al. A Randomized, Double-Blind, Placebo-Controlled Trial of Coenzyme Q10 in Huntington Disease. Neurology 2017, 88, 152–159. [Google Scholar] [CrossRef] [Scilit] [PubMed]
  43. Mitsui, J.; Matsukawa, T.; Uemura, Y.; Kawahara, T.; Chikada, A.; Porto, K.J.L.; Naruse, H.; Tanaka, M.; Ishiura, H.; Toda, T.; et al. High-Dose Ubiquinol Supplementation in Multiple-System Atrophy: A Multicentre, Randomised, Double-Blinded, Placebo-Controlled Phase 2 Trial. eClinicalMedicine 2023, 59, 101920. [Google Scholar] [CrossRef] [Scilit] [PubMed]
  44. Moghadam, S.G.M.; Zarban, A.; Marakieh, R.Y.; Allahyari, E. Some Beneficial Effects of Coenzyme Q10 Supplementation on Patients with Chronic Obstructive Pulmonary Disease. J. Adv. Med. Biomed. Res. 2023, 31, 238–243. [Google Scholar] [CrossRef] [Scilit]
  45. Mortensen, S.A.; Rosenfeldt, F.; Kumar, A.; Dolliner, P.; Filipiak, K.J.; Pella, D.; Alehagen, U.; Steurer, G.; Littarru, G.P. The Effect of Coenzyme Q10 on Morbidity and Mortality in Chronic Heart Failure: Results from Q-Symbio: A Randomized Double-Blind Trial. JACC Heart Fail. 2014, 2, 641–649. [Google Scholar] [PubMed]
  46. Müller, T.; Büttner, T.; Gholipour, A.F.; Kuhn, W. Coenzyme Q10 Supplementation Provides Mild Symptomatic Benefit in Patients with Parkinson’s Disease. Neurosci. Lett. 2003, 341, 201–204. [Google Scholar] [CrossRef] [Scilit] [PubMed]
  47. Permanetter, B.; Rossy, W.; Klein, G.; Weingartner, F.; Seidl, K.F.; Blomer, H. Ubiquinone (Coenzyme Q10) in the Long-Term Treatment of Idiopathic Dilated Cardiomyopathy. Eur. Heart J. 1992, 13, 1528–1533. [Google Scholar] [CrossRef] [Scilit] [PubMed]
  48. Pierce, J.D.; Shen, Q.; Mahoney, D.E.; Rahman, F.; Krueger, K.J.; Diaz, F.J.; Clark, L.; Smith, C.; Vacek, J.; Hiebert, J.B. Effects of Ubiquinol and/or D-Ribose in Patients with Heart Failure with Preserved Ejection Fraction. Am. J. Cardiol. 2022, 176, 79–88. [Google Scholar] [CrossRef] [Scilit] [PubMed]
  49. Schmücker, M.; Tranberg, C.; Borch, J.; Kaae, M.K.; Damgaard, M.; Flensted-Jensen, M.; Blom, I.; Morosetti, M.; Barbarossa, S.; Orlando, P.; et al. Coenzyme Q10 Supplementation Raises Plasma Levels without Improving Mitochondrial Function in Older Adults. Geroscience 2026. [Google Scholar] [CrossRef] [Scilit] [PubMed]
  50. Skough, K.; Krossén, C.; Heiwe, S.; Theorell, H.; Borg, K. Effects of Resistance Training in Combination with Coenzyme Q10 Supplementation in Patients with Post-Polio: A Pilot Study. J. Rehabil. Med. 2008, 40, 773–775. [Google Scholar] [CrossRef] [Scilit] [PubMed]
  51. Stamelou, M.; Reuss, A.; Pilatus, U.; Magerkurth, J.; Niklowitz, P.; Eggert, K.M.; Krisp, A.; Menke, T.; Schade-Brittinger, C.; Oertel, W.H.; et al. Short-Term Effects of Coenzyme Q10 in Progressive Supranuclear Palsy: A Randomized, Placebo-Controlled Trial. Mov. Disord. 2008, 23, 942–949. [Google Scholar] [CrossRef] [Scilit] [PubMed]
  52. Taylor, B.A.; Lorson, L.; White, C.M.; Thompson, P.D. A Randomized Trial of Coenzyme Q10 in Patients with Confirmed Statin Myopathy. Atherosclerosis 2015, 238, 329–335. [Google Scholar] [CrossRef] [Scilit] [PubMed]
  53. Yoritaka, A.; Kawajiri, S.; Yamamoto, Y.; Nakahara, T.; Ando, M.; Hashimoto, K.; Nagase, M.; Saito, Y.; Hattori, N. Randomized, Double-Blind, Placebo-Controlled Pilot Trial of Reduced Coenzyme Q10 for Parkinson’s Disease. Park. Relat. Disord. 2015, 21, 911–916. [Google Scholar] [CrossRef] [Scilit] [PubMed]
  54. Barcelos, I.P.D.; Haas, R.H. CoQ10 and Aging. Biology 2019, 8, 28. [Google Scholar] [CrossRef] [Scilit] [PubMed]
  55. Daei, S.; Ildarabadi, A.; Goodarzi, S.; Mohamadi-Sartang, M. Effect of Coenzyme Q10 Supplementation on Vascular Endothelial Function: A Systematic Review and Meta-Analysis of Randomized Controlled Trials. High Blood Press. Cardiovasc. Prev. 2024, 31, 113–126. [Google Scholar] [CrossRef] [Scilit] [PubMed]
  56. Rosenfeldt, F.; Hilton, D.; Pepe, S.; Krum, H. Systematic Review of Effect of Coenzyme Q10 in Physical Exercise, Hypertension and Heart Failure. Biofactors 2003, 18, 91–100. [Google Scholar] [CrossRef] [Scilit] [PubMed]
  57. Al Saadi, T.; Assaf, Y.; Farwati, M.; Turkmani, K.; Al-Mouakeh, A.; Shebli, B.; Khoja, M.; Essali, A.; Madmani, M.E. Coenzyme Q10 for Heart Failure. Cochrane Database Syst. Rev. 2021, 2, Cd008684. [Google Scholar] [PubMed]
  58. Qu, H.; Guo, M.; Chai, H.; Wang, W.T.; Gao, Z.Y.; Shi, D.Z. Effects of Coenzyme Q10 on Statin-Induced Myopathy: An Updated Meta-Analysis of Randomized Controlled Trials. J. Am. Heart Assoc. 2018, 7, e009835. [Google Scholar] [CrossRef] [Scilit] [PubMed]
  59. Kennedy, C.; Köller, Y.; Surkova, E. Effect of Coenzyme Q10 on Statin-Associated Myalgia and Adherence to Statin Therapy: A Systematic Review and Meta-Analysis. Atherosclerosis 2020, 299, 1–8. [Google Scholar] [CrossRef] [Scilit] [PubMed]
  60. Mueller, S.; Winzer, E.B.; Duvinage, A.; Gevaert, A.B.; Edelmann, F.; Haller, B.; Pieske-Kraigher, E.; Beckers, P.; Bobenko, A.; Hommel, J.; et al. Effect of High-Intensity Interval Training, Moderate Continuous Training, or Guideline-Based Physical Activity Advice on Peak Oxygen Consumption in Patients with Heart Failure with Preserved Ejection Fraction: A Randomized Clinical Trial. JAMA 2021, 325, 542–551. [Google Scholar] [CrossRef] [Scilit] [PubMed]
  61. Shoemaker, M.J.; Curtis, A.B.; Vangsnes, E.; Dickinson, M.G. Triangulating Clinically Meaningful Change in the Six-Minute Walk Test in Individuals with Chronic Heart Failure: A Systematic Review. Cardiopulm. Phys. Ther. J. 2012, 23, 5–15. [Google Scholar] [CrossRef] [Scilit]
  62. Khan, M.S.; Anker, S.D.; Friede, T.; Jankowska, E.A.; Metra, M.; Piña, I.L.; Coats, A.J.; Rosano, G.; Roubert, B.; Goehring, U.M.; et al. Minimal Clinically Important Differences in 6-Minute Walk Test in Patients with Hfref and Iron Deficiency. J. Card. Fail. 2023, 29, 760–770. [Google Scholar] [CrossRef] [Scilit] [PubMed]
Figure 1. PRISMA 2020 flow diagram showing identification, screening, eligibility assessment, and inclusion of randomized trials evaluating oral CoQ10 and eligible physical-performance, muscle-health, or clinician-rated motor-function outcomes.
Antioxidants 15 01219 g001
Figure 2. Summary of Cochrane RoB 2 judgments. D1–D5 and overall judgments include all 33 studies; Domain S (period and carryover effects) includes the 10 randomized crossover trials assessed with the dedicated crossover variant.
Antioxidants 15 01219 g002
Figure 3. Effects of CoQ10 supplementation on relative VO2peak/VO2max. The figure contrasts the Class A primary model with the A + B sensitivity model and reports effect estimates, uncertainty, and heterogeneity. Formal GRADE certainty is shown only for the Class A primary body of evidence; the A + B row is marked “Not rated”.
Antioxidants 15 01219 g003
Figure 4. Effects of CoQ10 supplementation on physical−capacity outcomes, including 6-min walking distance, exercise duration, and maximum workload. Exercise duration is expressed as Hedges’ g; the other outcomes use mean differences in their stated units. Class A primary and A + B sensitivity models are shown with uncertainty and heterogeneity. GRADE certainty is shown only for the Class A primary body of evidence; A + B rows are marked “Not rated”.
Antioxidants 15 01219 g004
Figure 5. Effects of CoQ10 supplementation on muscle-health outcomes, including handgrip strength, lower-limb strength, chair-rise performance, and muscle/lean-tissue quantity. Chair−rise performance and muscle/lean−tissue quantity are expressed as Hedges’ g; strength outcomes use mean differences in their stated units. Class A primary and A + B sensitivity models are shown with uncertainty and heterogeneity. GRADE certainty is shown only for the Class A primary body of evidence; A + B rows are marked “Not rated”.
Antioxidants 15 01219 g005
Table 1. Characteristics of included randomized trials. Each trial is counted once under its highest available evidence class using the hierarchy A > B > C; slash-separated labels preserve mixed outcome-level routes without double counting (definitions in Section 2.6). The n (R/A) column reports study-level randomized/analysed totals; meta-analytic N values are outcome-specific, and participants in crossover trials are counted once.
Study
(Country)
PopulationDesignn (R/A)Age, y (Mean ± SD Unless Otherwise Stated)CoQ10 RegimenComparator; DurationEligible
Performance/
Motor Outcomes
Study-Level Route
Ahmadi 2023 [23]
(USA)
Chronic kidney disease; eGFR < 60Three-period double-blind crossover RCT25/25Overall: 61.0 ± 11.6CoQ10 1200 mg/dayPlacebo; 6 weeks per periodVO2peak; total work; test durationA-pooled
Bagheri 2025 [24]
(Iran)
Healthy sedentary adults aged 65–75Parallel double-blind RCT; sex-stratified38/38CoQ10: 69 ± 4; placebo: 70 ± 4CoQ10 100 mg/dayMatched placebo; 8 weeks6MWD; chair-rise; grip; TUG; 25-ft walk; SLS; muscle massA-pooled
Beal 2014 [25] (QE3)
(USA/Canada)
Early Parkinson diseaseMulticentre three-arm parallel RCT600/60062.5CoQ10 1200 or 2400 mg/dayPlacebo; Mean follow-up 10.4 months; planned 16 monthsUPDRS Part III motor scoreA-standalone
Belardinelli 2006 [26]
(Italy)
NYHA II-III chronic heart failure secondary to ischemic heart diseaseFour-period randomized double-blind placebo-controlled crossover factorial trial23/2159 ± 9CoQ10 100 mg three times daily (300 mg/day) (enhanced formulation)Placebo; 4 weeks per phaseVO2peak; peak work rateB-sensitivity
Berman 2004 [27]
(Israel)
End-stage heart failure awaiting cardiac transplantationParallel randomized double-blind placebo-controlled trial32/2754.6 (range 40–67)Ultrasome CoQ10 60 mg/day (enhanced formulation)Placebo; 3 months6MWDC-narrative
Bloomer 2012 [28]
(USA)
Exercise-trained adults aged 30–65; study mean age ≥ 40Double-blind crossover RCT17/1542.7 ± 10.4Ubiquinol 300 mg/day (ubiquinol)Placebo; 4 weeks per periodTreadmill duration; sprint peak/mean power; total workB-sensitivity
Bodea 2025 [29]
(Romania)
NYHA II–III heart failureParallel double-blind RCT120/120CoQ10: 66.5 ± 12.8; placebo: 67.7 ± 14.3CoQ10 60 mg twice daily (120 mg/day)Identical placebo; 24 weeks6MWDA-pooled
Bonetti 2000 [30]
(Italy)
Male leisure-time cyclists aged 30–50Parallel randomized single-blind trial28/23CoQ10: 40.6 ± 6.0; placebo: 40.1 ± 7.4CoQ10 100 mg/dayPlacebo; 8 weeksVO2peak; WmaxA-pooled
Deichmann 2012 [18]
(USA)
Athletes aged ≥50 taking stable statin dosesDouble-blind crossover RCT20/1963.5 ± 8.2CoQ10 200 mg/day (gel capsule)Placebo; 6 weeks per periodVO2max change; anaerobic-threshold time; leg-extension repetitionsB-sensitivity/
B-standalone
Fogacci 2024 [31]
(Italy)
Adults aged 65–80 with statin-associated astheniaSingle-centre parallel double-blind RCT60/60CoQ10: 74 ± 2; placebo: 73 ± 3Ubiqsome 300 mg/day, providing CoQ10 60 mg/day (phytosome)Matched placebo; 8 weeksHandgrip; 1-min sit-to-stand; 2-min stepA-pooled
Glover 2010 [32]
(Canada)
Adults with mitochondrial cytopathyDouble-blind crossover RCT30/30MELAS 48 ± 3; other diagnoses 56 ± 3CoQ10 600 mg twice daily (1200 mg/day) (Qgel)Soybean-oil placebo; 60 days per periodMaximal isometric forearm torque; lean body mass; fixed-workload cycling VO2B-sensitivity
Gokbel 2016 [33]
(Turkey)
Maintenance hemodialysis patientsDouble-blind crossover RCT28/2346.6 ± 11.9CoQ10 200 mg/dayDextrose placebo; 12 weeks per period6MWD; estimated VO2maxB-sensitivity
Golomb 2014 [34]
(USA)
Veterans meeting criteria for Gulf War illnessThree-arm randomized double-blind placebo-controlled trial; first parallel phase used46/42100 mg: 48 ± 6.1; 300 mg: 50 ± 7.6; placebo: 44 ± 6.0CoQ10 100 or 300 mg/day (softgel)Identical placebo; 3.5 ± 0.5 monthsSummary performance scoreC-narrative
Hofman-Bang 1995 [35]
(Sweden)
Stable chronic congestive heart failureMulticentre double-blind crossover RCT79/6961 ± 10CoQ10 100 mg/dayMatching placebo; 3 months per periodWmaxB-sensitivity
Holloway 2014 [36]
(United Kingdom)
Healthy adults undertaking a high-altitude trekParallel assessor-blinded RCT23/23CoQ10: 48.5 ± 14.9; control: 43.1 ± 15.5CoQ10 300 mg/dayNo supplement; 17 daysLean body massA-pooled
Huntington Study Group 2001 [37] (CARE-HD)
(USA/Canada)
Early Huntington diseaseMulticentre 2 × 2 factorial RCT347/347~48CoQ10 600 mg/dayNo-CoQ10 factorial contrast; 30 monthsUHDRS total motor; Total Functional CapacityA-standalone
Kamikawa 1985 [38]
(Japan)
Chronic stable angina pectorisRandomized double-blind crossover trial after single-blind run-in12/1256 (range 45–66)CoQ10 50 mg three times daily (150 mg/day)Placebo; 4 weeks per periodExercise duration; time to 1-mm ST depressionB-sensitivity
Keogh 2003 [39]
(Australia)
NYHA II–III chronic heart failureParallel double-blind RCT39/35CoQ10: 62 ± 7; placebo: 61 ± 9CoQ10 150 mg/dayMatched placebo; 12 weeks6MWD; Naughton exercise timeA-pooled
Khatta 2000 [40]
(USA)
NYHA III–IV congestive heart failureParallel double-blind RCT55/4664CoQ10 200 mg/dayPlacebo; 6 monthsVO2peak; exercise durationA-pooled
Kuhlman 2021/2022 [41]
(Denmark)
Statin-naïve dyslipidaemic men aged 40–70Three-arm parallel randomized double-blind RCT32/26CoQ10: 56 ± 8; placebo: 56 ± 9Simvastatin 40 mg/day + CoQ10 400 mg/day (Ubiquinone)Simvastatin 40 mg/day + placebo; 8 weeksKnee-extension MVC; lean mass; grip; VO2max; WmaxA-pooled/C
Laaksonen 1995 [19]
(Finland)
Trained men; separately extractable older subgroup aged 60–74Double-blind crossover RCT19/763.8 (range 60–74)Ubiquinone 120 mg/day (Ubiquinone)Placebo; 6 weeks per periodVO2max; time to exhaustionB-sensitivity
McGarry 2017 [42] (2CARE)
(USA/Canada/Australia)
Early Huntington diseaseMulticentre parallel double-blind RCT609/609CoQ10: 50.5 ± 11.9; placebo: 50.7 ± 11.6CoQ10 2400 mg/dayPlacebo; Up to 60 monthsUHDRS total motor; Total Functional CapacityA-standalone
Mitsui 2023 [43]
(Japan)
Multiple system atrophy13-centre parallel randomized double-blind RCT139/129CoQ10: 59.8 ± 8.5; placebo: 62.0 ± 8.3Ubiquinol titrated to 1500 mg/day (Ubiquinol)Placebo; 48 weeksUMSARS Part II; 10-m walk timeA-standalone
Moghadam 2023 [44]
(Iran)
Moderate-to-severe COPDParallel double-blind placebo-controlled RCT; registry confirms lottery allocation90/90CoQ10: 64.20 ± 11.38; placebo: 66.98 ± 12.16CoQ10 120 mg/dayIdentical placebo; 6 weeksWalking time to exhaustion, capped at 6 minB-standalone
Mortensen 2014 [45] (Q-SYMBIO)
(Multinational)
Moderate-to-severe chronic heart failureMulticentre parallel randomized double-blind placebo-controlled trial420/42062.3 ± 12 vs. 62.3 ± 11CoQ10 100 mg three times daily (300 mg/day)Placebo plus standard therapy; 16 weeks for 6MWD; 2 years overall6MWDC-narrative
Müller 2003 [46]
(Germany)
Stable Parkinson diseaseSingle-centre parallel double-blind RCT28/28CoQ10: 66.21 ± 9.33; placebo: 64.36 ± 7.69CoQ10 180 mg twice daily (360 mg/day)Placebo; 4 weeksUPDRS Part IIIA-standalone
Permanetter 1992 [47]
(Germany)
Idiopathic dilated cardiomyopathy (NYHA class I–III)Randomized double-blind placebo-controlled crossover trial25/2454 ± 12 vs. 51 ± 8Ubiquinone 33.3 mg three times daily (approximately 100 mg/day) (Ubiquinone)Placebo; 4 months per periodMaximum workloadC-narrative
Pierce 2022 [48]
(USA)
Heart failure with preserved ejection fractionFour-arm parallel randomized double-blind RCT153/13969.2 ± 10.1Ubiquinol 600 mg/day (Ubiquinol)Double placebo; 12 weeks6MWDA-pooled
Schmücker 2026 [49]
(Denmark)
Robust community-dwelling older adultsParallel randomized double-blind placebo-controlled trial40/40CoQ10: 74 ± 4; placebo: 75 ± 4Ubiquinone 400 mg/day (Ubiquinone)Placebo; 12 weeksVO2max; Wmax; lean mass; 30-s sit-to-standA-pooled
Skough 2008 [50]
(Sweden)
Post-polio syndromeParallel randomized double-blind placebo-controlled pilot trial14/14Median—CoQ10: 71; placebo: 66CoQ10 100 mg twice daily (200 mg/day)Placebo; 12 weeksSit-stand-sit; TUG; 6MWD; knee strength; total workB-sensitivity
Stamelou 2008 [51]
(Germany)
Clinically probable progressive supranuclear palsySingle-centre parallel double-blind RCT21/20Median—CoQ10: 63.5; placebo: 68.0CoQ10 5 mg/kg/day (nanoparticulate)Matched placebo; 6 weeksPSP Rating Scale; UPDRS Part IIIA-standalone
Taylor 2015 [52]
(USA)
Adults with confirmed statin myalgiaInitial parallel randomized double-blind phase; later partial crossover41/38CoQ10: 58 ± 10; placebo: 60 ± 10Simvastatin 20 mg/day + ubiquinol 600 mg/day (Ubiquinol)Simvastatin 20 mg/day + placebo; 8 weeks after 2-week loadingVO2max; grip; knee and elbow strengthA-pooled
Yoritaka 2015 [53]
(Japan)
Parkinson disease; wearing-off and non-levodopa cohortsTwo parallel double-blind RCT cohorts64/48Cohort A—CoQ10: 64.1; placebo: 61.5; cohort B—CoQ10: 59.8; placebo: 64.4Ubiquinol 300 mg/day (Ubiquinol)Placebo; 48 weeks (A); 96 weeks (B)UPDRS Part III; total UPDRSA-standalone
Table 2. Summary of quantitative findings and certainty of evidence for the Class A primary analyses.
OutcomeEvidence Base,
k (N)
Pooled Effect
(95% CI)
95%
Prediction
Interval
I2Certainty
(GRADE)
Interpretation
Relative VO2peak/VO2max5 (172)MD 0.73 (−0.07 to 1.54) mL·kg−1·min−1−0.07 to 1.54 mL·kg−1·min−10.0%Low (a, d)Small, directionally favourable effect; the confidence interval includes little or no effect.
Six-minute walk distance4 (266)MD 34.58 (−22.56 to 91.72) mNot estimated81.7%Very low (b, c, d)Possible improvement, but the confidence interval is very wide, includes little or no effect, and heterogeneity is considerable.
Exercise duration2 (81)Hedges’ g 0.38 (−1.26 to 2.03) SD unitsNot estimated0.0%Very low (b, e)The standardized effect is highly uncertain because the confidence interval is extremely wide.
Handgrip strength4 (155)MD 1.85 (−2.08 to 5.79) kgNot estimated89.6%Very low (a, c, d)The effect is highly uncertain because the confidence interval crosses the null and heterogeneity is substantial.
Lower-limb strength2 (57)MD 5.64 (−222.12 to 233.40) N·mNot estimated52.1%Very low (a, c, e)The effect is highly uncertain; the confidence interval includes large effects in both directions.
Chair-rise performance3 (138)Hedges’ g 1.16 (−2.45 to 4.76) SD unitsNot estimated94.5%Very low (a, c, d)The pooled estimate favours CoQ10, but the confidence interval crosses the null and heterogeneity is substantial.
Muscle/
lean-tissue quantity
4 (120)Hedges’ g 0.10 (−0.26 to 0.47) SD unitsNot estimated0.0%Low (a, d)No clear standardized effect was detected; the confidence interval includes effects in both directions.
Table 3. Narrative-only eligible studies and reason for non-pooling.
StudyPopulation and DesignIntervention and ComparatorEligible Performance or Motor OutcomeReported ResultOverall RoB 2Reason Not Pooled
Berman 2004 [27]End-stage heart failure awaiting transplantation; parallel double-blind RCT; 32 randomized and 27 completedEnhanced-bioavailability CoQ10 60 mg/day vs. placebo; 3 months6-min walking distanceMean distance increased from 269.5 to 382.2 m with CoQ10 and decreased from 254 to 177 m with placebo; no compatible variance for the between-group effect was reported.HighGroup-specific SD, SE, or CI values were unavailable, and an inequality-reported p-value could not recover a defensible variance.
Golomb 2014 [34]Veterans with Gulf War illness; first randomized parallel phase; 46 randomizedCoQ10 100 or 300 mg/day vs. placebo; approximately 3.5 monthsLower-extremity Summary Performance ScoreImprovement occurred in 9/11 (82%) at 100 mg/day, 6/11 (55%) at 300 mg/day and 8/20 (40%) with placebo.HighThe 12-point composite combined chair rises, balance, and walking velocity and was converted to a binary improvement outcome because of ceiling effects; it was not compatible with the continuous outcome pools.
Mortensen 2014 [45]
(Q-SYMBIO)
Moderate-to-severe chronic heart failure; multicentre double-blind parallel RCT; 420 randomizedCoQ10 300 mg/day vs. placebo; 16-week short-term assessmentSix-minute walk distanceBaseline distances were 287 ± 98 m and 286 ± 92 m in the CoQ10 and placebo groups, respectively. Both groups improved at 16 weeks, with no reported statistically significant between-group difference.Some concernsCompatible follow-up means, change-score variances, and a CI were not reported in the main publication; the treatment effect and its precision could not be reconstructed.
Permanetter 1992 [47]Idiopathic dilated cardiomyopathy; two-sequence double-blind crossover RCT; 25 randomizedCoQ10 approximately 100 mg/day vs. placebo; 4 months per periodMaximum workloadWorkload remained essentially unchanged in one sequence and showed only a marginal improvement in the other; no clear treatment effect was documented.HighThe outcome was graph-based, exact period means and paired variance were unavailable, no adequate washout was used, and baseline or sequence imbalance and possible carryover could not be resolved.
Disclaimer/Publisher’s Note: The statements, opinions and data contained in all publications are solely those of the individual author(s) and contributor(s) and not of MDPI and/or the editor(s). MDPI and/or the editor(s) disclaim responsibility for any injury to people or property resulting from any ideas, methods, instructions or products referred to in the content.