
Oxidative Stress and Complement Activation in Aqueous Cells and Vitreous from Patient with Vitreoretinal Diseases: Comparison Between Diabetic ERM and PDR

 , , , , ,
Abstract
1. Introduction
2. Materials and Methods
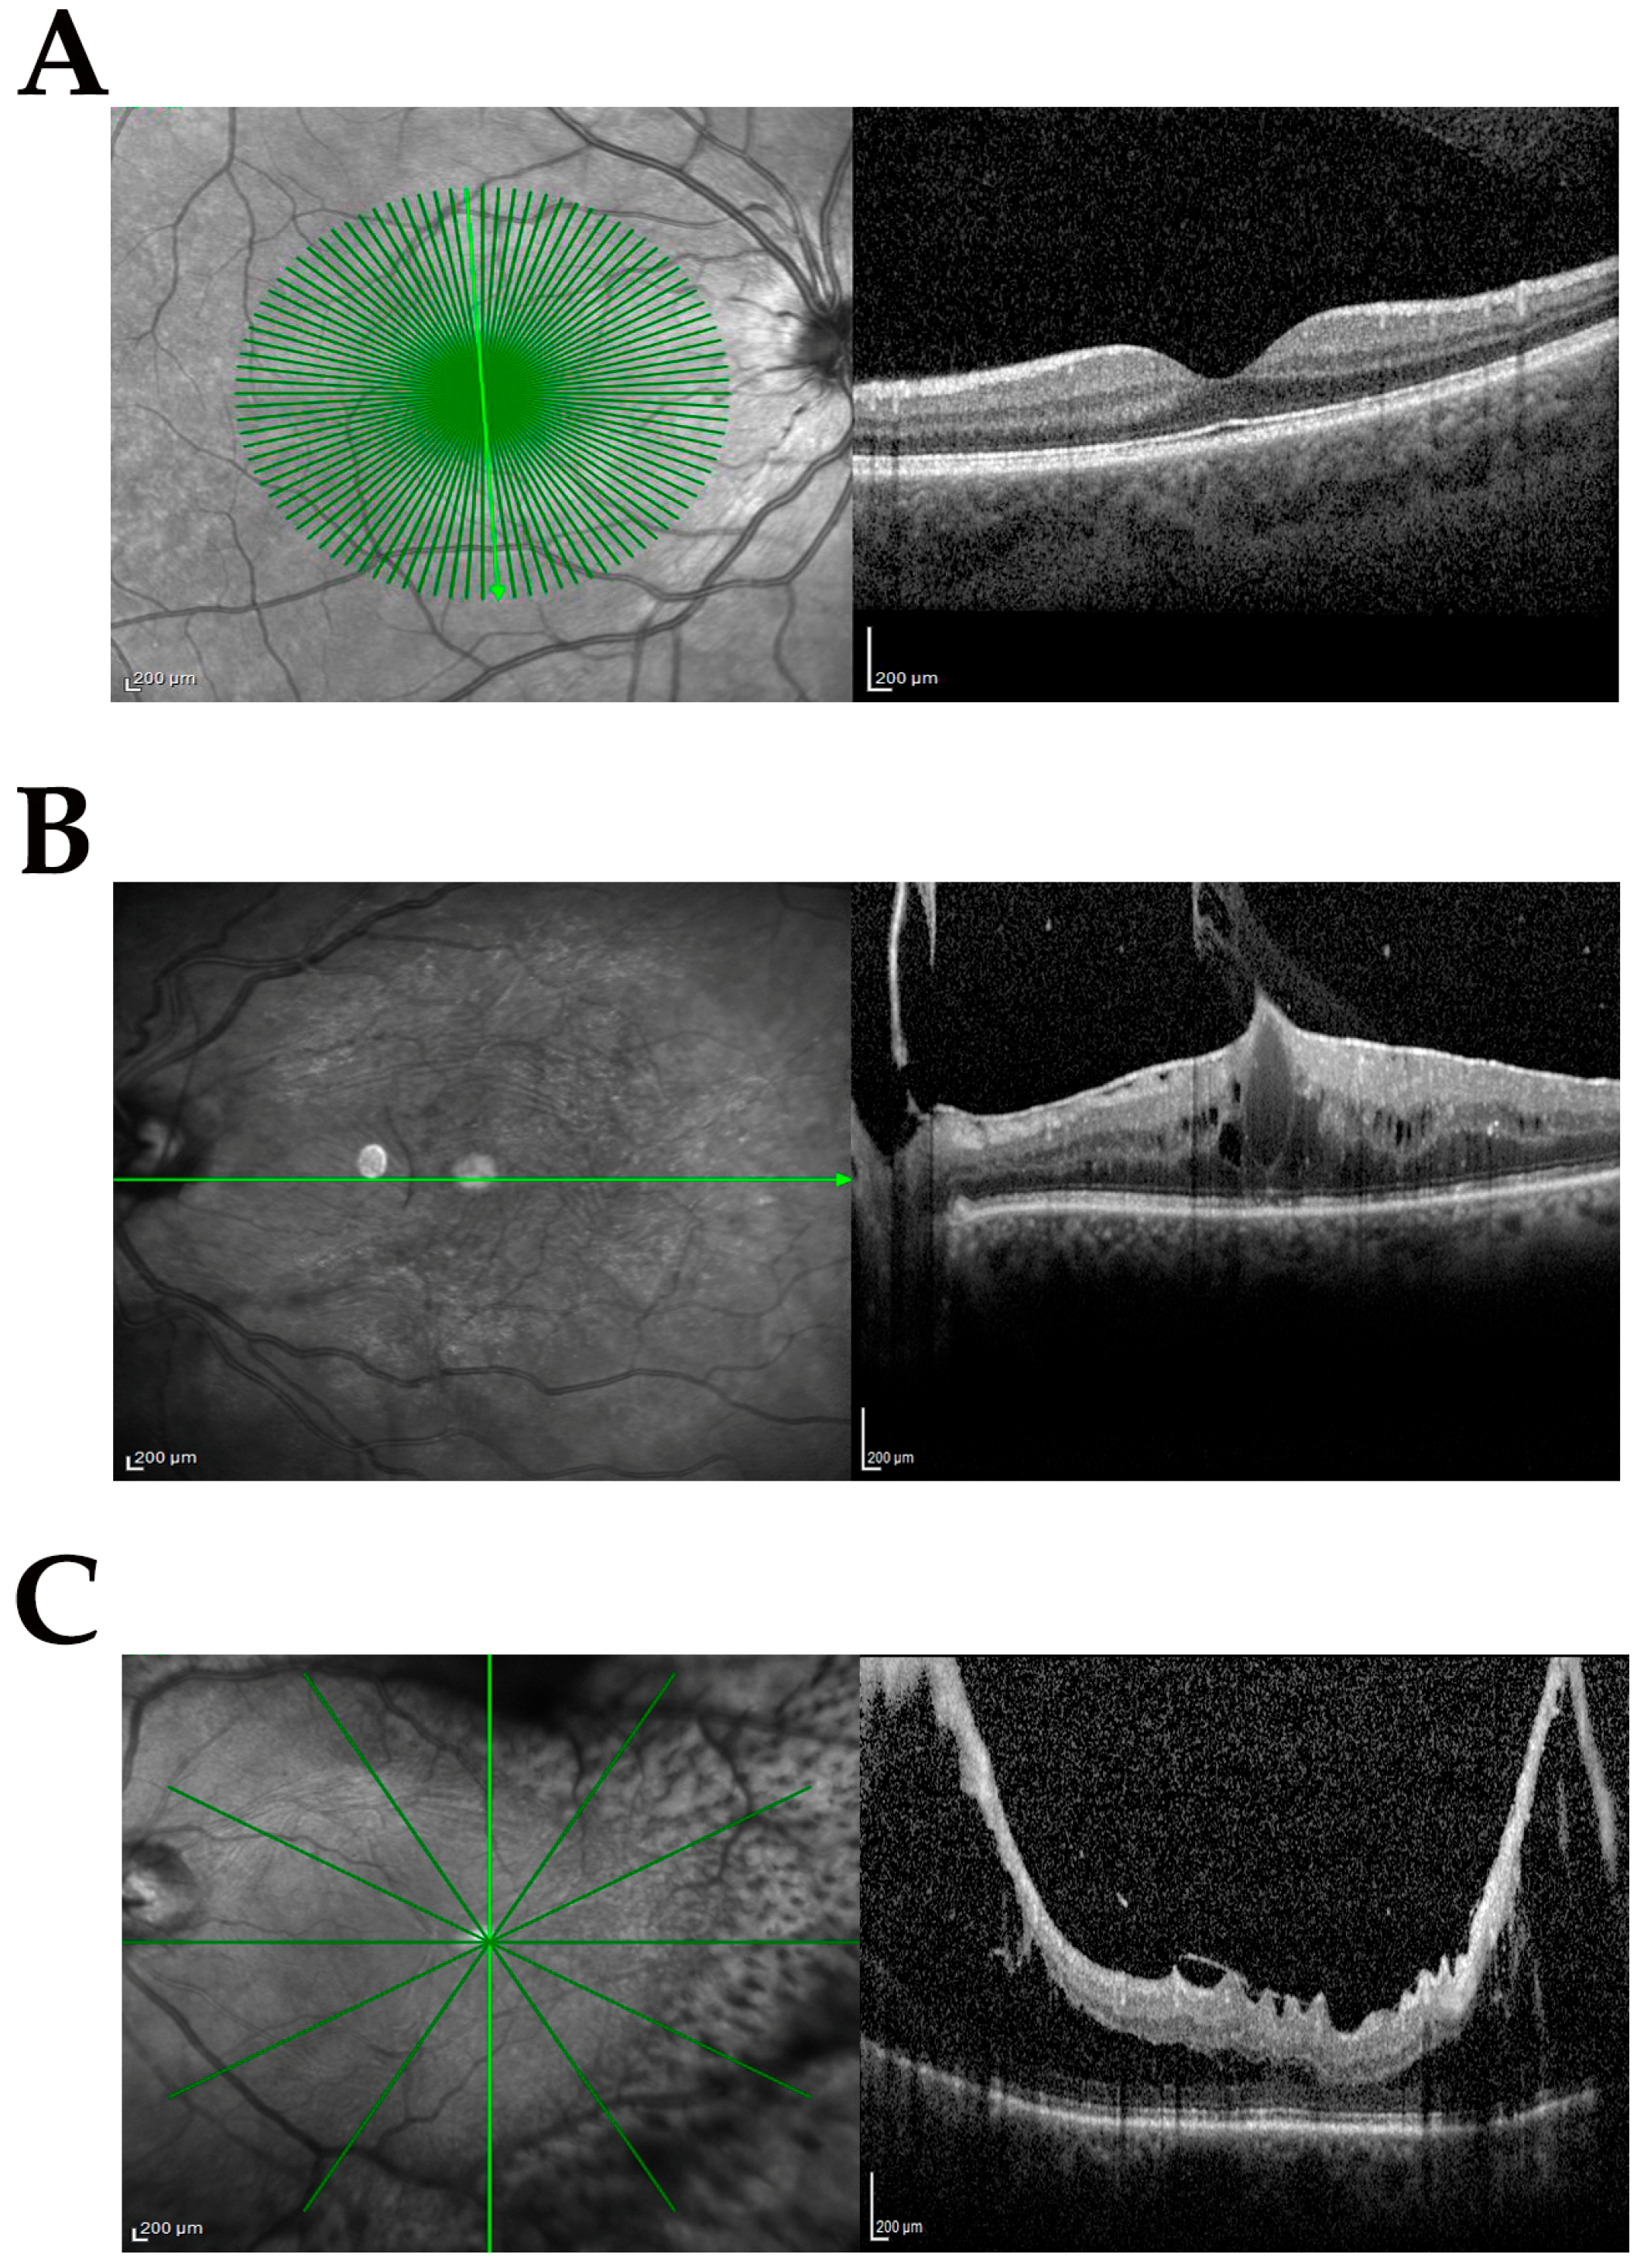
2.1. Study Population and SD-OCT Classification
2.2. Sampling Mode and Preanalytics
2.3. Total RNA Isolation, cDNA Synthesis, and Relative Real-Time PCR Analysis
2.4. Quantitative Analysis of C3a, C5b9, and Malondialdehyde (MDA)
2.5. Statistics
3. Results
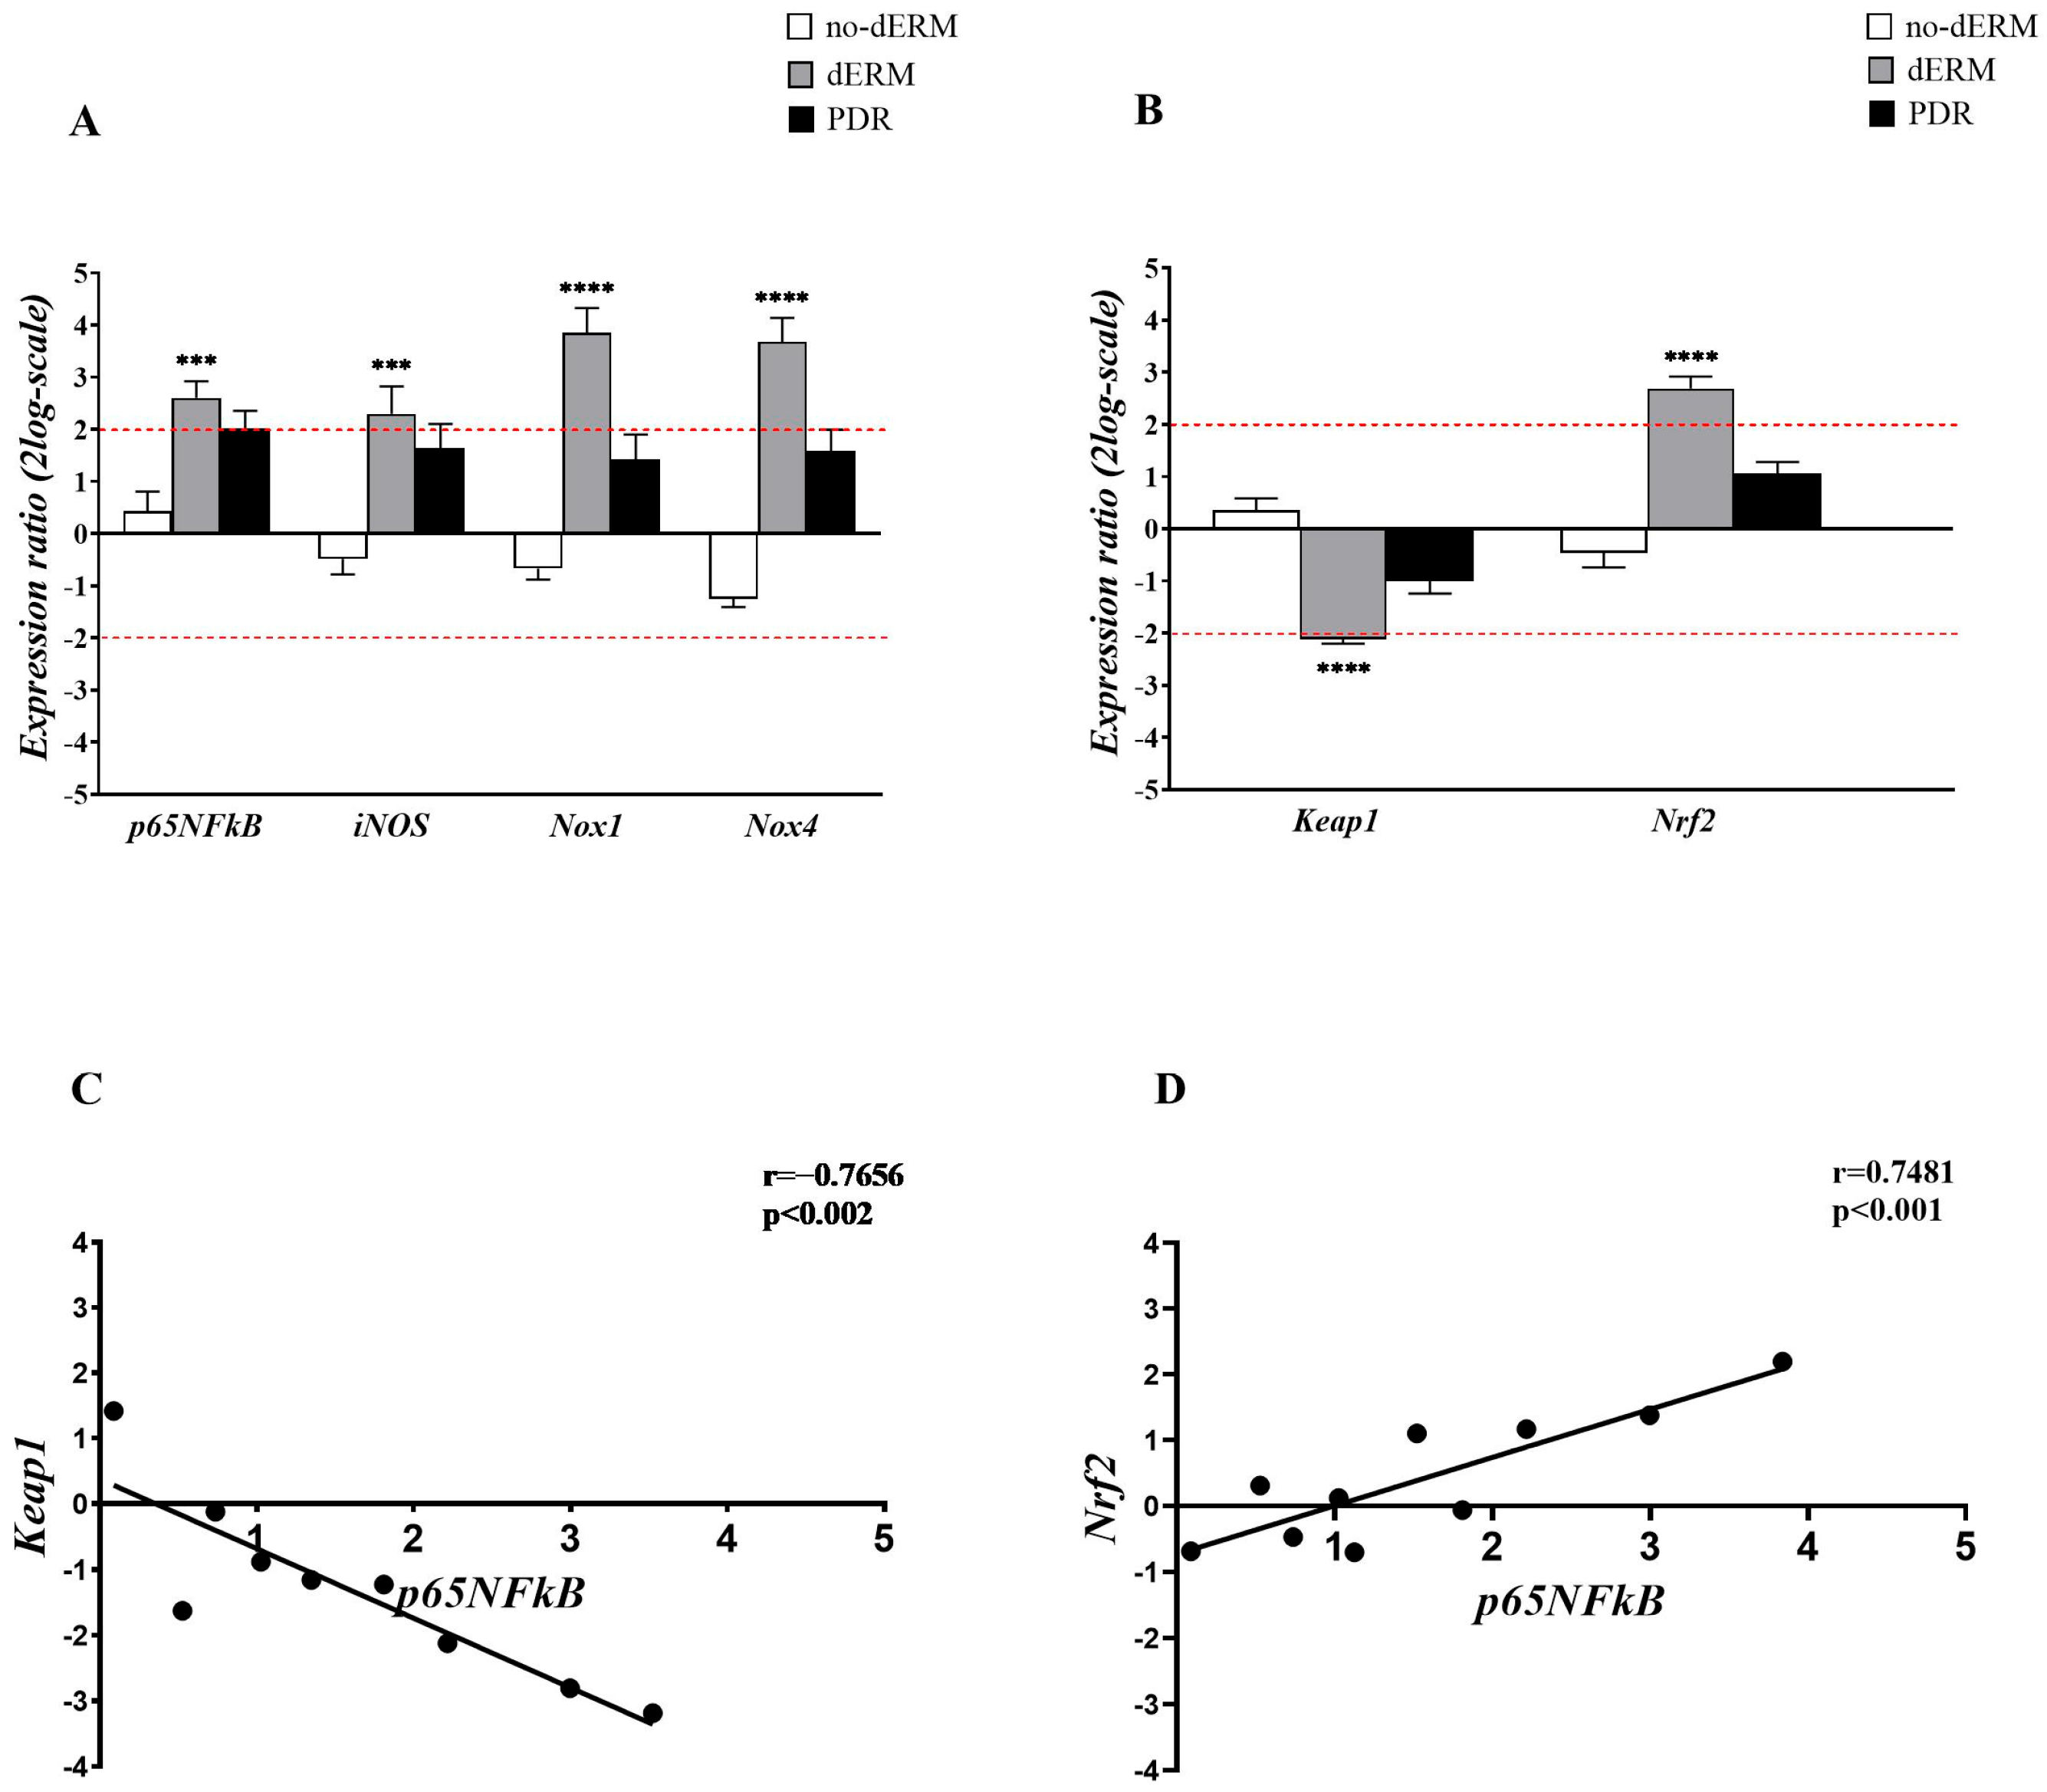
3.1. Oxidative Stress Regulators Are Overexpressed in Aqueous-Derived dERM Cells
3.2. Complement Receptors and Modulators Are Over-Expressed in Aqueous Cells from dERM
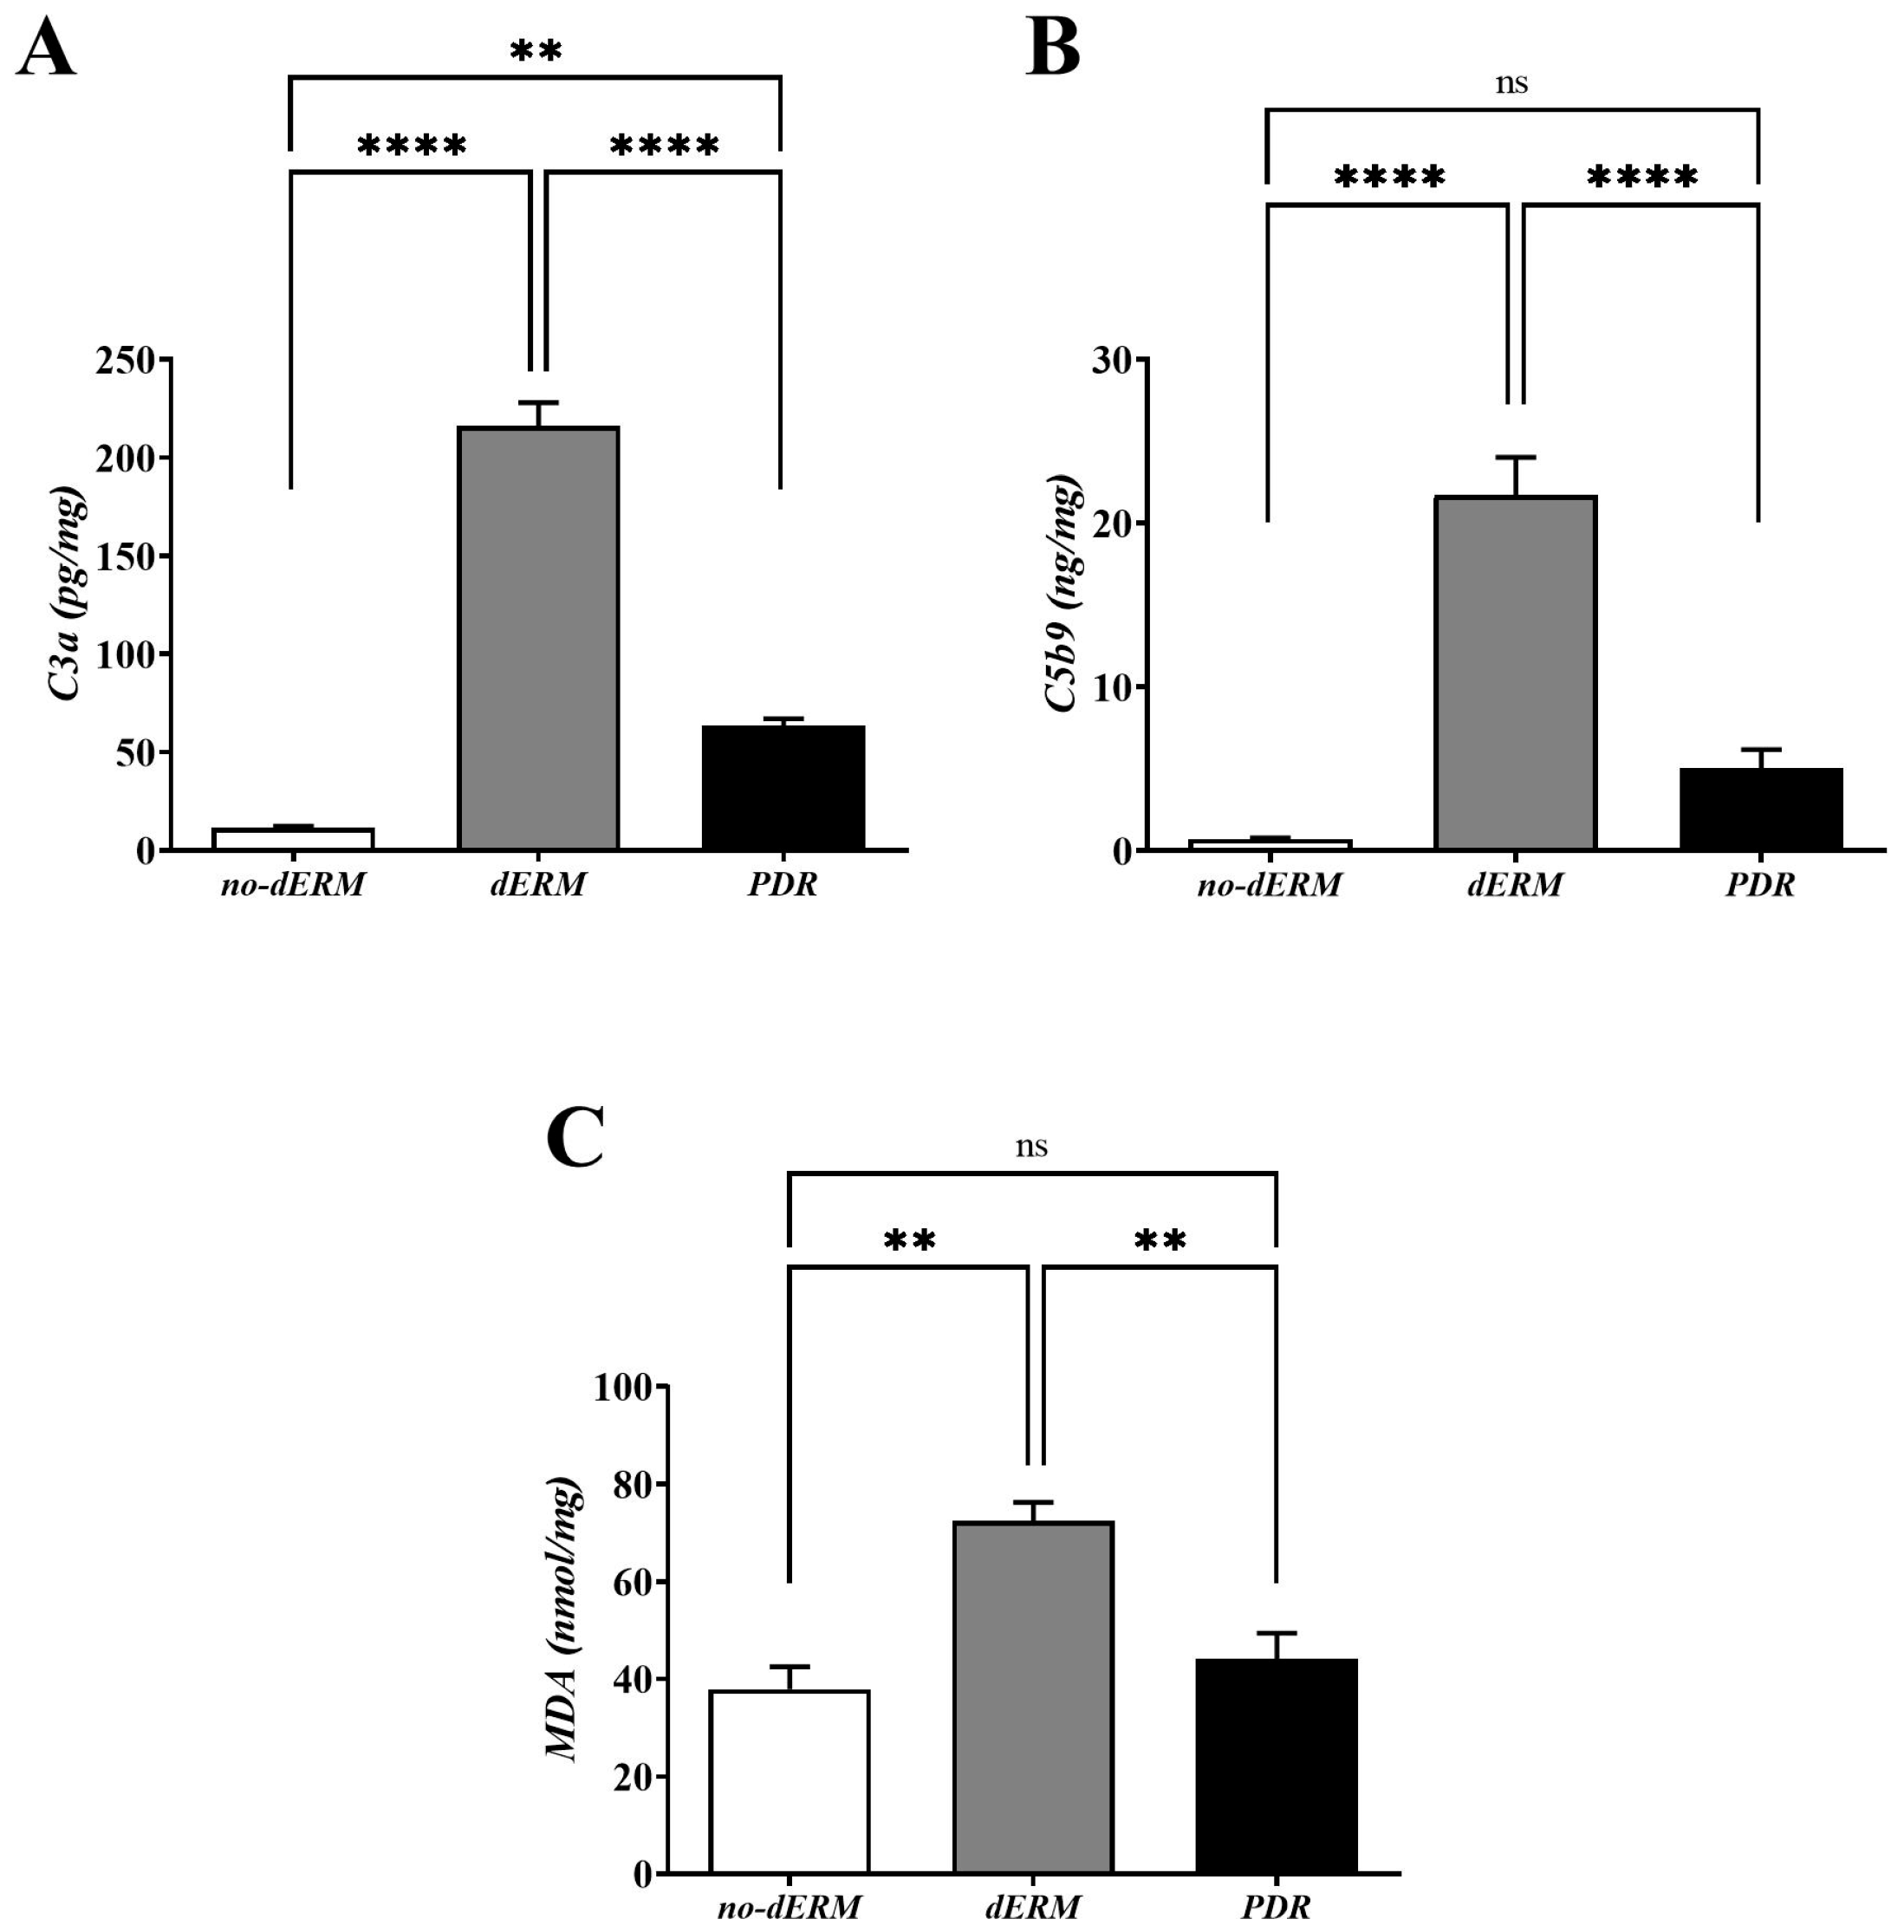
3.3. C3a, C5b9, and MDA Are Increased in dERM Vitreal Fluids
4. Discussion
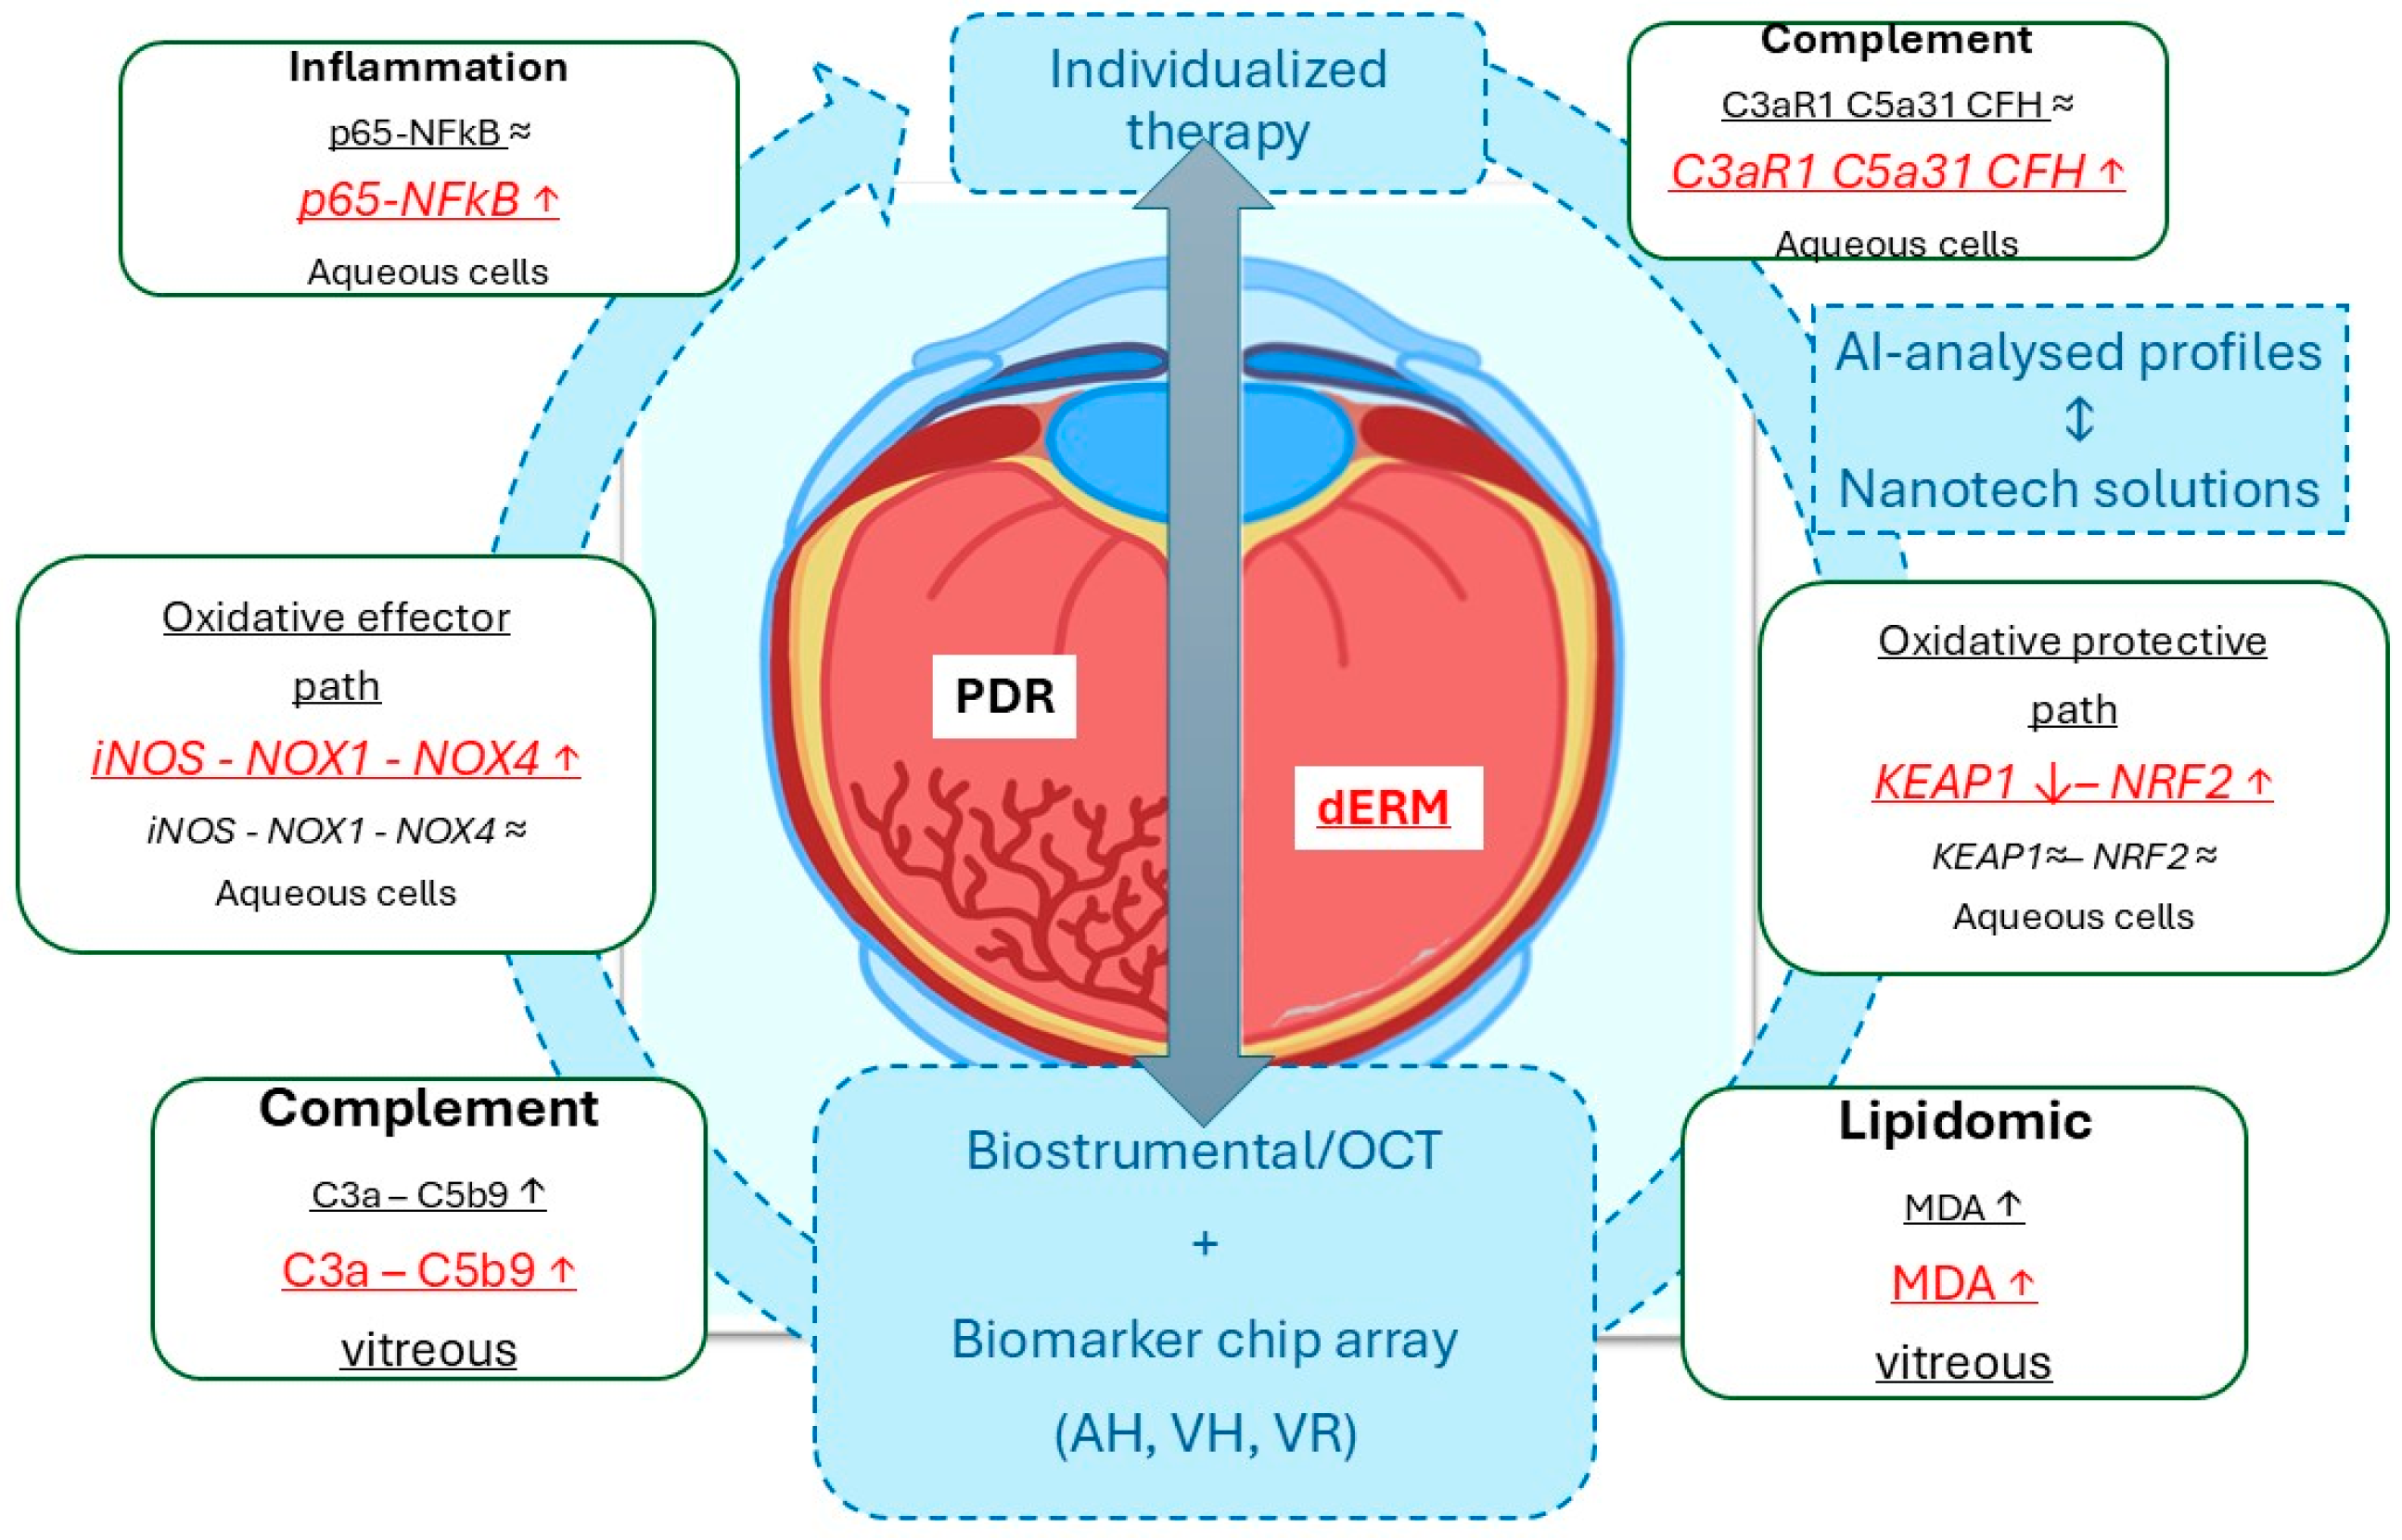
5. Conclusions
Author Contributions
Funding
Institutional Review Board Statement
Informed Consent Statement
Data Availability Statement
Acknowledgments
Conflicts of Interest
References
- Yun, S.; Huang, J.J. Routes for Drug Delivery: Sustained-Release Devices. Dev. Ophthalmol. 2016, 55, 84–92. [Google Scholar] [CrossRef] [PubMed]
- Ożóg, M.K.; Nowak-Wąs, M.; Rokicki, W. Pathophysiology and clinical aspects of epiretinal membrane—Review. Front. Med. 2023, 10, 1121270. [Google Scholar] [CrossRef]
- Vishwakarma, S.; Gupta, R.K.; Jakati, S.; Tyagi, M.; Pappuru, R.R.; Reddig, K.; Hendricks, G.; Volkert, M.R.; Khanna, H.; Chhablani, J.; et al. Molecular Assessment of Epiretinal Mem-brane: Activated Microglia, Oxidative Stress and Inflammation. Antioxidants 2020, 9, 654. [Google Scholar] [CrossRef]
- Al-Kharashi, A.S. Role of oxidative stress, inflammation, hypoxia and angiogenesis in the development of diabetic retinopathy. Saudi J. Ophthalmol. 2018, 32, 318–323. [Google Scholar] [CrossRef]
- Kakihara, S.; AbdelSalam, M.; Zhuang, K.; Fawzi, A.A. Epiretinal Membrane Is Associated with Diabetic Retinopathy Severity and Cumulative Anti-VEGF Injections. Ophthalmol. Sci. 2025, 5, 100733. [Google Scholar] [CrossRef]
- Kowluru, R.A.; Chan, P.S. Oxidative stress and diabetic retinopathy. Exp. Diabetes Res. 2007, 2007, 43603. [Google Scholar] [CrossRef] [PubMed]
- Behl, T.; Kaur, I.; Kotwani, A. Implication of oxidative stress in progression of diabetic retinopathy. Surv. Ophthalmol. 2016, 61, 87–196. [Google Scholar] [CrossRef]
- Sharma, S.; Saxena, S.; Srivastav, K.; Shukla, R.K.; Mishra, N.; Meyer, C.H.; Kruzliak, P.; Khanna, V.K. Nitric oxide and oxidative stress is associated with severity of diabetic retinopathy and retinal structural alterations. Clin. Exp. Ophthalmol. 2015, 43, 429–436. [Google Scholar] [CrossRef]
- Giordano, C.R.; Roberts, R.; Krentz, K.A.; Bissig, D.; Talreja, D.; Kumar, A.; Terlecky, S.R.; Berkowitz, B.A. Catalase therapy corrects oxidative stress-induced pathophysiology in incipient diabetic retinopathy. Investig. Ophthalmol. Vis. Sci. 2015, 56, 3095–3102. [Google Scholar] [CrossRef]
- Shin, E.S.; Huang, Q.; Gurel, Z.; Sorenson, C.M.; Sheibani, N. High glucose alters retinal astrocytes phenotype through increased production of inflammatory cytokines and oxidative stress. PLoS ONE 2014, 9, e103148. [Google Scholar] [CrossRef]
- Datta, S.; Cano, M.; Ebrahimi, K.; Wang, L.; Handa, J.T. The impact of oxidative stress and inflammation on RPE degeneration in non-neovascular AMD. Prog. Retin. Eye Res. 2017, 60, 201–218. [Google Scholar] [CrossRef]
- Huang, W.; Li, G.; Qiu, J.; Gonzalez, P.; Challa, P. Protective effects of resveratrol in experimental retinal detachment. PLoS ONE 2013, 8, e75735. [Google Scholar] [CrossRef]
- Giacco, F.; Brownlee, M. Oxidative stress and diabetic complications. Circ. Res. 2010, 107, 1058–1070. [Google Scholar] [CrossRef] [PubMed]
- Kowluru, R.A. Retinopathy in a diet-induced type 2 diabetic rat model and role of epigenetic modifications. Diabetes 2020, 69, 689–698. [Google Scholar] [PubMed]
- Sui, A.; Chen, X.; Demetriades, A.M.; Shen, J.; Cai, Y.; Yao, Y.; Yao, Y.; Zhu, Y.; Shen, X.; Xie, B. Inhibiting NF-kappaB signaling activation reduces retinal neovascularization by promoting a polarization shift in macrophages. Investig. Ophthalmol. Vis. Sci. 2020, 61, 4. [Google Scholar] [CrossRef]
- Morgan, M.J.; Liu, Z.G. Crosstalk of reactive oxygen species and NF-kB signaling. Cell Res. 2011, 21, 103–115. [Google Scholar] [CrossRef]
- Miller, W.P.; Sunilkumar, S.; Giordano, J.F.; Toro, A.L.; Barber, A.J.; Dennis, M.D. The stress response protein REDD1 promotes diabetes-induced oxidative stress in the retina by Keap1-independent Nrf2 degradation. J. Biol. Chem. 2020, 295, 7350–7361. [Google Scholar] [CrossRef]
- Zhong, Q.; Mishra, M.; Kowluru, R.A. Transcription factor Nrf2-mediated antioxidant defense system in the development of diabetic retinopathy. Investig. Ophthalmol. Vis. Sci. 2013, 54, 3941–3948. [Google Scholar] [CrossRef]
- Brownlee, M. Biochemistry and molecular cell biology of diabetic complications. Nature 2001, 414, 813–820. [Google Scholar] [CrossRef]
- Miller, R.G.; Orchard, T.J. Understanding metabolic memory: A tale of two studies. Diabetes 2020, 69, 291–299. [Google Scholar] [CrossRef]
- Kumari, N.; Karmakar, A.; Ganesan, S.K. Targeting epigenetic modifications as a potential therapeutic option for diabetic retinopathy. J. Cell. Physiol. 2020, 235, 1933–1947. [Google Scholar] [CrossRef] [PubMed]
- Kato, M.; Natarajan, R. Epigenetics and epigenomics in diabetic kidney disease and metabolic memory. Nat. Rev. Nephrol. 2019, 15, 327–345. [Google Scholar] [CrossRef]
- Chen, Z.; Miao, F.; Paterson, A.D.; Lachin, J.M.; Zhang, L.; Schones, D.E.; Wu, X.; Wang, J.; Tompkins, J.D.; Genuth, S.; et al. Epigenomic profiling reveals an association between persistence of DNA methylation and metabolic memory in the DCCT/EDIC type 1 diabetes cohort. Proc. Natl. Acad. Sci. USA 2016, 113, E3002–E3011. [Google Scholar] [CrossRef]
- Moldovan, L.; Moldovan, N.I. Oxygen free radicals and redox biology of organells. Histochem. Cell Biol. 2004, 122, 395–412. [Google Scholar] [CrossRef] [PubMed]
- Mondal, L.K.; Pramanik, S.; Chowdhury, S.; Bose, C.; Bera, D.; Saha, A.; Bhattacharjee, K. Do different lipid components accelerate the pathogenesis and severity of Diabetic Retinopathy? Int. J. Retin. Vitr. 2022, 8, 39. [Google Scholar] [CrossRef]
- Jiang, F.; Zhou, L.; Zhang, C.; Jiang, H.; Xu, Z. Malondialdehyde levels in diabetic retinopathy patients: A systematic review and meta-analysis. Meta-Anal. Chin. Med. J. 2023, 136, 1311–1321. [Google Scholar] [CrossRef] [PubMed]
- Verma, M.K.; Singh, S.P.; Alam, R.; Verma, P. Comparative study on MDA, SOD and HBA1C Levels in patients of type 2 diabetes mellitus with retinopathy and without retinopathy. Int. J. Pharm. Sci. Res. 2016, 7, 4184–4190. [Google Scholar] [CrossRef]
- Shawki, H.A.; Elzehery, R.; Shahin, M.; Abo-Hashem, E.M.; Youssef, M.M. Evaluation of some oxidative markers in diabetes and diabetic retinopathy. Diabetol. Int. 2021, 12, 108–117. [Google Scholar] [CrossRef] [PubMed]
- Mancino, R.; Pierro, D.D.; Varesi, C.; Cerulli, A.; Feraco, A.; Cedrone, C.; Pinazo-Duran, M.D.; Coletta, M.; Nucci, C. Lipid peroxidation and total antioxidant capacity in vitreous, aqueous humor, and blood samples from patients with diabetic retinopathy. Mol. Vis. 2011, 17, 1298–1304. [Google Scholar]
- Manoharan, N.; Patnaik, J.L.; Olson, J.L. Increased complement levels in human vitreous aspirates of proliferative diabetic retinopathy and retinal detachment eyes. Retina 2019, 39, 2212–2218. [Google Scholar] [CrossRef]
- Tezel, G.; Yang, X.; Luo, C.; Kain, A.D.; Powell, D.W.; Kuehn, M.H.; Kaplan, H.J. Oxidative stress and the regulation of complement activation in human glaucoma. Investig. Ophthalmol. Vis. Sci. 2010, 51, 5071–5082. [Google Scholar] [CrossRef]
- Shahulhameed, S.; Vishwakarma, S.; Chhablani, J.; Tyagi, M.; Pappuru, R.R.; Jakati, S.; Chakrabarti, S.; Kaur, I. A Systematic Investigation on Complement Pathway Activation in Diabetic Retinopathy. Front. Immunol. 2020, 11, 154. [Google Scholar] [CrossRef]
- Chrzanowska, M.; Modrzejewska, A.; Modrzejewska, M. New insight into the role of the complement in the most common types of retinopathy-current literature review. Int. J. Ophthalmol. 2018, 11, 1856–1864. [Google Scholar] [CrossRef] [PubMed]
- Rathi, S.; Hasan, R.; Ueffing, M.; Clark, S.J. Therapeutic targeting of the complement system in ocular disease. Drug Discov. Today 2023, 28, 103757. [Google Scholar] [CrossRef]
- Wu, J.C.W.; Sauter, L.; Johnson, P.K.; Chen, C.D.; Olsen, T.W. Identification and localization of major soluble vitreous proteins in human ocular tissue. Am. J. Ophthalmol. 2004, 137, 655–661. [Google Scholar] [CrossRef]
- Jiang, F.; Lei, C.; Chen, Y.; Zhou, N.; Zhang, M. The complement system and diabetic retinopathy. Surv. Ophthalmol. 2024, 69, 575–584. [Google Scholar] [CrossRef]
- Pfaffl, M.W.; Horgan, G.W.; Dempfle, L. Relative Expression Software Tool (REST©) for group wise comparison and statistical analysis of relative expression results in real-time PCR. Nucleic Acids Res. 2002, 30, E36. [Google Scholar] [CrossRef]
- Pieper, G.M.; Riaz ul, H. Activation of nuclear factor-kappaB in cultured endothelial cells by increased glucose concentration: Prevention by calphostin C. J. Cardiovasc. Pharmacol. 1997, 30, 528–532. [Google Scholar] [CrossRef]
- Yerneni, K.K.; Bai, W.; Khan, B.V.; Medford, R.M.; Natarajan, R. Hyperglycemia-induced activation of nuclear transcription factor kappaB in vascular smooth muscle cells. Diabetes 1999, 48, 855–864. [Google Scholar] [CrossRef]
- Liu, T.; Zhang, L.; Joo, D.; Sun, S.C. NF-kB signaling in inflammation. Signal Transduct. Target. Ther. 2017, 2, 17023. [Google Scholar] [CrossRef]
- Busik, J.V.; Mohr, S.; Grant, M.B. Hyperglycemia-induced reactive oxygen species toxicity to endothelial cells is dependent on paracrine mediators. Diabetes 2008, 57, 1952–1965. [Google Scholar] [CrossRef] [PubMed]
- Abu El-Asrar, A.M.; Meersschaert, A.; Dralands, L.; Missotten, L.; Geboes, K. Inducible nitric oxide synthase and vascular endothelial growth factor are colocalized in the retinas of human subjects with diabetes. Eye 2004, 18, 306–313. [Google Scholar] [CrossRef]
- Zheng, L.; Du, Y.; Miller, C.; Gubitosi-Klug, R.A.; Kern, T.S.; Ball, S.; Berkowitz, B.A. Critical role of inducible nitric oxide synthase in degeneration of retinal capillaries in mice with streptozotocin-induced diabetes. Diabetologia 2007, 50, 1987–1996. [Google Scholar] [CrossRef] [PubMed]
- Mishra, A.; Newman, E.A. Inhibition of inducible nitric oxide synthase reverses the loss of functional hyperemia in diabetic retinopathy. Glia 2010, 58, 1996–2004. [Google Scholar] [CrossRef]
- Gauss, K.A.; Nelson-Overton, L.K.; Siemsen, D.W.; Gao, Y.; DeLeo, F.R.; Quinn, M.T. Role of NF-kappaB in transcriptional regulation of the phagocyte NADPH oxidase by tumor necrosis factor-alpha. J. Leukoc. Biol. 2007, 82, 729–741. [Google Scholar] [CrossRef] [PubMed]
- Leal, E.C.; Manivannan, A.; Hosoya, K.; Terasaki, T.; Cunha-Vaz, J.; Ambrósio, A.F.; Forrester, J.V. Inducible nitric oxide synthase isoform is a key mediator of leukostasis and blood-retinal barrier breakdown in diabetic retinopathy. Investig. Ophthalmol. Vis. Sci. 2007, 48, 5257–5265. [Google Scholar] [CrossRef]
- Lv, J.; Chen, M.M.; Mu, Z.H.; Wang, F.; Qian, Z.Y.; Zhou, L.; Guo, Q.T.; Zhao, Z.M.; Pan, Y.P.; Liao, X.; et al. Intravitreal Bevacizumab Injection Attenuates Diabetic Retinopathy in Adult Rats with Experimentally Induced Diabetes in the Early Stage. J. Diabetes Res. 2018, 2018, 9216791. [Google Scholar] [CrossRef]
- Altenhöfer, S.; Radermacher, K.A.; Kleikers, P.W.; Wingler, K.; Schmidt, H.H. Evolution of NADPH oxidase inhibitors: Selectivity and mechanisms for target engagement. Antioxid. Redox Signal. 2015, 23, 406–427. [Google Scholar] [CrossRef]
- Ago, T.; Kuroda, J.; Kamouchi, M.; Sadoshima, J.; Kitazono, T. Pathophysiological roles of NADPH oxidase/nox family proteins in the vascular system. Review and perspective. Circ. J. 2011, 75, 1791–1800. [Google Scholar] [CrossRef]
- Kang, Q.; Yang, C. Oxidative stress and diabetic retinopathy: Molecular mechanisms, pathogenetic role and therapeutic implications. Redox Biol. 2020, 37, 101799. [Google Scholar] [CrossRef]
- Liu, X.F.; Zhou, D.D.; Xie, T.; Hao, J.L.; Malik, T.H.; Lu, C.B.; Qi, J.; Pant, O.P.; Lu, C.W. The Nrf 2 signaling in retinal ganglion cells under oxidative stress in ocular neurodegenerative diseases. Int. J. Biol. Sci. 2018, 14, 1090–1098. [Google Scholar] [CrossRef]
- Chen, J.; Wang, Q.; Li, R.; Li, Z.; Jiang, Q.; Yan, F.; Ye, J. The role of Keap1-Nrf2 signaling pathway during the progress and therapy of diabetic retinopathy. Life Sci. 2024, 338, 122386. [Google Scholar] [CrossRef] [PubMed]
- Zhang, J.C.; Yao, W.; Dong, C.; Han, M.; Shirayama, Y.; Hashimoto, K. Keap1-Nrf2 signaling pathway confers resilience versus susceptibility to inescapable electric stress. Eur. Arch. Psychiatry Clin. Neurosci. 2018, 268, 865–870. [Google Scholar] [CrossRef]
- David, J.A.; Rifkin, W.J.; Rabbani, P.S.; Ceradini, D.J. The Nrf2/Keap1/ARE pathway and oxidative stress as a therapeutic target in type II diabetes mellitus. J. Diabetes Res. 2017, 2017, 4826724. [Google Scholar] [CrossRef] [PubMed]
- Keleku-Lukwete, N.; Suzuki, M.; Yamamoto, M. An overview of the advantages of KEAP1-NRF2 system activation during inflammatory disease treatment. Antioxid. Redox Signal. 2018, 29, 1746–1755. [Google Scholar] [CrossRef] [PubMed]
- Zhu, C.; Dong, Y.; Liu, H.; Ren, H.; Cui, Z. Hesperetin protects against H2O2-triggered oxidative damage via upregulation of the Keap1-Nrf2/HO-1 signal pathway in ARPE-19 cells. Biomed. Pharmacother. 2017, 88, 124–133. [Google Scholar] [CrossRef]
- Pujol-Lereis, L.M.; Schäfer, N.; Kuhn, L.B.; Rohrer, B.; Pauly, D. Interrelation Between Oxidative Stress and Complement Activation in Models of Age-Related Macular Degeneration. Adv. Exp. Med. Biol. 2016, 854, 87–93. [Google Scholar] [CrossRef]
- Binder, C.J.; Papac-Milicevic, N.; Witztum, J.L. Innate sensing of oxidation-specific epitopes in health and disease. Nat. Rev. Immunol. 2016, 16, 485–497. [Google Scholar] [CrossRef]
- Armento, A.; Honisch, S.; Panagiotakopoulou, V.; Sonntag, I.; Jacob, A.; Bolz, S.; Kilger, E.; Deleidi, M.; Clark, S.; Ueffing, M. Loss of Complement Factor H impairs antioxidant capacity and energy metabolism of human RPE cells. Sci. Rep. 2020, 10, 10320. [Google Scholar] [CrossRef]
- Kim, B.J.; Mastellos, D.C.; Li, Y.; Dunaief, J.L.; Lambris, J.D. Targeting complement components C3 and C5 for the retina: Key concepts and lingering questions. Prog. Retin. Eye Res. 2021, 83, 100936. [Google Scholar] [CrossRef]
- Jha, P.; Bora, P.S.; Bora, N.S. The role of complement system in ocular diseases including uveitis and macular degeneration. Mol. Immunol. 2007, 44, 3901–3908. [Google Scholar] [CrossRef] [PubMed]
- Sircar, M.; Rosales, I.A.; Selig, M.K.; Xu, D.; Zsengeller, Z.K.; Stillman, I.E.; Libermann, T.A.; Karumanchi, S.A.; Thadhani, R.I. Complement 7 is up regulated in human early diabetic kidney disease. Am. J. Pathol. 2018, 188, 2147–2154. [Google Scholar] [CrossRef]
- Lynch, A.M.; Mandava, N.; Patnaik, J.L.; Frazer-Abel, A.A.; Wagner, B.D.; Palestine, A.G.; Mathias, M.T.; Siringo, F.S.; Cathcart, J.N.; Holers, V.M. Systemic activation of the complement system in patients with advanced age related macular degeneration. Eur. J. Ophthalmol. 2020, 30, 1061–1068. [Google Scholar] [CrossRef]
- Holers, V.M. Complement and its receptors: New insights into human disease. Annu. Rev. Immunol. 2014, 32, 433–459. [Google Scholar] [CrossRef]
- Zipfel, P.F.; Skerka, C. Complement regulators and inhibitory proteins. Nat. Rev. Immunol. 2009, 9, 729. [Google Scholar] [CrossRef] [PubMed]
- Xu, H.; Chen, M. Targeting the complement system for the management of retinal inflammatory and degenerative diseases. Eur. J. Pharmacol. 2016, 787, 94–104. [Google Scholar] [CrossRef]
- Mandava, N.; Tirado-Gonzalez, V.; Geiger, M.D.; Patnaik, J.L.; Frazer-Abel, A.; Lynch, A.M.; Mandava, N.; Palestine, A.G.; Holers, V.M.; Wagner, B.D.; et al. Complement Activation in the Vitreous of Patients With Proliferative Diabetic Retinopathy. Investig. Ophthalmol. Vis. Sci. 2020, 61, 39. [Google Scholar] [CrossRef]
- Wilson, S.; Siebourg-Polster, J.; Titz, B.; Jiang, Z.; Bartolo, F.; Lavergne, V.; Gayán, J.; Garweg, J.G.; Fauser, S.; Dieckmann, A. Correlation of Aqueous, Vitreous, and Serum Protein Levels in Patients With Retinal Diseases. Transl. Vis. Sci. Technol. 2023, 12, 9. [Google Scholar] [CrossRef] [PubMed]
- Chen, M.; Xu, H. Parainflammation, chronic inflammation, and agerelated macular degeneration. J. Leukoc. Biol. 2015, 98, 713–725. [Google Scholar] [CrossRef]
- Haydinger, C.D.; Oliver, G.F.; Ashander, L.M.; Smith, J.R. Oxidative Stress and Its Regulation in Diabetic Retinopathy. Antioxidants 2023, 12, 1649. [Google Scholar] [CrossRef]
- McGeer, P.L.; McGeer, E.G. Inflammation and the degenerative diseases of aging. Ann. N. Y. Acad. Sci. 2004, 1035, 104–116. [Google Scholar] [CrossRef] [PubMed]
- Böhm, E.W.; Buonfiglio, F.; Voigt, A.M.; Bachmann, P.; Safi, T.; Pfeiffer, N.; Gericke, A. Oxidative stress in the eye and its role in the pathophysiology of ocular diseases. Redox Biol. 2023, 68, 102967. [Google Scholar] [CrossRef]
- Luo, L.-J.; Jian, H.-J.; Harroun, S.G.; Lai, J.-Y.; Unnikrishnan, B.; Huang, C.-C. Targeting nanocomposites with anti-oxidative/inflammatory/angiogenic activities for synergistically alleviating macular degeneration. Appl. Mater. Today 2021, 24, 101156. [Google Scholar] [CrossRef]
- Shastri, D.H.; Silva, A.C.; Almeida, H. Ocular Delivery of Therapeutic Proteins: A Review. Pharmaceutics 2023, 15, 205. [Google Scholar] [CrossRef]
- Vora, L.K.; Gholap, A.D.; Jetha, K.; Thakur, R.R.S.; Solanki, H.K.; Chavda, V.P. Artificial Intelligence in Pharmaceutical Technology and Drug Delivery Design. Pharmaceutics 2023, 15, 1916. [Google Scholar] [CrossRef]


| CTR a | no-dERM b | dERM c | PDR d | |
|---|---|---|---|---|
| Eyes/patients | 6 | 9 | 6 | 6 |
| Gender (M/F) | 3M/3F | 4M/5F | 3M/3F | 5M/1F |
| Age e | 77.7 ± 9.0 | 70.4 ± 6.4 | 73.2 ± 4.9 | 63.7 ± 7.4 |
| Genes | Primers Pairs | Accession Number | |
|---|---|---|---|
| Referring Genes | |||
| H3 | F: GCTTCGAGAGATTCGTCGTT | R: GAAACCTCAGGTCGGTTTTG | NM_005324 |
| Target Genes | |||
| p65NFkB | F: CAGAAGCAGGCTGGAGGTAA | R: GTTAGGCACAGGGACAATGC | L19067.1 |
| iNOS | F: CCCCTTCAATGGCTGGTACA | R: GTTTCCAGGCCCATTCTCCT | U31511.1 |
| Nox1 | F: CCAGGATTGAAGTGGATGGT | R: AGGTTGTGGTCTGCACACTG | BC075014.2 |
| Nox4 | F: CTCAGCGGAATCAATCAGCTGTG | R: AGAGGAACACGACAATCAGCCTTAG | BC040105.1 |
| C3aR1 | F: TATGCAAGCTCATCCCCTCCAT | R: TGCACATCACAAAAGCCACCA | BC020742.1 |
| C5aR1 | F: TGGCCTTGGTCATCTTTGCA | R: GATGCTGTACAATGGACGTGAAC | BC008982.1 |
| CFH | F: TTGCACACAAGATGGATGGTCG | R: CATGTAACTGTGGTCTGCGCTT | Y00716.1 |
| Keap1 | F: TTCAGCTACACCCTGGAGGA | R: CTTGAAGACAGGGCTGGATG | BC002417.2 |
| Nrf2 | F: ACACGGTCCACAGCTCATC | R: TGCCTCCAAAGTATGTCAATCA | BC011558.1 |
Disclaimer/Publisher’s Note: The statements, opinions and data contained in all publications are solely those of the individual author(s) and contributor(s) and not of MDPI and/or the editor(s). MDPI and/or the editor(s) disclaim responsibility for any injury to people or property resulting from any ideas, methods, instructions or products referred to in the content. |
© 2025 by the authors. Licensee MDPI, Basel, Switzerland. This article is an open access article distributed under the terms and conditions of the Creative Commons Attribution (CC BY) license (https://creativecommons.org/licenses/by/4.0/).
Share and Cite
Dinice, L.; Cosimi, P.; Esposito, G.; Scarinci, F.; Cacciamani, A.; Cafiero, C.; Placentino, L.; Ripandelli, G.; Micera, A. Oxidative Stress and Complement Activation in Aqueous Cells and Vitreous from Patient with Vitreoretinal Diseases: Comparison Between Diabetic ERM and PDR. Antioxidants 2025, 14, 841. https://doi.org/10.3390/antiox14070841
Dinice L, Cosimi P, Esposito G, Scarinci F, Cacciamani A, Cafiero C, Placentino L, Ripandelli G, Micera A. Oxidative Stress and Complement Activation in Aqueous Cells and Vitreous from Patient with Vitreoretinal Diseases: Comparison Between Diabetic ERM and PDR. Antioxidants. 2025; 14(7):841. https://doi.org/10.3390/antiox14070841
Chicago/Turabian StyleDinice, Lucia, Pamela Cosimi, Graziana Esposito, Fabio Scarinci, Andrea Cacciamani, Concetta Cafiero, Luca Placentino, Guido Ripandelli, and Alessandra Micera. 2025. "Oxidative Stress and Complement Activation in Aqueous Cells and Vitreous from Patient with Vitreoretinal Diseases: Comparison Between Diabetic ERM and PDR" Antioxidants 14, no. 7: 841. https://doi.org/10.3390/antiox14070841
APA StyleDinice, L., Cosimi, P., Esposito, G., Scarinci, F., Cacciamani, A., Cafiero, C., Placentino, L., Ripandelli, G., & Micera, A. (2025). Oxidative Stress and Complement Activation in Aqueous Cells and Vitreous from Patient with Vitreoretinal Diseases: Comparison Between Diabetic ERM and PDR. Antioxidants, 14(7), 841. https://doi.org/10.3390/antiox14070841