
Molecular Response and Metabolic Reprogramming of the Spleen Coping with Cold Stress in the Chinese Soft-Shelled Turtle (Pelodiscus sinensis)

 ,
, 
Abstract
1. Introduction
2. Materials and Methods
2.1. Experimental Animals
2.2. Cold Stress Experiment and Sample Collection
2.3. Plasma Biochemical Parameters
2.4. Transcriptomic Analysis of Spleen
2.5. Metabolomic Analysis of Spleen
2.6. Combined Analysis of the Transcriptome and Metabolome
2.7. Validation of Transcriptomic Data
2.8. Statistical Analysis
3. Results
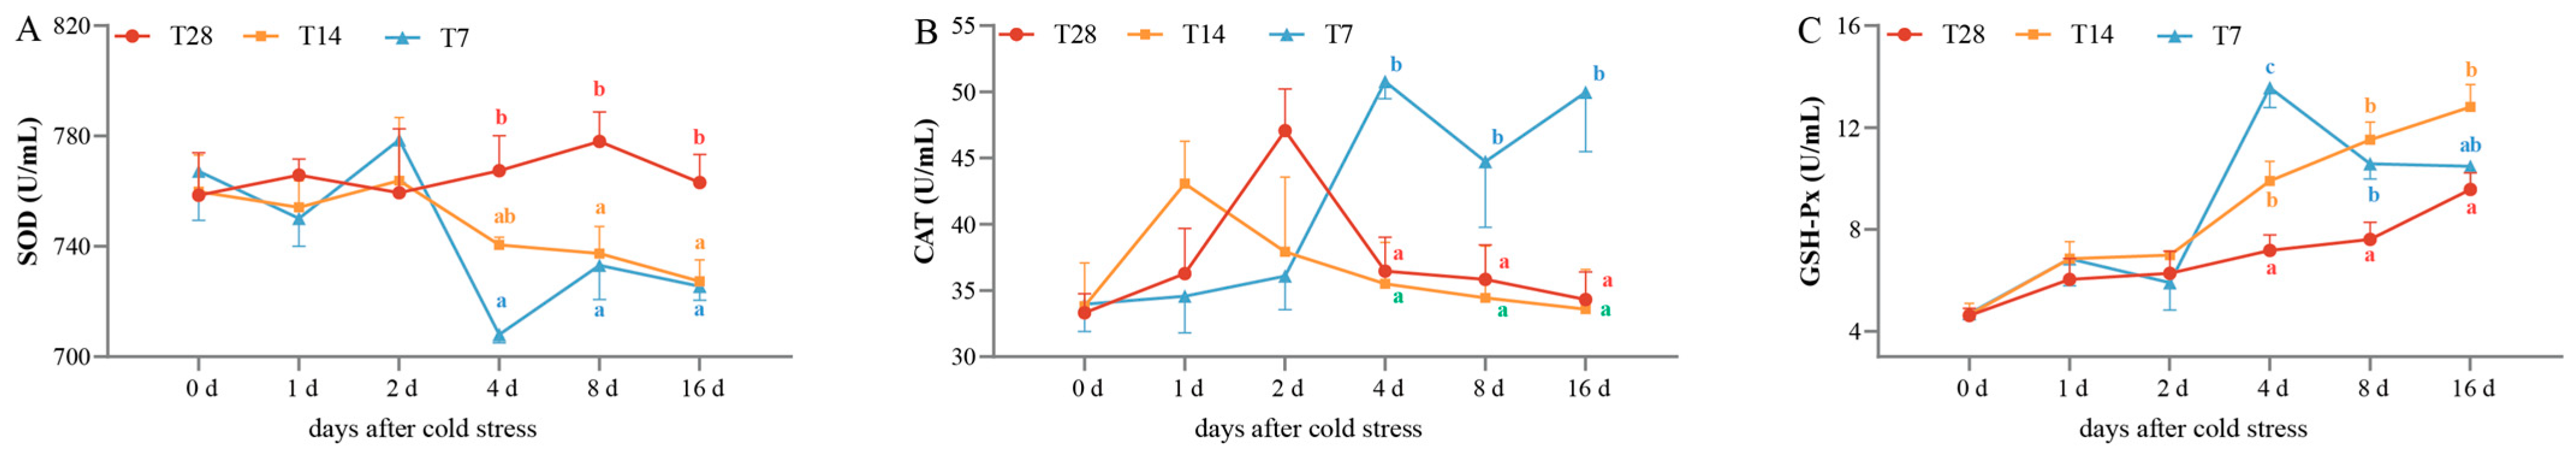
3.1. Changes in Plasma Antioxidant Enzymes Under Cold Stress
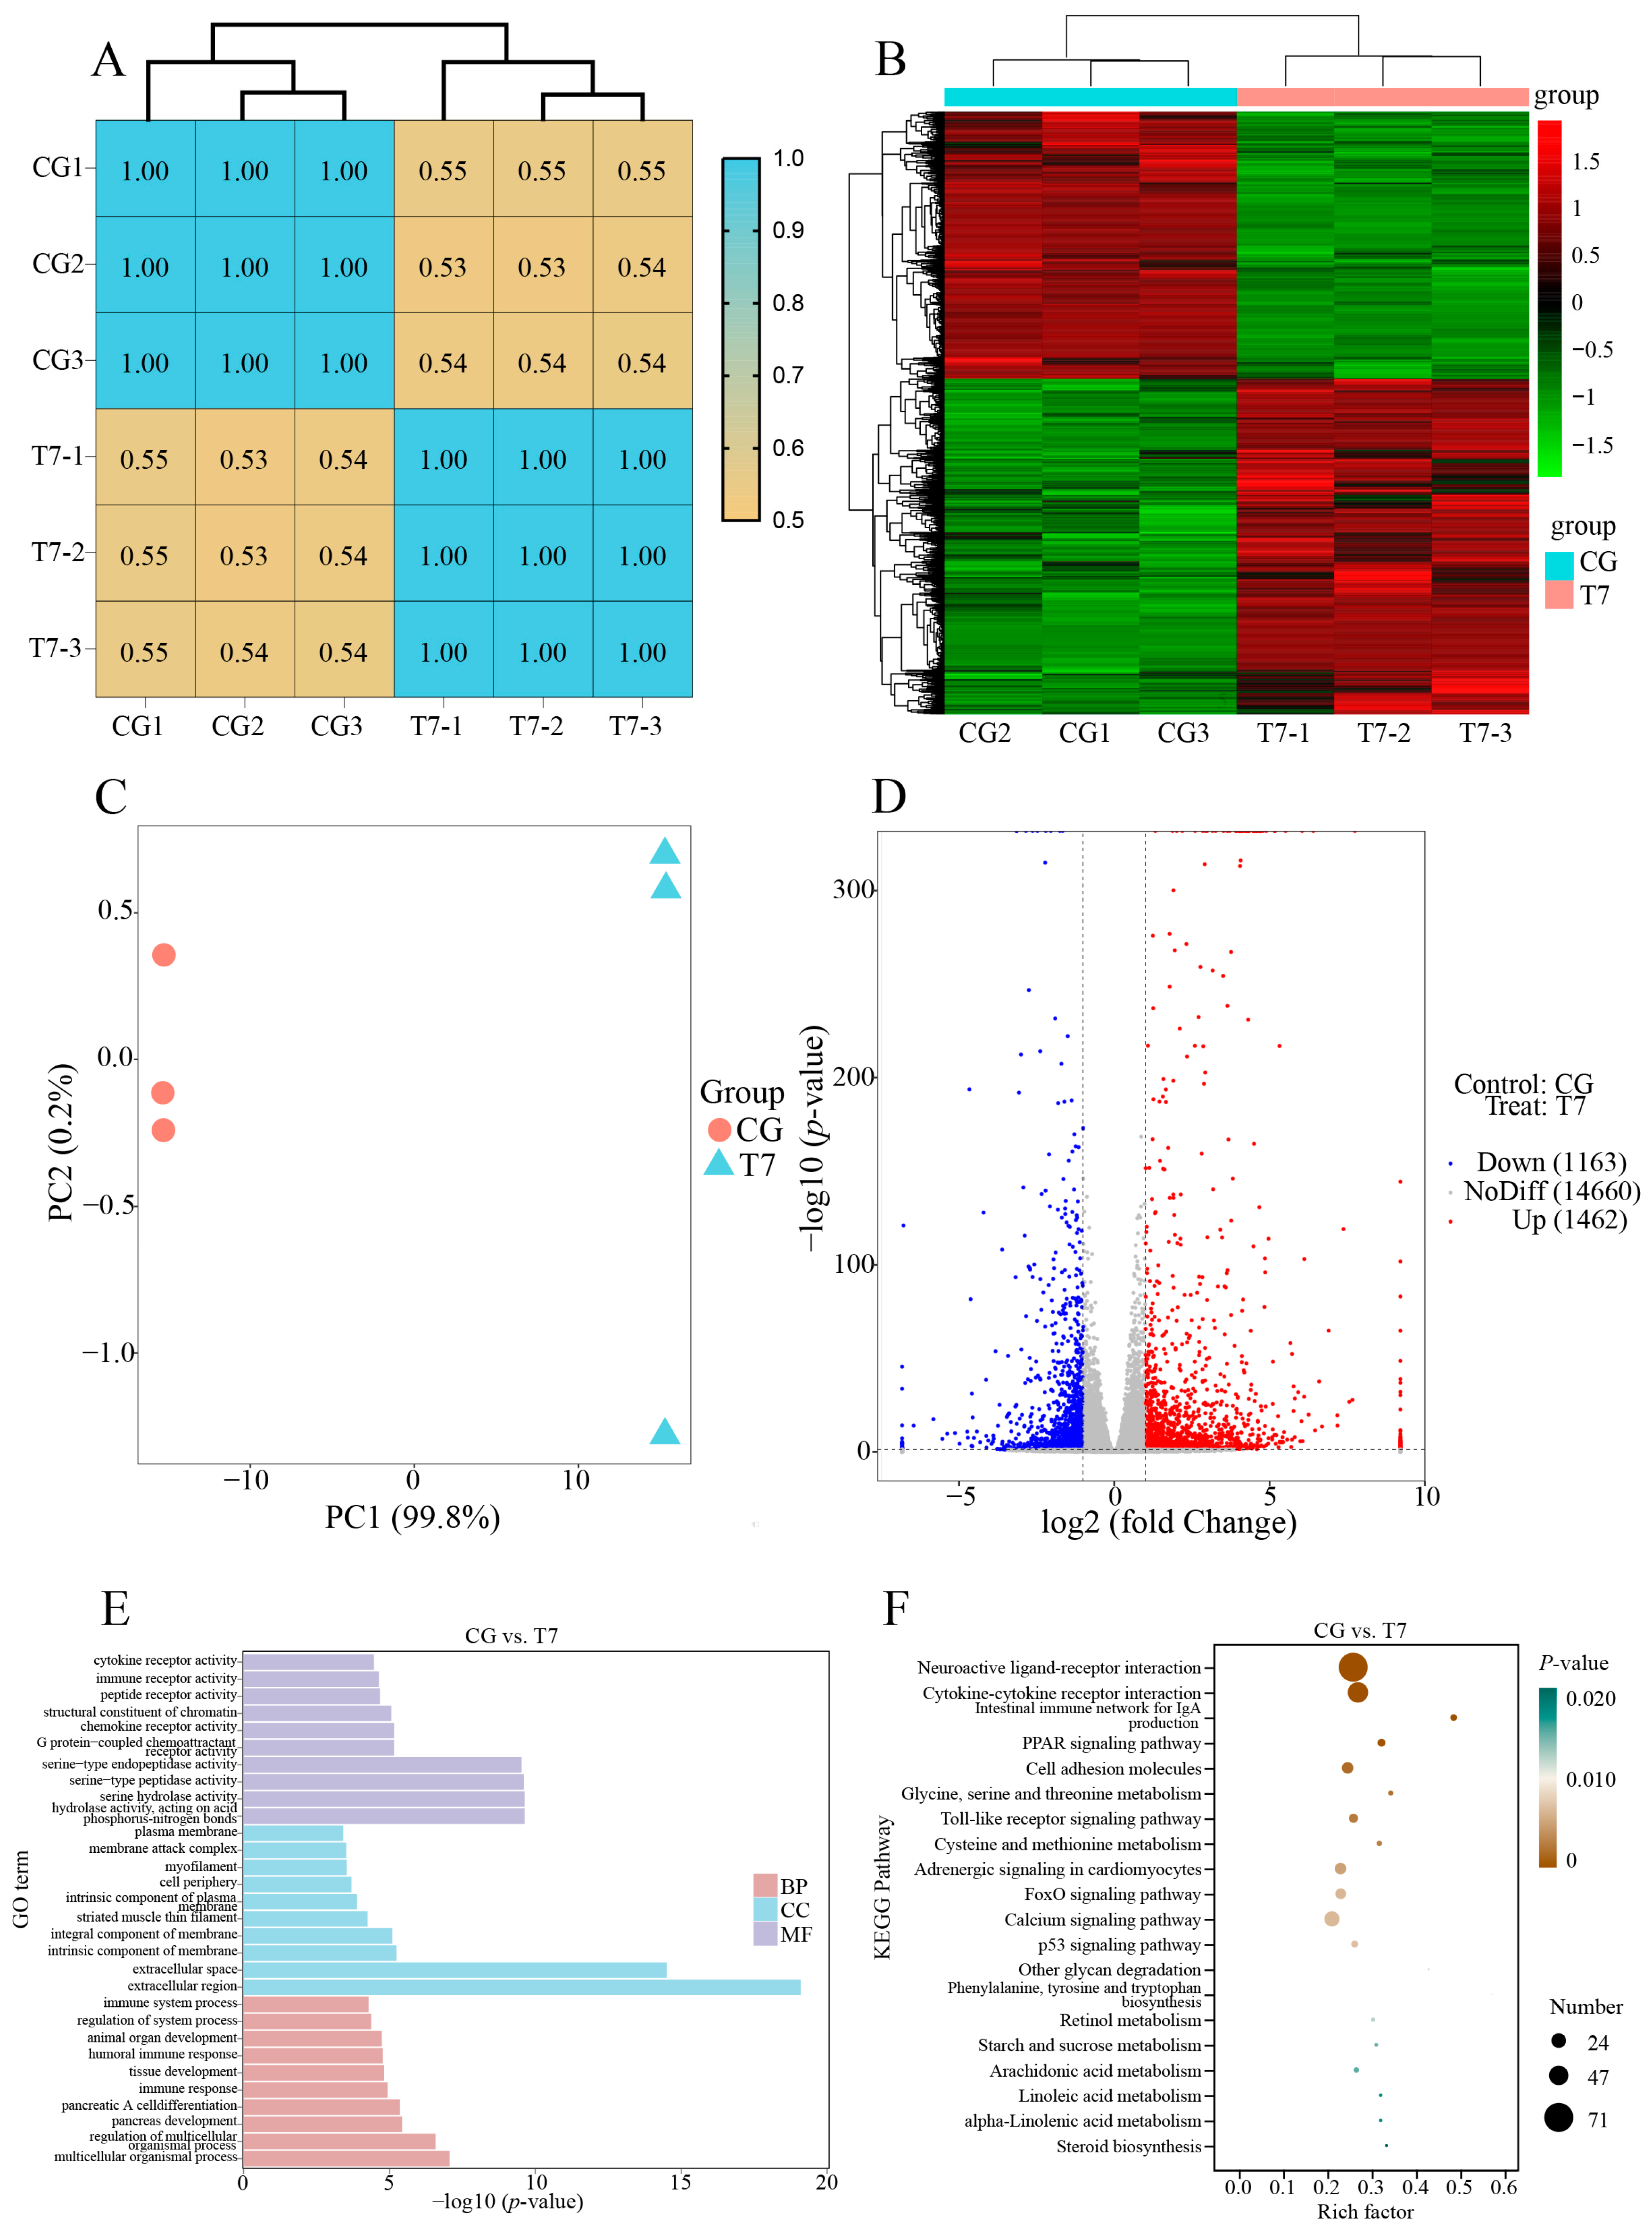
3.2. Effect of Cold Stress on Spleen Transcriptome
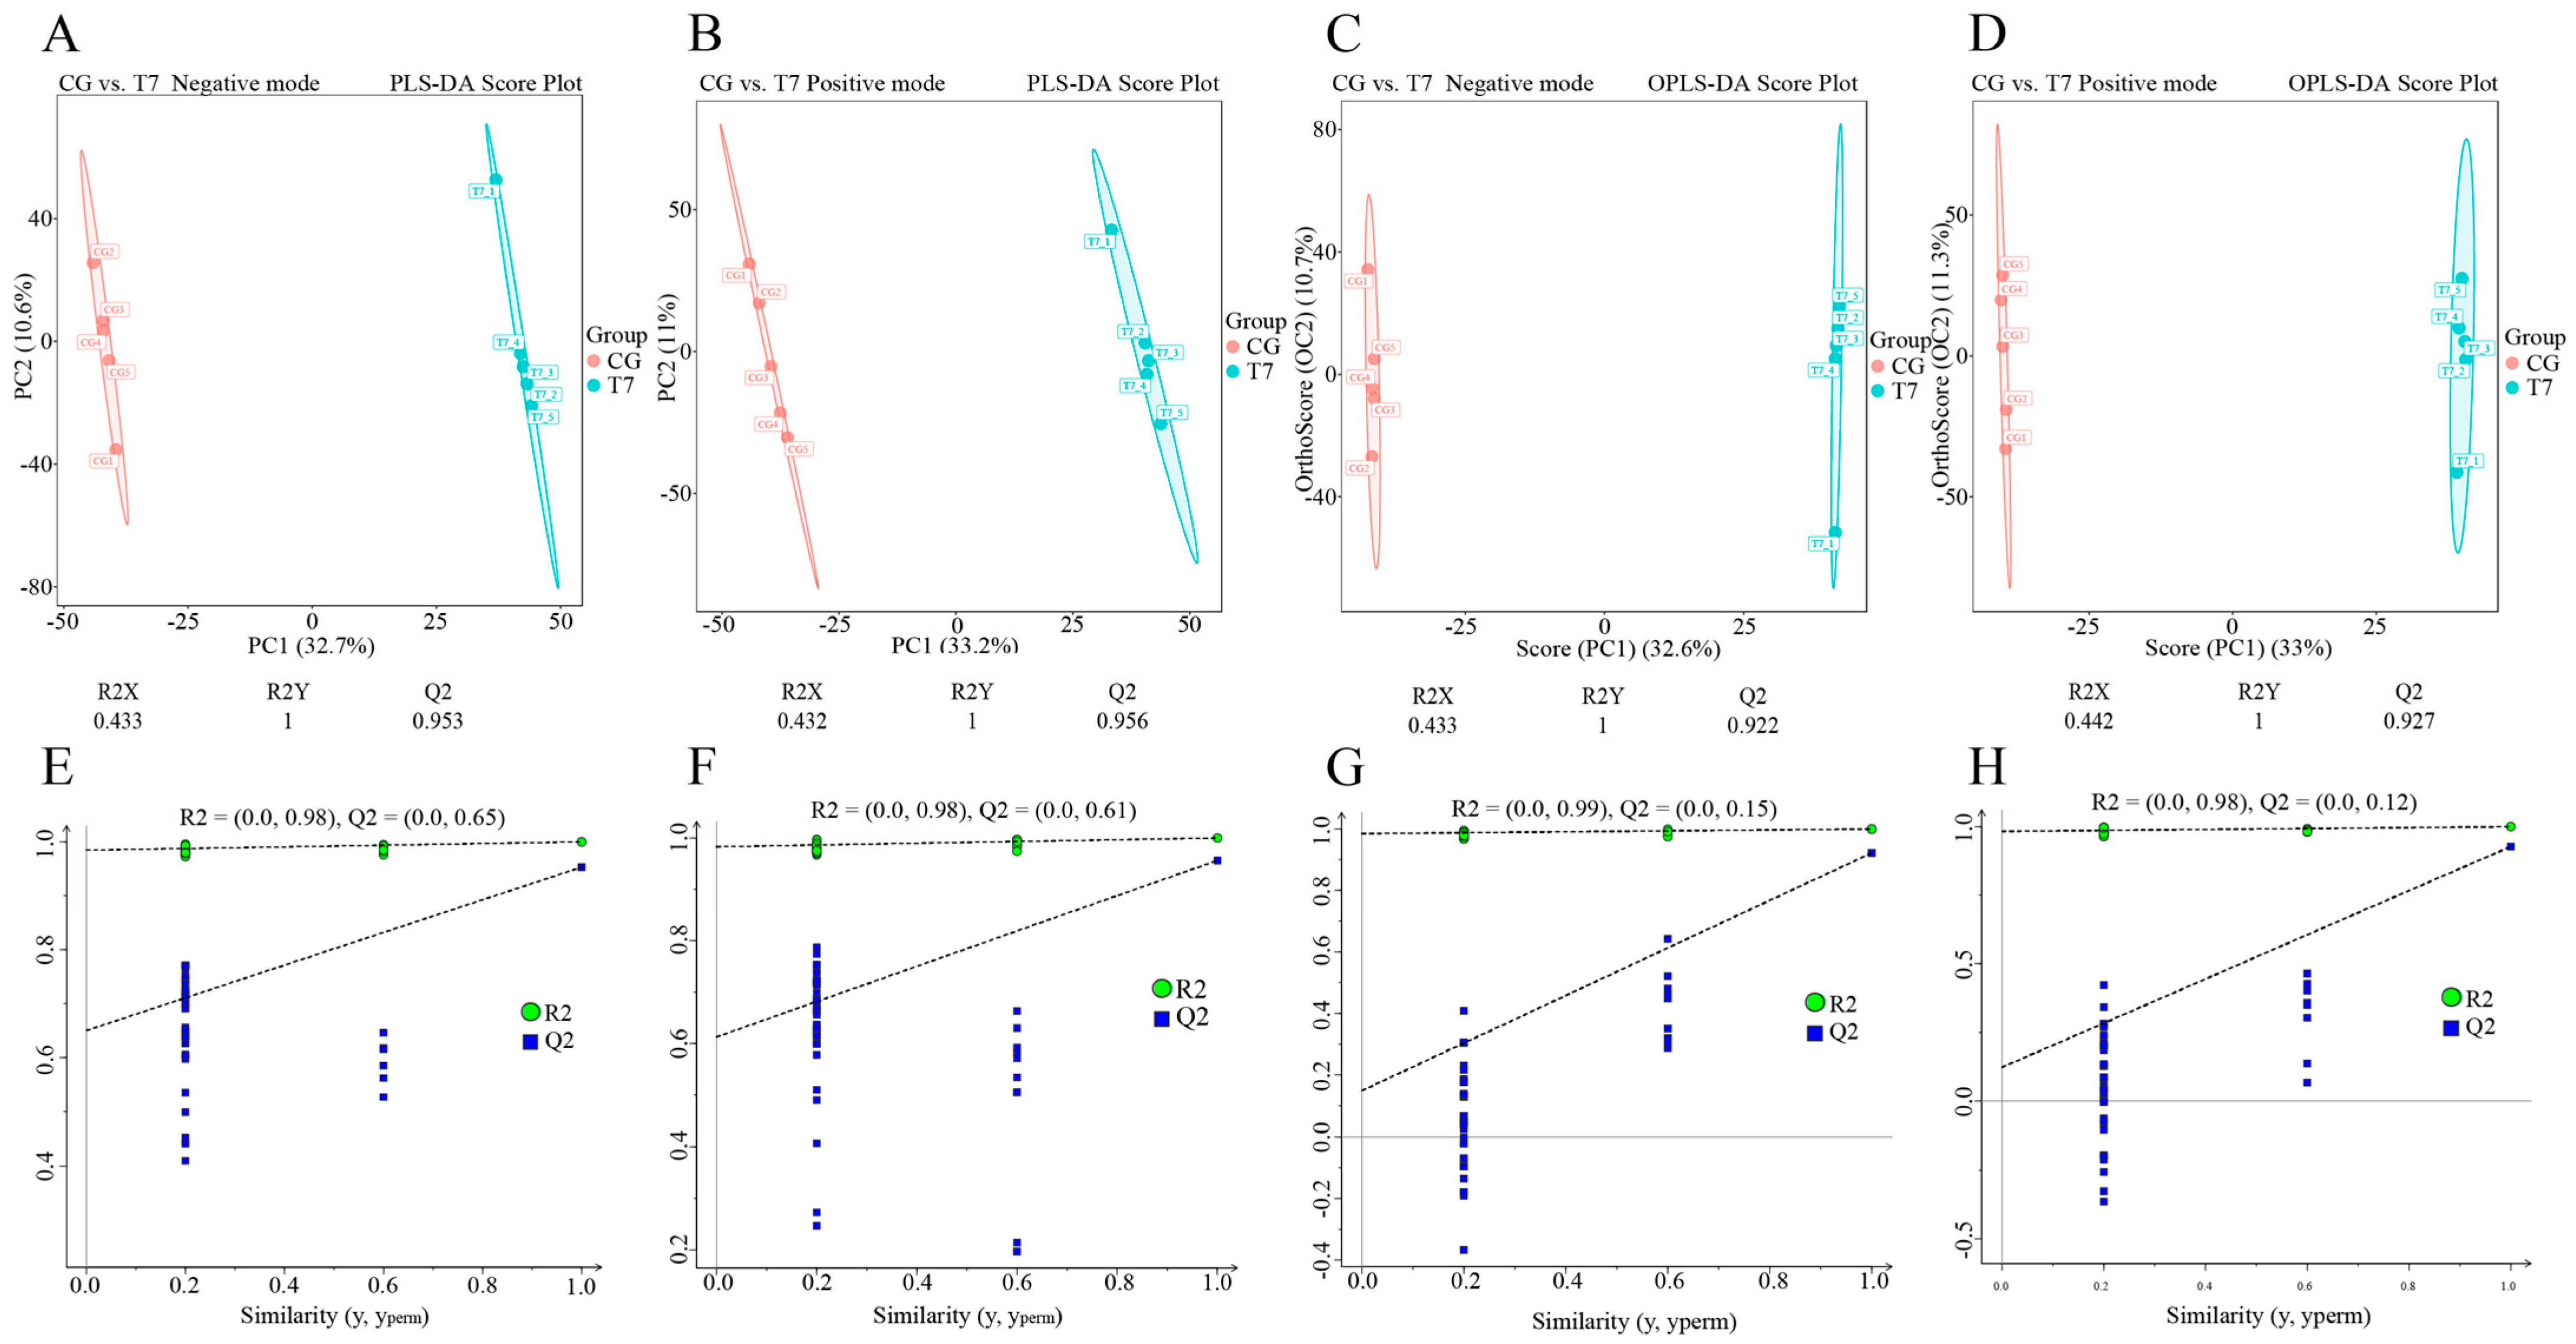
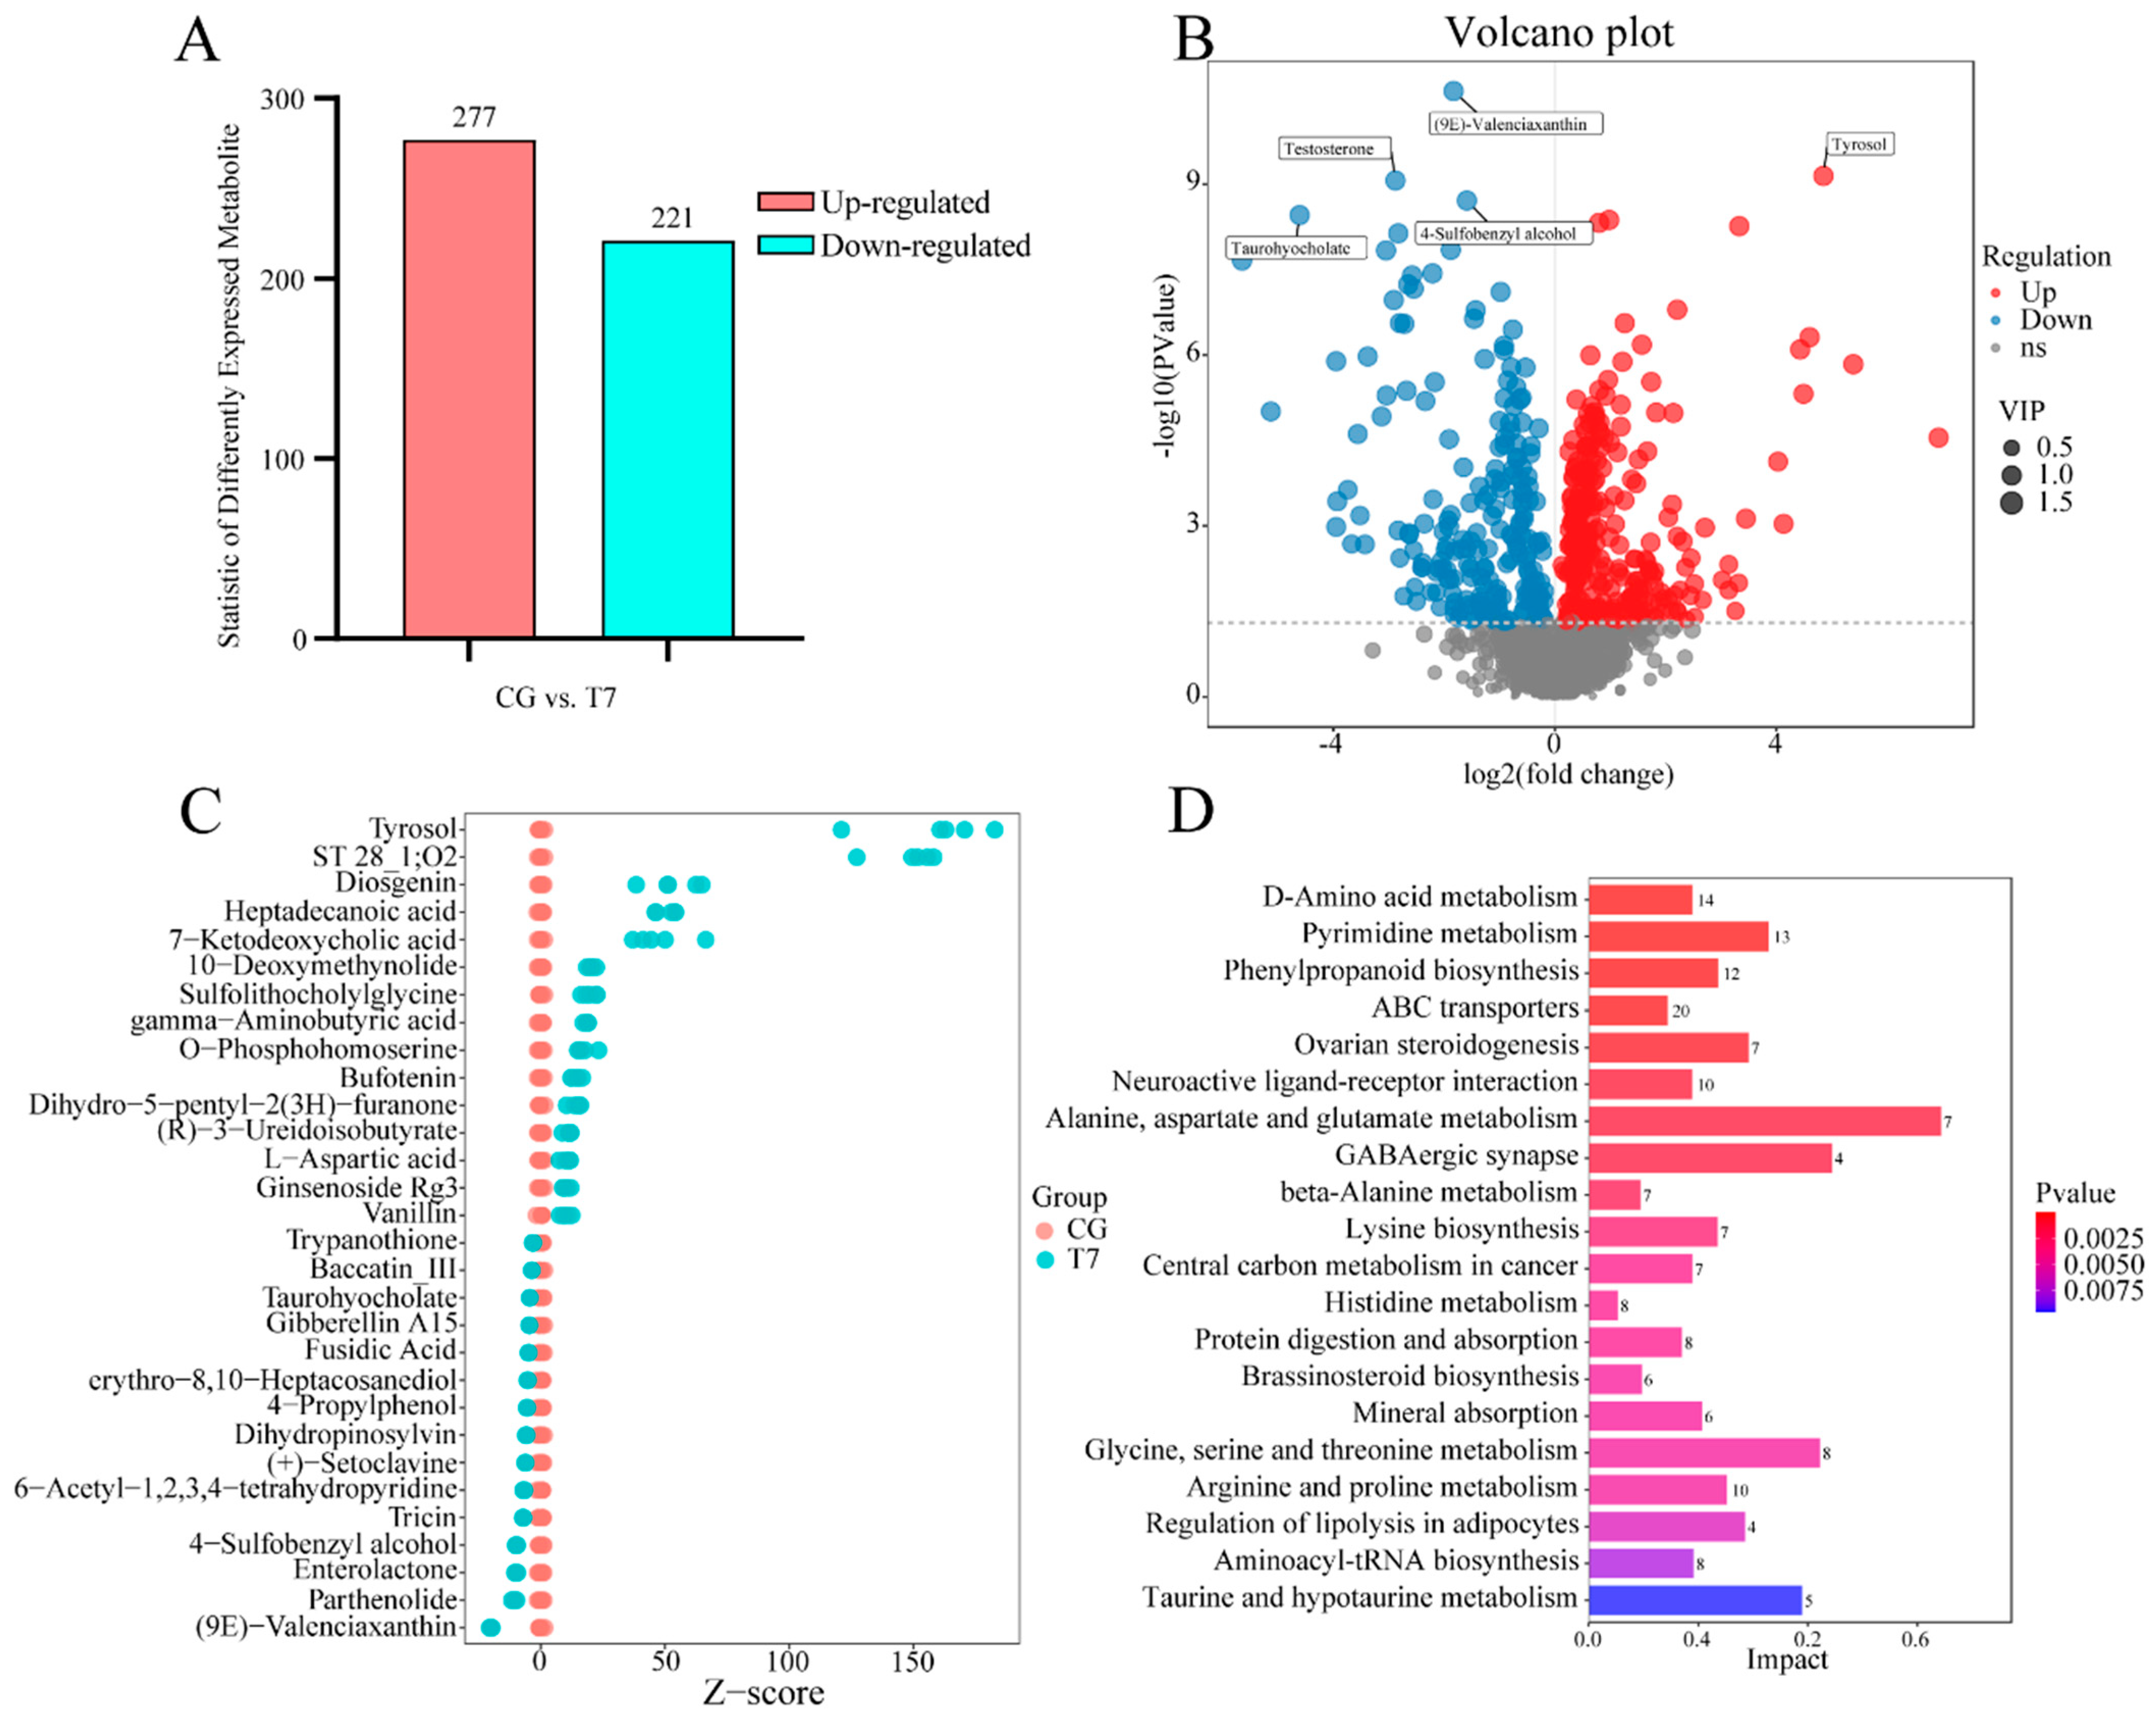
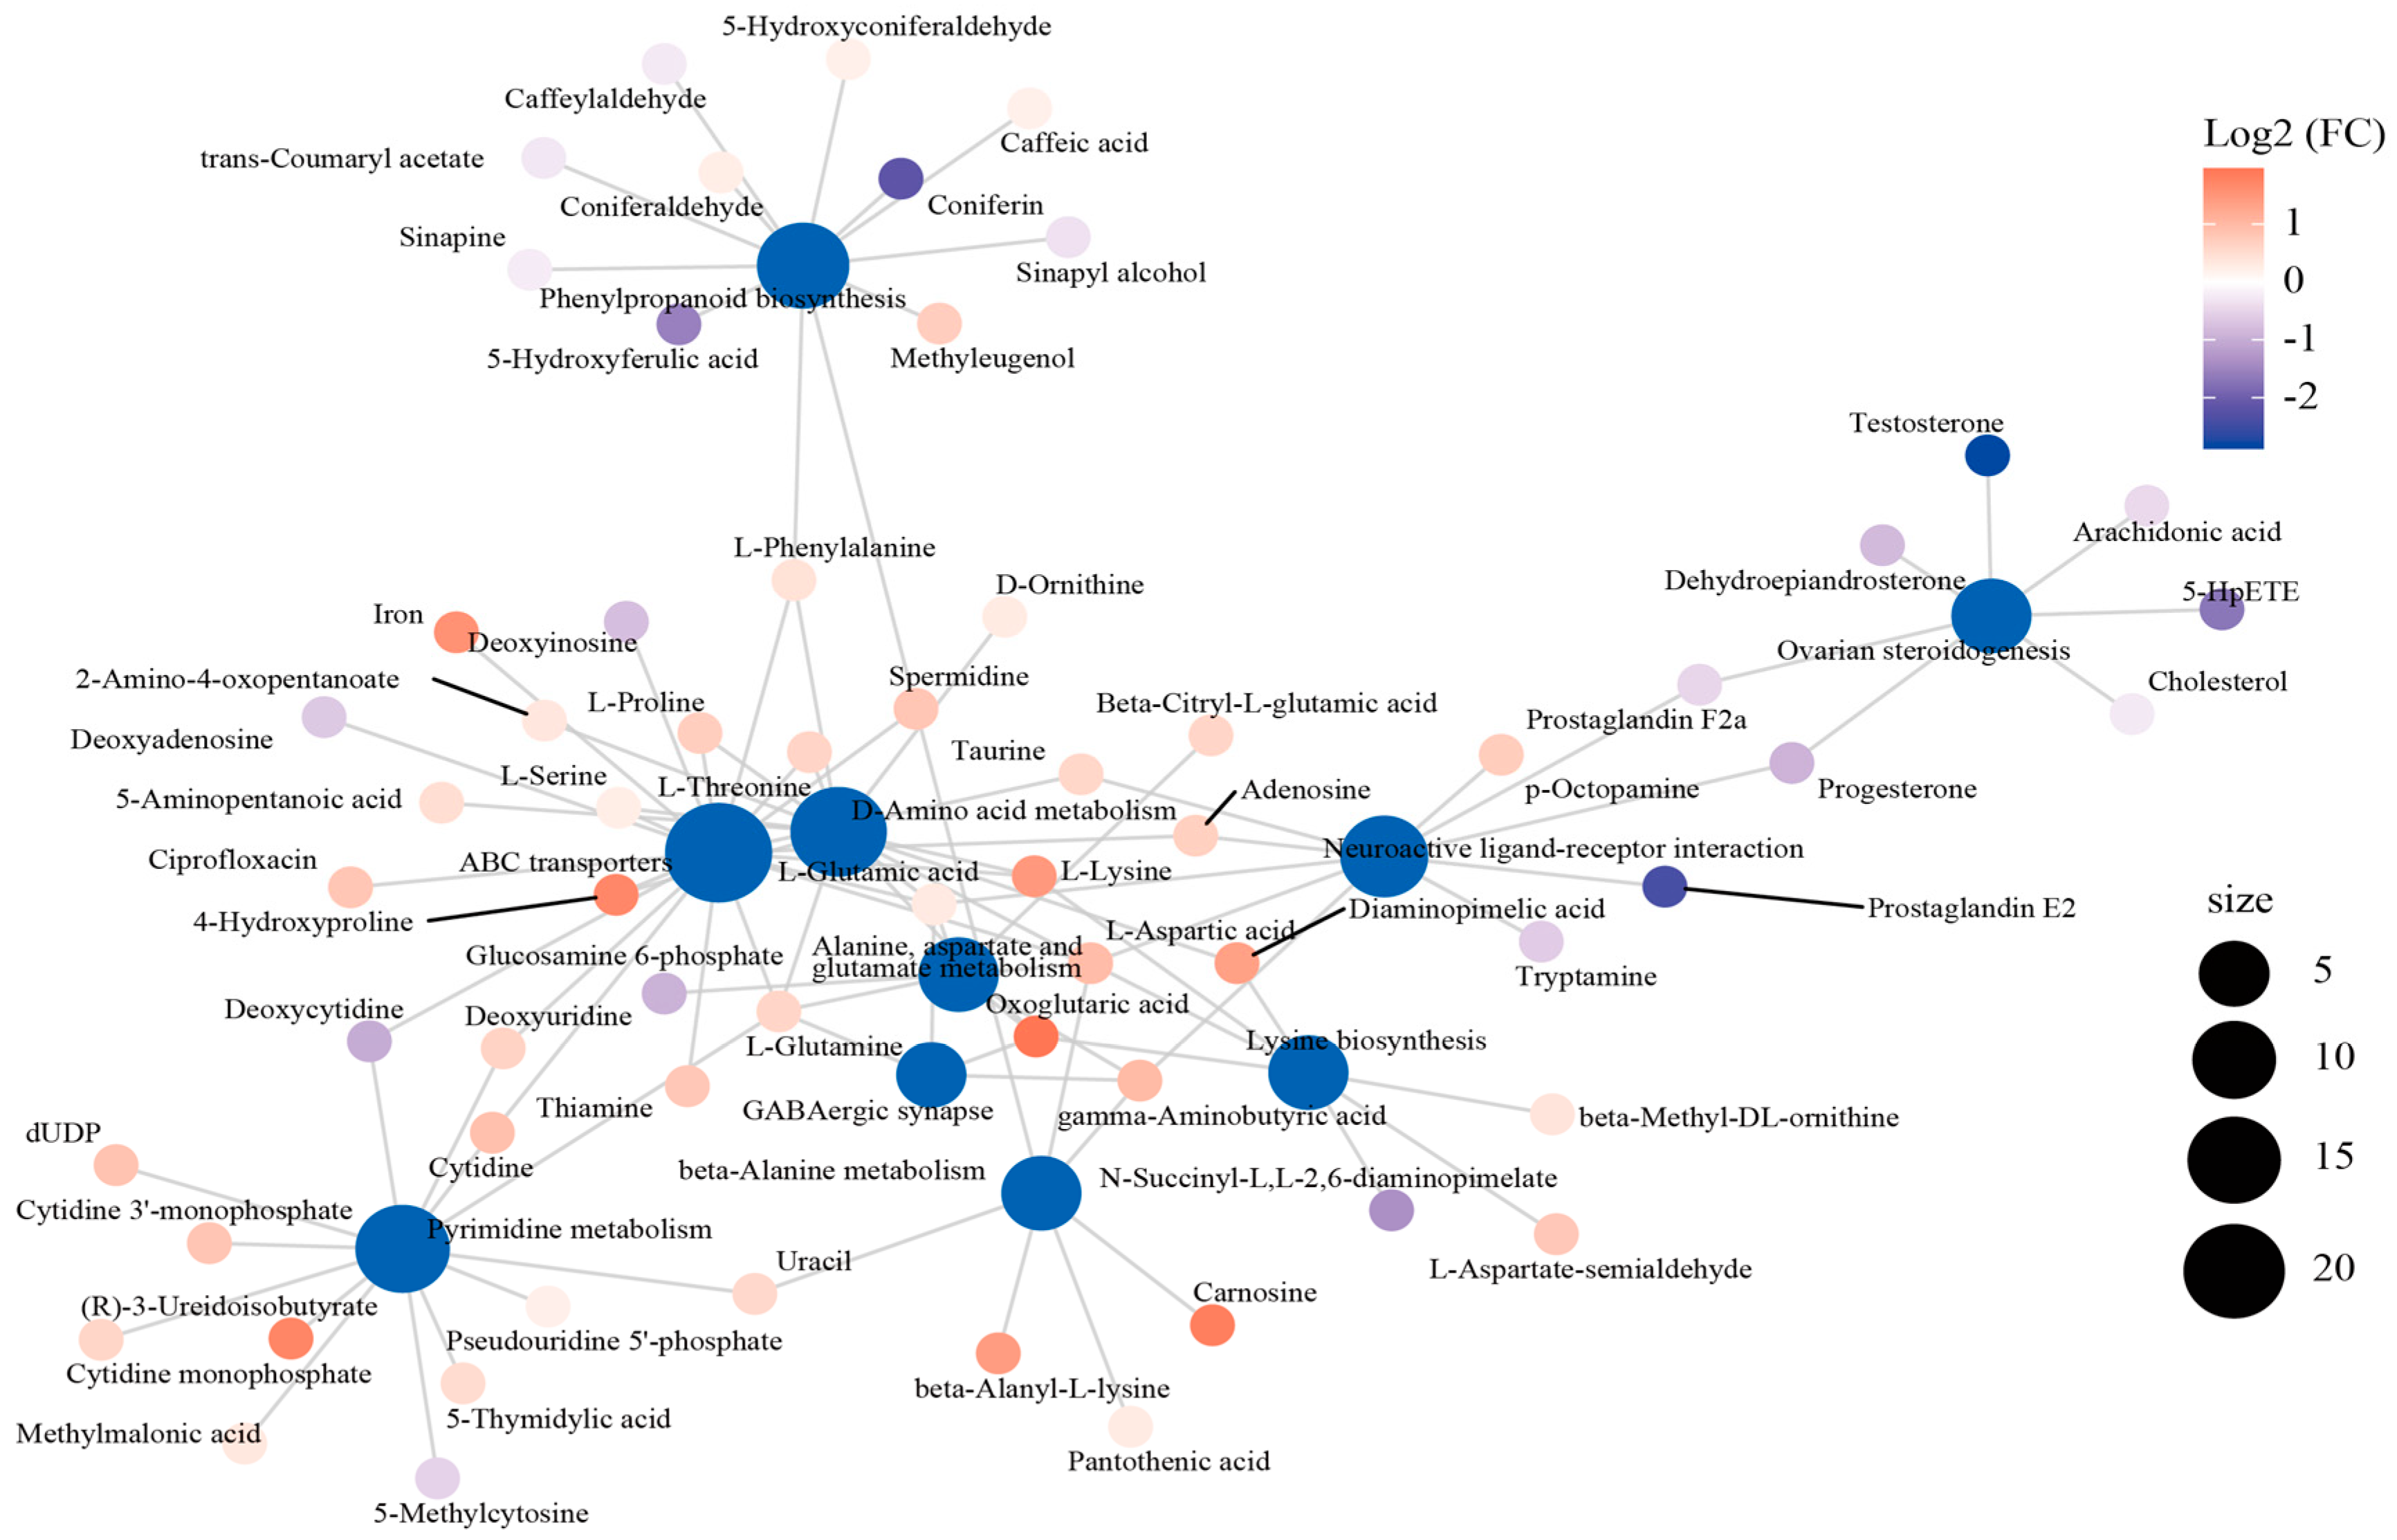
3.3. Effect of Cold Stress on Spleen Metabolome
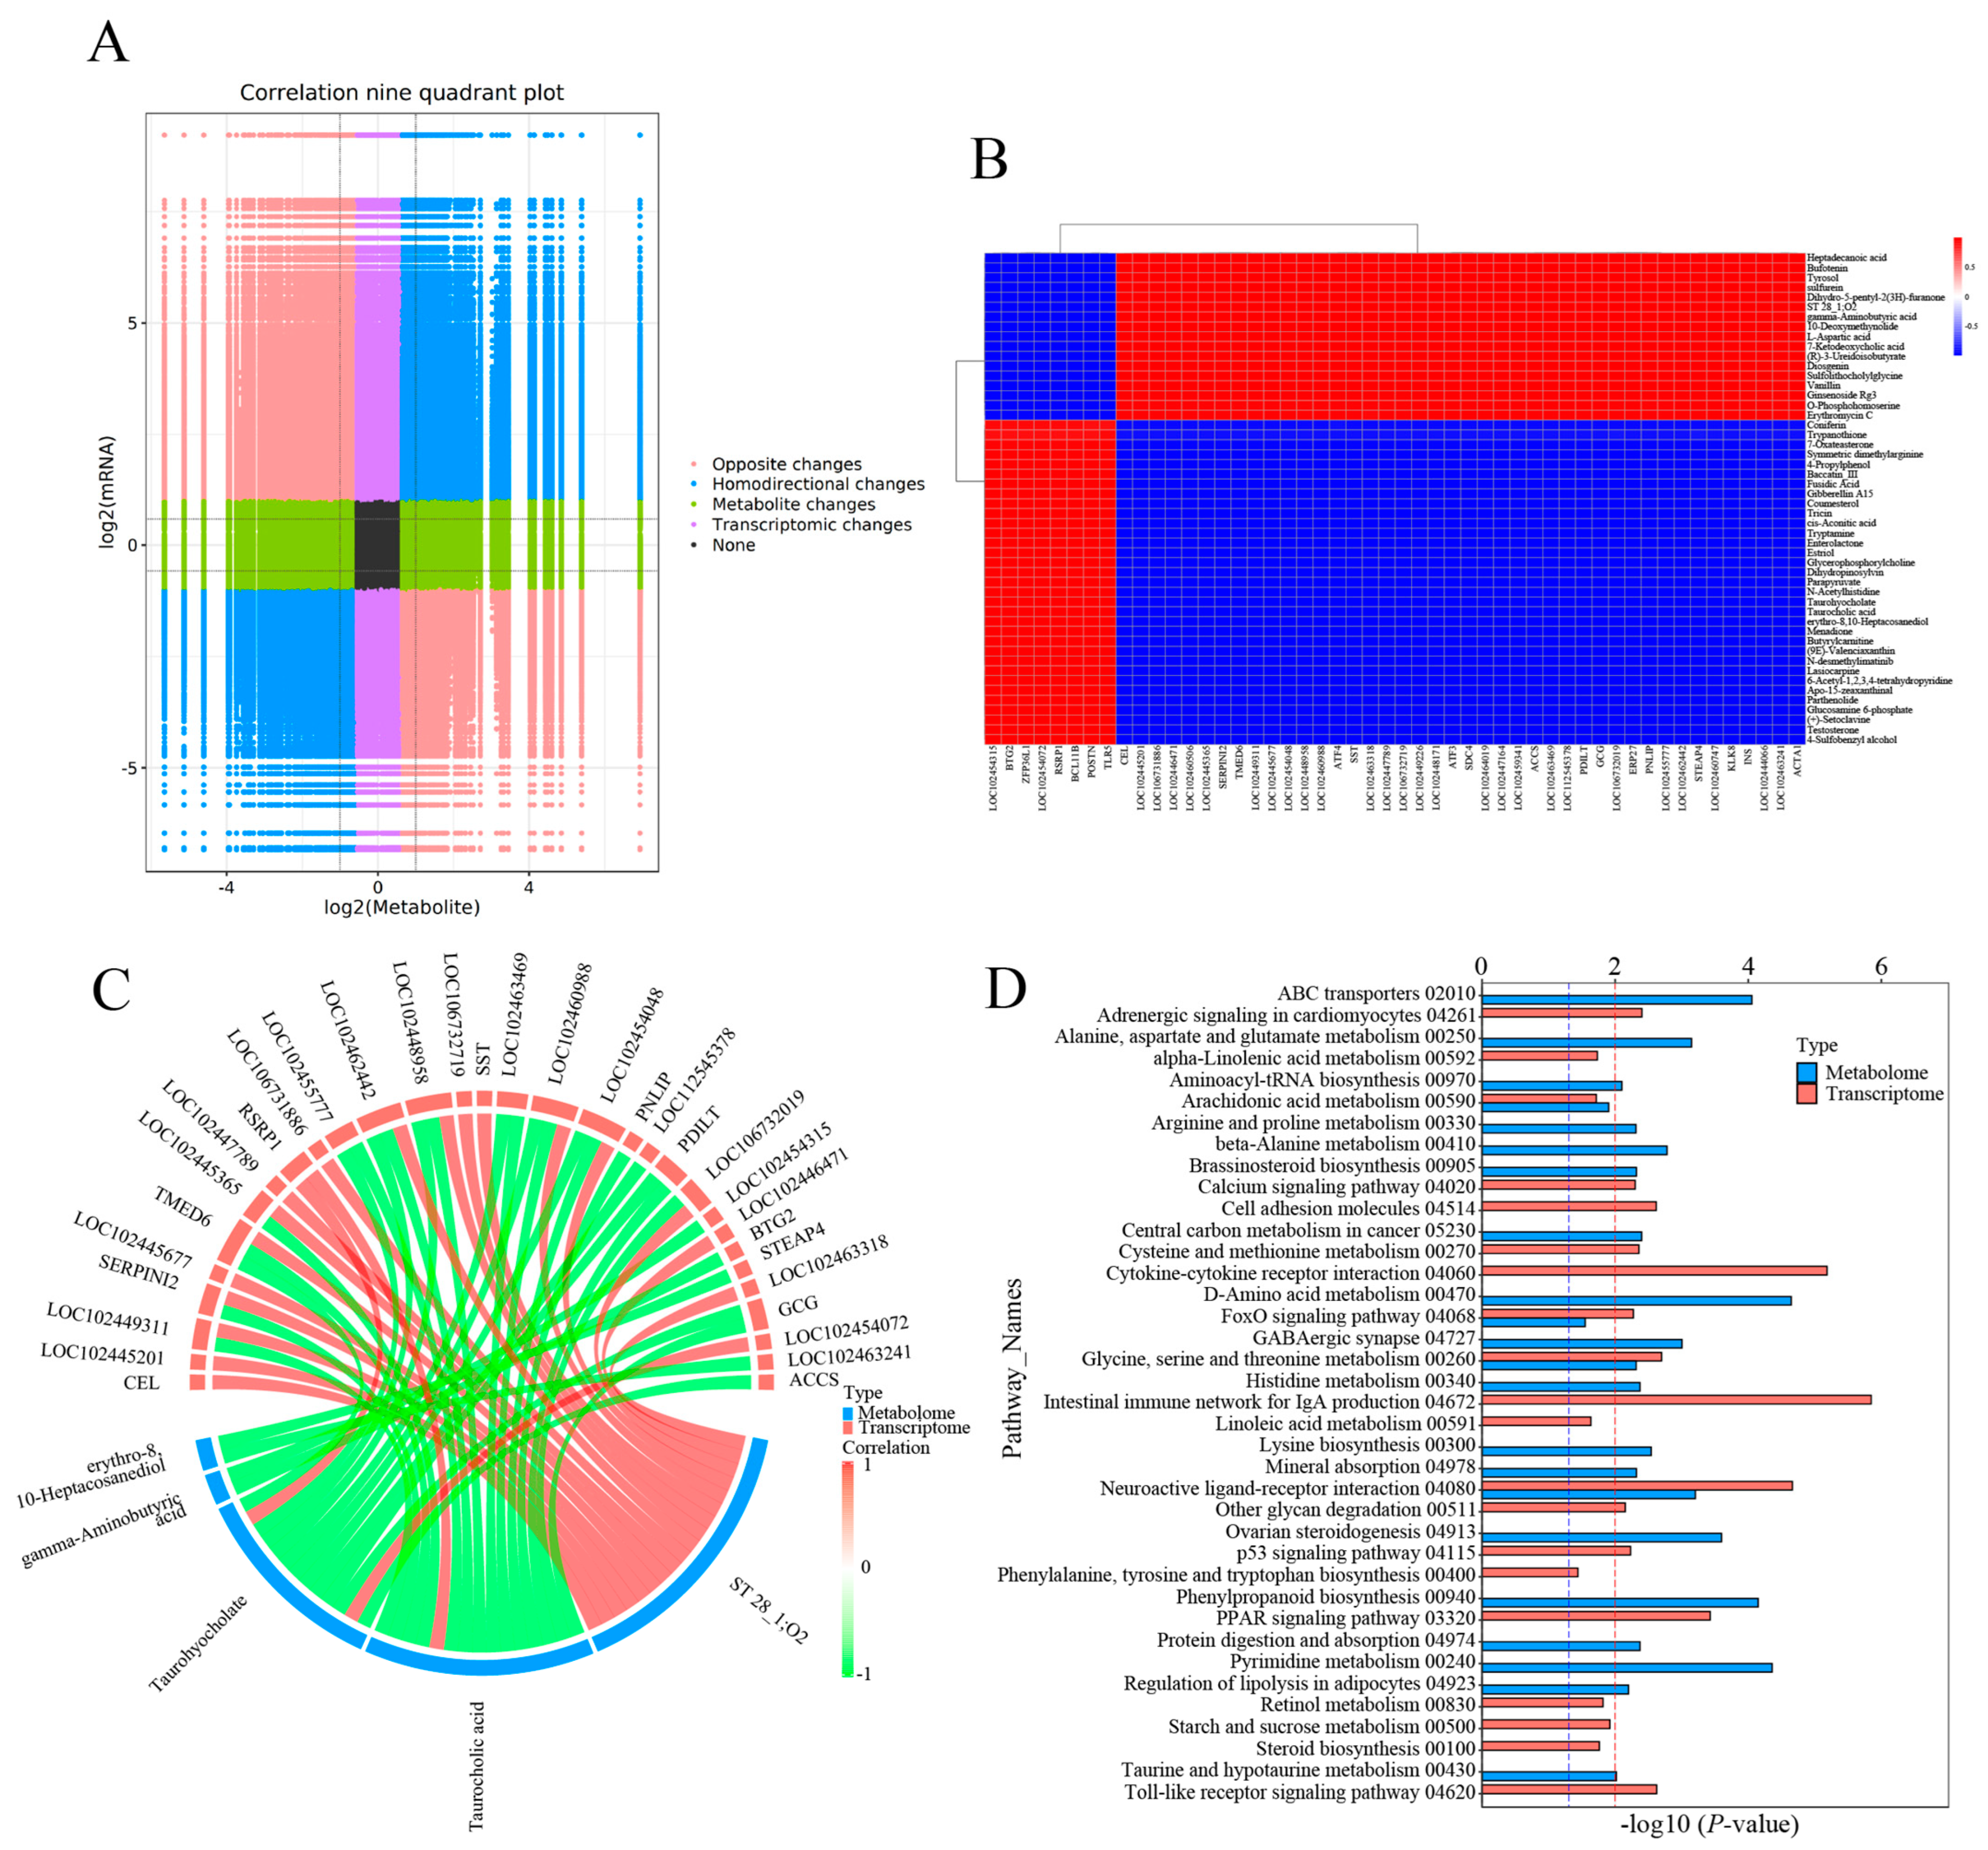
3.4. Joint Analysis of DEGs and DEMs
4. Discussion
4.1. Cold Stress Affected the Antioxidant Activities
4.2. Key Genes and Metabolites Responding to Cold Stress
4.3. Key Pathways Responding to Cold Stress
5. Conclusions
Supplementary Materials
Author Contributions
Funding
Institutional Review Board Statement
Data Availability Statement
Conflicts of Interest
References
- Tingley, M.P.; Huybers, P. Recent temperature extremes at high northern latitudes unprecedented in the past 600 years. Nature 2013, 496, 201–205. [Google Scholar] [CrossRef] [PubMed]
- Dey, M. The Influence of Low Temperature on the Immune System of Teleosts. Br. J. Biol. Stud. 2021, 1, 1–10. [Google Scholar] [CrossRef]
- Zhang, W.Y.; Chen, B.J.; Niu, C.J.; Yuan, L.; Jia, H.; Storey, K.B. Response of the Chinese Soft-Shelled Turtle to Acute Heat Stress: Insights From the Systematic Antioxidant Defense. Front. Physiol. 2019, 10, 710. [Google Scholar] [CrossRef]
- Li, R.X.; Amenyogbe, E.; Lu, Y.; Jin, J.H.; Xie, R.T.; Huang, J.S. Effects of low-temperature stress on serum biochemical indicators, intestinal microbiome, and transcriptome of juvenile golden pompano (Trachinotus ovatus). Aquac. Int. 2024, 32, 5551–5578. [Google Scholar] [CrossRef]
- Sun, Z.Z.; Tan, X.H.; Liu, Q.Y.; Ye, H.Q.; Zou, C.Y.; Xu, M.L.; Zhang, Y.F.; Ye, C.X. Physiological, immune responses and liver lipid metabolism of orange-spotted grouper (Epinephelus coioides) under cold stress. Aquaculture 2019, 498, 545–555. [Google Scholar] [CrossRef]
- OuYang, J.H.; Gao, Y.C.; Wei, Y.F.; Huang, H.P.; Ge, Y.; Zhao, J.; Gong, S.P. Transcriptome analysis reveals reduced immunity and metabolic level under cold stress in Mauremys mutica. Front. Mar. Sci. 2023, 10, 1224166. [Google Scholar] [CrossRef]
- Sumaila, U.R.; Cheung, W.W.L.; Lam, V.W.Y.; Pauly, D.; Herrick, S. Climate change impacts on the biophysics and economics of world fisheries. Nat. Clim. Change 2011, 1, 449–456. [Google Scholar] [CrossRef]
- Jakiul Islam, M.; James Slater, M.; Thiele, R.; Kunzmann, A. Influence of extreme ambient cold stress on growth, hematological, antioxidants, and immune responses in European seabass, Dicentrarchus labrax acclimatized at different salinities. Ecol. Indic. 2021, 122, 107280. [Google Scholar] [CrossRef]
- Xu, J.; Qin, C.J.; Xie, J.; Wang, J.; He, Y.; Tan, J.J.; Shi, X.T. Transcriptome analysis of Chinese sucker (Myxocyprinus asiaticus) head kidney and discovery of key immune-related genes to cold stress after swimming fatigue. Comp. Biochem. Physiol. Part D Genom. Proteom. 2023, 47, 101104. [Google Scholar] [CrossRef]
- Windisch, H.S.; Lucassen, M.; Frickenhaus, S. Evolutionary force in confamiliar marine vertebrates of different temperature realms: Adaptive trends in zoarcid fish transcriptomes. BMC Genom. 2012, 13, 549. [Google Scholar] [CrossRef]
- Guo, H.M.; Whitehouse, L.; Danzmann, R.; Dixon, B. Effects of juvenile thermal preconditioning on the heat-shock, immune, and stress responses of rainbow trout upon a secondary thermal challenge. Comp. Biochem. Physiol. A Mol. Integr. Physiol. 2023, 280, 111413. [Google Scholar] [CrossRef] [PubMed]
- de Freitas Souza, C.; Baldissera, M.D.; Barroso, D.C.; Val, A.L.; Baldisserotto, B. Purine levels and purinergic signaling in plasma and spleen of Brycon amazonicus exposed to acute heat thermal stress: An attempt to regulate the immune response. J. Therm. Biol. 2020, 89, 102569. [Google Scholar] [CrossRef] [PubMed]
- Elgendy, M.; Moustafa, M.; Gaafar, A.; Ibrahim, T. Impacts of extreme cold water conditions and some bacterial infections on earthen-pond cultured Nile Tilapia, Oreochromis niloticus. Res. J. Pharm. Biol. Chem. Sci. 2015, 6, 136–145. [Google Scholar]
- Sun, B.; Sun, B.G.; Zhang, B.B.; Sun, L. Temperature induces metabolic reprogramming in fish during bacterial infection. Front. Immunol. 2022, 13, 1010948. [Google Scholar] [CrossRef] [PubMed]
- Faught, E.; Schaaf, M.J.M. Molecular mechanisms of the stress-induced regulation of the inflammatory response in fish. Gen. Comp. Endocrinol. 2024, 345, 114387. [Google Scholar] [CrossRef] [PubMed]
- Wang, S.; Li, M.; Jiang, Y.; Sun, C.; Wu, G.Q.; Yang, C.Y.; Liu, W.L.; Pan, Y.F. Transcriptome analysis reveals immune regulation in the spleen of koi carp (Cyprinus carpio Koi) during Aeromonas hydrophila infection. Mol. Immunol 2023, 162, 11–20. [Google Scholar] [CrossRef] [PubMed]
- Peng, T.; Hu, T.J.; Lin, Y.; Tang, Z.S.; Lan, Z. Effects of Low Temperature Stress on Indices of Biochemistry, Immunity and Antioxidation in Nile Tilapia. Fish. Sci. 2012, 31, 259–263. [Google Scholar]
- Han, P.; Yan, W.J.; Liu, X.M.; Wang, X.B. Differential environmental-induced heat stresses cause the structural and molecular changes in the spleen of Japanese flounder (Paralichthys olivaceus). Aquaculture 2024, 581, 740490. [Google Scholar] [CrossRef]
- Dong, F.; Sun, Y.L.; Qian, Y.X.; Chen, Q.; He, J.L.; Wang, J.T.; Han, T.; Zhang, X.M.; Deng, Y.T. Integrated analysis of transcriptome and metabolome reveals the regulatory mechanism of largemouth bass (Micropterus salmoides) in response to Nocardia seriolae infection. Fish Shellfish Immunol. 2024, 145, 109322. [Google Scholar] [CrossRef]
- Ren, X.Y.; Yu, Z.X.; Xu, Y.; Zhang, Y.B.; Mu, C.M.; Liu, P.; Li, J. Integrated transcriptomic and metabolomic responses in the hepatopancreas of kuruma shrimp (Marsupenaeus japonicus) under cold stress. Ecotoxicol. Environ. Saf. 2020, 206, 111360. [Google Scholar] [CrossRef] [PubMed]
- Luo, M.K.; Zhu, W.B.; Liang, Z.Y.; Feng, B.B.; Xie, X.D.; Li, Y.L.; Liu, Y.; Shi, X.L.; Fu, J.J.; Miao, L.H.; et al. High-temperature stress response: Insights into the molecular regulation of American shad (Alosa sapidissima) using a multi-omics approach. Sci. Total Environ. 2024, 916, 170329. [Google Scholar] [CrossRef]
- Lv, Z.; Hu, Y.Z.; Tan, J.; Wang, X.Q.; Liu, X.Y.; Zeng, C. Comparative Transcriptome Analysis Reveals the Molecular Immunopathogenesis of Chinese Soft-Shelled Turtle (Trionyx sinensis) Infected with Aeromonas hydrophila. Biology 2021, 10, 1218. [Google Scholar] [CrossRef] [PubMed]
- Wang, D.; Gao, H.Q. China Fishery Statistical Yearbook; China Agriculture Press: Beijing, China, 2024; p. 24. [Google Scholar]
- Ai, X.Q.; Lin, R.; Ali, Z.S.; Zhu, Q.J.; Ding, L.; Shi, H.T.; Hong, M.L. Seasonal changes in hepatic lipid metabolism and apoptosis in Chinese soft-shelled turtle (Pelodiscus sinensis). Comp. Biochem. Physiol. C Toxicol. Pharmacol. 2024, 280, 109883. [Google Scholar] [CrossRef] [PubMed]
- Zhang, Z.B.; Chen, B.J.; Yuan, L.; Niu, C.J. Acute cold stress improved the transcription of pro-inflammatory cytokines of Chinese soft-shelled turtle against Aeromonas hydrophila. Dev. Comp. Immunol. 2015, 49, 127–137. [Google Scholar] [CrossRef] [PubMed]
- Ji, L.Q.; Chen, C.; Zhu, J.X.; Hong, X.Y.; Liu, X.L.; Wei, C.Q.; Zhu, X.P.; Li, W. Integrated time-series biochemical, transcriptomic, and metabolomic analyses reveal key metabolites and signaling pathways in the liver of the Chinese soft-shelled turtle (Pelodiscus sinensis) against Aeromonas hydrophila infection. Front. Immunol. 2024, 15, 1376860. [Google Scholar] [CrossRef] [PubMed]
- Rasmussen, J.A.; Villumsen, K.R.; Ernst, M.; Hansen, M.; Forberg, T.; Gopalakrishnan, S.; Gilbert, M.T.P.; Bojesen, A.M.; Kristiansen, K.; Limborg, M.T. A multi-omics approach unravels metagenomic and metabolic alterations of a probiotic and synbiotic additive in rainbow trout (Oncorhynchus mykiss). Microbiome 2022, 10, 21. [Google Scholar] [CrossRef]
- Houghton, S.G.; Cockerill, F.R., III. Real-time PCR: Overview and applications. Surgery 2006, 139, 1–5. [Google Scholar] [CrossRef]
- Sonna, L.A.; Fujita, J.; Gaffin, S.L.; Lilly, C.M. Invited review: Effects of heat and cold stress on mammalian gene expression. J. Appl. Physiol. (1985) 2002, 92, 1725–1742. [Google Scholar] [CrossRef]
- Xu, D.F.; Wu, J.X.; Sun, L.J.; Qin, X.M.; Fan, X.P.; Zheng, X.X. Combined stress of acute cold exposure and waterless duration at low temperature induces mortality of shrimp Litopenaeus vannamei through injuring antioxidative and immunological response in hepatopancreas tissue. J. Therm. Biol. 2021, 100, 103080. [Google Scholar] [CrossRef]
- Zhang, J.; Wang, Q.H.; Miao, B.B.; Wu, R.X.; Li, Q.Q.; Tang, B.G.; Liang, Z.B.; Niu, S.F. Liver transcriptome analysis reveal the metabolic and apoptotic responses of Trachinotus ovatus under acute cold stress. Fish Shellfish Immunol. 2024, 148, 109476. [Google Scholar] [CrossRef] [PubMed]
- Ighodaro, O.M.; Akinloye, O.A. First line defence antioxidants-superoxide dismutase (SOD), catalase (CAT) and glutathione peroxidase (GPX): Their fundamental role in the entire antioxidant defence grid. Alex. J. Med. 2018, 54, 287–293. [Google Scholar] [CrossRef]
- Van der Oost, R.; Beyer, J.; Vermeulen, N.P. Fish bioaccumulation and biomarkers in environmental risk assessment: A review. Environ. Toxicol. Pharmacol. 2003, 13, 57–149. [Google Scholar] [CrossRef]
- Meng, X.L.; Liu, P.; Li, J.; Gao, B.Q.; Chen, P. Physiological responses of swimming crab Portunus trituberculatus under cold acclimation: Antioxidant defense and heat shock proteins. Aquaculture 2014, 434, 11–17. [Google Scholar] [CrossRef]
- Zhao, F.Q.; Zhang, Z.W.; Qu, J.P.; Yao, H.D.; Li, M.; Li, S.; Xu, S.W. Cold stress induces antioxidants and Hsps in chicken immune organs. Cell Stress Chaperones 2014, 19, 635–648. [Google Scholar] [CrossRef]
- Yu, J.Y.; Yi, S.K.; Yang, G.L.; Wang, W.M. Integrated analysis of transcriptomic and physiological responses to cold stress in Macrobrachium rosenbergii. Aquac. Rep. 2024, 36, 102042. [Google Scholar] [CrossRef]
- Liu, T.Y.; Li, L.; Yang, Y.C.; Li, J.R.; Yang, X.T.; Li, L.; Zheng, Z.Y.; Yang, B.Y.; Zhang, P.Y.; Liu, H.Y. Effects of chronic cold stress and thermal stress on growth performance, hepatic apoptosis, oxidative stress, immune response and gut microbiota of juvenile hybrid sturgeon (Acipenser baerii ♀ × A. schrenkii ♂). Fish Shellfish Immunol. 2025, 157, 110078. [Google Scholar] [CrossRef] [PubMed]
- Cheng, C.H.; Ye, C.X.; Guo, Z.X.; Wang, A.L. Immune and physiological responses of pufferfish (Takifugu obscurus) under cold stress. Fish Shellfish Immunol. 2017, 64, 137–145. [Google Scholar] [CrossRef] [PubMed]
- Song, H.B.; Xu, D.D.; Tian, L.; Chen, R.Y.; Wang, L.G.; Tan, P.; You, Q.C. Overwinter mortality in yellow drum (Nibea albiflora): Insights from growth and immune responses to cold and starvation stress. Fish Shellfish Immunol. 2019, 92, 341–347. [Google Scholar] [CrossRef] [PubMed]
- Zhang, J.X.; Wang, X.L.; Vikash, V.; Ye, Q.; Wu, D.D.; Liu, Y.L.; Dong, W.G. ROS and ROS-Mediated Cellular Signaling. Oxid. Med. Cell. Longev. 2016, 2016, 4350965. [Google Scholar] [CrossRef] [PubMed]
- Hamanaka, R.B.; Chandel, N.S. Mitochondrial reactive oxygen species regulate cellular signaling and dictate biological outcomes. Trends Biochem. Sci. 2010, 35, 505–513. [Google Scholar] [CrossRef] [PubMed]
- Liu, B.; Chen, Y.; St Clair, D.K. ROS and p53: A versatile partnership. Free Radic. Biol. Med. 2008, 44, 1529–1535. [Google Scholar] [CrossRef]
- Kamata, H.; Honda, S.; Maeda, S.; Chang, L.F.; Hirata, H.; Karin, M. Reactive oxygen species promote TNFalpha-induced death and sustained JNK activation by inhibiting MAP kinase phosphatases. Cell 2005, 120, 649–661. [Google Scholar] [CrossRef] [PubMed]
- Han, S.; Wei, S.; Chen, R.Y.; Ni, M.; Chen, L.B. Tissue-Specific and Differential Cold Responses in the Domesticated Cold Tolerant Fugu. Fishes 2022, 7, 159. [Google Scholar] [CrossRef]
- Fischer, M. Census and evaluation of p53 target genes. Oncogene 2017, 36, 3943–3956. [Google Scholar] [CrossRef] [PubMed]
- Wang, J.; Han, S.; Luo, Y.H.; Zhang, J.P.; Wang, Y.Q.; Chen, L.B. Comparative transcriptomic analysis reveals the gut-brain axis regulatory mechanisms in cold-tolerant pufferfish (Takifugu fasciatus) under cold stress. Aquaculture 2025, 598, 742033. [Google Scholar] [CrossRef]
- Schreiber, G.; Walter, M.R. Cytokine–receptor interactions as drug targets. Curr. Opin. Chem. Biol. 2010, 14, 511–519. [Google Scholar] [CrossRef]
- Gao, Y.C.; Wei, Y.F.; Cao, D.N.; Ge, Y.; Gong, S.P. Transcriptome analysis reveals decreased immunity under heat stress in Mauremys mutica. Aquaculture 2021, 531, 735894. [Google Scholar] [CrossRef]
- Kawai, T.; Akira, S. TLR signaling. Cell Death Differ. 2006, 13, 816–825. [Google Scholar] [CrossRef] [PubMed]
- Huang, D.Y.; Liang, H.L.; Zhu, J.; Ren, M.C.; Ge, X.P. Transcriptome reveals insights into hepatic nutritional metabolism and gill immune responses adapted to cold stress in genetically improved farmed tilapia (GIFT: Oreochromis niloticus). Aquac. Rep. 2022, 26, 101297. [Google Scholar] [CrossRef]
- Escoll, P.; Buchrieser, C. Metabolic reprogramming: An innate cellular defence mechanism against intracellular bacteria? Curr. Opin. Immunol. 2019, 60, 117–123. [Google Scholar] [CrossRef]
- Yang, S.S.; Zhao, T.T.; Ma, A.J.; Huang, Z.H.; Liu, Z.F.; Cui, W.X.; Zhang, J.S.; Zhu, C.Y.; Guo, X.L.; Yuan, C.H. Metabolic responses in Scophthalmus maximus kidney subjected to thermal stress. Fish Shellfish Immunol. 2020, 103, 37–46. [Google Scholar] [CrossRef]
- Niu, X.F.; Mu, Q.L.; Li, W.F.; Yao, H.; Li, H.N.; Huang, H.M. Esculentic acid, a novel and selective COX-2 inhibitor with anti-inflammatory effect in vivo and in vitro. Eur. J. Pharmacol. 2014, 740, 532–538. [Google Scholar] [CrossRef]
- Niu, X.F.; Mu, Q.L.; Li, W.F.; Yao, H.; Li, H.; Li, Y.M.; Hu, H.; Huang, H.M. Protective effects of esculentic acid against endotoxic shock in Kunming mice. Int. Immunopharmacol. 2014, 23, 229–235. [Google Scholar] [CrossRef] [PubMed]
- de la Puerta, R.; Domínguez, M.E.M.; Ruíz-Gutíerrez, V.; Flavill, J.A.; Hoult, J.R.S. Effects of virgin olive oil phenolics on scavenging of reactive nitrogen species and upon nitrergic neurotransmission. Life Sci. 2001, 69, 1213–1222. [Google Scholar] [CrossRef] [PubMed]
- Bertelli, A.A.E.; Migliori, M.; Panichi, V.; Longoni, B.; Origlia, N.; Ferretti, A.; Cuttano, M.G.; Giovannini, L. Oxidative stress and inflammatory reaction modulation by white wine. Ann. N. Y. Acad. Sci. 2002, 957, 295–301. [Google Scholar] [CrossRef] [PubMed]
- Lu, J.; Huang, G.R.; Wang, Z.N.; Zhuang, S.; Xu, L.L.; Song, B.C.; Xiong, Y.; Guan, S. Tyrosol exhibits negative regulatory effects on LPS response and endotoxemia. Food Chem. Toxicol. 2013, 62, 172–178. [Google Scholar] [CrossRef] [PubMed]
- Bu, Y.; Rho, S.; Kim, J.; Kim, M.Y.; Lee, D.H.; Kim, S.Y.; Choi, H.; Kim, H. Neuroprotective effect of tyrosol on transient focal cerebral ischemia in rats. Neurosci. Lett. 2007, 414, 218–221. [Google Scholar] [CrossRef] [PubMed]
- Lee, D.H.; Kim, Y.J.; Kim, M.J.; Ahn, J.; Ha, T.Y.; Lee, S.H.; Jang, Y.J.; Jung, C.H. Pharmacokinetics of Tyrosol Metabolites in Rats. Molecules 2016, 21, 128. [Google Scholar] [CrossRef] [PubMed]
- Mischitelli, M.; Jemaà, M.; Almasry, M.; Faggio, C.; Lang, F. Ca2+ Entry, Oxidative Stress, Ceramide and Suicidal Erythrocyte Death Following Diosgenin Treatment. Cell. Physiol. Biochem. 2016, 39, 1626–1637. [Google Scholar] [CrossRef] [PubMed]
- Ren, Q.L.; Wang, Q.; Zhang, X.Q.; Wang, M.; Hu, H.; Tang, J.J.; Yang, X.T.; Ran, Y.H.; Liu, H.H.; Song, Z.X.; et al. Anticancer Activity of Diosgenin and Its Molecular Mechanism. Chin. J. Integr. Med. 2023, 29, 738–749. [Google Scholar] [CrossRef] [PubMed]
- Huang, N.N.; Yu, D.; Wu, J.K.; Du, X.W. Diosgenin: An important natural pharmaceutical active ingredient. Food Sci. Technol. 2021, 42, 94521. [Google Scholar] [CrossRef]
- Lee, Y.H.; Lee, Y.R.; Kim, K.H.; Im, S.A.; Song, S.; Lee, M.K.; Kim, Y.H.; Hong, J.T.; Kim, K.; Lee, C.K. Baccatin III, a synthetic precursor of taxol, enhances MHC-restricted antigen presentation in dendritic cells. Int. Immunopharmacol. 2011, 11, 985–991. [Google Scholar] [CrossRef]
- Tang, H.B.; Guo, Q.H.; Yang, J.M.; Zhang, J.H.; Lu, H.L. Hepatic Metabolomic Responses to Low-Temperature Stress in the Invasive Turtle, Trachemys scripta elegans. Animals 2024, 14, 2388. [Google Scholar] [CrossRef] [PubMed]
- Amelio, I.; Cutruzzolá, F.; Antonov, A.; Agostini, M.; Melino, G. Serine and glycine metabolism in cancer. Trends Biochem. Sci. 2014, 39, 191–198. [Google Scholar] [CrossRef] [PubMed]
- Pan, S.J.; Fan, M.; Liu, Z.G.; Li, X.; Wang, H.J. Serine, glycine and one-carbon metabolism in cancer (Review). Int. J. Oncol. 2021, 58, 158–170. [Google Scholar] [CrossRef] [PubMed]
- Cheng, Z.X.; Guo, C.; Chen, Z.G.; Yang, T.C.; Zhang, J.Y.; Wang, J.; Zhu, J.X.; Li, D.; Zhang, T.T.; Li, H.; et al. Glycine, serine and threonine metabolism confounds efficacy of complement-mediated killing. Nat. Commun. 2019, 10, 3325. [Google Scholar] [CrossRef]
- Hedrick, S.M. The cunning little vixen: Foxo and the cycle of life and death. Nat. Immunol. 2009, 10, 1057–1063. [Google Scholar] [CrossRef] [PubMed]
- Eijkelenboom, A.; Burgering, B.M. FOXOs: Signalling integrators for homeostasis maintenance. Nat. Rev. Mol. Cell. Biol. 2013, 14, 83–97. [Google Scholar] [CrossRef]
- Palucka, A.K.; Coussens, L.M. The Basis of Oncoimmunology. Cell 2016, 164, 1233–1247. [Google Scholar] [CrossRef]
- Ma, F.; Zhao, L.; Ma, R.L.; Wang, J.; Du, L.Q. FoxO signaling and mitochondria-related apoptosis pathways mediate tsinling lenok trout (Brachymystax lenok tsinlingensis) liver injury under high temperature stress. Int. J. Biol. Macromol. 2023, 251, 126404. [Google Scholar] [CrossRef]
- Lu, X.; Wu, Y.; Peng, Y.; Tan, K.; Liu, M.; Liang, X.; Xu, P.; Liang, M.; Liu, W.; Gong, Q.; et al. Dietary Lithospermum erythrorhizon ethanol extract alleviates soybean meal-induced enteritis by improving immune tolerance profile of pearl gentian grouper (Epinephelus fuscoguttatus ♀ × E. lanceolatus ♂). Comp. Biochem. Physiol. Part D Genom. Proteom. 2024, 52, 101335. [Google Scholar] [CrossRef]
- Wei, J.L.; Liu, J.H.; Liang, S.; Sun, M.Q.; Duan, J.C. Low-Dose Exposure of Silica Nanoparticles Induces Neurotoxicity via Neuroactive Ligand-Receptor Interaction Signaling Pathway in Zebrafish Embryos. Int. J. Nanomed. 2020, 15, 4407–4415. [Google Scholar] [CrossRef]
- Jiang, J.L.; Mao, M.G.; Lü, H.Q.; Wen, S.H.; Sun, M.L.; Liu, R.T.; Jiang, Z.Q. Digital gene expression analysis of Takifugu rubripes brain after acute hypoxia exposure using next-generation sequencing. Comp. Biochem. Physiol. Part D Genom. Proteom. 2017, 24, 12–18. [Google Scholar] [CrossRef] [PubMed]
- Hou, X.T.; Shi, H.K.; Jiang, Y.; Li, X.K.; Chen, K.Q.; Li, Q.; Liu, R.N. Transcriptome analysis reveals the neuroactive receptor genes response to Streptococcus agalactiae infection in tilapia, Oreochromis niloticus. Fish Shellfish Immunol. 2023, 141, 109090. [Google Scholar] [CrossRef] [PubMed]
- Su, F.; Dolmatov, I.Y.; Cui, W.; Yang, H.S.; Sun, L.N. Molecular dynamics and spatial response of proliferation and apoptosis in wound healing and early intestinal regeneration of sea cucumber Apostichopus japonicus. Dev. Comp. Immunol. 2025, 162, 105297. [Google Scholar] [CrossRef] [PubMed]

| Category | Pathway | Number of DEGs in Pathway | Up_Gene | Down_Gene |
|---|---|---|---|---|
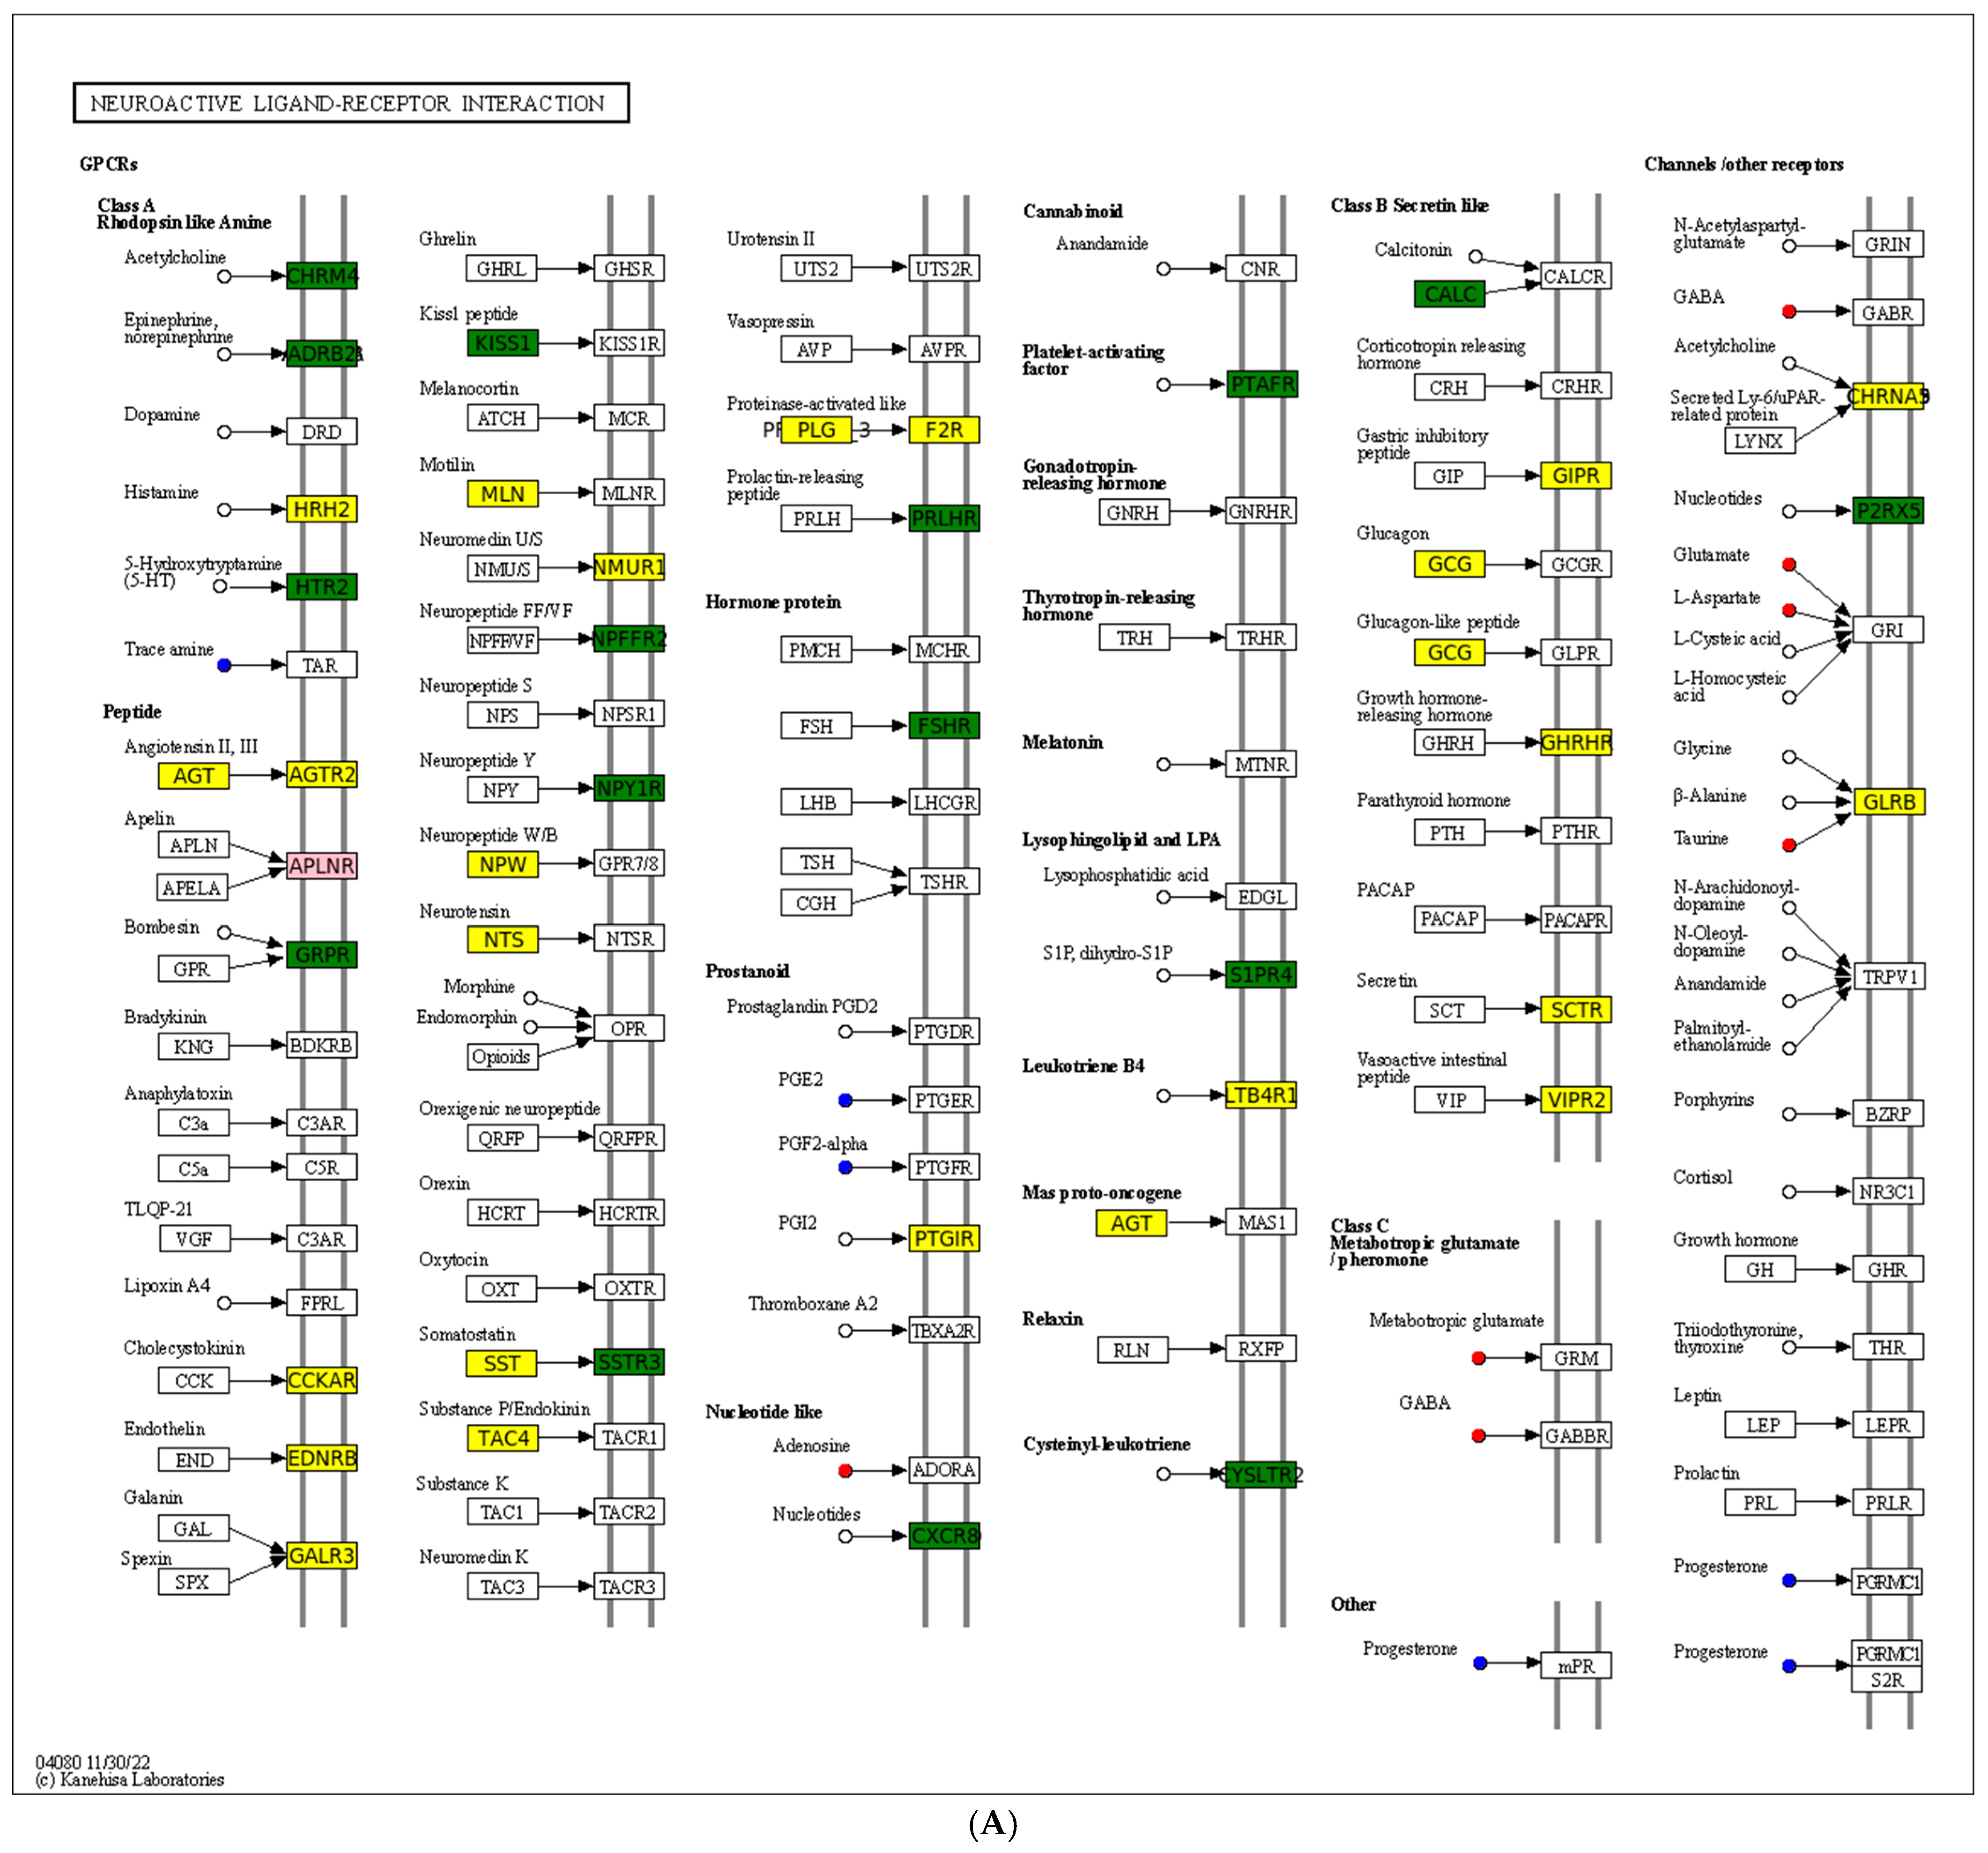
| Signaling molecules and interaction | Neuroactive ligand–receptor interaction | Up_number: 39 Down_number: 32 | Glrb, Nmur1, Sctr, Galr3, LOC102450564, Agt, Ltb4r, LOC102445365, Agtr2, LOC106732597, Mln, LOC102463318, LOC112547215, Npw, Plg, Sst, Htr1a, LOC102455738, LOC102445677, LOC102450075, LOC102462299, Gcg, Nts, LOC102462143, LOC102446059, Galr1, Cckar, F2r, Adra2A, LOC102455240, LOC102457024, LOC102443518, LOC102445111, Ghrhr, LOC102444212, LOC102447960, LOC102449550, LOC102454403, LOC102454640 | Lpar6, Chrna9, Kiss1, LOC102463720, Sstr3, P2Rx5, Hrh4, Npy1Rr, Fshr, Ptafr, LOC102450527, LOC102456588, Adra1b, LOC106731387, Htr2b, LOC102460605, Cysltr2, LOC112543526, F2, S1pr4, Chrm3, LOC102463328, Grpr, Chrm4, Adrb2, LOC106731386, Hrh1, LOC102462691, LOC102445535, LOC102450296, Npffr2, Chrna3 |
| Signaling molecules and interaction | Cytokine–cytokine receptor interaction | Up_number: 20 Down_number: 30 | Epor, LOC102463217, Tnfrsf12a, LOC102462633, Il15ra, Cxcl14, LOC102454836, LOC102455635, LOC106732727, Il31ra, Bmp3, LOC106731489, LOC102453911, LOC102463419, LOC102448244, LOC102443642, LOC102463713, Il1rap, LOC102450014, LOC102445218 | Cx3cl1, LOC102444580, Tnfsf10, LOC102454894, Ccr7, Cxcr3, Ccr10, LOC102458236, Tnfrsf11b, Cd40lg, Edar, Tnfrsf4, Ccr6, Ifng, LOC102453719, Ccr4, LOC102461383, Bmp7, Cx3cr1, Cxcr4, Il12Rb2, Tnfrsf17, Il23r, LOC102460133, Cxcr5, Il7r, LOC102451419, LOC102459422, Eda, LOC102457828 |
| Signaling molecules and interaction | Cell adhesion molecules | Up_number: 12 Down_number: 16 | LOC102458879, Mag, Ocln, F11R, LOC102455872, Cldn2, Sdc4, LOC102454797, Cdh4, LOC102452457, LOC102455630, Mpz | Itga4, LOC102462153, Cd40Lg, Cd2, LOC102446295, Cd8B, LOC112546502, Vsir, Siglec1, Ctla4, LOC102456519, Cd28, Cd226, Ptprc, Nlgn4x, LOC102459758 |
| Signal transduction | Calcium signaling pathway | Up_number: 22 Down_number: 21 | Casq1, Cacna1b, Fgfr3, Fgf6, Pdgfc, Mst1, Atp2b2, LOC102447960, LOC102449550, Cacna1I, Tnnc1, Ntrk1, LOC102451515, Met, LOC102460301, Pde1c, F2r, Cckar, LOC102459783, Camk2a, Nos2, Slc25a4 | Cysltr2, Mylk3, Cxcr4, LOC112546502, LOC112545842, Htr2b, Adcy7, LOC112547828, Camk4, Adra1b, Ntrk2, Ptafr, Cd38, P2rx5, Hrh1, LOC106731800, Adrb2, Grpr, Chrm3, Pln, Gna15 |
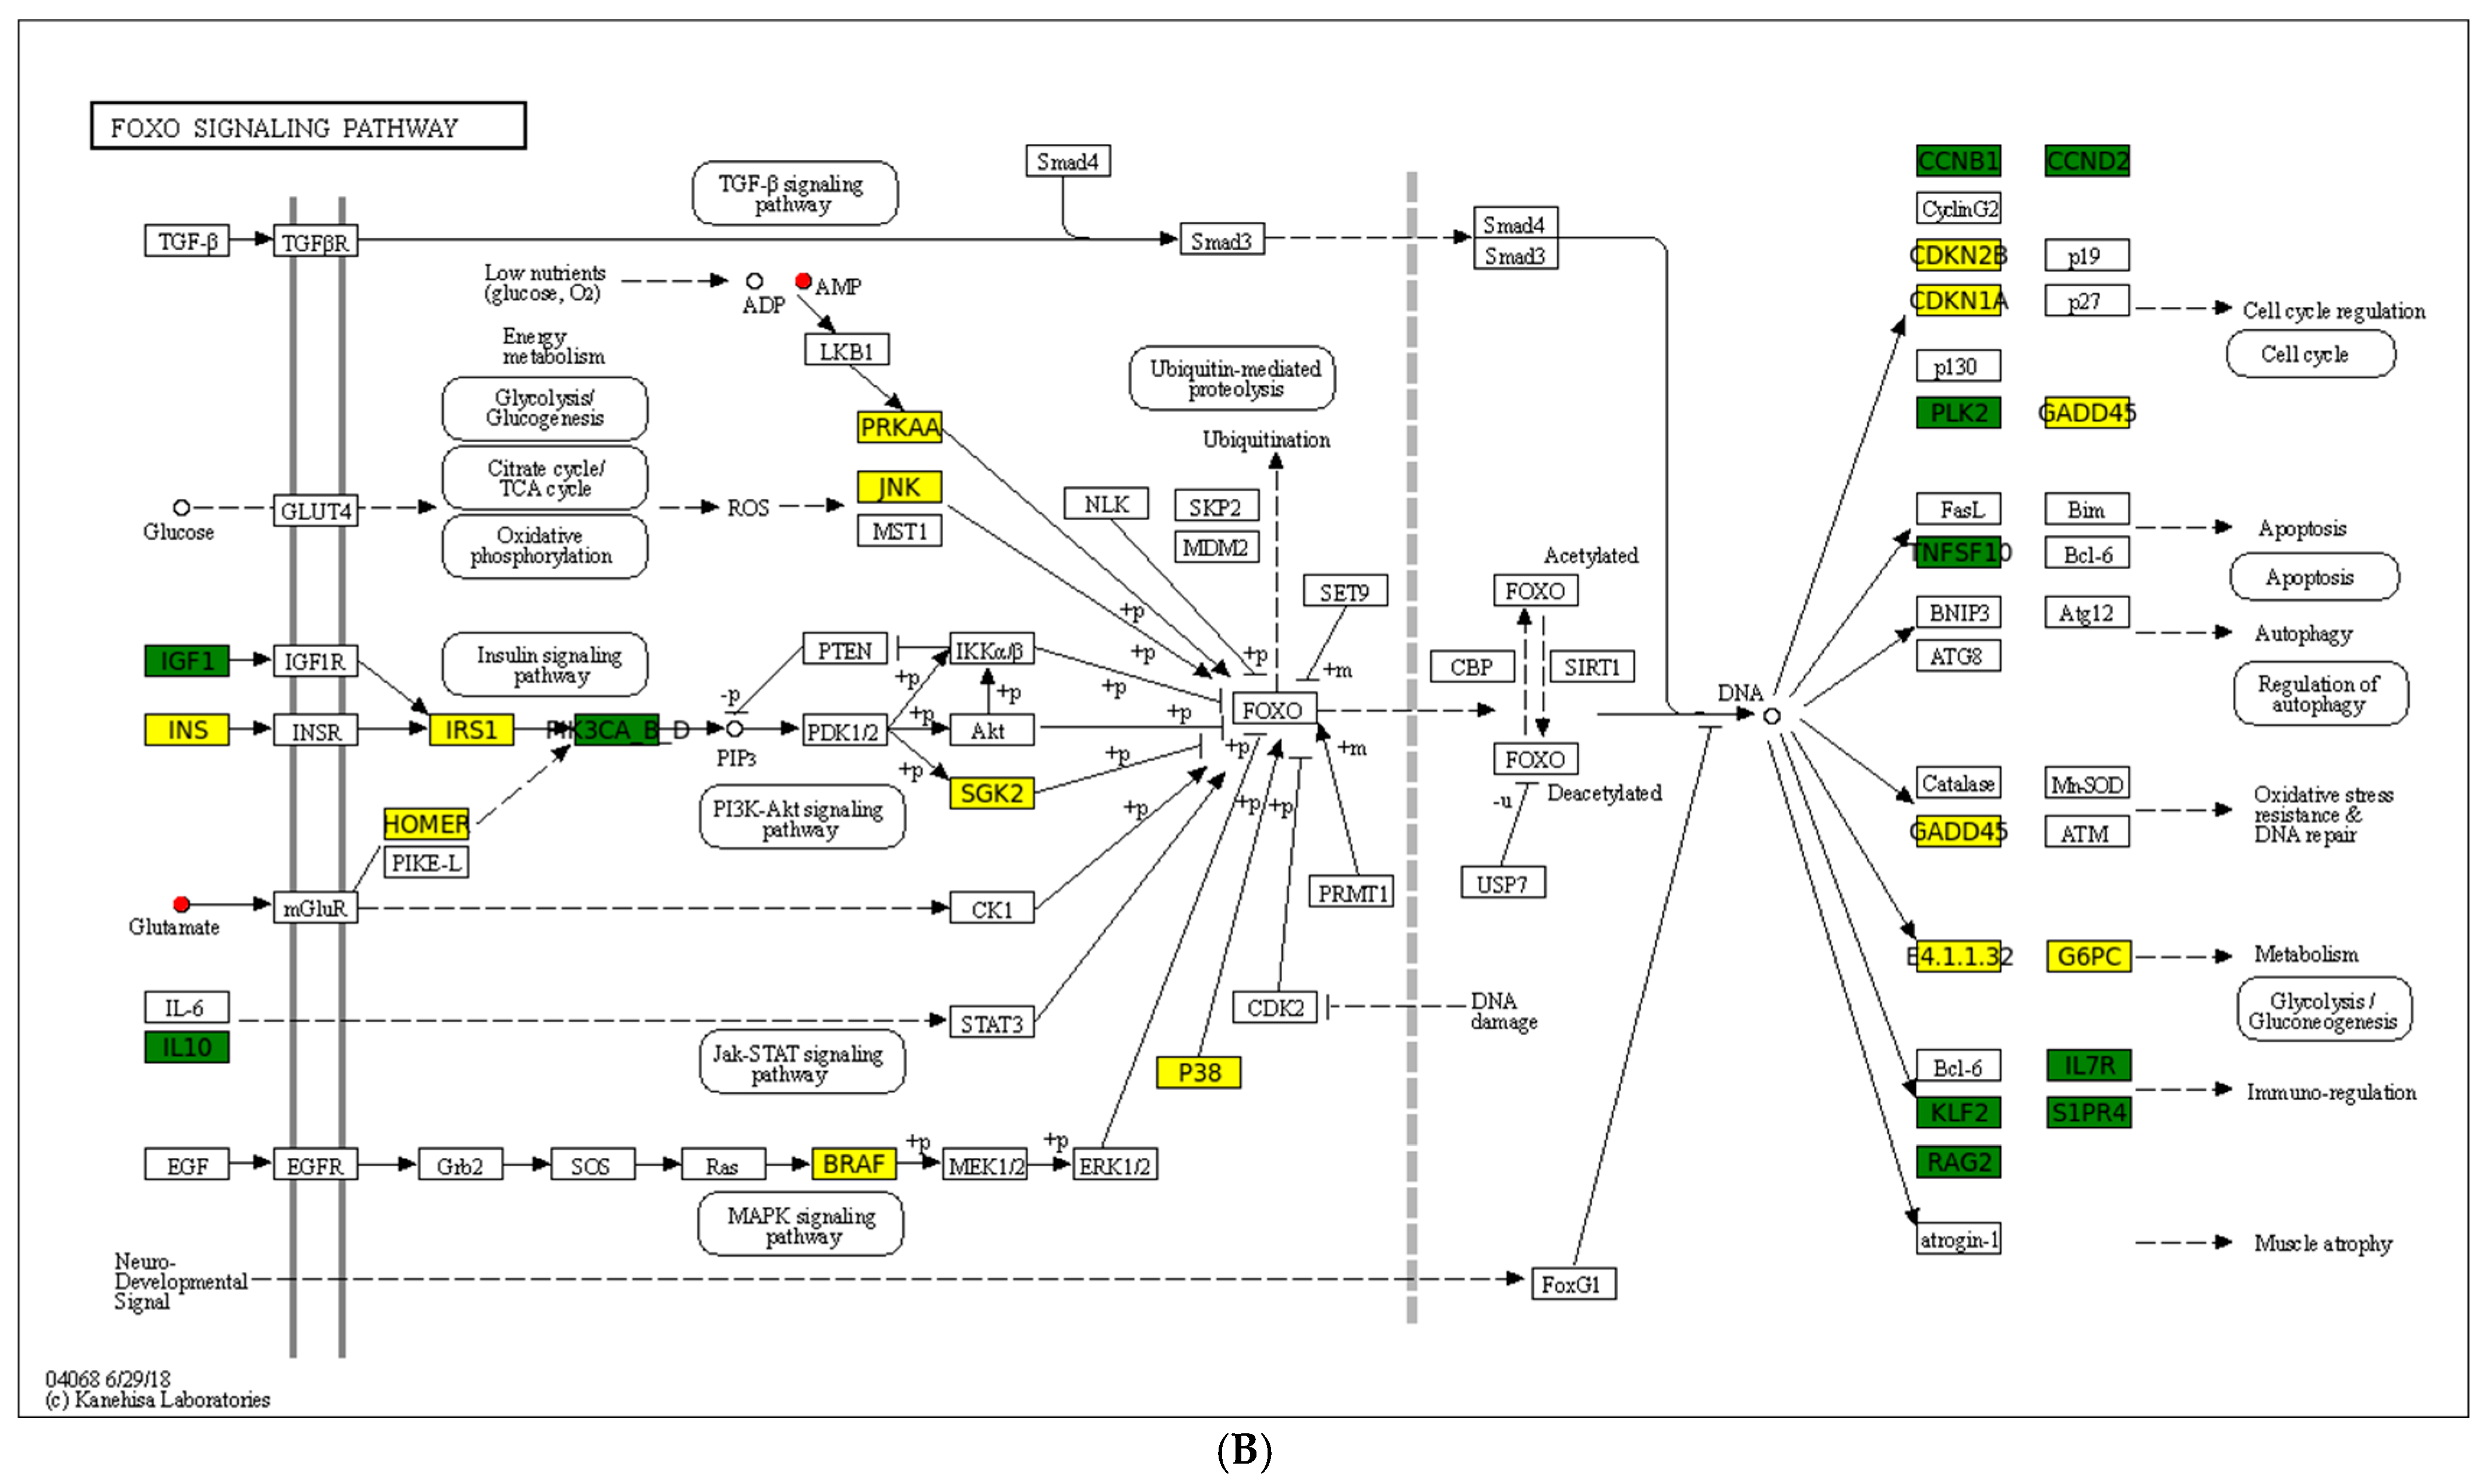
| Signal transduction | FoxO signaling pathway | Up_number: 14 Down_number: 12 | Cdkn1a, Mapk10, Braf, Homer2, G6pc2, Ins, LOC102449535, Irs1, Sgk2, LOC102453637, Prkaa2, Mapk13, Gadd45A, Pck1 | LOC102453719, Igf1, Klf2, Tnfsf10, LOC102462482, Plk2, Ccnd2, Rag2, Ccnb1, Rag1, S1pr4, Il7r |
| Immune system | Toll-like receptor signaling pathway | Up_number: 10 Down_number: 12 | Mapk10, LOC102463217, LOC102445063, LOC102463713, Irf7, Mapk13, LOC102453911, LOC106731489, LOC102443642, LOC102448244 | LOC102456214, Map2k6, Tlr5, LOC102444580, LOC102459334, LOC102462482, Tlr7, LOC102454894, LOC102456470, Tlr2, LOC102460455, Tlr8 |
| Immune system | Intestinal immune network for IgA production | Up_number: 2 Down_number: 14 | Pigr, Il15ra | Tnfrsf17, Aicda, LOC106731800, Cd28, LOC102459422, LOC102459758, Itga4, Cd40lg, Ccr10, LOC102453719, LOC112547828, LOC112545842, Cxcr4, LOC112546502 |
| Amino acid metabolism | Cysteine and methionine metabolism | Up_number: 10 Down_number: 3 | LOC102445649, LOC102456958, LOC102461938, Psat1, Mri1, Bcat1, Tat, Cth, Cdo1, Mat1a | LOC102458451, Mtr, Mat2a |
| Amino acid metabolism | Glycine, serine, and threonine metabolism | Up_number: 12 Down_number: 0 | LOC102451402, Psat1, Sardh, LOC102450327, Cth, LOC102450557, Gcat, LOC102445649, Gamt, Gldc, Dao, LOC102460961 | - |
| Circulatory system | Adrenergic signaling in cardiomyocytes | Up_number: 19 Down_number: 9 | LOC102450688, LOC102456632, Tnnc1, LOC102451515, Scn1b, Atf4, LOC102460301, Tnnt2, Ppp2r2c, Camk2a, Mapk13, LOC102456979, Cacng3, Cacnb2, Cacnb4, Agtr2, Agt, Myl3, Atp2b2 | Adcy5, Adrb2, Pln, LOC102455980, Cacna2d1, Adcy7, Adra1b, Bcl2, Scn4b |
| Endocrine system | PPAR signaling pathway | Up_number: 9 Down_number: 10 | LOC102447294, Slc27a2, Ehhadh, Pck1, Angptl4, Acsl5, Fabp3, Acsl1, Acox2 | Cd36, LOC102444673, LOC102457003, Rxra, Fads2, Hmgcs1, LOC102448178, LOC102447791, Fabp7, Me1 |
| Cell growth and death | p53 signaling pathway | Up_number: 8 Down_number: 9 | Sesn2, LOC102453637, Sfn, Gadd45a, Serpine1, Cdkn1a, Pmaip1, LOC102462633 | Ccnb1, Cdk6, Igf1, Cdk1, Rrm2, Sesn1, Ccnd2, Bcl2, LOC102448042 |
| Metabolism of cofactors and vitamins | Retinol metabolism | Up_number: 4 Down_number: 6 | LOC102450173, Dhrs9, LOC102451983, LOC102460451 | LOC102453949, Dgat1, Aldh1a2, LOC102448341, LOC102461202, Aox1 |
| Carbohydrate metabolism | Starch and sucrose metabolism | Up_number: 8 Down_number: 1 | Gyg2, LOC102447192, Si, Amy2a, G6pc2, LOC102447842, LOC102459941, LOC102460423 | Treh |
| Glycan biosynthesis and metabolism | Other glycan degradation | Up_number: 2 Down_number: 4 | Neu3, LOC102443738 | Neu2, Hexb, Aga, Fuca2 |
Disclaimer/Publisher’s Note: The statements, opinions and data contained in all publications are solely those of the individual author(s) and contributor(s) and not of MDPI and/or the editor(s). MDPI and/or the editor(s) disclaim responsibility for any injury to people or property resulting from any ideas, methods, instructions or products referred to in the content. |
© 2025 by the authors. Licensee MDPI, Basel, Switzerland. This article is an open access article distributed under the terms and conditions of the Creative Commons Attribution (CC BY) license (https://creativecommons.org/licenses/by/4.0/).
Share and Cite
Ji, L.; Shi, Q.; Shangguan, Y.; Chen, C.; Zhu, J.; Dong, Z.; Hong, X.; Liu, X.; Wei, C.; Zhu, X.; et al. Molecular Response and Metabolic Reprogramming of the Spleen Coping with Cold Stress in the Chinese Soft-Shelled Turtle (Pelodiscus sinensis). Antioxidants 2025, 14, 217. https://doi.org/10.3390/antiox14020217
Ji L, Shi Q, Shangguan Y, Chen C, Zhu J, Dong Z, Hong X, Liu X, Wei C, Zhu X, et al. Molecular Response and Metabolic Reprogramming of the Spleen Coping with Cold Stress in the Chinese Soft-Shelled Turtle (Pelodiscus sinensis). Antioxidants. 2025; 14(2):217. https://doi.org/10.3390/antiox14020217
Chicago/Turabian StyleJi, Liqin, Qing Shi, Yisen Shangguan, Chen Chen, Junxian Zhu, Zhen Dong, Xiaoyou Hong, Xiaoli Liu, Chengqing Wei, Xinping Zhu, and et al. 2025. "Molecular Response and Metabolic Reprogramming of the Spleen Coping with Cold Stress in the Chinese Soft-Shelled Turtle (Pelodiscus sinensis)" Antioxidants 14, no. 2: 217. https://doi.org/10.3390/antiox14020217
APA StyleJi, L., Shi, Q., Shangguan, Y., Chen, C., Zhu, J., Dong, Z., Hong, X., Liu, X., Wei, C., Zhu, X., & Li, W. (2025). Molecular Response and Metabolic Reprogramming of the Spleen Coping with Cold Stress in the Chinese Soft-Shelled Turtle (Pelodiscus sinensis). Antioxidants, 14(2), 217. https://doi.org/10.3390/antiox14020217