Article

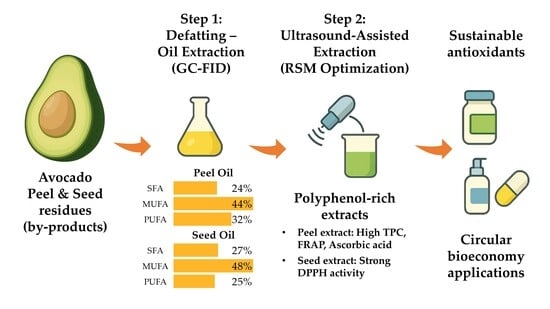
Optimization of Polyphenol-Rich Extracts from Defatted Avocado Peel and Seed Residues Using Ultrasound-Assisted RSM: Antioxidant Potential and Valorization Prospects

by
Argyro Petrantonaki
,
Vasiliki-Ioanna Theodoropoulou
,
Martha Mantiniotou
,
Vassilis Athanasiadis
,
Eleni Bozinou
and
Stavros I. Lalas
*
Department of Food Science and Nutrition, University of Thessaly, Terma N. Temponera Street, 43100 Karditsa, Greece
*
Author to whom correspondence should be addressed.
Antioxidants 2025, 14(11), 1293; https://doi.org/10.3390/antiox14111293
Submission received: 9 October 2025 / Revised: 26 October 2025 / Accepted: 27 October 2025 / Published: 28 October 2025
(This article belongs to the Special Issue Bioactive Antioxidants from Agri-Food Wastes)

Abstract

It is well known that a significant amount of processed avocado fruit, specifically peel and seed, is treated as waste. During this study, these by-products were valorized through a two-step approach combining lipid profiling and optimized antioxidant extraction. Initially, oil was extracted and analyzed via GC-FID, revealing distinct fatty acid compositions: peel oil was rich in oleic (32.0%), linoleic (21.9%), and α-linolenic acids (9.7%), while seed oil was dominated by oleic (48.0%) and palmitic acids (20.7%), with moderate linoleic content (24.0%). Following defatting, the dried residues were subjected to ultrasound-assisted extraction, which was optimized by response surface methodology (RSM) to maximize the recovery of antioxidant-rich fractions. Peel extracts exhibited the highest total polyphenolic content (105.98 mg GAE/g), FRAP (673.89 μmol AAE/g), and ascorbic acid (17.9 mg/g), while seed extracts showed superior DPPH activity (1071.31 μmol AAE/g). Regression modeling identified optimal conditions for each antioxidant metric, highlighting matrix-specific bioactivity. The combined analysis of lipid and polar fractions underscores the multifunctional potential of avocado residues as sustainable sources of natural antioxidants. These findings support their application in food, cosmetic, and nutraceutical formulations, contributing to circular bioeconomy strategies.

Graphical Abstract

1. Introduction

Human health depends on efficient metabolic processes, homeostatic balance, and properly functioning cellular repair mechanisms. Although free oxygen radicals play essential roles in normal physiology, their excess induces oxidative stress, leading to dysfunctions in the human body [1]. Reactive oxygen and nitrogen species are molecules characterized by the presence of at least one unpaired electron. This indicates that free radicals are extremely reactive molecules with brief lifespans that swiftly engage in chemical reactions with biological structures [2,3]. Free radicals are perpetually generated by every single cell under physiological conditions and impact our bodies daily [2]. To inhibit the interaction of radicals and biological molecules, antioxidants must be situated near the site of radical production, competing with the free radical for the biological substrate. Insufficient antioxidant levels to counteract reactive oxygen species (ROS) will lead to the deterioration of biomolecules, particularly lipid peroxidation, protein degradation (carbonylation of amino acid residues), oxidation of various DNA and RNA nucleotides, and enzyme inhibition, ultimately resulting in cellular apoptosis [4,5].
The investigation of naturally derived products for their antioxidant properties has garnered significant attention due to the demand for safer and more effective therapeutic alternatives, and the shift towards healthier lifestyles that incorporate natural antioxidant compounds [6]. Polyphenolic compounds, found in numerous plants and foods, have been thoroughly investigated for their antioxidant, antibacterial and anti-inflammatory properties [7,8]. Food by-products, often rich in polyphenolic compounds, are generated during plant-based food production but are usually discarded, contributing to environmental pollution [9]. In this context, scientists have concentrated on advancing sustainable food production, wherein the utilization of waste materials, referred to as byproducts, from agribusiness offers a significant chance for development [10,11].
In response to sustainable environmental practices, industry and scientists have been seeking to employ green extraction techniques on food residue and by-products in recent years [12]. Ultrasonication lies among the green extraction techniques, which is chiefly attributable to the prospective advantages of diminished extraction duration and less solvent waste [13,14]. The utilization of ultrasound for the targeted extraction of bioactive compounds facilitates a high yield at relatively low temperatures, hence limiting degradation and preserving the quality of the final extract [13]. Ultrasonication induces negative pressure in the liquid medium, resulting in acoustic cavitation, which appears as bubbles due to the inability of gases to remain dissolved under these conditions [15]. Ultrasound waves induce pressure fluctuations that produce cavitation bubbles, causing their development and subsequent collapse, which releases energy. The rupture of bubbles generates significant shear forces and localized elevated temperatures, resulting in cell disintegration and enhanced mass transfer, hence augmenting the yield of chemical compound extraction [16]. Some main factors that highly affect ultrasound efficiency are ultrasonic power, ultrasonic frequency and ultrasonic intensity [16].
Avocado, also known in the scientific community as Persea americana Mill., a member of the Lauraceae family, is a tropical fruit characterized by an olive green skin and a dense pale yellow flesh rich in oils [17]. Around 6 million tons of avocado fruit are harvested annually worldwide, generating 1.6 million tons of waste [18,19]. The elevated industrial processing and direct consumption are seen in its rapid and substantial production rise in 2020 and preceding years among tropical fruits, particularly for the widely favored ‘Hass’ variety [20]. Avocados generate a substantial amount of waste, including seeds, peels, and leaves, owing to both direct consumption and industrial processing. The avocado peel (AP) accounts for 11% and avocado seeds (ASs) account for 16% of the fruit’s total weight [21]. AP contains lipids (4.4–9.1%), carbohydrates (62–73.3%), fibers (~50%), minerals (1.5–6%), proteins (0.17–8%) and a high amount of polyphenolic compounds that result in a high antioxidant activity [22]. ASs are an excellent source of dietary fiber (2–4.2%) and contain lipids (3–15%), carbohydrates (43–81%), minerals (1.3–4.3%), proteins (0.14–9%) and rich bioactive compounds that can yield various useful substances, including phenolics, polyphenols, and tocopherols, which include antioxidant and antibacterial properties [18,23].
With all the above in mind, this study aims to examine the polyphenolic profile and antioxidant activity of avocado by-products. Until now, great importance has been given to the seed, and as a result, the peel and all the beneficial substances it contains have not been studied thoroughly. Research and applications underscore the potential of seed and peel extracts for integration into food systems, cosmeceuticals, and biodegradable packaging materials. Starch and polyphenols derived from seeds have been utilized to create biodegradable films possessing antioxidant and barrier properties, whereas peel extracts have exhibited protective effects against oxidative stress and apoptosis in neuronal cell models, owing to their high phenolic content [24]. In this study, both peel and seed will be examined simultaneously, with extraction parameters optimized using Response Surface Methodology (RSM). Ultrasound-assisted extraction (UAE) will be utilized as a green, non-thermal, beneficial extraction technique and parameters such as ultrasonic power, liquid-to-solid ratio, treatment duration, and appropriate solvent composition will be investigated. Ethanol, water and a 1:1 v/v mixture of the two will be utilized as solvents under investigation, due to terms of environmental protection and food-grade solvent usage. In addition, the oil composition in fatty acids of AS and AP will be studied, along with their possible antioxidant activity and oxidative stability.

2. Materials and Methods

2.1. Chemicals and Reagents

Deionized water was produced by a deionizing column. Dichloromethane and ethyl acetate were purchased from Carlo Erba (Normandie, France). The Human Corporation NEX Power 1000 device (Seoul, Republic of Korea) was utilized to produce ultrapure water. Sodium carbonate anhydrous (≥95.0% w/w), sodium chloride (≥99.0% w/w), chloroform, and ammonium thiocyanate (≥99.0% w/w) were purchased from Penta (Prague, Czech Republic). Ethanol (≥99.8% v/v), gallic acid (≥99.0% w/w), ammonium iron (II) sulfate hexahydrate (≥99.0% w/w), and Folin–Ciocalteu’s reagent were bought from Panreac Co. (Barcelona, Spain). Acetonitrile was purchased from Labkem (Barcelona, Spain). Trolox (6-hydroxy-2,5,7,8-tetramethylchroman-2-carboxylic acid) (≥96.5% w/w) was obtained from Glentham Life Sciences (Corsham, UK). Hydrogen peroxide (35%) was purchased from Chemco (Malsch, Germany). Iron (III) chloride hexahydrate (≥99.0% w/w) was from Merck (Darmstadt, Germany). L-ascorbic acid (≥99.0% w/w), trichloroacetic acid (≥99.0% w/w), aluminum chloride (≥99% w/w), hydrochloric acid (37% w/w), methanol (≥99.8% v/v), 2,2-diphenyl-1-picrylhydrazyl (DPPH) (≥90.0% w/w), 2,4,6-tris(2-pyridyl)-s-triazine (TPTZ) (≥98% w/w), FAME Mix C8–C24 reference standards, 2-propanol and polyphenolic chemical standards of HPLC grade (≥99.0% w/w) were all purchased from Sigma-Aldrich (Darmstadt, Germany).

2.2. Avocado Fruit Handling

Fresh avocado fruits (cv. Hass) were harvested by a local farmer in Agia village, Chania, Crete, Greece, coordinates: 35°28′19″ N 23°55′40″ E according to Google Earth (ver. 10.91.0.1 from Google Inc. (Cambridge, MA, USA). The field contains 180 avocado trees of the same cultivar within acres. Fruits were harvested on 3 March 2025 in unripe form in the afternoon so that they would not be damp. The harvesting was repeated in triplicate, and about 20 kg of fruit were collected each time. Unripe avocado fruits were transported to our lab and left at ambient temperature to ripen naturally. When the peel color turned from green to black, the fruits were ready to be consumed. The fruits were manually peeled, and the seeds were separated from the pulp and cracked to expose the inner kernel (Figure 1). Both peel and seed fractions were cut into small pieces, frozen at −40 °C, and subsequently freeze-dried using a BK-FD10P freeze-dryer (Biobase, Jinan, China), at −55 °C, 0.05 mbar until constant weight. The moisture content was measured as 74.33% for the AP and as 52.72% for AS. The dried materials were ground to a fine powder using a laboratory mill. The powder then underwent a sieving process with an Analysette 3 PRO apparatus from Fritsch GmbH (Oberstein, Germany), a total of five times for each sample. In both cases, particles with a diameter less than 400 μm were kept, with average particle diameters of 314 ± 60 μm for AP and 262 ± 11 μm for AS, and stored in airtight containers under vacuum at −40 °C until further use.

2.3. Defatting and Lipophilic Analysis

2.3.1. Defatting Procedure

Freeze-dried avocado peel and seed powders were defatted with n-hexane at a ratio of 1:10 g/mL, under continuous mechanical stirring through a magnetic stirrer from Heidolph Instruments GmbH & Co. KG (Schwabach, Germany) at ambient temperature for 24 h. The solvent evaporated at decreased pressure with a rotary evaporator (40 °C), and the recovered oils were weighed to determine lipid yield. The defatted residues were air-dried to remove residual solvent and stored at −40 °C for subsequent polar extraction.

2.3.2. Fatty Acid Profile

Fatty acid composition of the extracts was measured as previously established [25]. The recovered oils were esterified by base-catalyzed transesterification with methanolic KOH into fatty acid methyl esters (FAMEs). FAMEs were analyzed through a gas chromatograph coupled with a flame ionization detector (GC-FID) from Agilent Technologies (Santa Clara, CA, USA), Gas Chromatograph model 7890A, with a capillary column Omegawax (30 m × 320 μm × 0.25 μm) provided by Supelco (Bellefonte, PA, USA). Identification was conducted by the comparison of retention times with a certified FAME standard mixture (C8:0–C24:0). Results were presented as a relative proportion of the total detected fatty acids.

2.3.3. Antioxidant Activity of Oils

The radical scavenging activity of the oils was examined via the DPPH assay, as established in an already published study [25]. Briefly, oil samples were dissolved in ethyl acetate, mixed with a DPPH solution (0.1 mM), and incubated in the dark for 30 min. Trolox was used as a positive control. Absorbance was measured at 515 nm utilizing a UV–1900i PharmaSpec double-beam spectrophotometer manufactured by Shimadzu (Kyoto, Japan), and results were expressed as μmol Trolox equivalents (TE)/g oil.

2.3.4. Oxidative Stability Indices

Oxidative stability was assessed by measuring peroxide value (PV) according to the AOCS official method [26], expressed as mmol H2O2/kg oil, as previously discussed [25]. Specific extinction coefficients at 232 nm (K232) and 270 nm (K270) were determined spectrophotometrically in cyclohexane, providing information on primary and secondary oxidation products, respectively, as previously discussed [25].

2.3.5. Lipophilic Pigments

Spectrophotometric analysis of lipophilic pigments was performed on avocado peel and seed oil extracts dissolved in diethyl ether at a concentration of 0.3 g oil/mL. Measurements were carried out in 1.00 cm quartz cuvettes using a UV–Vis spectrophotometer (400–800 nm). For the peel extract, a 10-fold dilution was applied to avoid detector saturation due to high pigment content.
Carotenoid absorption maxima were identified in the 400–500 nm region, and chlorophylls in the 640–680 nm region. The %III/II ratio, defined as the ratio of the third to the second carotenoid absorption peak, was calculated to assess spectral fine structure and support pigment identification [27]:
% III / II = A III A II   ×   100
where AII and AIII are the absorbance values of the second and third carotenoid peaks, respectively.
Quantification of carotenoids was performed using the Beer-Lambert law:
C carotenoid   ( μ g / mL ) = A λ · V · 10 4 A 1 %
where Aλ is the absorbance at λmax, V is the dilution factor, and A1% is the specific absorption coefficient for the assigned carotenoid (2500 for carotenoids in diethyl ether) [27]. Final concentrations were expressed in mg pigment/kg oil using the known oil density:
C oil   ( mg / kg ) = C   ( μ g / mL ) 0.3
Chlorophyll a was quantified in the diluted peel oil extract using the Wellburn and Lichtenthaler [28] equation adapted for diethyl ether:
C a   ( μ g / mL ) = ( 16.36 × A 663.2 × F D ) ( 2.43 × A 646.8 × F D )
where FD denotes the dilution factor. The resulting concentration was corrected for the 10-fold dilution and converted to mg/kg oil as described above.

2.4. Experimental Design

A custom RSM design was employed to optimize the ultrasound-assisted extraction (UAE) of polar bioactive compounds from defatted avocado peel and seed residues. Five independent variables were considered: waste type (categorical: peel or seed), ultrasonic power (E), liquid-to-solid ratio (R), ethanol concentration (C), and extraction time (t). Continuous factors were studied at three coded levels (−1, 0, +1), corresponding to the actual values shown in Table 1. The ultrasonication (US) process was executed through an Elmasonic P70H bath obtained from Elma Schmidbauer GmbH (Singen, Germany). An EWJ 600–2M precision scale from Kern (Frankfurt, Germany) was employed to weigh the freeze-dried and ground material, while liquid supernatant separation from the solid byproduct was conducted through a NEYA 16R centrifuge from Remi Elektrotechnik Ltd. (Palghar, India), spinning the samples at 4500 rpm for 5 min. A total of 26 randomized experimental runs were performed. The responses evaluated were TPC, FRAP, DPPH radical scavenging activity, and AAC. Regression models were fitted to the data, and analysis of variance (ANOVA) was used to assess model significance [29]. Optimal conditions were determined using desirability functions to maximize antioxidant responses.
In addition to the Custom design, a stepwise multiple regression analysis was performed to identify the most significant linear, interaction, and quadratic terms affecting the extraction responses. The final predictive model for each response was expressed as a second-order polynomial equation of the form:
Y k = β 0 + i = 1 2 β i X i + i = 1 2 β ii X i 2 + i = 1 2 j = i + 1 3 β ij X i X j
where the independent variables are denoted by Xi and Xj, and the predicted response variable is defined by Yk. In the model, the intercept and regression coefficients β0, βi, βii, and βij represent the linear, quadratic, and interaction terms, respectively.

2.5. Extraction of Polar Compounds from Defatted Residues

Defatted powders of peel and seed were subjected to UAE under the conditions specified by the experimental design. Extractions were carried out in an ultrasonic bath with controlled temperature (<30 °C) to avoid degradation of thermolabile compounds. Ethanol–water mixtures were used as solvents according to the design matrix. After extraction, the mixtures were centrifuged at 4500 rpm for 10 min, filtered, and the supernatants were stored at −40 °C until analysis.

2.6. Determination of Antioxidant Parameters

2.6.1. Measurement of Total Polyphenolic Content (TPC)

A previous spectrophotometric approach [30] was used to quantify. Using a calibration curve for gallic acid, it was feasible to determine the TPC. Briefly, 200 μL of the sample was mixed with 200 μL of Folin–Ciocalteu reagent, and after 2 min, 1600 μL of 5% w/v aqueous sodium carbonate solution was added in a 2-mL Eppendorf tube. The mixture was incubated at 40 °C for 20 min and the absorbance was recorded at 740 nm. TPC was calculated in milligrams of gallic acid equivalents (GAE) for every gram of dry weight (dw), according to Equation (6), using a gallic acid calibration curve (R2 = 0.9995) ranging from 0 to 100 mg/L.
TPC   ( mg   GAE / g   dw ) = C T P × V w
where the volume of the extraction medium is indicated with V (expressed in L) and the dry weight of the sample as w (expressed in g).

2.6.2. Measurement of Ferric Reducing Antioxidant Power (FRAP)

In order to assess FRAP, a well-established method [31] was employed. In a 2-mL Eppendorf tube, 100 μL of properly diluted sample was mixed with 100 μL of FeCl3 solution (4 mM in 0.05 M HCl). The mixture was incubated at 37 °C for 30 min, with 1800 μL of TPTZ solution (1 mM in 0.05 M HCl) immediately added right after, and the absorbance was measured after 5 min at 620 nm. The absorbance was measured at 620 nm. A calibration curve (R2 = 0.9953) for ascorbic acid in 0.05 M HCl with values ranging from 50 to 500 μM was used to determine the ferric-reducing power (PR). PR was determined as μmol of ascorbic acid equivalents (AAE) per g of dw, as shown in Equation (7).
P R   ( μ mol   AAE / g   d w ) = C A A × V w
where the volume of the extraction medium is indicated with V (expressed in L) and the dry weight of the sample as w (expressed in g).

2.6.3. Measurement of DPPH Radical Scavenging Activity

Using an already established DPPH technique [30], the antioxidant activity of the extracts was further evaluated by assessing their ability to scavenge the DPPH radical. In brief, 50 μL of the sample was mixed with a quantity of 1950 μL of a 100 μM DPPH solution in methanol, with the solution being kept at room temperature for 30 min in the dark. Then, at 515 nm, the absorbance was recorded. In addition, the absorbance was tested instantly using a blank sample in place of the solution containing DPPH and methanol. The inhibition % was determined and the results were given as μmol AAE per g of dw (Equation (8)) utilizing an ascorbic acid calibration curve in methanol (0–1000 μM, R2 = 0.9926, Equation (9)).
%   Scavenging = A control A sample A control × 100
A AR   ( μ mol   AAE / g   d w ) = C A A × V w
where the volume of the extraction medium is indicated with V (expressed in L) and the dry weight of the sample as w (expressed in g).

2.6.4. Measurement of Ascorbic Acid Content

AAC was evaluated through a method successfully used in the past [32]. Briefly, 100 μL of the sample was mixed with 500 μL of 10% v/v Folin–Ciocalteu’s reagent (in water) and 900 μL of 10% w/v TCA. After 10 min, the absorbance was recorded at 760 nm. A calibration curve of ascorbic acid (R2 = 0.9980) with concentrations ranging from 0 to 500 mg/L was utilized to assess the results (Equation (10)).
AAC   ( mg   / g   dw ) = C A A × V w
where the volume of the extraction medium is indicated with V (expressed in L) and the dry weight of the sample as w (expressed in g).

2.6.5. HPLC Analysis

An HPLC system by Shimadzu Europa GmbH (Duisburg, Germany) was utilized to identify and quantify individual polyphenols of the extracts. A CBM–20A HPLC model was coupled to an SPD-M20A diode array detector (DAD). The separation of the compounds was feasible through a Luna C18(2) column (100 Å, 5 μm, 4.6 mm × 250 mm) by Phenomenex Inc. (Torrance, CA, USA). The HPLC analysis of specific polyphenols from the extracts originated from our previous research [32]. The mobile phase comprised 0.5% formic acid in acetonitrile (B) and 0.5% formic acid in an aqueous solution (A). The gradient program commenced at 0%, escalating to 40% B, then reaching 50% B over 10 min, followed by 70% B in an additional 10 min, and maintaining a constant value for 10 min. The flow rate of the mobile phase was maintained at a constant 1 mL/min. The compounds were identified and quantified through evaluating their absorbance spectra and retention times to those of pure standards, using calibration curves (0–50 μg/mL). In Table A1, the equations, along with R2, retention times, UVmax, LOD, and LOQ of all identified compounds, are provided. To support the classification of catechin derivatives, Figure A1 presents an overlay of UV-Vis spectra (200–400 nm) comparing the catechin standard with the five identified compounds.

2.7. Color Analysis

The Lovibond CAM-System 500 colorimeter by The Tintometer Ltd. (Amesbury, UK) was used to evaluate the CIELAB factors (L*, a*, and b*) of the samples. The color of the extracts following an already published protocol [32]. The L* coordinate defines brightness, ranging from 0 (black) to 100 (white), and the a* axis signifies the red–green dimension, with positive values indicating red and negative ones indicating green. Colors can be assessed by their b* values, which reflect their inclination towards yellow (positive values) or blue (negative values), respectively.

2.8. Statistical Analysis

Every statistical process conducted was through the JMP® Pro 16.0.0 (SAS Institute Inc., Cary, NC, USA). Mean ± standard deviation (SD) of at least three independent determinations (n = 3) was used as the final data presentation. The Shapiro–Wilk test was implemented to evaluate the normality of the data before its analysis. Comparisons between avocado peel and seed oils were conducted using one-way analysis of variance (ANOVA) followed by Tukey–Kramer’s HSD post hoc test to identify significant variations among means. Differences were considered statistically significant at p < 0.05. Multivariate analyses (principal component analysis, PCA, and partial least squares regression, PLS) were applied exclusively during the optimization of the extraction process, in order to evaluate the influence of experimental factors, identify significant variables, and guide the selection of optimal extraction conditions.

3. Results and Discussion

3.1. Peel and Seed Oils Analysis

3.1.1. Fatty Acid Composition

The fatty acid profiles of avocado peel and seed oils revealed distinct lipid signatures (Table 2). Both oils were rich in oleic acid (C18:1), with seed oil showing a higher content (48.09 ± 2.31%) compared to peel oil (42.05 ± 3.11%), although the difference was not statistically significant (p > 0.05). Saturated fatty acids (SFA) were also more abundant in seed oil (26.80 ± 0.69%) than in peel oil (24.28 ± 1.06%, p < 0.05), mainly due to higher levels of stearic acid (C18:0, 4.70%) and, and to a lesser extent, lignoceric acid (C24:0, 0.94%), while palmitic acid (C16:0) was present at comparable levels in both oils (~20%). Peel oil, on the other hand, was significantly richer in polyunsaturated fatty acids (PUFA), especially α-linolenic acid (C18:3, ω-3), which reached 9.72 ± 0.70% compared to only 0.61 ± 0.02% in seed oil (p < 0.001). This resulted in a markedly lower ω-6/ω-3 ratio in peel oil (2.25) versus seed oil (39.43), indicating superior anti-inflammatory potential [25,33]. Minor fatty acids such as lauric (C12:0), myristic (C14:0), behenic (C22:0), and erucic (C22:1) were detected in trace amounts, with lauric acid being notably higher in peel oil (3.17 ± 0.19%) than in seed oil (0.17 ± 0.01%). The PUFA:SFA ratio was significantly higher in peel oil (1.30 ± 0.04) compared to seed oil (0.92 ± 0.01), while the MUFA:PUFA ratio was higher in seed oil (1.95 ± 0.02) than in peel oil (1.39 ± 0.00), reflecting the dominance of oleic acid in the seed fraction.

3.1.2. Oxidative Stability and Antioxidant Activity

The oxidative stability and antioxidant activity of avocado peel and seed oils were evaluated through DPPH radical scavenging activity, conjugated dienes (CDs), conjugated trienes (CTs), and peroxide value (PV) (Table 3). Both oils exhibited comparable DPPH activity, with peel oil showing slightly higher values (15.49 ± 0.91 mmol TEAC/kg) than seed oil (14.97 ± 0.66 mmol TEAC/kg), although the differentiation was not of statistical significance (p > 0.05). However, significant differences were observed in oxidative degradation markers. Peel oil had higher peroxide values (PV) (16.95 ± 0.76 mmol H2O2/kg) compared to seed oil (13.50 ± 0.27 mmol H2O2/kg, p < 0.05), indicating greater primary oxidation. Similarly, CDs and CTs were markedly elevated in peel oil (33.56 ± 2.52 and 10.52 ± 0.36 mmol/kg, respectively) versus seed oil (11.51 ± 0.51 and 1.67 ± 0.13 mmol/kg, p < 0.001), reflecting enhanced formation of secondary oxidation products. These results are consistent with the fatty acid profiles, where peel oil contained significantly higher levels of PUFA (especially C18:3), rendering it more susceptible to oxidative degradation. Despite this, its antioxidant activity remained slightly superior, likely due to the presence of tocopherols and polyphenolic compounds co-extracted with the oil.

3.1.3. Pigment Composition and Spectral Characteristics

UV–Vis spectral analysis revealed distinct pigment profiles in avocado peel and seed oils (Figure 2). The seed oil exhibited three carotenoid absorption maxima at 420, 442, and 470 nm, with a %III/II ratio of 83.8%, consistent with lutein-type xanthophylls. The peel oil showed two carotenoid peaks at 432 and 470 nm, alongside a strong chlorophyll a absorption at 661 nm, indicating a mixed pigment composition. Quantitative estimates based on specific extinction coefficients suggested that peel oil contained 253.1 ± 15.95 mg/kg of α-carotene-equivalent and 209.4 ± 9.76 mg/kg of chlorophyll a, while seed oil contained 29.2 ± 2.16 mg/kg of lutein-equivalent (Table 4). These results confirm the pigment-rich nature of peel oil, with nearly 9-fold higher carotenoid content and substantial chlorophyll a levels compared to seed oil. While this enhances its antioxidant potential, it also increases susceptibility to photooxidative degradation, especially under light exposure [34]. The pigment concentrations reported in Table 4 are consistent with literature values for carotenoid- and chlorophyll-rich fruit residues, and reflect the high extraction efficiency and spectral clarity achieved using diethyl ether as solvent [35,36].
Taken together, the fatty acid profiles, oxidative stability markers, and pigment composition reveal complementary properties of avocado peel and seed oils. Seed oil offers greater oxidative resistance and a safer pigment profile dominated by lutein, while peel oil provides a richer source of carotenoids and chlorophylls, with enhanced antioxidant potential but increased susceptibility to degradation. These findings support the targeted valorization of each fraction for distinct functional applications, provided appropriate stabilization and formulation strategies are employed.

3.2. Experimental Results of the RSM Design

The experimental results of the 26 design points are presented in Table 5. TPC values ranged from 3.72 to 103.14 mg GAE/g dw, FRAP from 61.61 to 602.39 µmol AAE/g dw, DPPH from 53.58 to 1103.76 µmol AAE/g dw, and AAC from 1.90 to 17.19 mg/g dw. The highest TPC was observed in peel extracts at 100% ultrasonic power and 50% ethanol (Run 17), while the strongest DPPH activity was obtained in seed extracts at 100% ultrasonic power and 100% ethanol (Run 10). These results highlight the strong dependence of antioxidant responses on both matrix type and extraction conditions.
The regression analysis revealed distinct but complementary patterns across the four antioxidant responses (Table 6). TPC and FRAP were consistently higher in peel extracts, with ethanol concentration emerging as the most influential factor. Both responses showed strong quadratic effects of ethanol (optimum ≈ 50% v/v), confirming that intermediate solvent polarity maximizes polyphenolic recovery and reducing power. FRAP was additionally enhanced by higher liquid-to-solid ratios, indicating that solvent availability plays a critical role in extracting reducing compounds. In contrast, DPPH activity was markedly stronger in seed extracts, highlighting compositional differences between the two matrices. DPPH was positively influenced by ethanol concentration, solvent ratio, and ultrasonic power, with several significant two-factor interactions (e.g., Ratio × Ethanol, Waste × Ethanol, Power × Ratio). These results suggest that radical scavenging compounds in seeds are more efficiently released under harsher extraction conditions. For AAC, peel extracts consistently yielded higher values, with solvent ratio being the dominant positive factor. Ethanol concentration exerted a negative linear effect, again with a quadratic optimum at intermediate levels. Strong interactions (Waste × Ratio, Waste × Ethanol) confirmed that peel matrices respond differently to solvent composition compared to seeds. Overall, the models demonstrated high predictive power (R2 > 0.93 for all responses, up to 0.989 for AAC). The consistent significance of ethanol concentration and its quadratic term across all responses underscores the importance of solvent polarity in balancing the extraction of both hydrophilic and moderately lipophilic antioxidants. The divergence between peel (higher TPC, FRAP, AAC) and seed (higher DPPH) highlights the complementary bioactive potential of the two by-products, supporting their combined valorization [37].

3.3. Model Analysis

The experimental data obtained from the custom RSM design were fitted to second-order polynomial models. Non-significant terms (p > 0.05) were removed through stepwise regression, resulting in reduced quadratic equations with high coefficients of determination (R2 = 0.93–0.99). To preserve model hierarchy, linear terms were retained when their corresponding quadratic or interaction terms were significant. The final reduced models are presented below (Equations (11)–(14)), containing only statistically significant predictors (p < 0.05).
The fitted models for TPC, FRAP, DPPH radical scavenging activity, and AAC are presented below in coded variables. Waste type was included as a categorical factor (W = +1 for peel, W = −1 for seed):
TPC = 98.5 − 1.43X2 + 1.84X4 + 0.0105X22 − 0.0190X42 + 0.125X52 + 0.0049X2X3 − 0.0025X2X4 + 0.0026X3X4 +
W(12.6 + 0.120X2 − 0.286X4)
FRAP = 94.9 − 10.2X2 + 11.2X3 + 5.85X4 + 23.8X5 + 0.094X22 − 0.065X42 − 0.042X2X3 − 0.135X2X5 − 0.034X3X4
0.271X3X5 + W(44.7 − 55.6 − 1.59X4)
DPPH = 259.1 − 2.32X2 + 3.58X3 − 1.80X4 − 11.7X5 + 0.700X52 + 0.0586X2X3 + 0.0326X2X4 + 0.0618X3X4
0.208X3X5 − 0.0874X4X5 + W(259.0 − 3.03X2 + 0.637X3 − 1.72X4 + 3.93X5)
AAC = 1.85 + 0.00431X2 + 0.168X3 − 0.00519X4 + 0.139X5 − 0.000292X42 + 0.000256X2X4 − 0.00167X2X5 +
W(1.09 + 0.0511X3 − 0.0299X4)
The interaction plots provide additional insight into the regression models by visually confirming the combined effects of the experimental factors on each antioxidant response. These graphical representations complement the statistical outputs and facilitate the interpretation of matrix-dependent differences between peel and seed extracts. To visualize the interaction effects identified in the regression models, response surface and contour plots were generated for each antioxidant response of avocado peel and seed extracts. For clarity, the results are presented in four separate figures: Figure 3 (TPC), Figure 4 (FRAP), Figure 5 (DPPH), and Figure 6 (AAC). Each figure contains three (or two for AAC) representative two-factor interactions, with the sample type (X1: peel or seed) shown separately. All other factors were fixed at their central levels. This arrangement highlights the most influential parameter combinations and allows direct comparison of matrix-dependent trends. As shown in Figure 3, Figure 4, Figure 5 and Figure 6, peel extracts generally exhibited higher TPC, FRAP, and AAC values, whereas seed extracts aligned more strongly with DPPH activity. These visualizations confirm the statistical findings and provide an intuitive representation of how factor interactions drive antioxidant capacity in each matrix.
The optimization profiler identified distinct extraction conditions for each antioxidant response (Table 7). TPC was maximized in peel extracts (105.98 ± 12.94 mg GAE/g) under high power, moderate ratio, and low ethanol concentration. FRAP also peaked in peel extracts (673.89 ± 141 µmol AAE/g) at a low ratio and intermediate ethanol. In contrast, DPPH activity was highest in seed extracts (1071.31 ± 131.16 µmol AAE/g) under harsher conditions (high ratio, low ethanol, high power). Finally, AAC reached its maximum in peel extracts (17.9 ± 1.18 mg/g) at a low ratio and extended extraction time. All models achieved high desirability values (>0.87), confirming the robustness of the optimization. These findings highlight the complementary bioactive potential of avocado peel (rich in polyphenols, reducing power, and ascorbic acid) and seed (strong radical scavenging activity).

3.4. Impact of Extraction Parameters on Antioxidant Assays Through Pareto Plot Analysis

The relative influence of the extraction parameters on each antioxidant response was further evaluated through Pareto plot analysis (Figure 7). The standardized effects highlight both the magnitude and direction of each factor, with statistical significance determined at p < 0.05. For TPC, ethanol concentration (X4) was the dominant factor, with a strong negative linear effect and a highly significant quadratic term (X42), indicating an optimum at low–moderate ethanol levels. Waste type (X1) was also significant, with peel extracts yielding higher TPC than seeds. Additional curvature effects of power (X22) and time (X52) suggested optima at intermediate levels, while solvent-to-solid ratio (X3) had a negligible impact. In the case of FRAP, solvent ratio (X3) exerted the strongest positive effect, while ethanol concentration (X4) again showed a negative linear and quadratic influence. Waste type (X1) favored peel extracts, and significant interactions (X1 × X4, X3 × X5) revealed that ethanol and time modulated the efficiency of polyphenolic recovery differently across matrices. Power contributed mainly through a quadratic effect (X22), suggesting an optimum at intermediate intensity. The DPPH model was the most interaction-rich. Ratio (X3), ethanol (X4), and power (X2) were strong positive drivers, whereas time (X5) had a negative effect. Numerous interactions were significant, including Waste × Power (X1 × X2), Waste × Ethanol (X1 × X4), Ratio × Ethanol (X3 × X4), and Ratio × Time (X3 × X5). These results confirm that seed extracts, under conditions of high ratio, high ethanol, and strong ultrasonic power, achieved the highest radical scavenging activity, while prolonged extraction reduced activity. For AAC, solvent ratio (X3) and waste type (X1) were the most influential positive factors, with peel extracts showing higher ascorbic acid content. Ethanol concentration (X4) had a strong negative effect, both linear and quadratic, indicating that moderate ethanol levels are optimal. Significant interactions (X1 × X3, X1 × X4) highlighted the matrix-dependent response, with peel extracts benefiting more from a high ratio but being more sensitive to ethanol increase. Additional interactions (X2 × X4, X2 × X5) suggested that power and time jointly modulate ascorbic acid stability. Overall, Pareto analysis confirmed that ethanol concentration and waste type were the most consistent determinants across assays, while ratio, power, and time exerted assay-specific effects. Peel extracts were superior in TPC, FRAP, and AAC, whereas seed extracts excelled in DPPH. These findings align with the optimization results and highlight the complementary bioactive potential of avocado peel and seed.

3.5. Principal Component Analysis (PCA) and Multivariate Component Analysis (MCA)

PCA and MCA were applied to explore the interrelationships among the antioxidant ability of AP and AS extracts (Figure 8, Table 8). The correlation matrix revealed strong positive interactions between TPC and FRAP (r = 0.74), as well as between FRAP and AAC (r = 0.69), confirming that polyphenolic compounds and ascorbic acid jointly contribute to reducing power. Moderate correlations were observed between AAC and DPPH (r = 0.59) and between TPC and AAC (r = 0.53), while DPPH showed only weak correlation with TPC (r = 0.31) and moderate correlation with FRAP (r = 0.43). Variable clustering grouped all four assays into a single cluster, with FRAP identified as the most representative variable, explaining 66.5% of the total variation. Within this cluster, FRAP and AAC exhibited the highest R2 with the cluster (0.80 and 0.75, respectively), followed by TPC (0.64) and DPPH (0.47). This indicates that while all assays are interrelated, FRAP best captures the shared variance across the dataset. The PCA biplot further supported these findings, with TPC, FRAP, and AAC loading strongly on the first principal component (PC1), while DPPH contributed more distinctly to PC2, separating seed extracts from peel extracts. This multivariate structure highlights the complementary nature of the assays: peel extracts are characterized by higher polyphenols, reducing power, and ascorbic acid, whereas seed extracts are distinguished by stronger radical scavenging activity. Collectively, these multivariate analyses demonstrate that while peel extracts are enriched in polyphenols and ascorbic acid, seed extracts excel in radical scavenging. This complementary behavior underscores the importance of integrating multiple assays and multivariate tools (PCA, MCA) to capture the full spectrum of antioxidant potential in avocado by-products.

3.6. Partial Least Squares (PLS) Analysis

PLS regression was employed to optimize the extraction conditions and validate the predictive performance of the model. The PLS model with 15 latent factors explained 85.8% of the total variance in X and 99.98% of the variance in Y, with cross-validation indicating that the first 7–8 factors contributed most to predictive ability. The Prediction Profiler (Figure 9A) illustrated the response surfaces for each assay, confirming that moderate ethanol concentration, optimized solvent ratio, and peel matrix favored higher TPC, FRAP, and AAC, whereas seed extracts were associated with enhanced DPPH activity. The Variable Importance in Projection (VIP) scores (Figure 9B) identified the solvent-to-solid ratio (X3), the interactions of waste type with ratio (X1 × X3) and ethanol (X1 × X4), and the quadratic effect of ethanol (X42) as the most influential factors (VIP > 1.5).
The optimized conditions (X1 = peel, X2 = 100 W, X3 = 70 mL/g, X4 = 45% ethanol, X5 = 5 min) yielded predicted values of 105.36 mg GAE/g (TPC), 578.38 μmol AAE/g (FRAP), 565.01 μmol AAE/g (DPPH), and 14.64 mg/g (AAC), with an overall desirability of 0.736. Experimental validation under these conditions confirmed the model’s accuracy, with observed values of 87.79 ± 5.00 mg GAE/g (TPC), 741.4 ± 43.9 μmol AAE/g (FRAP), 616.1 ± 13.9 μmol AAE/g (DPPH), and 10.8 ± 0.7 mg/g (AAC) (Table 9). These results are remarkable, as a previous study [17] reported TPC values almost 4 times lower in AS. A similar result was drawn from Hefzalrahman et al. [38] who determined ~35 mg GAE/g dw on AP. In another study by Lyu et al. [39] determined ~78 mg GAE/g dw on AP. Moreover, Kamaraj et al. [40] 51.52 mg GAE/g on aqueous AP extracts. Ascorbic acid content was also determined on AP by another researcher, and the value was significantly lower than ours, at 4.1 ± 2.7 mg/100 g [41]. All of these reinforce the importance of this research, highlighting the positive impact of the optimized UAE model on AP.
To further characterize the optimized extract, HPLC analysis was performed to identify and quantify individual polyphenolic compounds (Table 10, Figure 10). A total of 12 compounds were detected, yielding a cumulative concentration of 10.48 ± 0.47 mg/g dry weight. The most abundant constituents were catechin derivative 1 (2.21 ± 0.13 mg/g), chlorogenic acid (1.65 ± 0.06 mg/g), and catechin derivative 3 (1.60 ± 0.04 mg/g), followed by vanillic acid (1.20 ± 0.04 mg/g) and catechin derivative 2 (1.17 ± 0.06 mg/g). These findings highlight the dominance of flavan-3-ols and hydroxycinnamic acids in the extract. Classical antioxidants such as catechin (0.62 ± 0.02 mg/g), epicatechin (0.25 ± 0.01 mg/g), and 3-hydroxytyrosol (0.34 ± 0.02 mg/g) were also present, supporting the extract’s radical scavenging activity observed in DPPH and FRAP assays [42,43,44]. The detection of luteolin-7-glucoside (0.29 ± 0.01 mg/g) adds further bioactivity, while homovanillic acid (0.35 ± 0.03 mg/g) may reflect partial transformation or microbial activity during extraction [45,46]. Chlorogenic acid is abundant in AP, which was an anticipated outcome. Other scientists [47] determined chlorogenic acid and other (caffeoyl)quinic derivatives on AS. Vanillic acid is also another abundant polyphenol in the optimal extract. Jimenez et al. [21] reported this compound both as an AS and an AP, along with catechin and luteolin. Also, Trujillo-Mayol et al. [48] analyzed AP extracts with high-resolution mass spectrometry and reported several polyphenolic compounds, like catechin and some derivatives and chlorogenic acid. Overall, the polyphenolic profile is dominated by catechin-type structures, with five derivatives contributing significantly to the total. This suggests either structural diversity within the extract or partial polymerization/oxidation during processing. As illustrated in Figure A1, the overlay of UV–Vis spectra confirms the similarity in peak positions and absorbance profiles between the catechin standard and the identified compounds, justifying their designation as catechin-related structures. The high content of chlorogenic acid and vanillic acid further supports the extract’s potential for nutraceutical and functional food applications.

4. Conclusions

This study demonstrated the effective valorization of avocado peel and seed residues through optimized extraction and comprehensive characterization of their bioactive profiles. Multivariate modeling (PLS) guided the optimization of extraction conditions, identifying peel extracts as superior in total polyphenolic content (TPC), ferric reducing antioxidant power (FRAP), and ascorbic acid content (AAC), while seed extracts exhibited enhanced DPPH radical scavenging activity. Detailed HPLC analysis confirmed the presence of 12 distinct polyphenolic compounds in the peel extract, including chlorogenic acid, vanillic acid, catechin, epicatechin, 3-hydroxytyrosol, and luteolin-7-glucoside, with a total concentration of 10.48 ± 0.47 mg/g dry weight. The dominance of catechin-type structures and hydroxycinnamic acids supports the extract’s potent antioxidant activity and highlights its potential for nutraceutical applications. Fatty acid profiling revealed that seed oil was richer in monounsaturated fatty acids (MUFAs), particularly oleic acid, and exhibited greater oxidative stability, whereas peel oil contained significantly higher levels of polyunsaturated fatty acids (PUFAs), especially α-linolenic acid (ω-3), resulting in a favorable ω-6/ω-3 ratio and enhanced cardioprotective potential. Spectrophotometric analysis further highlighted the pigment richness of peel oil, with high concentrations of α-carotene (253.1 ± 15.95 mg/kg) and chlorophyll a (207.7 ± 9.76 mg/kg), while seed oil was dominated by lutein-type xanthophylls (29.2 ± 2.16 mg/kg). Despite the increased susceptibility of peel oil to oxidative degradation, its superior antioxidant and pigment profile suggests promising applications in functional foods, nutraceuticals, and natural colorant formulations. Seed oil, with its MUFA dominance and oxidative resilience, may serve as a stable lipid carrier or base oil in antioxidant-enriched systems. Overall, avocado peel and seed fractions offer complementary bioactive properties, and their targeted utilization could support sustainable by-product valorization strategies in the agri-food sector.

Author Contributions

Conceptualization, V.A. and S.I.L.; methodology, V.A., software, V.A.; validation, V.A.; formal analysis, M.M., E.B. and V.A.; investigation, M.M., V.-I.T. and A.P.; resources, S.I.L.; data curation, A.P., M.M. and V.-I.T.; writing—original draft preparation, V.A. and M.M.; writing—review and editing, V.A., M.M., E.B. and S.I.L.; visualization, M.M., V.-I.T. and A.P.; supervision, V.A. and S.I.L.; project administration, S.I.L.; funding acquisition, S.I.L. All authors have read and agreed to the published version of the manuscript.

Funding

This research received no external funding.

Institutional Review Board Statement

Not applicable.

Informed Consent Statement

Not applicable.

Data Availability Statement

The original contributions presented in this study are included in the article. Further inquiries can be directed to the corresponding author.

Acknowledgments

The authors gratefully acknowledge Stamatis Petrantonakis for his generous provision of Hass avocado fruits and his valuable assistance during the sampling process in Agia village, Chania, Crete, Greece.

Conflicts of Interest

The authors declare no conflicts of interest.

Abbreviations

The following abbreviations are used in this manuscript:
AACAscorbic Acid Content
AAEAscorbic Acid Equivalents
ANOVAAnalysis of Variance
APAvocado Peel
ASAvocado Seed
CDConjugated Dienes
CTConjugated Trienes
DADDiode Array Detector
DPPH2,2-Diphenyl-1-picrylhydrazyl
dwDry Weight
FAMEFatty Acid Methyl Esters
FRAPFerric Reducing Antioxidant Power
GAEGallic Acid Equivalents
GC-FIDGas Chromatography with Flame Ionization Detector
HPLCHigh-Performance Liquid Chromatography
LODLimit of Detection
LOQLimit of Quantification
MUFAMonounsaturated Fatty Acids
PCAPrincipal Component Analysis
PLSPartial Least Squares
PUFAPolyunsaturated Fatty Acids
PVPeroxide Value
ROSReactive Oxygen Species
RSMResponse Surface Methodology
SDStandard Deviation
SFASaturated Fatty Acids
TETrolox Equivalents
TPCTotal Polyphenolic Content
TPTZ2,4,6-Tris(2-pyridyl)-s-triazine
UAEUltrasound-Assisted Extraction
UV-VisUltraviolet-Visible Spectroscopy
VIPVariable Importance in Projection

Appendix A

Table A1. Calibration equations, correlation coefficients (R2), retention times (RT), UV absorbance maxima (UVmax), limits of detection (LOD), and quantification (LOQ) for all identified polyphenolic compounds. For catechin derivatives 1–5, identification was based on spectral similarity to the catechin standard, as shown in Figure A1.
Polyphenolic CompoundEquation (Linear)R2RT (min)UVmax (nm)LOD (mg/L)LOQ (mg/L)
3-Hydroxytyrosoly = 183,448.37x – 251,422.04 0.99714.5522782.878.69
Catechiny = 11,920.78x − 128.190.99720.9332782.547.71
Chlorogenic acidy = 50,320.40x − 23,038.360.99421.9473253.6711.11
Vanillic acidy = 28,178.39x + 15,571.900.99923.9002702.316.99
Homovanillic acidy = 18,843.08x + 6856.980.99924.4582791.183.59
Epicatechiny = 142,099.00x + 4705.94 0.99925.8212780.190.58
Luteolin-7-glucosidey = 34,875.94x − 16,827.360.99936.9493471.283.89
Figure A1. Overlay of UV–Vis spectra (200–400 nm) for catechin standard and the five identified catechin derivatives.
Antioxidants 14 01293 g0a1

References

  1. Mucha, P.; Skoczyńska, A.; Małecka, M.; Hikisz, P.; Budzisz, E. Overview of the Antioxidant and Anti-Inflammatory Activities of Selected Plant Compounds and Their Metal Ions Complexes. Molecules 2021, 26, 4886. [Google Scholar] [CrossRef]
  2. Perillo, B.; Di Donato, M.; Pezone, A.; Di Zazzo, E.; Giovannelli, P.; Galasso, G.; Castoria, G.; Migliaccio, A. ROS in Cancer Therapy: The Bright Side of the Moon. Exp. Mol. Med. 2020, 52, 192–203. [Google Scholar] [CrossRef] [PubMed]
  3. Gulcin, İ. Antioxidants and Antioxidant Methods: An Updated Overview. Arch. Toxicol. 2020, 94, 651–715. [Google Scholar] [CrossRef]
  4. Dumanović, J.; Nepovimova, E.; Natić, M.; Kuča, K.; Jaćević, V. The Significance of Reactive Oxygen Species and Antioxidant Defense System in Plants: A Concise Overview. Front. Plant Sci. 2021, 11, 552969. [Google Scholar] [CrossRef]
  5. Sies, H. Oxidative Stress: A Concept in Redox Biology and Medicine. Redox Biol. 2015, 4, 180–183. [Google Scholar] [CrossRef]
  6. Kyriakopoulou, E.; Tsakni, A.; Korakidis, E.; Mpekoulis, G.; Kalliampakou, K.I.; Polanska, M.; Van Impe, J.F.M.; Tsakali, E.; Houhoula, D.; Vassilaki, N. Evaluation of Polyphenolic Compounds Common in Greek Medicinal Plants for Their Antioxidant Effects and Antiviral Activity Against Dengue and Yellow Fever Viruses. Antioxidants 2025, 14, 1103. [Google Scholar] [CrossRef] [PubMed]
  7. Hadidi, M.; Liñán-Atero, R.; Tarahi, M.; Christodoulou, M.C.; Aghababaei, F. The Potential Health Benefits of Gallic Acid: Therapeutic and Food Applications. Antioxidants 2024, 13, 1001. [Google Scholar] [CrossRef] [PubMed]
  8. Lang, Y.; Gao, N.; Zang, Z.; Meng, X.; Lin, Y.; Yang, S.; Yang, Y.; Jin, Z.; Li, B. Classification and Antioxidant Assays of Polyphenols: A Review. J. Future Foods 2024, 4, 193–204. [Google Scholar] [CrossRef]
  9. ‘Aqilah, N.M.N.; Rovina, K.; Felicia, W.X.L.; Vonnie, J.M. A Review on the Potential Bioactive Components in Fruits and Vegetable Wastes as Value-Added Products in the Food Industry. Molecules 2023, 28, 2631. [Google Scholar] [CrossRef]
  10. Marianne, L.-C.; Lucía, A.-G.; De Jesús, M.-S.M.; Eric Leonardo, H.-M.; Mendoza-Sánchez, M. Optimization of the Green Extraction Process of Antioxidants Derived from Grape Pomace. Sustain. Chem. Pharm. 2024, 37, 101396. [Google Scholar] [CrossRef]
  11. Galanakis, C.M. Recovery of High Added-Value Components from Food Wastes: Conventional, Emerging Technologies and Commercialized Applications. Trends Food Sci. Technol. 2012, 26, 68–87. [Google Scholar] [CrossRef]
  12. Mantiniotou, M.; Athanasiadis, V.; Kalompatsios, D.; Lalas, S.I. Optimization of Carotenoids and Other Antioxidant Compounds Extraction from Carrot Peels Using Response Surface Methodology. Biomass 2025, 5, 3. [Google Scholar] [CrossRef]
  13. Pereira, T.C.; Souza, V.P.; Padilha, A.P.F.; Duarte, F.A.; Flores, E.M. Trends and Perspectives on the Ultrasound-Assisted Extraction of Bioactive Compounds Using Natural Deep Eutectic Solvents. Curr. Opin. Chem. Eng. 2025, 47, 101088. [Google Scholar] [CrossRef]
  14. Zhu, Y.; Luan, Y.; Zhao, Y.; Liu, J.; Duan, Z.; Ruan, R. Current Technologies and Uses for Fruit and Vegetable Wastes in a Sustainable System: A Review. Foods 2023, 12, 1949. [Google Scholar] [CrossRef]
  15. Rao, M.V.; Sengar, A.S.; Rawson, A. Ultrasonication-A Green Technology Extraction Technique for Spices: A Review. Trends Food Sci. Technol. 2021, 116, 975–991. [Google Scholar] [CrossRef]
  16. Siddiqui, S.A.; Ali Redha, A.; Salauddin, M.; Harahap, I.A.; Rupasinghe, H.P.V. Factors Affecting the Extraction of (Poly)Phenols from Natural Resources Using Deep Eutectic Solvents Combined with Ultrasound-Assisted Extraction. Crit. Rev. Anal. Chem. 2025, 55, 139–160. [Google Scholar] [CrossRef]
  17. Nyakang’i, C.O.; Marete, E.; Ebere, R.; Arimi, J.M. Physicochemical Properties of Avocado Seed Extract Model Beverages and Baked Products Incorporated with Avocado Seed Powder. Int. J. Food Sci. 2023, 2023, 6860806. [Google Scholar] [CrossRef]
  18. Salazar-López, N.J.; Domínguez-Avila, J.A.; Yahia, E.M.; Belmonte-Herrera, B.H.; Wall-Medrano, A.; Montalvo-González, E.; González-Aguilar, G.A. Avocado Fruit and By-Products as Potential Sources of Bioactive Compounds. Food Res. Int. 2020, 138, 109774. [Google Scholar] [CrossRef]
  19. FAOSTAT. Food and Agriculture Association of the United States. Available online: http://www.fao.org/faostat/en/ (accessed on 27 March 2024).
  20. Kupnik, K.; Primožič, M.; Kokol, V.; Knez, Ž.; Leitgeb, M. Enzymatic, Antioxidant, and Antimicrobial Activities of Bioactive Compounds from Avocado (Persea Americana L.) Seeds. Plants 2023, 12, 1201. [Google Scholar] [CrossRef] [PubMed]
  21. Jimenez, P.; Garcia, P.; Quitral, V.; Vasquez, K.; Parra-Ruiz, C.; Reyes-Farias, M.; Garcia-Diaz, D.F.; Robert, P.; Encina, C.; Soto-Covasich, J. Pulp, Leaf, Peel and Seed of Avocado Fruit: A Review of Bioactive Compounds and Healthy Benefits. Food Rev. Int. 2021, 37, 619–655. [Google Scholar] [CrossRef]
  22. Akan, S. Phytochemicals in Avocado Peel and Their Potential Uses. Food Health 2021, 7, 138–149. [Google Scholar] [CrossRef]
  23. Kautsar, D.B.; Rois, M.F.; Faizah, N.; Widiyastuti, W.; Nurtono, T.; Setyawan, H. Antioxidant and Antimicrobial Agents from Avocado (Persea Americana) Seed Extract Encapsulated in Gum Arabic through Spray Drying Method. Period. Polytech. Chem. Eng. 2023, 67, 161–171. [Google Scholar] [CrossRef]
  24. Nascimento, A.P.S.; Duarte, M.E.M.; Rocha, A.P.T.; Barros, A.N. Valorization of Avocado (Persea Americana) Peel and Seed: Functional Potential for Food and Health Applications. Antioxidants 2025, 14, 1032. [Google Scholar] [CrossRef] [PubMed]
  25. Athanasiadis, V.; Kalompatsios, D.; Mantiniotou, M.; Lalas, S.I. Investigation into the Reduction of Palm Oil in Foods by Blended Vegetable Oils through Response Surface Methodology and Oxidative Stability Tests. Antioxidants 2024, 13, 929. [Google Scholar] [CrossRef] [PubMed]
  26. International Dairy Federation. Anhydrous Milkfat: Determination of Peroxide Value (IDF Standard 74A:1991); IDF: Brussels, Belgium, 1991.
  27. Scott, K.J. Detection and Measurement of Carotenoids by UV/VIS Spectrophotometry. Curr. Protoc. Food Anal. Chem. 2001, F2.2.1–F2.2.10. [Google Scholar] [CrossRef]
  28. Wellburn, A.R.; Lichtenthaler, H. Formulae and Program to Determine Total Carotenoids and Chlorophylls A and B of Leaf Extracts in Different Solvents. In Advances in Photosynthesis Research: Proceedings of the VIth International Congress on Photosynthesis, Brussels, Belgium, August 1–6, 1983 Volume 2; Sybesma, C., Ed.; Springer: Dordrecht, The Netherlands, 1984; pp. 9–12. ISBN 978-94-017-6368-4. [Google Scholar]
  29. Bezerra, M.A.; Santelli, R.E.; Oliveira, E.P.; Villar, L.S.; Escaleira, L.A. Response Surface Methodology (RSM) as a Tool for Optimization in Analytical Chemistry. Talanta 2008, 76, 965–977. [Google Scholar] [CrossRef] [PubMed]
  30. Mantiniotou, M.; Athanasiadis, V.; Liakos, K.G.; Bozinou, E.; Lalas, S.I. Artificial Intelligence and Extraction of Bioactive Compounds: The Case of Rosemary and Pressurized Liquid Extraction. Processes 2025, 13, 1879. [Google Scholar] [CrossRef]
  31. Athanasiadis, V.; Mantiniotou, M.; Kalompatsios, D.; Makrygiannis, I.; Alibade, A.; Lalas, S.I. Evaluation of Antioxidant Properties of Residual Hemp Leaves Following Optimized Pressurized Liquid Extraction. AgriEngineering 2025, 7, 1. [Google Scholar] [CrossRef]
  32. Mantiniotou, M.; Athanasiadis, V.; Kalompatsios, D.; Bozinou, E.; Ntourtoglou, G.; Dourtoglou, V.G.; Lalas, S.I. Atmospheric Room Temperature Plasma as a Green Pretreatment Strategy for Enhanced Phytochemical Extraction from Moringa Oleifera Leaves. Foods 2025, 14, 3233. [Google Scholar] [CrossRef]
  33. Athanasiadis, V.; Chatzimitakos, T.; Kalompatsios, D.; Palaiogiannis, D.; Makrygiannis, I.; Bozinou, E.; Lalas, S.I. Evaluation of the Efficacy and Synergistic Effect of α- and δ-Tocopherol as Natural Antioxidants in the Stabilization of Sunflower Oil and Olive Pomace Oil during Storage Conditions. Int. J. Mol. Sci. 2023, 24, 1113. [Google Scholar] [CrossRef]
  34. Sandmann, G. Antioxidant Protection from UV-and Light-Stress Related to Carotenoid Structures. Antioxidants 2019, 8, 219. [Google Scholar] [CrossRef]
  35. Flieger, J.; Raszewska-Famielec, M.; Radzikowska-Büchner, E.; Flieger, W. Skin Protection by Carotenoid Pigments. Int. J. Mol. Sci. 2024, 25, 1431. [Google Scholar] [CrossRef]
  36. Foppen, F.H. Tables for the Identification of Carotenoid Pigments. Chromatogr. Rev. 1971, 14, 133–298. [Google Scholar] [CrossRef]
  37. Rodríguez-Carpena, J.G.; Morcuende, D.; Estévez, M. Avocado By-Products as Inhibitors of Color Deterioration and Lipid and Protein Oxidation in Raw Porcine Patties Subjected to Chilled Storage. Meat Sci. 2011, 89, 166–173. [Google Scholar] [CrossRef]
  38. Hefzalrahman, T.; Morsi, M.K.S.; Morsy, N.F.S.; Hammad, K.S.M. Application of Enzyme and Ultrasound Assisted Extraction of Polyphenols from Avocado (Persea Americana Mill.) Peel as Natural Antioxidants. Acta Sci. Pol. Technol. Aliment. 2022, 21, 129–138. [Google Scholar] [CrossRef]
  39. Lyu, X.; Agar, O.T.; Barrow, C.J.; Dunshea, F.R.; Suleria, H.A.R. Phenolic Compounds Profiling and Their Antioxidant Capacity in the Peel, Pulp, and Seed of Australian Grown Avocado. Antioxidants 2023, 12, 185. [Google Scholar] [CrossRef] [PubMed]
  40. Kamaraj, M.; Dhana Rangesh Kumar, V.; Nithya, T.G.; Danya, U. Assessment of Antioxidant, Antibacterial Activity and Phytoactive Compounds of Aqueous Extracts of Avocado Fruit Peel from Ethiopia. Int. J. Pept. Res. Ther. 2020, 26, 1549–1557. [Google Scholar] [CrossRef]
  41. Vinha, A.; Moreira, J.; Barreira, S. Physicochemical Parameters, Phytochemical Composition and Antioxidant Activity of the Algarvian Avocado (Persea Americana Mill.). J. Agric. Sci. 2013, 5, 100. [Google Scholar] [CrossRef]
  42. Bae, J.; Kim, N.; Shin, Y.; Kim, S.-Y.; Kim, Y.-J. Activity of Catechins and Their Applications. Biomed. Dermatol. 2020, 4, 8. [Google Scholar] [CrossRef]
  43. Prakash, M.; Basavaraj, B.V.; Chidambara Murthy, K.N. Biological Functions of Epicatechin: Plant Cell to Human Cell Health. J. Funct. Foods 2019, 52, 14–24. [Google Scholar] [CrossRef]
  44. Abate, M.; Pisanti, S.; Caputo, M.; Citro, M.; Vecchione, C.; Martinelli, R. 3-Hydroxytyrosol Promotes Angiogenesis In Vitro by Stimulating Endothelial Cell Migration. Int. J. Mol. Sci. 2020, 21, 3657. [Google Scholar] [CrossRef] [PubMed]
  45. Selka, A.; Ndongou Moutombi, F.J.; Cormier, M.; Touaibia, M. Phenethyl Esters and Amide of Ferulic Acid, Hydroferulic Acid, Homovanillic Acid, and Vanillic Acid: Synthesis, Free Radicals Scavenging Activity, and Molecular Modeling as Potential Cholinesterases Inhibitors. Molbank 2020, 2020, M1151. [Google Scholar] [CrossRef]
  46. Caporali, S.; De Stefano, A.; Calabrese, C.; Giovannelli, A.; Pieri, M.; Savini, I.; Tesauro, M.; Bernardini, S.; Minieri, M.; Terrinoni, A. Anti-Inflammatory and Active Biological Properties of the Plant-Derived Bioactive Compounds Luteolin and Luteolin 7-Glucoside. Nutrients 2022, 14, 1155. [Google Scholar] [CrossRef]
  47. Razola-Díaz, M.d.C.; De Montijo-Prieto, S.; Aznar-Ramos, M.J.; Jiménez-Valera, M.; Ruiz-Bravo, A.; Verardo, V.; Gómez-Caravaca, A.M. Effect of Lactic Acid Bacteria Fermentation on the Polar Compounds Content with Antioxidant and Antidiabetic Activity of Avocado Seed Extracts. Fermentation 2023, 9, 420. [Google Scholar] [CrossRef]
  48. Trujillo-Mayol, I.; Casas-Forero, N.; Pastene-Navarrete, E.; Lima Silva, F.; Alarcón-Enos, J. Fractionation and Hydrolyzation of Avocado Peel Extract: Improvement of Antibacterial Activity. Antibiotics 2021, 10, 23. [Google Scholar] [CrossRef] [PubMed]
Figure 1. Anatomical parts of avocado fruit: pulp, peel, and seed.
Antioxidants 14 01293 g001
Figure 2. UV–Vis absorbance spectra of avocado peel and seed oil extracts in diethyl ether. Seed oil shows three carotenoid maxima typical of lutein-type xanthophylls, while peel oil exhibits overlapping carotenoid and chlorophyll a peaks.
Antioxidants 14 01293 g002
Figure 3. Response surface and contour plots for total polyphenolic content (TPC) of avocado peel and seed extracts. Panels illustrate the combined effects of (A) Power (X2) × Ethanol concentration (X4), (B) Ratio (X3) × Ethanol concentration (X4), and (C) Power (X2) × Ratio (X3). Sample type (X1: peel or seed) is shown separately in each panel. All other factors (X5) were fixed at their central levels. Warmer colors indicate higher predicted values.
Antioxidants 14 01293 g003
Figure 4. Response surface and contour plots for ferric reducing antioxidant power (FRAP) of avocado peel and seed extracts. Panels illustrate the combined effects of (A) Ratio (X3) × Ethanol concentration (X4), (B) Ratio (X3) × Time (X5), and (C) Power (X2) × Time (X5). Sample type (X1: peel or seed) is shown separately in each panel. All other factors were fixed at their central levels. Warmer colors indicate higher predicted values.
Antioxidants 14 01293 g004
Figure 5. Response surface and contour plots for DPPH radical scavenging activity of avocado peel and seed extracts. Panels illustrate the combined effects of (A) Ratio (X3) × Ethanol concentration (X4), (B) Power (X2) × Ethanol concentration (X4), and (C) Ethanol concentration (X4) × Time (X5). Sample type (X1: peel or seed) is shown separately in each panel. All other factors were fixed at their central levels. Warmer colors indicate higher predicted values.
Antioxidants 14 01293 g005
Figure 6. Response surface and contour plots for ascorbic acid content (AAC) of avocado peel and seed extracts. Panels illustrate the combined effects of (A) Power (X2) × Ethanol concentration (X4), and (B) Power (X2) × Time (X5). Sample type (X1: peel or seed) is shown separately in each panel. All other factors were fixed at their central levels. Warmer colors indicate higher predicted values.
Antioxidants 14 01293 g006
Figure 7. Normalized Pareto plots showing the relative impact of extraction parameters on (A) TPC, (B) FRAP, (C) DPPH, and (D) AAC of avocado peel and seed extracts. Blue bars denote positive effects; red bars denote negative effects. The dashed line represents the t-ratio threshold for statistical significance (p < 0.05), with significant factors marked by asterisks.
Antioxidants 14 01293 g007
Figure 8. Principal Component Analysis (PCA) biplot of avocado peel and seed extracts based on TPC, FRAP, DPPH, and AAC responses. PC1 is mainly associated with TPC, FRAP, and AAC, while PC2 is driven by DPPH. Peel extracts cluster toward higher TPC, FRAP, and AAC, whereas seed extracts align with DPPH. Design points are color-coded to distinguish peel and seed samples.
Antioxidants 14 01293 g008
Figure 9. Partial Least Squares (PLS) regression results for avocado peel and seed extracts. (A) Prediction Profiler illustrating the effect of extraction parameters on TPC, FRAP, DPPH, and AAC. (B) Variable Importance in Projection (VIP) scores identifying the most influential extraction parameters. A red dashed line marks the 0.8 significance threshold, indicating the relative importance of each variable in the model.
Antioxidants 14 01293 g009
Figure 10. Representative HPLC chromatogram of the optimized avocado peel extract. Peaks correspond to identified polyphenolic compounds listed in Table 10. Retention times and peak identities were confirmed using authentic standards.
Antioxidants 14 01293 g010
Table 1. Coded levels of the independent variables used in the RSM design for UAE.
Independent VariablesCoded UnitsTypeCoded Levels
−101
WasteX1CategoricalPeel-Seed
Ultrasonic power (E, %)X2Continuous4070100
Liquid-to-solid ratio (R, mL/g)X3Continuous104070
Ethanol concentration (C, % v/v)X4Continuous050100
Extraction time (t, min)X5Continuous51525
Table 2. Fatty acid composition of avocado peel and seed oils (%total fatty acids, mean ± SD, n = 3). Significant differences (p < 0.05) are marked with (*).
Fatty AcidPeel (%)Seed (%)
C10:0 (Decanoic)n.d.0.11 ± 0.00 *
C12:0 (Lauric)3.17 ± 0.19 *0.17 ± 0.01
C14:0 (Myristic)0.34 ± 0.01 *0.07 ± 0.00
C16:0 (Palmitic)19.38 ± 0.7920.73 ± 0.48
C18:0 (Stearic)0.96 ± 0.044.70 ± 0.15 *
C20:0 (Arachidic)n.d.0.05 ± 0.00 *
C22:0 (Behenic)0.23 ± 0.01 *0.03 ± 0.00
C24:0 (Lignoceric)0.20 ± 0.010.94 ± 0.04 *
∑ SFA24.28 ± 1.0626.80 ± 0.69 *
C16:1 (Palmitoleic)1.68 ± 0.05 *n.d.
C18:1 (Oleic)42.05 ± 3.1148.09 ± 2.31
C22:1 (Erucic)0.05 ± 0.00 *n.d.
∑ MUFA43.78 ± 3.1648.09 ± 2.31
C18:2 (Linoleic, ω-6)21.88 ± 1.5324.04 ± 0.87
C18:3 (α-Linolenic, ω-3)9.72 ± 0.70 *0.61 ± 0.02
∑ PUFA31.60 ± 2.23 *24.65 ± 0.88
∑ UFA75.38 ± 5.4072.74 ± 3.19
PUFA:SFA1.30 ± 0.04 *0.92 ± 0.01
MUFA:PUFA1.39 ± 0.001.95 ± 0.02 *
ω-6/ω-32.25 ± 0.00 *39.43 ± 1.54 *
n.d. for not detected.
Table 3. Oxidative stability and antioxidant activity of avocado peel and seed oils (mean ± SD, n = 3). Significant differences (p < 0.05) are marked with (*).
ParameterPeelSeed
DPPH (mmol TEAC/kg oil)15.49 ± 0.9114.97 ± 0.66
PV (mmol H2O2/kg oil)16.95 ± 0.76 *13.50 ± 0.27
CD (mmol/kg oil)33.56 ± 2.52 *11.51 ± 0.51
CT (mmol/kg oil)10.52 ± 0.36 *1.67 ± 0.13
Table 4. Spectral characteristics and estimated concentrations of pigments in avocado peel and seed oils. Carotenoid identity was inferred from absorption maxima and fine-structure ratios (%III/II), with lutein assigned to seed oil and α-carotene to peel oil. Chlorophyll a was quantified in peel oil using Wellburn and Lichtenthaler’s equations [28]. Values represent mean ± standard deviation (n = 3), expressed in mg pigment per kg oil.
SampleAssigned Pigmentλmax (nm)%III/IIConcentration (mg/kg Oil)
Seed oilLutein420, 442, 47083.80%29.2 ± 2.16
Peel oilα-Carotene432, 470n.d.253.1 ± 15.95
Peel oilChlorophyll a661209.4 ± 9.76
n.d. for not detected.
Table 5. Experimental design matrix (coded and actual values) and responses (TPC, FRAP, DPPH, AAC) for ultrasound-assisted extraction of avocado peel and seed residues.
Design PointIndependent VariablesActual Responses *
Waste (X1)Power (X2, %)Ratio
(X3, mL/g)
Ethanol (X4, % v/v)Time
(X5, min)
TPCFRAPDPPHAAC
1Seed7040501553.84275.03235.16.18
2Seed40700517.18407.1654.215.82
3Peel4010100153.7277.69160.591.9
4Seed100101002532.01369.81291.932.72
5Peel404001543.83546.7389.0912.73
6Peel407050571.87568.6558614.81
7Seed7040501553.79272.46243.166.43
8Peel70701001510.2130.45488.9211.36
9Peel100401002518.17203.12401.188.08
10Seed10070100541.05408.651103.768.09
11Peel707002551.26449.8480.7417.19
12Peel40100558.868.32327.665.59
13Peel4040502588.4529.99422.6910.68
14Seed100100526.2295.0296.692.45
15Seed7040501551.18257.28230.276.02
16Seed401002525.78149.16105.782.94
17Peel100705015103.14566.51420.8713.78
18Seed1007002528.89174.59136.524.67
19Peel10010100511.5393.6953.582.02
20Peel1001002567.32371.43278.815.33
21Seed40701002551.04265.98240.957.95
22Seed7040501552.65263.33282.136.16
23Peel100700578.97514.63423.4515.59
24Seed4010100536.5767.29102.852.48
25Peel7010502590.86602.39207.894.87
26Peel7040100517.4161.614045.54
* Values represent the mean of triplicate determinations; TPC, total polyphenol content in mg GAE/g dw; FRAP, ferric reducing antioxidant power in µmol AAE/g dw; DPPH antiradical activity in µmol AAE/g dw; AAC, ascorbic acid content in mg/g dw.
Table 6. ANOVA summary (p-values) for the fitted quadratic models of TPC, FRAP, DPPH, and AAC.
Term/SourceTPCFRAPDPPHAAC
Model (overall)<0.0001 ***<0.0001 ***<0.0001 ***<0.0001 ***
X1 − Waste0.0008 **0.0085 **0.0042 **<0.0001 ***
X2 − Power0.0973 (ns)0.828 (ns)0.0077 **0.154 (ns)
X3 − Ratio0.1962 (ns)0.0011 **<0.0001 ***<0.0001 ***
X4 − Ethanol concentration0.0041 **0.0268 *0.0003 ***0.0001 ***
X5 − Time0.4163 (ns)0.067 (trend)0.047 *0.176 (ns)
X1 × X20.0733 (trend)0.0002 ***
X1 × X30.222 (ns)<0.0001 ***
X1 × X4<0.0001 ***0.0007 ***0.0002 ***<0.0001 ***
X1 × X50.053 (trend)0.025 *0.083 (trend)
X2 × X30.053 (trend)0.067 (trend)0.012 *
X2 × X40.0838 (trend)0.233 (ns)0.018 *0.046 *
X2 × X50.062 (trend)0.011 *
X3 × X40.0693 (trend)0.0227 *0.0002 ***
X3 × X50.0018 **0.0045 **
X4 × X50.027 *
X220.0315 *0.0333 *
X320.280 (ns)0.106 (trend)
X42<0.0001 ***0.0008 ***0.039 *
X520.0087 **0.048 *
Lack of fit0.0043 *0.0015 *0.048 *0.0177 *
R2/Adj. R20.961/0.9190.934/0.8500.972/0.9240.989/0.979
Significance codes: *** p < 0.001; ** p < 0.01; * p < 0.05; (trend) 0.05 < p < 0.1; ns = not significant.
Table 7. Optimum extraction conditions and maximum predicted responses for avocado peel and seed extracts.
ResponseWaste (X1)Power (X2, %)Ratio
(X3, mL/g)
Ethanol
(X4, % v/v)
Time
(X5, min)
DesirabilityMaximum Predicted Response
TPCPeel100703950.9465105.98 ± 12.94
FRAPPeel407020240.9458673.89 ± 141
DPPHSeed1007010050.87761071.31 ± 131.16
AACPeel40700250.991917.9 ± 1.18
TPC, total polyphenol content in mg GAE/g dw; FRAP, ferric reducing antioxidant power in µmol AAE/g dw; DPPH antiradical activity in µmol AAE/g dw; AAC, ascorbic acid content in mg/g dw.
Table 8. Correlation matrix among antioxidant assays of avocado peel and seed extracts.
ResponsesTPCFRAPDPPHAAC
TPC0.7380.3080.530
FRAP 0.4250.688
DPPH  0.587
AAC   
Table 9. Optimized extraction conditions, predicted responses from the PLS regression model, overall desirability, and experimental validation values for avocado peel extracts.
ResponseWaste (X1)Power (X2, %)Ratio
(X3, mL/g)
Ethanol
(X4, % v/v)
Time
(X5, min)
PLS
Regression
DesirabilityExperimental Values
TPCPeel10070455105.360.735987.79 ± 5
FRAP578.38741.4 ± 43.93
DPPH565.01616.07 ± 13.94
AAC14.6410.8 ± 0.66
TPC, total polyphenol content in mg GAE/g dw; FRAP, ferric reducing antioxidant power in µmol AAE/g dw; DPPH antiradical activity in µmol AAE/g dw; AAC, ascorbic acid content in mg/g dw.
Table 10. Polyphenolic composition of avocado peel extract under optimized conditions, as determined by HPLC (mean ± SD, n = 3).
NoPolyphenolic Compoundmg/L Extractmg/g Dry Weight
13-Hydroxytyrosol8.46 ± 0.610.34 ± 0.02
2Catechin15.54 ± 0.50.62 ± 0.02
3Chlorogenic acid41.48 ± 1.621.65 ± 0.06
4Vanillic acid30.05 ± 1.111.2 ± 0.04
5Homovanillic acid8.88 ± 0.640.35 ± 0.03
6Epicatechin6.18 ± 0.160.25 ± 0.01
7Catechin derivative 155.34 ± 3.272.21 ± 0.13
8Catechin derivative 229.38 ± 1.621.17 ± 0.06
9Catechin derivative 340.18 ± 11.6 ± 0.04
10Catechin derivative 412.42 ± 0.320.5 ± 0.01
11Catechin derivative 57.76 ± 0.510.31 ± 0.02
12Luteolin-7-glucoside7.34 ± 0.350.29 ± 0.01
 Total identified263.03 ± 11.7110.48 ± 0.47
Disclaimer/Publisher’s Note: The statements, opinions and data contained in all publications are solely those of the individual author(s) and contributor(s) and not of MDPI and/or the editor(s). MDPI and/or the editor(s) disclaim responsibility for any injury to people or property resulting from any ideas, methods, instructions or products referred to in the content.

