
Berberis microphylla G. Forst Intake Reduces the Cardiovascular Disease Plasmatic Markers Associated with a High-Fat Diet in a Mice Model
 , , , ,
  and
and 
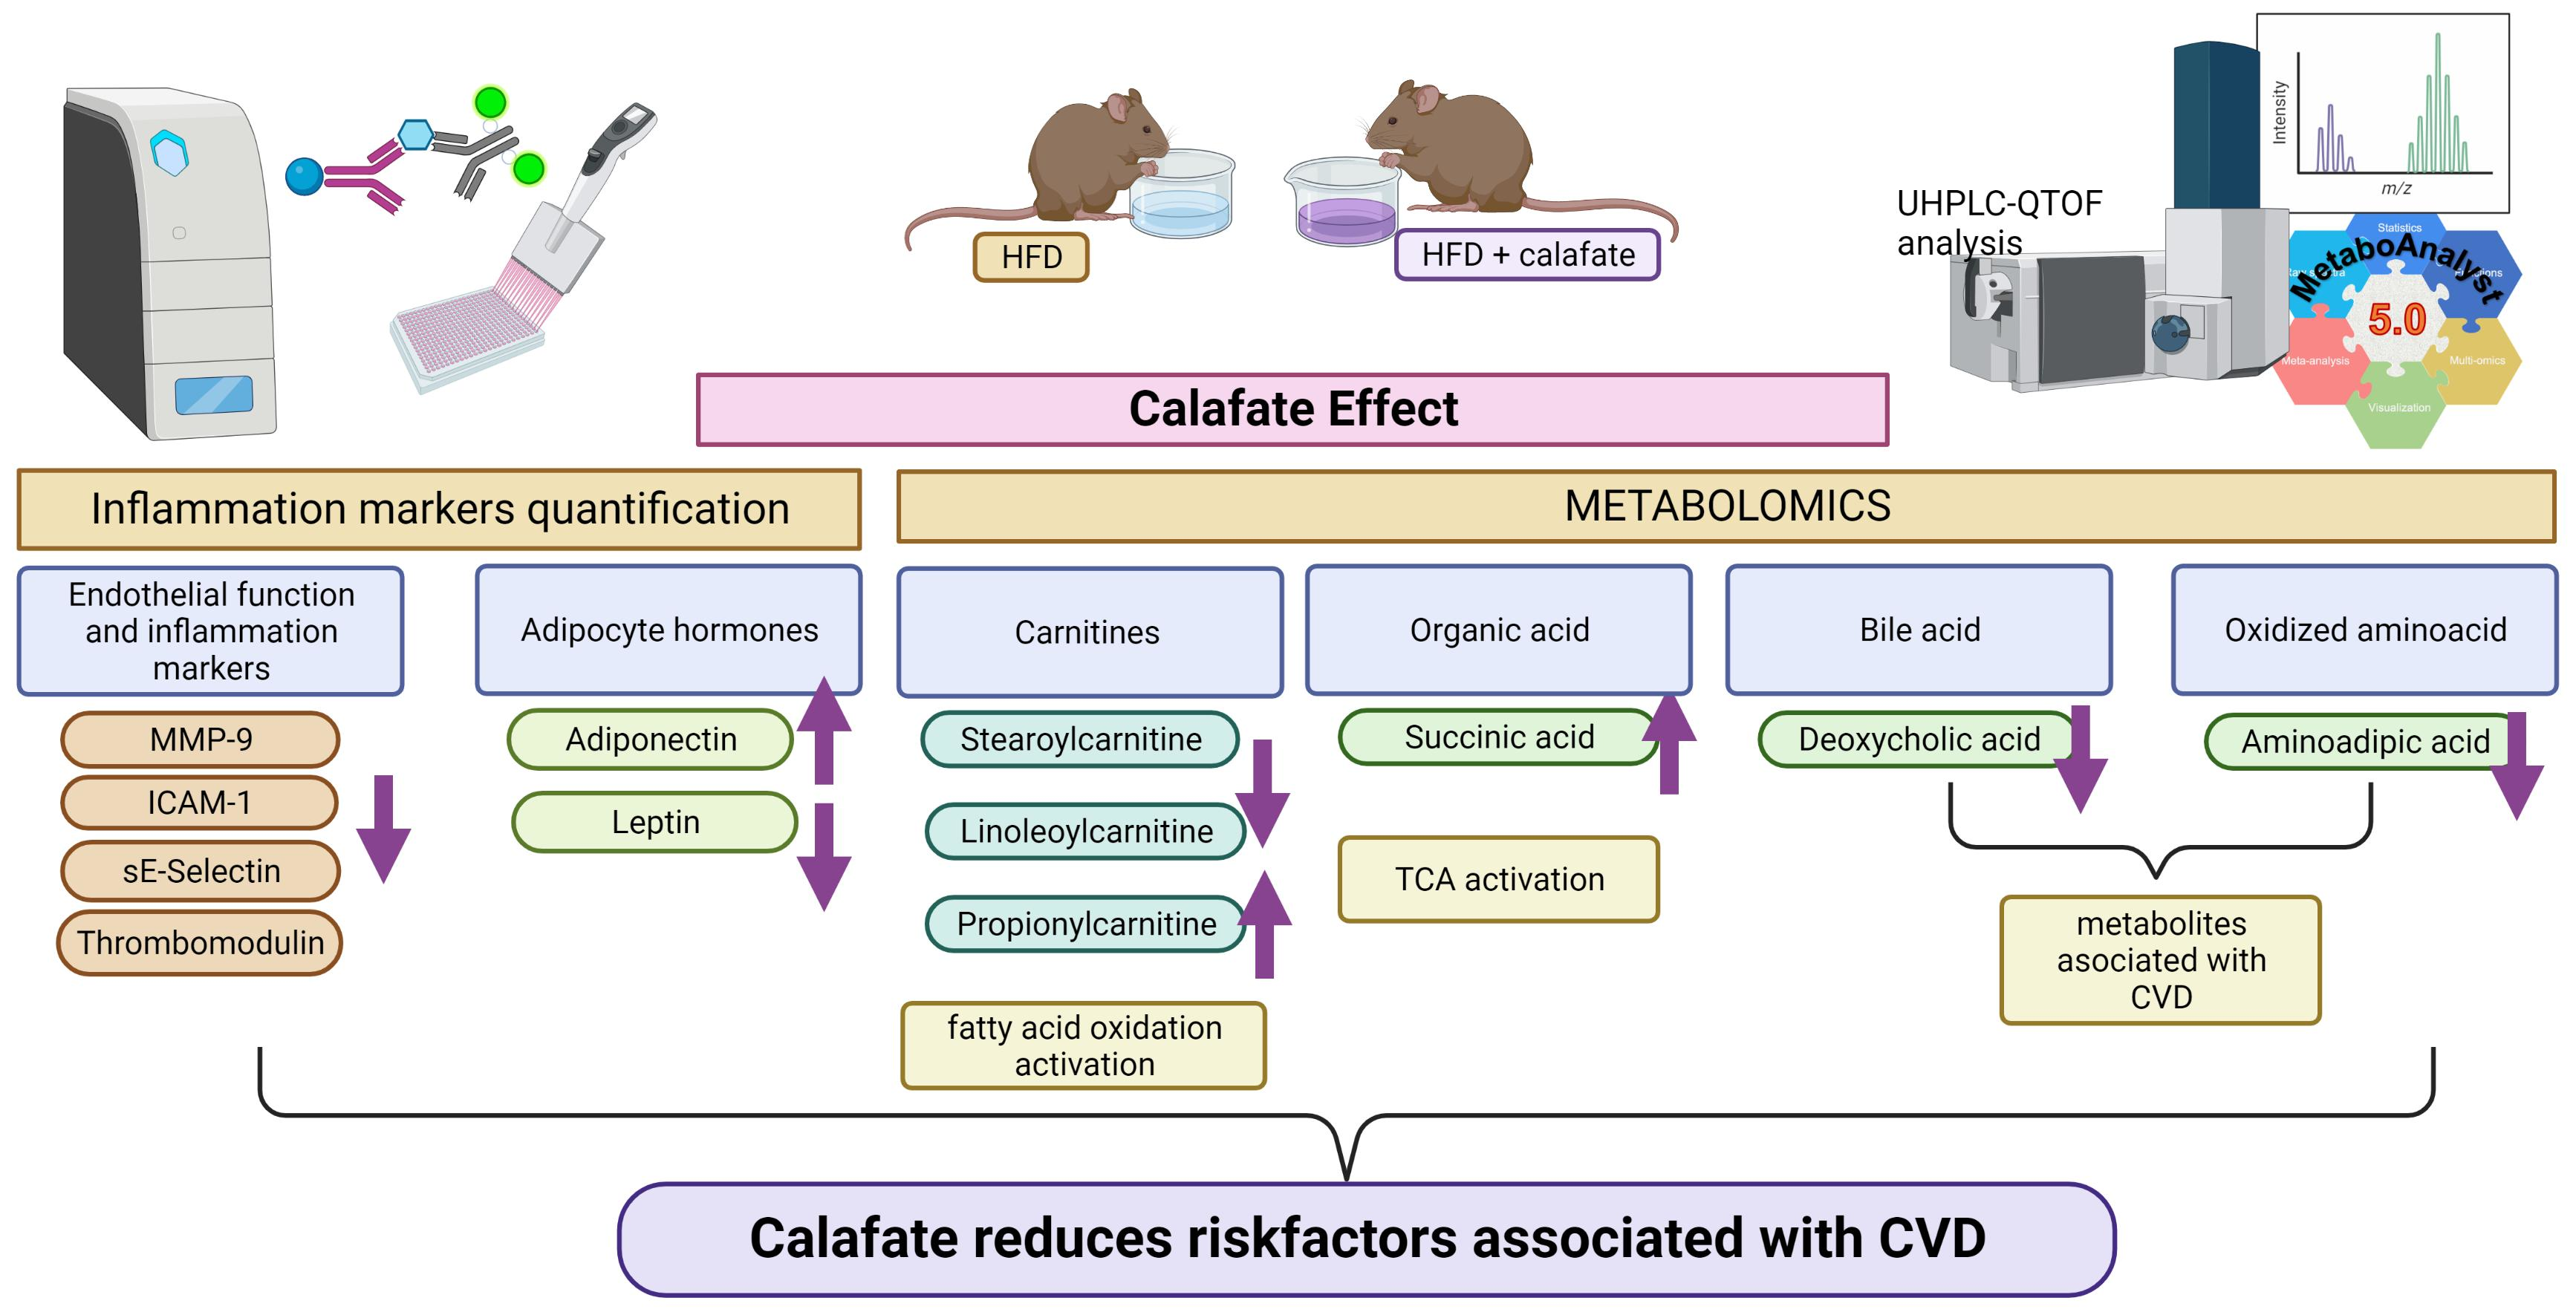
Abstract

1. Introduction
2. Materials and Methods
2.1. Reagents and Vegetable Material
2.2. Instrumentation
2.2.1. Calafate Extract
2.2.2. In Vivo Assay
2.2.3. Biochemical Analyses and Protein Quantification
2.2.4. Metabolite Extraction from Plasma Samples
2.2.5. UHPLC-DAD-ESI-QTOF-MS/MS Metabolomics Analysis
2.2.6. Data Processing and Data Analysis
3. Results and Discussion
3.1. Calafate Berry Extract Composition
3.2. Animal Characteristics
3.3. Biochemical Analysis
3.3.1. Clinical Biochemistry
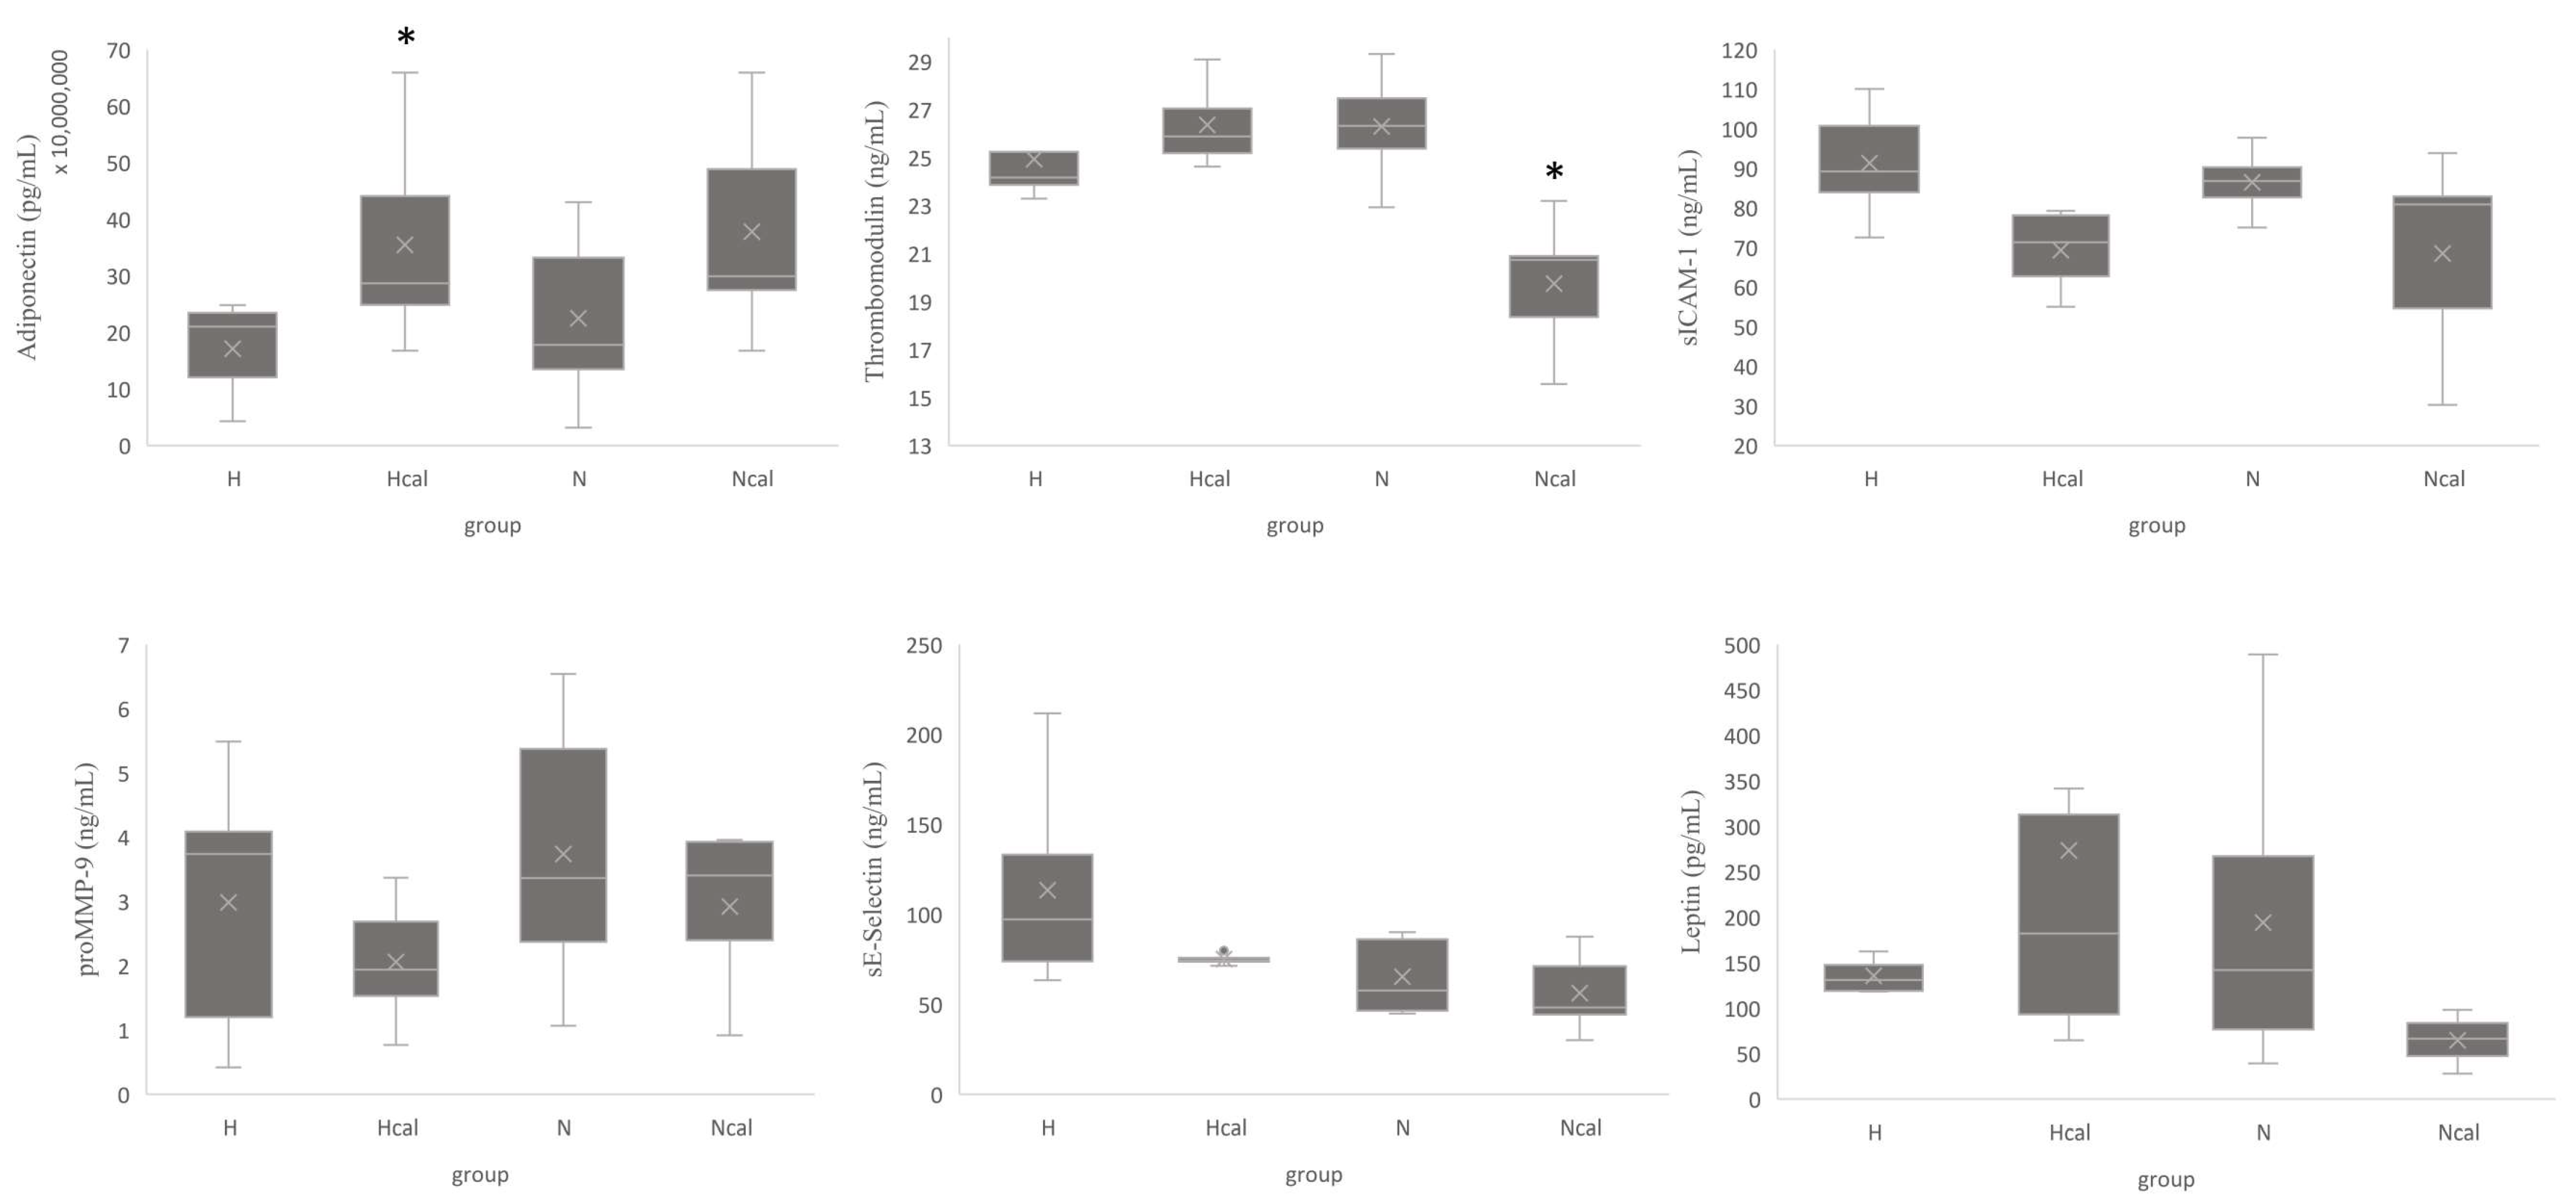
3.3.2. Inflammation and Cardiovascular Risk Markers
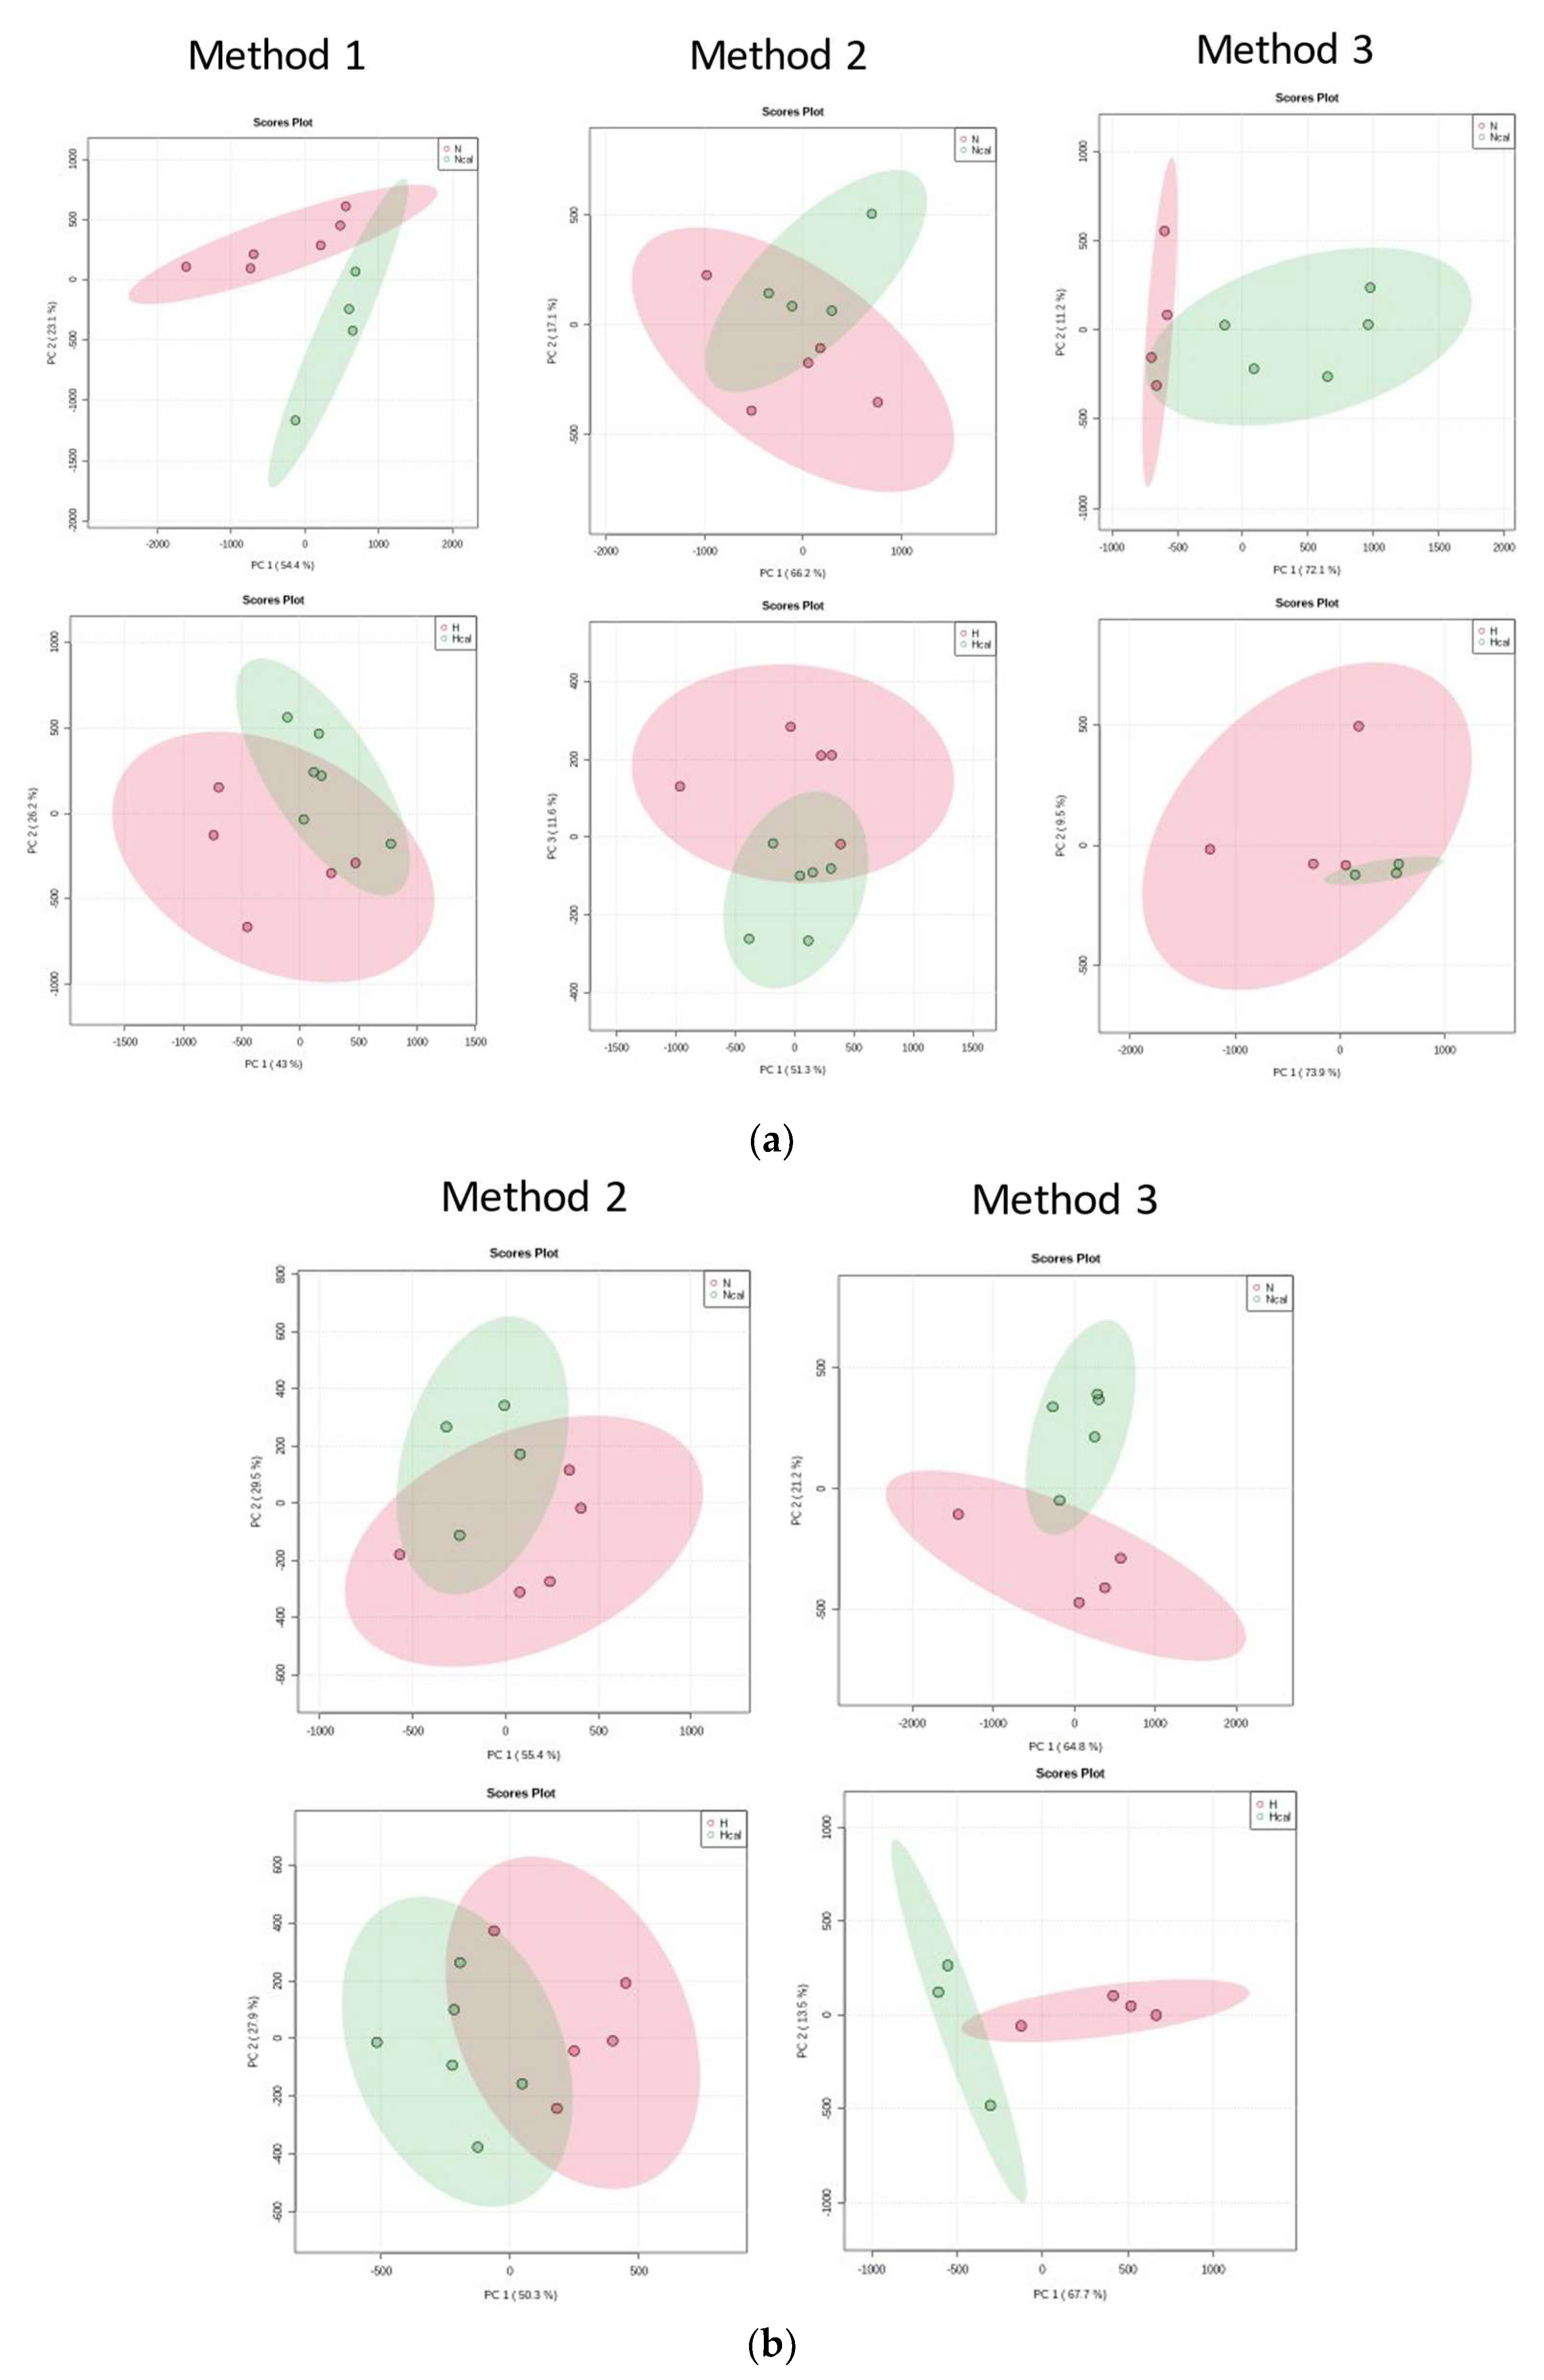
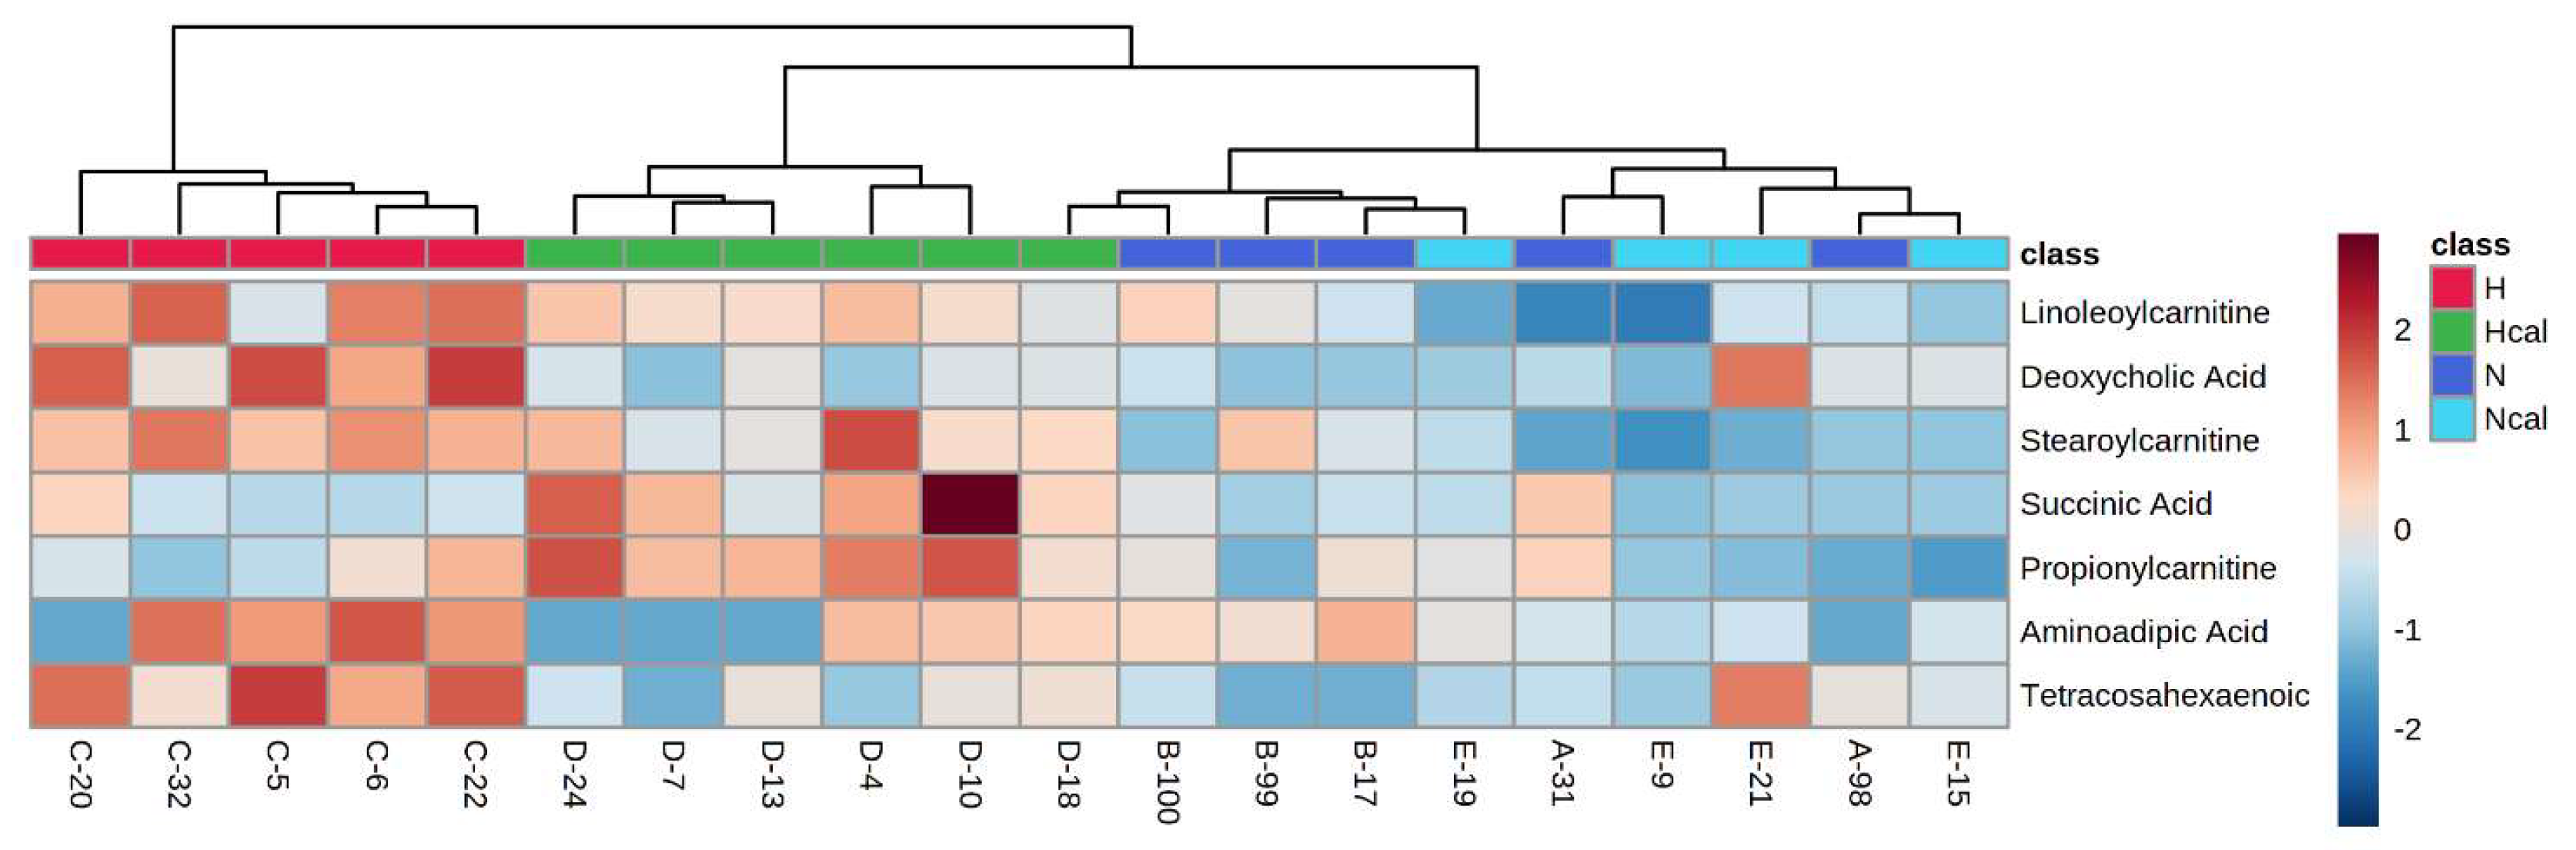
3.4. Metabolomics
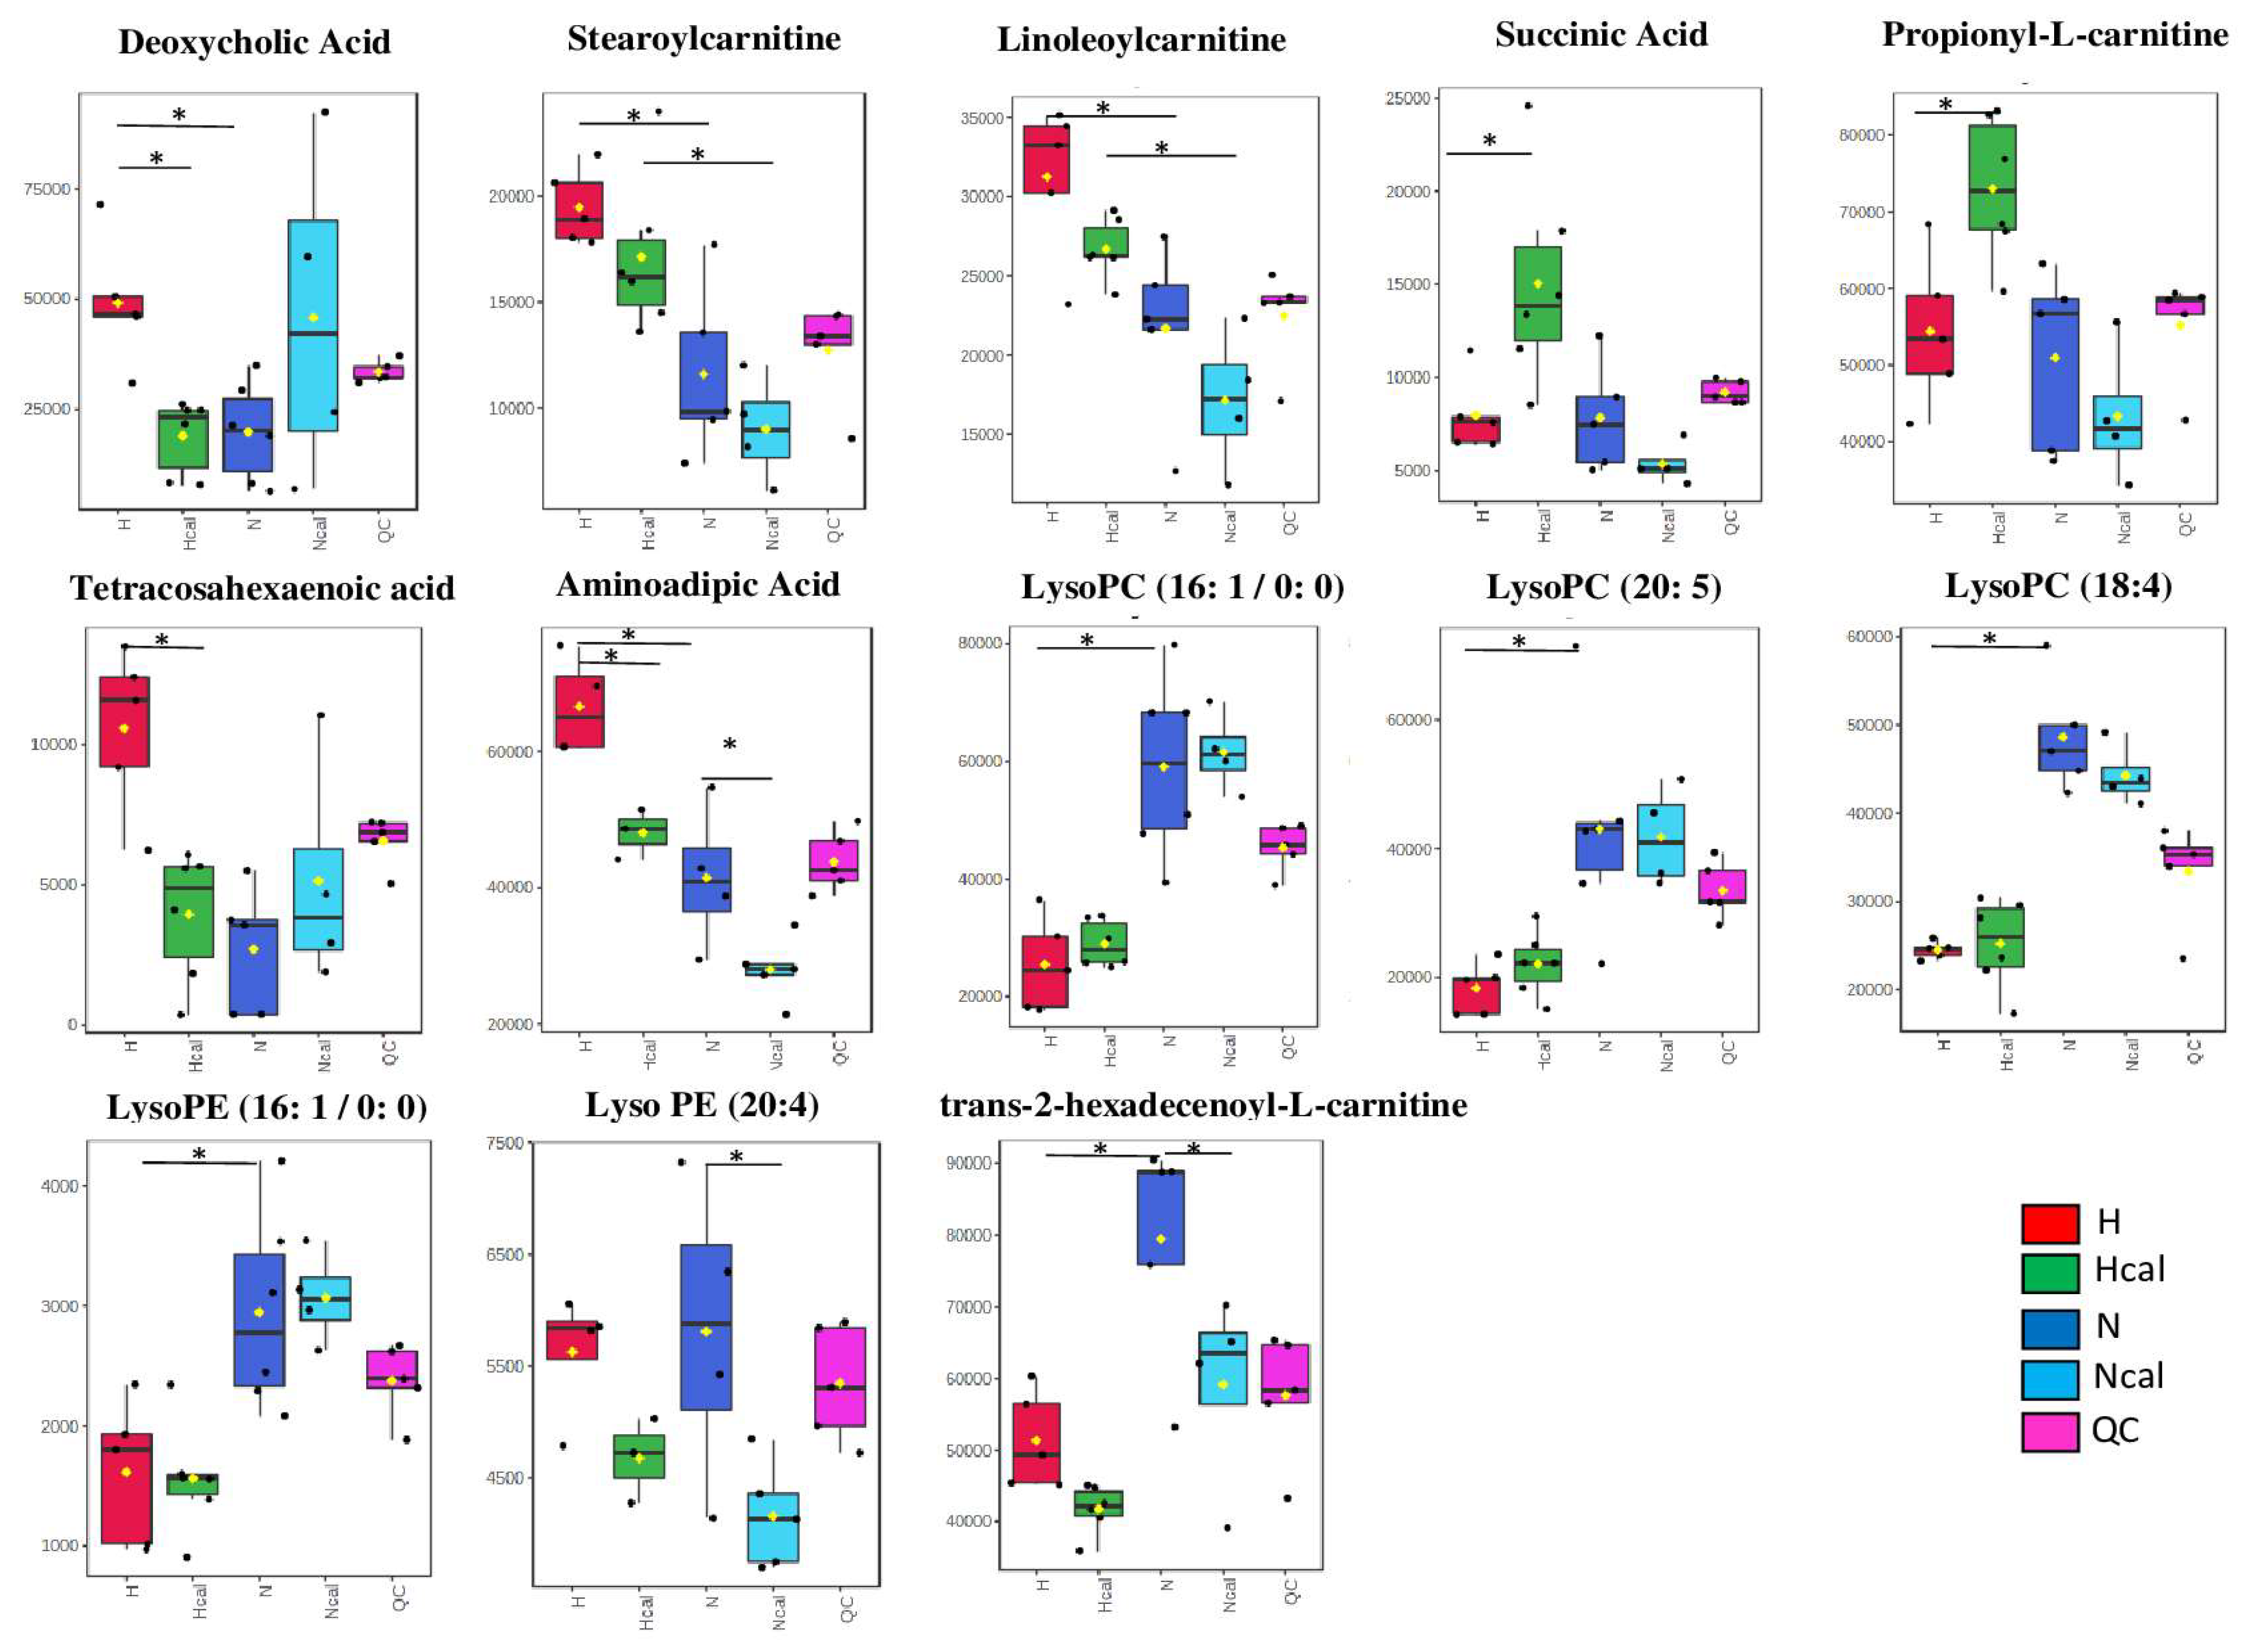
Metabolite Annotation and Observational Changes
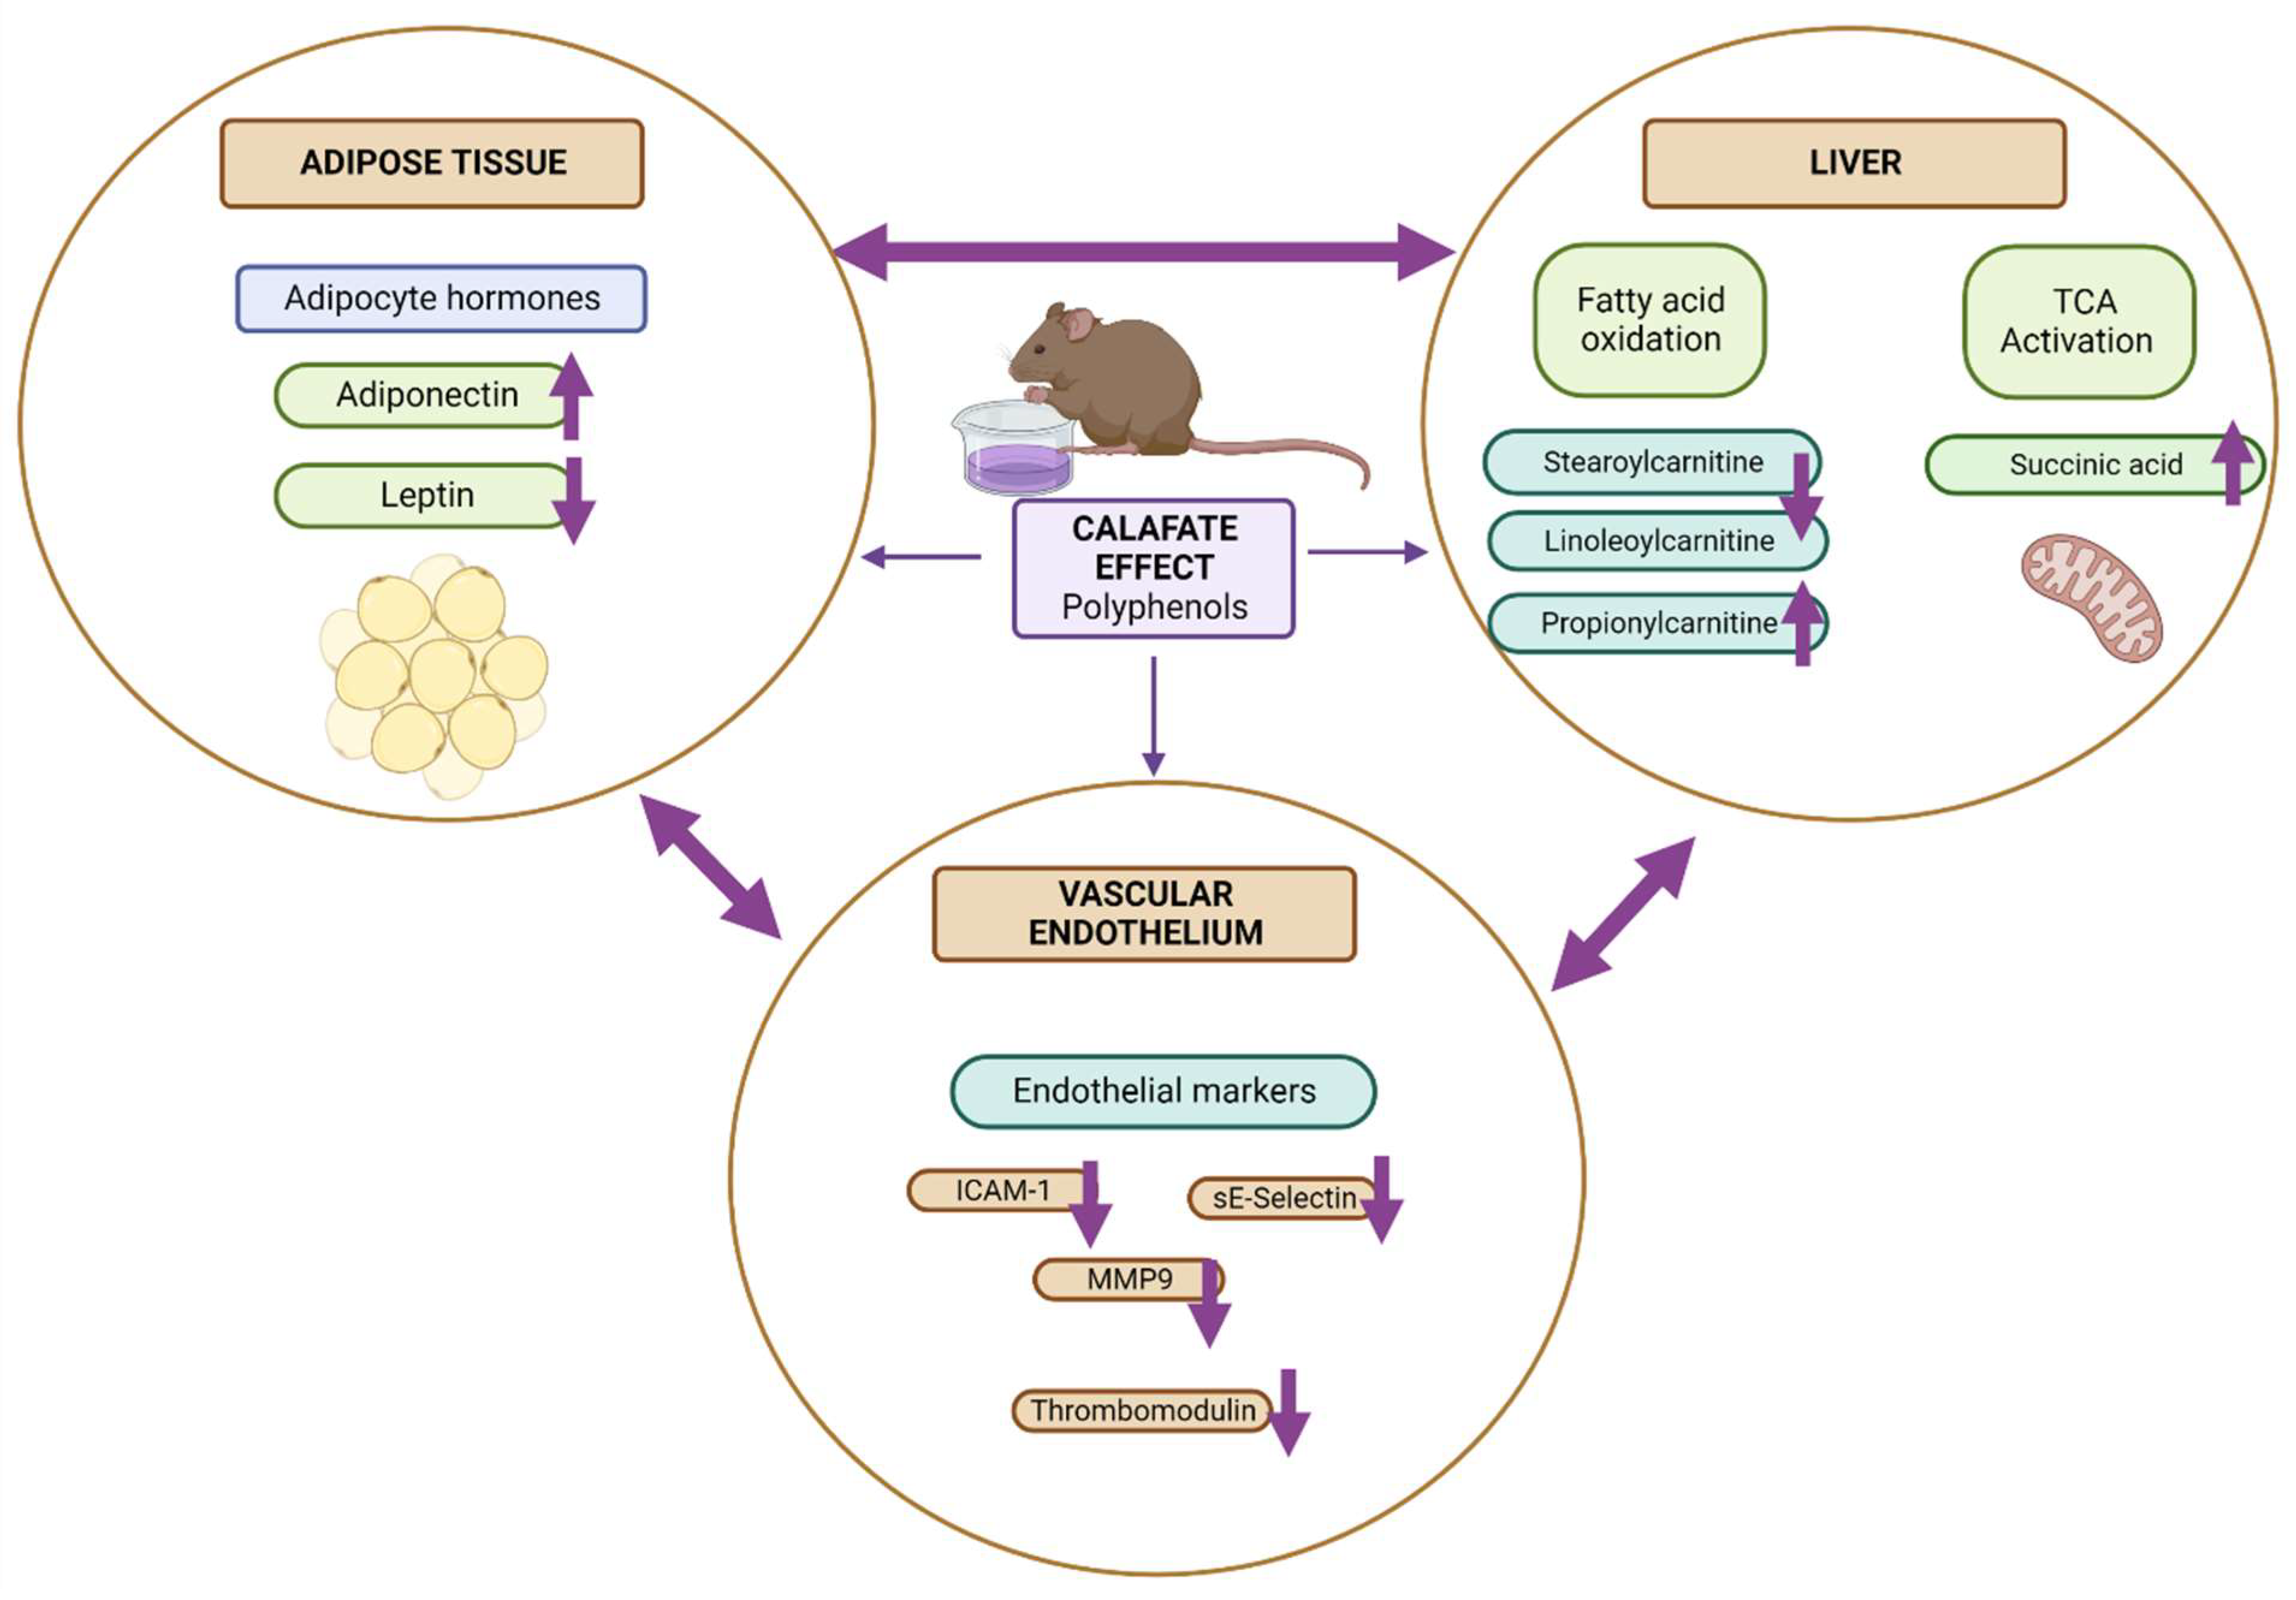
3.5. Biological Interpretation
4. Conclusions
Supplementary Materials
Author Contributions
Funding
Institutional Review Board Statement
Informed Consent Statement
Data Availability Statement
Acknowledgments
Conflicts of Interest
References
- Curtasu, M.V.; Knudsen, K.E.B.; Callesen, H.; Purup, S.; Stagsted, J.; Hedemann, M.S. Obesity development in a miniature Yucatan pig model: A multi-compartmental metabolomics study on cloned and normal pigs fed restricted or ad libitum high-energy diets. J. Proteome Res. 2019, 18, 30–47. [Google Scholar] [CrossRef] [PubMed]
- Kesherwani, V.; Chavali, V.; Hackfort, B.T.; Tyagi, S.C.; Mishra, P.K. Exercise ameliorates high fat diet induced cardiac dysfunction by increasing interleukin 10. Front. Physiol. 2015, 6, 1–7. [Google Scholar] [CrossRef] [PubMed]
- Biobaku, F.; Ghanim, H.; Batra, M.; Dandona, P. Macronutrient-mediated inflammation and oxidative stress: Relevance to insulin resistance, obesity, and atherogenesis. J. Clin. Endocrinol. Metab. 2019, 104, 6118–6128. [Google Scholar] [CrossRef] [PubMed]
- Shai, I.; Pischon, T.; Hu, F.B.; Ascherio, A.; Rifai, N.; Rimm, E.B. Soluble intercellular adhesion molecules, soluble vascular cell adhesion molecules, and risk of coronary heart disease. Obesity 2006, 14, 2099–2106. [Google Scholar] [CrossRef] [PubMed]
- Ruel, G.; Pomerleau, S.; Couture, P.; Lemieux, S.; Lamarche, B.; Couillard, C. Low-calorie cranberry juice supplementation reduces plasma oxidized LDL and cell adhesion molecule concentrations in men. Br. J. Nutr. 2008, 99, 352–359. [Google Scholar] [CrossRef]
- Couillard, C.; Ruel, G.; Archer, W.R.; Pomerleau, S.; Bergeron, J.; Couture, P.; Lamarche, B.; Bergeron, N. Circulating levels of oxidative stress markers and endothelial adhesion molecules in men with abdominal obesity. J. Clin. Endocrinol. Metab. 2005, 90, 6454–6459. [Google Scholar] [CrossRef]
- Zunino, S.J.; Parelman, M.A.; Freytag, T.L.; Stephensen, C.B.; Kelley, D.S.; MacKey, B.E.; Woodhouse, L.R.; Bonnel, E.L. Effects of dietary strawberry powder on blood lipids and inflammatory markers in obese human subjects. Br. J. Nutr. 2012, 108, 900–909. [Google Scholar] [CrossRef]
- Bartekova, M.; Radosinska, J.; Jelemensky, M.; Dhalla, N.S. Role of cytokines and inflammation in heart function during health and disease. Heart Fail. Rev. 2018, 23, 733–758. [Google Scholar] [CrossRef] [PubMed]
- Lobo, V.; Patil, A.; Phatak, A.; Chandra, N. Free radicals, antioxidants and functional foods: Impact on human health. Pharmacogn. Rev. 2010, 4, 118–126. [Google Scholar] [CrossRef] [PubMed]
- Ruiz, A.; Hermosín-Gutiérrez, I.; Vergara, C.; von Baer, D.; Zapata, M.; Hitschfeld, A.; Obando, L.; Mardones, C. Anthocyanin profiles in south Patagonian wild berries by HPLC-DAD-ESI-MS/MS. Food Res. Int. 2013, 51, 706–713. [Google Scholar] [CrossRef]
- Ruiz, A.; Mardones, C.; Vergara, C.; Hermosín-Gutiérrez, I.; von Baer, D.; Hinrichsen, P.; Rodriguez, R.; Arribillaga, D.; Dominguez, E. Analysis of hydroxycinnamic acids derivatives in calafate (Berberis microphylla G. Forst) berries by liquid chromatography with photodiode array and mass spectrometry detection. J. Chromatogr. A 2013, 1281, 38–45. [Google Scholar] [CrossRef] [PubMed]
- Schmeda-Hirschmann, G.; Jiménez-Aspee, F.; Theoduloz, C.; Ladio, A. Patagonian berries as native food and medicine. J. Ethnopharmacol. 2019, 241, 111979. [Google Scholar] [CrossRef] [PubMed]
- Reyes-Farias, M.; Vasquez, K.; Fuentes, F.; Ovalle-Marin, A.; Parra-Ruiz, C.; Zamora, O.; Pino, M.T.; Quitral, V.; Jimenez, P.; Garcia, L.; et al. Extracts of Chilean native fruits inhibit oxidative stress, inflammation and insulin-resistance linked to the pathogenic interaction between adipocytes and macrophages. J. Funct. Foods 2016, 27, 69–83. [Google Scholar] [CrossRef]
- Olivares-Caro, L.; Radojkovic, C.; Chau, S.Y.; Nova, D.; Bustamante, L.; Neira, J.Y.; Perez, A.J.; Mardones, C. Berberis microphylla G. Forst (calafate) berry extract reduces oxidative stress and lipid peroxidation of human LDL. Antioxidants 2020, 9, 1171. [Google Scholar] [CrossRef] [PubMed]
- Marshall, D.D.; Powers, R. Beyond the paradigm: Combining mass spectrometry and nuclear magnetic resonance for metabolomics. Prog. Nucl. Magn. Reson. Spectrosc. 2017, 100, 1–16. [Google Scholar] [CrossRef]
- Dettmer, K.; Aronov, P.A.; Hammock, B.D. Mass Spectrometry-Based Metabolomics Katja. Mass Spectrom. Rev. 2007, 26, 51–78. [Google Scholar] [CrossRef]
- Bustamante, L.; Pastene, E.; Duran-Sandoval, D.; Vergara, C.; Von Baer, D.; Mardones, C. Pharmacokinetics of low molecular weight phenolic compounds in gerbil plasma after the consumption of calafate berry (Berberis microphylla) extract. Food Chem. 2018, 268, 347–354. [Google Scholar] [CrossRef]
- Morlock, G.E.; Vega-Herrera, M.A. Two new derivatization reagents for planar chromatographic quantification of sucralose in dietetic products. J. Planar Chromatogr. Mod. TLC 2007, 20, 411–417. [Google Scholar] [CrossRef]
- Morton, D.; Griffiths, P.H. Guidelines in the recognition of pain, distress anddisconform in experimental animal and an hypothesis for assessment. Vet. Rec. 1985, 116, 431–436. [Google Scholar] [CrossRef]
- Bujak, R.; García-Álvarez, A.; Rupérez, F.J.; Nuño-Ayala, M.; García, A.; Ruiz-Cabello, J.; Fuster, V.; Ibáñez, B.; Barbas, C. Metabolomics reveals metabolite changes in acute pulmonary embolism. J. Proteome Res. 2014, 13, 805–816. [Google Scholar] [CrossRef]
- Keller, B.O.; Sui, J.; Young, A.B.; Whittal, R.M. Interferences and contaminants encountered in modern mass spectrometry. Anal. Chim. Acta 2008, 627, 71–81. [Google Scholar] [CrossRef] [PubMed]
- Laursen, M.R.; Hansen, J.; Elkjær, C.; Stavnager, N.; Nielsen, C.B.; Pryds, K.; Johnsen, J.; Nielsen, J.M.; Bøtker, H.E.; Johannsen, M. Untargeted metabolomics reveals a mild impact of remote ischemic conditioning on the plasma metabolome and α-hydroxybutyrate as a possible cardioprotective factor and biomarker of tissue ischemia. Metabolomics 2017, 13, 67. [Google Scholar] [CrossRef] [PubMed]
- Patterson, R.E.; Ducrocq, A.J.; McDougall, D.J.; Garrett, T.J.; Yost, R.A. Comparison of blood plasma sample preparation methods for combined LC-MS lipidomics and metabolomics. J. Cromatogr. B Anal. Technol. Biomed. Life Sci. 2015, 1002, 260–266. [Google Scholar] [CrossRef]
- Armirotti, A.; Basit, A.; Realini, N.; Caltagirone, C.; Bossù, P.; Spalletta, G.; Piomelli, D. Sample preparation and orthogonal chromatography for broad polarity range plasma metabolomics: Application to human subjects with neurodegenerative dementia. Anal. Biochem. 2014, 455, 48–54. [Google Scholar] [CrossRef]
- Alseekh, S.; Aharoni, A.; Brotman, Y.; Contrepois, K.; D’Auria, J.; Ewald, J.; Ewald, J.C.; Fraser, P.D.; Giavalisco, P.; Hall, R.D.; et al. Mass spectrometry-based metabolomics: A guide for annotation, quantification and best reporting practices. Nat. Methods 2021, 18, 747–756. [Google Scholar] [CrossRef] [PubMed]
- Gao, X.; Guo, M.; Li, Q.; Peng, L.; Liu, H.; Zhang, L.; Bai, X.; Wang, Y.; Li, J.; Cai, C. Plasma metabolomic profiling to reveal antipyretic mechanism of Shuang-Huang-Lian injection on yeast-induced pyrexia rats. PLoS ONE 2014, 9, e100017. [Google Scholar] [CrossRef] [PubMed]
- Miao, H.; Zhao, Y.H.; Vaziri, N.D.; Tang, D.D.; Chen, H.; Chen, H.; Khazaeli, M.; Tarbiat-Boldaji, M.; Hatami, L.; Zhao, Y.Y. Lipidomics biomarkers of diet-induced hyperlipidemia and its treatment with Poria cocos. J. Agric. Food Chem. 2016, 64, 969–979. [Google Scholar] [CrossRef]
- Guzmán, C.; Sánchez, R. Effect of calafate (Berberis microphylla) supplementation on lipid profile in rats with diet-induced obesity. Funct. Foods Health Dis. 2021, 11, 512–521. [Google Scholar] [CrossRef]
- Kikuchi, T.; Lin, L.; Horigome, H. Soluble thrombomodulin and cardiovascular disease risk factors in Japanese children. Blood Coagul. Fibrinolysis 2021, 32, 273–277. [Google Scholar] [CrossRef]
- Seigneur, M.; Dufourcq, P.; Conri, C.; Constans, J.; Mercié, P.; Pruvost, A.; Amiral, J.; Midy, D.; Baste, J.C.; Boisseau, M.R. Levels of plasma thrombomodulin are increased in atheromatous arterial disease. Thromb. Res. 1993, 71, 423–431. [Google Scholar] [CrossRef]
- Shabalala, S.C.; Dludla, P.V.; Mabasa, L.; Kappo, A.P.; Basson, A.K.; Pheiffer, C.; Johnson, R. The effect of adiponectin in the pathogenesis of Non-Alcoholic Fatty Liver Disease (NAFLD) and the potential role of polyphenols in the modulation of adiponectin signaling. Biomed. Pharmacother. 2020, 131, 110785. [Google Scholar] [CrossRef] [PubMed]
- Okamoto, Y.; Folco, E.J.; Minami, M.; Wara, A.K.; Feinberg, M.W.; Sukhova, G.K.; Colvin, R.A.; Kihara, S.; Funahashi, T.; Luster, A.D.; et al. Adiponectin inhibits the production of CXC receptor 3 chemokine ligands in macrophages and reduces T-lymphocyte recruitment in atherogenesis. Circ. Res. 2008, 102, 218–225. [Google Scholar] [CrossRef] [PubMed]
- Masumi, A.; Otokozawa, S.; Asztalos, B.F.; White, C.C.; Banjaw, S.D.; Cupples, L.A.; Nakajima, K.; Wilson, P.W.; Schaefer, E.J. Adiponectin: An independent risk factor for coronary heart disease in the framingham offspring study. Atherosclerosis 2011, 217, 543–548. [Google Scholar] [CrossRef]
- Bui, T.M.; Wiesolek, H.L.; Sumagin, R. ICAM-1: A master regulator of cellular responses in inflammation, injury resolution, and tumorigenesis. J. Leukoc. Biol. 2020, 108, 787–799. [Google Scholar] [CrossRef]
- Pawelczyk, M.; Glabiński, A.; Kaczorowska, B.; Baj, Z. sP- and sE-selectin in stroke patients with metabolic disorders. Neurol. Neurochir. Pol. 2018, 52, 599–605. [Google Scholar] [CrossRef]
- Olejarz, W.; Łacheta, D.; Kubiak-Tomaszewska, G. Matrix metalloproteinases as biomarkers of atherosclerotic plaque instability. Int. J. Mol. Sci. 2020, 21, 3946. [Google Scholar] [CrossRef]
- Yabluchanskiy, A.; Ma, Y.; Iyer, R.P.; Hall, M.E.; Lindsey, M.L. Matrix metalloproteinase-9: Many shades of function in cardiovascular disease. Physiology 2013, 28, 391–403. [Google Scholar] [CrossRef]
- Kim, J.G.; Lee, B.J.; Jeong, J.K. Temporal leptin to determine cardiovascular and metabolic fate throughout the life. Nutrients 2020, 12, 3256. [Google Scholar] [CrossRef]
- Otero, M.; Lago, R.; Lago, F.; Casanueva, F.F.; Dieguez, C.; Gómez-Reino, J.J.; Gualillo, O. Leptin, from fat to inflammation: Old questions and new insights. FEBS Lett. 2005, 579, 295–301. [Google Scholar] [CrossRef]
- Agostinis-Sobrinho, C.A.; Lacerda Mendes, E.; Moreira, C.; Abreu, S.; Lopes, L.; Oliveira-Santos, J.; Skurvydas, A.; Mota, J.; Santos, R. Association between leptin, adiponectin, and leptin/adiponectin ratio with clustered metabolic risk factors in Portuguese adolescents: The LabMed physical activity study. Ann. Nutr. Metab. 2017, 70, 321–328. [Google Scholar] [CrossRef]
- Evans, A.M.; O’Donovan, C.; Playdon, M.; Beecher, C.; Beger, R.D.; Bowden, J.A.; Broadhurst, D.; Clish, C.B.; Dasari, S.; Dunn, W.B.; et al. Dissemination and analysis of the quality assurance (QA) and quality control (QC) practices of LC–MS based untargeted metabolomics practitioners. Metabolomics 2020, 16, 1–16. [Google Scholar] [CrossRef]
- Yoshimoto, S.; Loo, T.M.; Atarashi, K.; Kanda, H.; Sato, S.; Oyadomari, S.; Iwakura, Y.; Oshima, K.; Morita, H.; Hattori, M.; et al. Obesity-induced gut microbial metabolite promotes liver cancer through senescence secretome. Nature 2013, 499, 97–101. [Google Scholar] [CrossRef] [PubMed]
- Shimizu, H.; Hagio, M.; Iwaya, H.; Tsuneki, I.; Lee, J.Y.; Fukiya, S.; Yokota, A.; Miyazaki, H.; Hara, H.; Ishizuka, S. Deoxycholic acid is involved in the proliferation and migration of vascular smooth muscle cells. J. Nutr. Sci. Vitaminol. 2014, 60, 450–454. [Google Scholar] [CrossRef] [PubMed]
- Haeusler, R.A.; Astiarraga, B.; Camastra, S.; Accili, D.; Ferrannini, E. Human insulin resistance is associated with increased plasma levels of 12a-hydroxylated bile acids. Diabetes 2013, 62, 4184–4191. [Google Scholar] [CrossRef] [PubMed]
- Suhre, K.; Meisinger, C.; Döring, A.; Altmaier, E.; Belcredi, P.; Gieger, C.; Chang, D.; Milburn, M.V.; Gall, W.E.; Weinberger, K.M.; et al. Metabolic footprint of diabetes: A multiplatform metabolomics study in an epidemiological setting. PLoS ONE 2010, 5, e13953. [Google Scholar] [CrossRef] [PubMed]
- Wang, T.J.; Ngo, D.; Psychogios, N.; Dejam, A.; Larson, M.G.; Vasan, R.S.; Ghorbani, A.; O’Sullivan, J.; Cheng, S.; Rhee, E.P.; et al. 2-Aminoadipic acid is a biomarker for diabetes risk. J. Clin. Investig. 2013, 123, 4309–4317. [Google Scholar] [CrossRef]
- Estaras, M.; Ameur, F.Z.; Estévez, M.; Díaz-Velasco, S.; Gonzalez, A. The lysine derivative aminoadipic acid, a biomarker of protein oxidation and diabetes-risk, induces production of reactive oxygen species and impairs trypsin secretion in mouse pancreatic acinar cells. Food Chem. Toxicol. 2020, 145, 111594. [Google Scholar] [CrossRef]
- Lee, H.J.; Jang, H.B.; Kim, W.H.; Park, K.J.; Kim, K.Y.; Park, S.I.; Lee, H.J. 2-Aminoadipic acid (2-AAA) as a potential biomarker for insulin resistance in childhood obesity. Sci. Rep. 2019, 9, 13610. [Google Scholar] [CrossRef]
- He, J.; Sun, C.; Li, T.; Luo, Z.; Huang, L.; Song, X.; Li, X.; Abliz, Z. A Sensitive and Wide Coverage Ambient Mass Spectrometry Imaging Method for Functional Metabolites Based Molecular Histology. Adv. Sci. 2018, 5, 1800250. [Google Scholar] [CrossRef]
- Liu, J.; Zhang, G.; Chen, D.; Chen, J.; Yuan, Z.B.; Zhang, E.L.; Gao, Y.X.; Xu, G.; Sun, B.D.; Liao, W.; et al. UPLC-QTOFMS-based metabolomic analysis of the serum of hypoxic preconditioning mice. Mol. Med. Rep. 2017, 16, 6828–6836. [Google Scholar] [CrossRef]
- Mihalik, S.J.; Goodpaster, B.H.; Kelley, D.E.; Chace, D.H.; Vockley, J.; Toledo, F.G.S.; Delany, J.P. Increased levels of plasma acylcarnitines in obesity and type 2 diabetes and identification of a marker of glucolipotoxicity. Obesity 2010, 18, 1695–1700. [Google Scholar] [CrossRef] [PubMed]
- Aichler, M.; Borgmann, D.; Krumsiek, J.; Buck, A.; MacDonald, P.E.; Fox, J.E.M.; Lyon, J.; Light, P.E.; Keipert, S.; Jastroch, M.; et al. N-acyl Taurines and Acylcarnitines cause an imbalance in insulin synthesis and secretion provoking β cell dysfunction in type 2 diabetes. Cell Metab. 2017, 25, 1334–1347.e4. [Google Scholar] [CrossRef] [PubMed]
- Zhou, C.X.; Zhou, D.H.; Elsheikha, H.M.; Liu, G.X.; Suo, X.; Zhu, X.Q. Global metabolomic profiling of mice brains following experimental infection with the cyst-forming Toxoplasma gondii. PLoS ONE 2015, 10, e0139635. [Google Scholar] [CrossRef] [PubMed]
- Tarifeño-Saldivia, E.; Aguilar, A.; Contreras, D.; Mercado, L.; Morales-Lange, B.; Márquez, K.; Henríquez, A.; Riquelme-Vidal, C.; Boltana, S. Iron overload is associated with oxidative stress and nutritional immunity during viral infection in fish. Front. Immunol. 2018, 9, 1296. [Google Scholar] [CrossRef]
- Ferrari, R.; Merli, E.; Cicchitelli, G.; Mele, D.; Fucili, A.; Ceconi, C. Therapeutic effects of L-carnitine and propionyl-L-carnitine on cardiovascular diseases: A review. Ann. N. Y. Acad. Sci. 2004, 1033, 79–91. [Google Scholar] [CrossRef]
- Gómez-Amores, L.; Mate Barrero, A.; Revilla Torres, E.; Santa-María Pérez, C.; Vázquez Cueto, C.M. El tratamiento con propionil-L-carnitina mejora el estrés oxidativo asociado a la hipertensión arterial. Hipertens. Riesgo Vasc. 2005, 22, 109–116. [Google Scholar] [CrossRef]
- Ganna, A.; Salihovic, S.; Sundström, J.; Broeckling, C.D.; Hedman, Å.K.; Magnusson, P.K.E.; Pedersen, N.L.; Larsson, A.; Siegbahn, A.; Zilmer, M.; et al. Large-scale metabolomic profiling identifies novel biomarkers for incident coronary heart disease. PLoS Genet. 2014, 10, e1004801. [Google Scholar] [CrossRef]
- Rozenberg, O.; Shih, D.M.; Aviram, M. Human serum paraoxonase 1 decreases macrophage cholesterol biosynthesis: Possible role for its phospholipase-A2-like activity and lysophosphatidylcholine formation. Arterioscler. Thromb. Vasc. Biol. 2003, 23, 461–467. [Google Scholar] [CrossRef]
- Shih, D.M.; Gu, L.; Hama, S.; Xia, Y.R.; Navab, M.; Fogelman, A.M.; Lusis, A.J. Genetic-dietary regulation of serum paraoxonase expression and its role in atherogenesis in a mouse model. J. Clin. Investig. 1996, 97, 1630–1639. [Google Scholar] [CrossRef]
- Woznica, A.; Cantley, A.M.; Beemelmanns, C.; Freinkman, E.; Clardy, J.; King, N. Bacterial lipids activate, synergize, and inhibit a developmental switch in choanoflagellates. Proc. Natl. Acad. Sci. USA 2016, 113, 7894–7899. [Google Scholar] [CrossRef]
- Park, J.Y.; Lee, S.H.; Shin, M.J.; Hwang, G.S. Alteration in metabolic signature and lipid metabolism in patients with angina pectoris and myocardial infarction. PLoS ONE 2015, 10, e0135228. [Google Scholar] [CrossRef] [PubMed]
- Sandoval-Acuña, C.; Ferreira, J.; Speisky, H. Polyphenols and mitochondria: An update on their increasingly emerging ROS-scavenging independent actions. Arch. Biochem. Biophys. 2014, 559, 75–90. [Google Scholar] [CrossRef] [PubMed]
- Chen, C.Y.; Yi, L.; Jin, X.; Zhang, T.; Fu, Y.J.; Zhu, J.D.; Mi, M.T.; Zhang, Q.Y.; Ling, W.H.; Yu, B. Inhibitory effect of delphinidin on monocyte-endothelial cell adhesion induced by oxidized low-density lipoprotein via ROS/p38MAPK/NF-κB pathway. Cell Biochem. Biophys. 2011, 61, 337–348. [Google Scholar] [CrossRef] [PubMed]
- Ballmann, C.; Denney, T.S.; Beyers, R.J.; Quindry, T.; Romero, M.; Amin, R.; Selsby, J.T.; Quindry, J.C. Lifelong quercetin enrichment and cardioprotection in Mdx/Utrn+/-mice. Am. J. Physiol. Hear. Circ. Physiol. 2017, 312, H128–H140. [Google Scholar] [CrossRef] [PubMed]
- Fukaya, M.; Sato, Y.; Kondo, S.; Adachi, S.i.; Yoshizawa, F.; Sato, Y. Quercetin enhances fatty acid β-oxidation by inducing lipophagy in AML12 hepatocytes. Heliyon 2021, 7, e07324. [Google Scholar] [CrossRef]
- Tahri-Joutey, M.; Andreoletti, P.; Surapureddi, S.; Nasser, B.; Cherkaoui-Malki, M.; Latruffe, N. Mechanisms mediating the regulation of peroxisomal fatty acid beta-oxidation by PPARα. Int. J. Mol. Sci. 2021, 22, 8969. [Google Scholar] [CrossRef]
- Calfío, C.; Huidobro-Toro, J.P. Potent vasodilator and cellular antioxidant activity of endemic patagonian calafate berries (Berberis microphylla) with nutraceutical potential. Molecules 2019, 24, 2700. [Google Scholar] [CrossRef]


| Feature N° | Ion | Molecular Ion Formula | m/z | Fragments | Error ppm | Identification | Identification Level (A-D) 1 | International Identifier 2 | Method 3 |
|---|---|---|---|---|---|---|---|---|---|
| [M-H]- | [C24H39O4]- | 391.2849 | 391.2872; 345.2823 C23H37O2; 392.2978 | −1.9 | deoxycholic acid | A | METLIN 265 | 1 | |
| 1 | HMDB00626 | ||||||||
| 2 | [M-H]- | [C6H10NO4]- | 160.0612 | 116.0709 C5NO2H10; 142.0510 C6H8NO3 | 3.5 | DL- 2-aminoadipic acid | A | METLIN 324 HMDB00510 | 3 |
| 3 | [M-H]- | [C4H5O4]- | 117.0192 | −2.4 | succinic acid | A tR | METLIN 114 | 2 3 | |
| 4 | [M+FA-H]- | [C25H49NO9P]- | 538.3140 | 253.2184 palmitoleic acid C16H29O2; 478.2965 C23H45NO7P; 479.3015; 254.2202; 224.0688 C7H15NO5P; 538.3203; 152.9954 C6H4NO2; 242.0767 C7H17NO6P; 168.0431 C4H11NO4P; 255.2270 palmitic acid C16H31O2; 480.3119; 134.9973 82 C7H4OP | −2.5 | LysoPC(16:1/0:0) | B | HMDB0010383 | 1, 2 and 3 |
| METLIN 40288 | |||||||||
| 5 | [M+FA-H]- | [ C29H49NO9P ]- | 586.3142 | 526.2964 C27H45NO7P; 527.2954; 301.2199; 224.0732; 586.3142; 587.3137; 303.2374 C16H34NO2P; 302.2256; 152.9942; 528.2938; 301.2686 C20H29O2; 529.3097; 168.0459; 228.2245; 257.2409 C16H34P; 242.0797 C7H2NO6P; 257.0238 C13H8NO3P | −0.9 | LysoPC (20: 5 / 0: 0) | B | HMDB10397 | 1 |
| 6 | [M-H]- | [ C21H41NO7P]- | 450.2619 | 253.2162 palmitoleic acid C16H29O2; 450.2641; 254.2229; 451.2742; 196.0359 C5H11NO5P; 121.9994 C2H5NO3P; 197.0393; 140.0115 C2H7NO4P; 262.9691; 451.3470 | 4.2 | LysoPE (16:1/0:0) | B | HMDB0011504 | 1 |
| LysoPE (0:0/16:1) | HMDB0011474 | ||||||||
| 7 | [M-H]- | [C25H43NO7P]- | 500.2775 | −2.9 | LysoPE(20:4) | D | METLIN 62302, 62275 or 62276 | 3 | |
| 8 | [M+H]+ | [C23H43NO4]+ | 398.3251 | 85.0260 182 C5H4O2; 125.0717; 144.1003 C7H14NO2 | −1.9 | trans-2-hexadecenoyl-L-carnitine | A | METLIN 58388 | 2 |
| HMDB06317 | |||||||||
| 9 | [M+H]+ | [C25H50NO4]+ | 428.3702 | 9.1 | stereoyl-L-carnitine | A (tR) | METLIN 5811 | 2 | |
| 10 | [M+H]+ | [C26H47NO7P]+ | 516.3046 | 184.0733 C5H15NO4P; 124.9998; 98.9853; 104.1061; 457.2327; 458.2310; 86.0967; 185.0763 C5H12N; 146.9791; 311.2591 | 7 | LysoPC (18:4) | B (family Standard D) | HMDB10389 | 2 |
| METLIN 61699 | |||||||||
| 11 | [M+H]+ | [C25H46NO4]+ | 424.3407 | 97.1010 | 2.1 | cys,cys-9,12-octadecadienoyl-L-carnitine | A | METLIN 58418 | 2 and 3 |
| linoleoyl-L-carnitine | |||||||||
| 12 | [M+H]+ | [C24H37O2]+ | 357.2767 | −3.7 | tetracosahexaenoic acid | D | METLIN 6430 | 2 | |
| 13 | [M+H]+ | [C10H20NO4]+ | 218.1388 | 3.8 | propionyl-L-carnitine | A (tR) | METLIN 965 | 2 and 3 | |
| 14 | [M+H]+ | [C6H12NO4]+ | 162.0758 | 98.0587 C5H8NO | 1.7 | aminoadipic acid | B | HMDB00510 | 3 |
| METLIN 324 | |||||||||
Disclaimer/Publisher’s Note: The statements, opinions and data contained in all publications are solely those of the individual author(s) and contributor(s) and not of MDPI and/or the editor(s). MDPI and/or the editor(s) disclaim responsibility for any injury to people or property resulting from any ideas, methods, instructions or products referred to in the content. |
© 2023 by the authors. Licensee MDPI, Basel, Switzerland. This article is an open access article distributed under the terms and conditions of the Creative Commons Attribution (CC BY) license (https://creativecommons.org/licenses/by/4.0/).
Share and Cite
Olivares-Caro, L.; Nova-Baza, D.; Radojkovic, C.; Bustamante, L.; Duran, D.; Mennickent, D.; Melin, V.; Contreras, D.; Perez, A.J.; Mardones, C. Berberis microphylla G. Forst Intake Reduces the Cardiovascular Disease Plasmatic Markers Associated with a High-Fat Diet in a Mice Model. Antioxidants 2023, 12, 304. https://doi.org/10.3390/antiox12020304
Olivares-Caro L, Nova-Baza D, Radojkovic C, Bustamante L, Duran D, Mennickent D, Melin V, Contreras D, Perez AJ, Mardones C. Berberis microphylla G. Forst Intake Reduces the Cardiovascular Disease Plasmatic Markers Associated with a High-Fat Diet in a Mice Model. Antioxidants. 2023; 12(2):304. https://doi.org/10.3390/antiox12020304
Chicago/Turabian StyleOlivares-Caro, Lia, Daniela Nova-Baza, Claudia Radojkovic, Luis Bustamante, Daniel Duran, Daniela Mennickent, Victoria Melin, David Contreras, Andy J. Perez, and Claudia Mardones. 2023. "Berberis microphylla G. Forst Intake Reduces the Cardiovascular Disease Plasmatic Markers Associated with a High-Fat Diet in a Mice Model" Antioxidants 12, no. 2: 304. https://doi.org/10.3390/antiox12020304
APA StyleOlivares-Caro, L., Nova-Baza, D., Radojkovic, C., Bustamante, L., Duran, D., Mennickent, D., Melin, V., Contreras, D., Perez, A. J., & Mardones, C. (2023). Berberis microphylla G. Forst Intake Reduces the Cardiovascular Disease Plasmatic Markers Associated with a High-Fat Diet in a Mice Model. Antioxidants, 12(2), 304. https://doi.org/10.3390/antiox12020304