Abstract
Emerging evidence suggests that diets rich in plant-based foods and beverages may exert plausible effects on human health tackling the risk of chronic diseases. Although the data are promising for numerous outcomes, including cardiovascular diseases, the data on mental health are limited. The aim of this study was to investigate the association between individual polyphenol-rich beverages intake and mental health outcomes, such as perceived stress, depressive symptoms, and sleep quality, among adult individuals living in the Mediterranean area. The demographic and dietary characteristics of a sample of 1572 adults living in southern Italy were analysed. Multivariate logistic regression analyses, controlling for confounding factors, were used to calculate odds ratios (ORs) and 95% confidence intervals (CIs) of the association between individual polyphenol-rich and alcoholic beverages containing polyphenols and mental health outcomes. The multivariate model adjusted for background covariates and the Mediterranean diet showed that individuals with a moderate intake (up to 1 cup/glass per day) of coffee and tea were less likely to have high perceived stress (OR = 0.61, 95% CI: 0.45–0.84) and depressive symptoms (OR = 0.56, 95% CI: 0.39–0.80), respectively. Furthermore, regular coffee and moderate/regular red wine drinkers were less likely to have depressive symptoms (OR = 0.72, 95% CI: 0.54–0.95 and OR = 0.74, 95% CI: 0.54–0.99, respectively). No significant associations were retrieved for the intake of polyphenol-rich and alcoholic beverages and sleep quality. In conclusion, the results of the present study suggest that polyphenol-rich beverages may be associated with mental health, in terms of depressive symptoms and perceived stress. Nonetheless, further research exploring how the polyphenol-rich beverages impact brain health and what the optimal patterns of consumption are for different populations are warranted.
Keywords:
polyphenols; coffee; tea; wine; beer; citrus juice; mental health; sleep quality; depressive symptoms; perceived stress 1. Introduction
Dietary habits and food choices are considered among the most important behavioral risk factors for non-communicable diseases worldwide [1]. The Global Burden of Disease Study (GBD) estimated that in 2017 dietary risk factors contributed to 11 million deaths globally [2]. Most of the existing summaries of scientific literature corroborate the evidence of some key drivers of diet quality, such as the high consumption of fiber-rich foods (including fruits, vegetables, whole grains, and legumes), the adequate intake of dairy products, the limited consumption of red/processed meat and sodium, and the avoidance of trans-fatty acids and refined added sugars [3]. Such features, easily applicable at a global level, would play a major role in reducing the burden of cardiovascular diseases, metabolic disorders, and certain cancers [2]. Emerging evidence suggests that diet might also exert far more complex effects in the human body, being potentially responsible for low-grade immune responses and all conditions potentially related to chronic inflammation [4]. Among the most intriguing hypotheses, dietary risks have been related to brain health [5]. While the influence of the brain toward the gastroenteric system is well-known, a growing number of studies suggests that dietary factors may be associated with various mental health outcomes, such as depressive symptoms, perceived stress, and sleep disorders [5,6]. These conditions have been estimated to be the leading causes of years lived with disability worldwide [7], while also being interconnected with each other and associated with several non-communicable diseases, including cardio-metabolic conditions and dementias [8]. Thus, it is of paramount interest to understand whether dietary factors may have played a role in the sudden increase in the burden of mental conditions and whether the adoption of specific dietary patterns could tackle the increasing trend.
Plant-based foods are rich in fiber, but a large body of scientific literature supports the hypothesis that other molecules, such as antioxidant phytochemicals, may exert positive effects on human health [9]. Several meta-analyses demonstrated consistent findings on the association between a higher intake of dietary polyphenols and a lower risk of cardiovascular disease [10] and overall mortality [11], hypertension [12], type-2 diabetes [13], and certain cancers [14,15]. These findings suggest a potential role of plant-based foods, such as fruits, vegetables, whole grains, and legumes, in preventing non-communicable diseases and justify their inclusion in dietary recommendations. Furthermore, the consumption of plant-based beverages, such as coffee, tea, fruit juices, beer, and red and white wine, have demonstrated a potential role for the prevention of certain non-communicable diseases [9].
Among less studied outcomes, there is emerging evidence that polyphenols may exert a beneficial role in neuroprotection [16]. There are several mechanisms that could explain the potential effects of polyphenols in the central nervous system, including protection from neuroinflammation [17], improvement in vascular and endothelial brain health [18], an increase in antioxidant defenses of specific brain areas [19], and ultimately modulation of the gut microbiota profile providing peripheral effects via the gut–brain axis [20]. Recently, some studies showed an association between the intake of specific polyphenols and sleep quality and depressive symptoms [21,22]. However, although the number of studies reporting on the association between polyphenol-rich beverages and mental health outcomes is increasing, current evidence is still unclear. The aim of this study is to investigate the association between individual polyphenol-rich beverages intake and mental health outcomes, such as perceived stress, depressive symptoms, and sleep quality, among adult individuals living in the Mediterranean area.
2. Materials and Methods
2.1. Study Population
The Mediterranean healthy Eating, Aging, and Lifestyle (MEAL) study is an observational study aimed to evaluate the association between Mediterranean dietary and lifestyle habits and chronic diseases. A detailed protocol of this study is published elsewhere [23]. In brief, a sample of men and women aged 18 or more years old was randomly selected by using the list of registered records of local general practitioners. Participants were enrolled between 2014 and 2015 from the main districts of Catania, a city of southern Italy. Data were stratified by 10-year age groups and sex. In order to provide a specific relative precision of 5% (Type I error, 0.05; Type II error, 0.10), considering an anticipated 70% participation rate, the theoretical sample size was estimated to 1500 individuals. Out of 2405 subjects invited to participate in the study, 2044 accepted to participate in the study (response rate of 85%). The aims of the study were explained in detail to all participants, and written informed consent was provided. All the procedures were performed in agreement with the Declaration of Helsinki (1989) of the World Medical Association. The study protocol has been revised and authorized by the concerning ethical committee.
2.2. Data Collection
Face-to-face personal interviews were conducted and an electronic data collection was implemented with the use of tablet computers. All participants were provided with a paper copy of the questionnaire to better visualize the response options, but the final answers were registered by the interviewer personally. The following background data were collected: sex, age at recruitment, highest degree of education, physical activity level, and smoking status. Educational status was categorized as (i) low (primary/secondary), (ii) medium (high school), and (iii) high (university). International Physical Activity Questionnaires (IPAQ) was used to estimate the physical activity level [24]. According to IPAQ, physical activity was categorized as (i) low, (ii) moderate, and (iii) high. Smoking status was classified as being a non, former-, or current smoker. Anthropometric assessments were undertaken according to the standardized techniques [25]. Body height was measured with precision of 0.5 cm in barefoot participants with a right-angle triangle resting on the scalp, who were standing back to the wall and focusing their eyes straight ahead. Body mass index (BMI) was categorized as normal weight (BMI < 25 kg/m2), overweight (BMI 25 to 29.9 kg/m2), and obese (BMI ≥ 30 kg/m2).
2.3. Dietary Assessment
The dietary intake was assessed using two versions of food frequency questionnaires (FFQs), a long and a short version [26,27], whose validity and reliability have been previously tested in the Sicilian population. The consumption of seasonal foods refers to the intake during the period in which the food was available and then adjusted by its proportional intake in one year. Employing the determination of the food intake, the energy content as well as the macro- and micronutrients intake was calculated through a comparison with food composition tables of Council for Research in Agriculture and Analysis of Agricultural Economy (CREA) [28]. Phenol-Explorer database was used to estimate polyphenol intake, as previously reported in detail [29]. Specifically, the individual food consumption (in mL or g) was obtained for each participant of the study by following the standard portion sizes converted to 24 h intake; next, the databases were searched to obtain average values for the energy content, macro-, micronutrients, and polyphenols contained in the foods (per 100 mL or g). Finally, the energy, nutrient, and polyphenol intake from each food was calculated by multiplying the content of each variable by the daily consumption of each food [30]. FFQs with lacking data or unreliable intakes (<1000 or >6000 kcal/d) were excluded from the analyses (n = 198) leaving a total of 1846 individuals. The variables of interest were intake of tea, coffee (espresso/stovetop), red and white wine, beer, and fruit juice (fresh citrus juice). For each polyphenol-rich beverage type, three type-specific categories of intake [(i) no consumption, (ii) up to one cup/glass per day, and (iii) more than one cup/glass per day] were considered. The categorization was based on roughly tertiles of distribution and universally accepted standard servings for beverage consumption.
A literature-based score was used to calculate adherence to the Mediterranean diet [31]. Adherence to the Mediterranean diet was used as a proxy of diet quality and assessed using a literature-based scoring system. Briefly, two points were given to the highest category of consumption of food groups typical of the Mediterranean pattern (such as vegetables, fruits, legumes, cereals, fish), one point for the middle category and 0 points for the lowest category of consumption. Conversely, two points were given for the lowest category of consumption of foods not characteristic to the Mediterranean diet (such as meat and dairy products), one point for the middle category, and 0 points for the highest category of consumption. A better adherence was guaranteed by a moderate alcohol intake and regular use of olive oil. The final score comprises nine food categories with a score ranging from 0 points (lowest adherence) to 18 points (highest adherence); thus, individuals were categorized in the following tertiles: (i) low, (ii) medium, and (iii) high adherence to the Mediterranean diet.
2.4. Mental Health Status Assessment
Participants’ sleep quality was evaluated using the Pittsburgh sleep quality index (PSQI) [32]. The questionnaire consists of 19 items classified on a four-point scale (0–3) and clustered into seven domains (sleep quality, sleep latency, sleep duration, habitual sleep efficiency, sleep disturbance, use of sleeping medications, and daytime dysfunction). The item scores in each component were summed and converted into domain scores ranging from 0 (better) to 3 (worse) based on guidelines. The total PSQI score was obtained by calculating the sum of the seven domain scores. The global PSQI score ranges from 0 to 21 points, with a higher score indicating worse sleep quality. A result of <5 on global PSQI score is indicative of adequate sleep quality.
The Perceived Stress Scale (PSS) was used to evaluate stress symptoms [33]. In brief, PSS is a 14-item questionnaire used to measure perceived stress, i.e., how individuals perceive situations as stressful. Each question has answer options ranging from zero to four (i.e., 0 = never, 1 = almost never, 2 = sometimes, 3 = often, and 4 = always). The global score is the sum of the scores of these 14 items and the global score ranges from 0 (minimum) to 56 (maximum). The sex-specific median value was considered as cut-off point to define high or low perceived stress.
In order to evaluate depressive symptoms, the 20-item Center for the Epidemiological Studies of Depression Short Form (CES-D) was used [34]. Briefly, CES-D is commonly used to screen for depressive symptoms in the general population. Each item of the scale rates the frequency of each mood or symptom ‘during the past week’ on a 4-point scale ranging from 0 (rarely or none of the time [less than 1 day]) to 3 (most or all of the time [5–7 days]). A score is assigned by totaling all items (after reversing the positive mood items); total scores can range from 0 to 30, with higher scores suggesting greater severity of symptoms, and a score ≥ 16 indicating as having depressive symptoms [35,36]. After exclusion of individuals with missing data about the mental and sleep health assessment, a total sample of 1572 was included in the final analysis.
2.5. Statistical Analysis
Categorical variables were characterized by absolute numbers and relative frequencies (%). Continuous features were reported as means and standard deviations. The distribution of background characteristics and polyphenol intake were compared between predefined groups of polyphenol-rich beverage consumption. Differences in percentages of categorical variables across three groups were verified with Chi-squared test. Comparison of normally and not normally distributed continuous variables between defined groups of subjects were conducted by applying ANOVA and Kruskall–Wallis test, respectively. Odds ratios (ORs) and 95% confidence intervals (CIs) for association between categories of intake of individual polyphenol-rich beverages and mental health outcomes (including sleep quality, perceived stress, and depressive symptoms) were calculated based on fitted multiple logistic regression models. To test possible effect of confounding factors we used three levels of adjustment with different sets of covariates, including energy intake and all polyphenol-rich beverage intake (model 1), all background characteristics (model 2), and adherence to the Mediterranean diet as a proxy of diet quality (model 3). This allowed us to verify robustness of the findings and check whether the retrieved associations were independent of the potential confounders, including overall quality of the diet. The significance level was set at 0.05 and all reported p-values were based on two-sided tests. Analyses were performed using the SPSS version 27 (SPSS Inc., Chicago, IL, USA).
3. Results
The background characteristics of the study sample are provided in Table 1. The mean age was 46.6 years old, less than half were men (42.0%). The majority of participants were never smokers with an average BMI of 25.6, reporting occasional alcohol drinking. Educational and physical activity levels were quite equally distributed in the study sample. Roughly one third of the participants reported having depressive symptoms, perceived stress, and/or low sleep quality (Table 1). Compared with individuals excluded from the analysis due to a lack of data on mental health status, participants were younger, had lower BMIs, a higher educational status, were more physically active, and there was a lower prevalence of current smokers and a higher proportion of occasional drinkers (Supplementary Table S1).

Table 1.
Background characteristics of the study sample (n = 1572).
The background characteristics distributed across the three categories of the intake of individual polyphenol-rich and alcoholic beverages containing polyphenols are presented in Table 2 and Table 3, respectively. There was a significantly higher proportion of women among individuals consuming more tea and white wine and among those characterized by a moderate (up to 1 glass/cup a day) coffee and red wine intake, while beer was significantly more consumed by men. There was a significant, yet not clear, trend in the distribution of age groups by the level of consumption of tea, citrus fruit juice, and white wine (more consumed in middle-aged individuals), while there was a significantly higher proportion of older participants consuming coffee and red wine, and younger participants consuming more beer. Education level was slightly lower among higher coffee and white wine consumers, higher among citrus juice and beer, and with no trend among red wine consumers. Among individuals consuming more tea and citrus juice there was a significantly higher proportion of non-smokers, while among those consuming more coffee (Table 2) and red and white wine (Table 3) there were more current and former smokers compared with no consumption.
Table 2.
Background characteristics of the study sample by consumption of individual non-alcoholic polyphenol-rich beverages.
Table 3.
Background characteristics of the study sample by consumption of individual alcoholic polyphenol-rich beverages.
Concerning physical activity levels, there was a higher proportion of more active individuals among citrus juice, red and white wine, and beer consumers, while no clear patterns were evidenced for tea and coffee drinkers (Table 2 and Table 3). Similarly, there was a lower proportion of obese individuals among higher tea, citrus juice, red and white wine, and beer consumers, while there was a higher proportion of obesity among individuals consuming up to one cup of coffee per day. Finally, adherence to the Mediterranean diet was significantly differently distributed across categories of some polyphenol-rich beverages consumption: higher adherence was found among higher tea, citrus juice, and white wine consumers, and in those consuming up to one glass of red wine per day.
Figure 1 describes the distribution of the mean intake of total and specific classes of polyphenols by the intake of polyphenol-rich beverages. While the total polyphenol intake significantly increased with the intake of red and white wine and beer, there was a lower intake among moderate consumers of citrus juice and tea, and an unclear trend when considering the coffee intake categories, being made up of individuals who reported no consumption of coffee but who had the highest intakes of total polyphenols. This pattern substantially changes when considering individual polyphenol groups. For instance, higher flavonoid intake was found among higher tea, and red and white wine drinkers; higher phenolic acid intake was found among coffee, red and white wine, and beer drinkers; the mean intake of stilbenes was again higher among red and white wine drinkers, but also in those consuming more coffee, despite the overall quantity being lower than in the former.
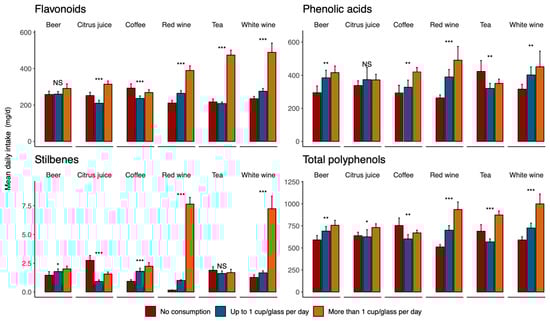
Figure 1.
Distribution of mean intake of total and specific classes of polyphenols by intake of polyphenol-rich beverages. * p < 0.05; ** p = 0.001; *** p < 0.001; NS—not significant.
Figure 2 presents the distribution of the PSQI, CES-D, and PSS scores by categories of polyphenol-rich beverage consumption. Overall, there were no significant median differences between the groups.
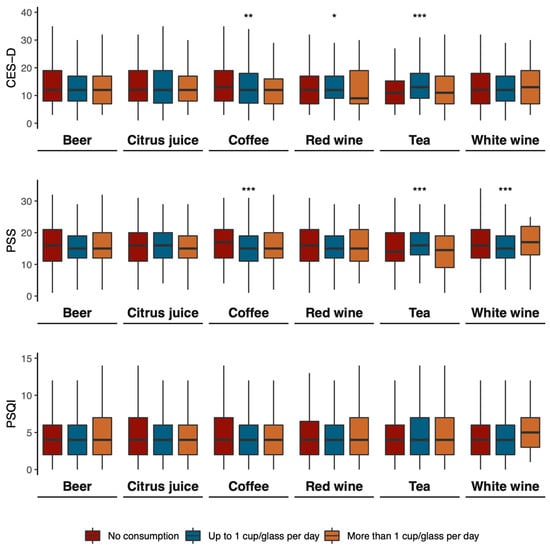
Figure 2.
Mean scores of CES-D, PSS, and PSQI by consumption of polyphenol-rich beverages. * p < 0.05; ** p = 0.001; *** p < 0.001.
Table 4 shows the association between the intake of individual polyphenol-rich and alcoholic beverages containing polyphenols and mental health outcomes investigated in this study. While none of the unadjusted models resulted in significant associations for the highest intake of beverages compared with the lowest intake, the multivariate model adjusted for background covariates and Mediterranean diet revealed that individuals with a moderate intake (up to 1 cup/glass per day) of coffee and tea were less likely to have high perceived stress (OR = 0.61, 95% CI: 0.45–0.84) and depressive symptoms (OR = 0.56, 95% CI: 0.39–0.80), respectively. Moreover, regular coffee and moderate/regular red wine drinkers were less likely to have depressive symptoms (OR = 0.72, 95% CI: 0.54–0.95 and OR = 0.74, 95% CI: 0.54–0.99, respectively). No significant associations were retrieved for the intake of polyphenol-rich and alcoholic beverages and sleep quality.
Table 4.
Association between polyphenol-rich beverages consumption and mental health outcomes in the study sample.
4. Discussion
The results from this study show that beverages rich in polyphenols are associated, to various extents, with the mental health status of southern Italian individuals. While no significant results were found for sleep quality, other outcomes such as perceived stress and depressive symptoms were inversely associated with different coffee, tea, and red wine intakes. Interestingly, some associations (i.e., for tea or red wine) were not dose-dependent but occurred for moderate intakes (such as, 1 cup/glass per day), suggesting that a higher intake of one beverage did not necessarily imply the highest intake of polyphenols and that a moderate intake versus no intake could have some benefits, while excess consumption could be jeopardized by other compounds (i.e., alcohol, caffeine, etc.) that may counteract the beneficial effects. To our knowledge, this is the first study investigating the relation between polyphenol-rich beverages and mental health outcomes in Italy.
The results reported in this study are generally in line with the emerging existing scientific literature published on this topic. A meta-analysis of observational studies including a total of 346,913 individuals and 8146 cases of depression showed a J-shaped relation between coffee consumption and the risk of depression, with the lowest risk registered at 400 mL/d [37]. Another meta-analysis including 22,817 participants with 4743 cases of depression showed a linear relation between tea consumption and depression risk [38]. However, no data was previously published on Italian individuals recruited from the general population: a report from the InChianti (Invecchiare in Chianti) study conducted on 1058 Italian participants (aged 20–102 years) reported no association between either tea or coffee consumption and symptoms of depression [39], while two other studies conducted on a sample of 300 non-demented elderly Italian subjects with subcortical ischemic vascular disease showed that daily moka pot coffee intake was associated with a higher mood status, with a significant dose-response association even for moderate consumption [40,41]. A recent study from the UK Biobank including 402,290 participants showed that moderate coffee consumption, alongside adequate sleep quality, would reduce the risk of mental disorders, such as depressive and anxiety disorders [42]. When considering the wider aspects of mood and psychological well-being, a recent study from the Nurses’ Health Study involving multiple assessments from 1992–2000 (N = 44,449) and the 2004–2012 (N = 36,729) data collections reported that moderate coffee intake was associated with a greater likelihood of sustained optimism [43]. However, in another study conducted on Japanese auto factory workers (n = 5256), coffee consumption and smoking status was not significantly related to psychological well-being [44].
Concerning wine consumption, the only Italian data was published from the InChianti (Invecchiare in Chianti) study conducted on 1362 participants aged 18–102 years (mean age 68 y) followed-up for 9 years. The study reported that a typical Italian diet characterized by vegetables, olive oil, grains, fruits, fish, and moderate meat and wine consumption was consistently inversely associated with depressive symptoms both at baseline and at follow-up [45]. A more recent study conducted on 5505 participants (55 to 80 y) of the PREDIMED Trial (Spain), followed-up for up to 7 years, showed that moderate alcohol intake (5 to 15 g/day) from wine (two to seven drinks/week) was significantly associated with a lower risk of incident depression [46]. In another study conducted on 13,619 university graduates (mean age 38 y) participating in a Spanish prospective epidemiological cohort (the SUN Project) followed-up for 10 years there was a U-shaped relationship between total alcohol intake and depression risk among women, although no apparent association with a specific type of alcoholic beverage was reported [47]. Similarly to the PREDIMED study, a moderate alcohol intake (5 to 15 g/day) was associated with a lower risk of depression [47]. However, another study conducted on 5299 community-dwelling older adults from the ELSA (English Longitudinal Study of Ageing) and Seniors-ENRICA cohorts (Study on Nutrition and Cardiovascular Risk in Spain) reported that moderate drinkers showed comparable scores on psychological tests with no different risk of being clinically diagnosed with depression [48]. Furthermore, studies on secondary prevention of depression following a primary major disease showed the potential beneficial effects of moderate alcohol (especially from wine) consumption. Two studies on colorectal cancer survivors showed that moderate alcohol drinkers (<7 drinks per week) were less likely to have depressive symptoms and reported having better health-related quality of life compared with abstainers [49,50]. Moreover, similar findings were reported in 6973 patients enrolled in the Gruppo Italiano per lo Studio della Sopravvivenza nell’Insufficienza Cardiaca-Heart Failure (GISSI-HF) trial in which those with more frequent wine consumption had less frequent symptoms of depression, a better perception of health status, and lower plasma levels of the biomarkers of vascular inflammation [51].
Polyphenol-rich beverages are a source of fluids and may contribute to the daily amount of ingested water [52]. However, the specific types of beverages (i.e., espresso/stove coffee), the scarcity of intake in the population under study (i.e., tea), and findings on moderate rather than large amounts (i.e., wine) suggest that the potential beneficial effects may rely on other qualitative aspects of such beverages rather than the mere content of water. Each beverage is, in fact, a source of different polyphenol compounds: coffee is rich in hydroxycinnamic acids, such as chlorogenic acid, ferulic acid, and caffeic acid [53], while tea is characterized by a high content of flavonoids, such as epigallocatechin-3-gallate, epigallocatechin, epicatechin-3-gallate, and epicatechin [54]. Finally, red wine is a major source of resveratrol, a stilbene richly contained in grapes [55]. All these compounds have been demonstrated to potentially exert, to a various extent, anti-inflammatory effects in the central nervous system [56]. The bioactive constituents of coffee are able to modulate the parameters of neuroinflammation through anti-inflammatory and antioxidant properties [57]. Tea polyphenols are also known to be potent anti-inflammatory agents (i.e., via down-regulation of NF-κB signaling) and effective modulators of dopaminergic activity [58]. The main biological mechanisms identified to potentially explain the effects of resveratrol (and red wine) on brain health include the regulation of the hypothalamic–pituitary–adrenal (HPA) axis, an increase in brain-derived neurotrophic factor (BDNF) and neurogenesis, and anti-inflammatory effects [59]. Emerging evidence also involves the potential effects of polyphenols on the gut–brain axis, intended as a bi-directional communication network connecting the central nervous system to the gut through a variety of pathways, including the nervous system (i.e., vagus nerve), immune system, neuroendocrine pathways, and an alteration in the gut-microbiota [60,61]. Polyphenols are largely metabolized by the gut microbiota, leading to the production of metabolites that exert an important support on the functional ecology of symbiotic partners, which in turn may affect the host physiology [62,63]. Polyphenols derived from coffee [64], tea [65], and wine [66,67] have been reported to be able to modulate the gut microbiota in favor of strains, such as Lactobacillus spp. and Bifidobacterium spp., that positively affect mental health. The mechanisms through which the modulation of gut microbiota may exert favorable effects on mental health disorders are only partially elucidated, but the integrity of the colonic mucosa, nervous impulses transmission through the vagus nerve, and dopaminergic/serotonergic systems have been found to be related to microbiota [68,69,70]. Moreover, polyphenols derived from beverages may also increase certain gut microbiota strains, such as Eubacterium, Ruminococcaceae, and Roseburia [71,72,73,74,75], which are known to improve the production of short-chain fatty acids (SCFAs), such as butyrate, acetate, and propionate [76], which have been shown to be able to cross the blood brain barrier and exhibit antidepressant and anxiolytic effects by ameliorating psychosocial stress-induced alterations in behavior [77,78].
The results of the present study should be considered in light of some limitations. Firstly, the cross-sectional design of the study does not allow for the establishment of causality but only associations. Moreover, given the cross-sectional nature of the study, the conclusions might be biased by reverse causality. Second, although various factors have been considered as potential confounders, we cannot rule out the possibility of residual confounding from unmeasured variables (i.e., social integration, family history of specific diseases, other environmental factors, etc.). Moreover, compared with non responders, the participants included in this analysis had a higher educational status and healthier lifestyle behaviors: thus, the results of this study may not necessarily apply to the totality of the population but might be limited to some subgroups. Third, although the use of FFQ is widely adopted in observational studies, the dietary exposure assessment may be affected by recall bias and over- or underestimation. Finally, exposure to dietary factors may identify features of dietary patterns or larger clusters of lifestyle behaviors and the variables of interest may not be sufficient to exert the expected effects alone.
5. Conclusions
In conclusion, the results of the present study suggest that polyphenol-rich beverages may be associated with mental health, specifically, the consumption of coffee, tea, and red wine was associated with lower depressive symptoms and perceived stress. Considering that the overall consumption of such beverages in this sample was moderate, the findings reported in this study suggest that the retrieved associations with better mental health outcomes are more likely to be considered for the moderate consumption of a variety of polyphenol-rich beverages rather than higher intake of a single one. Additional studies are needed to better describe the optimal patterns of consumption of polyphenol-rich beverages and whether these may differ across populations with different dietary patterns. Moreover, further research exploring how the polyphenol-rich beverages impact brain health from a mechanistic point of view is highly warranted.
Supplementary Materials
The following supporting information can be downloaded at: https://www.mdpi.com/article/10.3390/antiox12020272/s1, Table S1: Differences in background characteristics between included and excluded sample.
Author Contributions
Conceptualization and methodology, A.M., G.G. and J.G.; Data curation and formal analysis, A.M., G.G. and J.G.; Writing—original draft preparation, A.M., J.J., M.O., G.G. and J.G.; Writing—review and editing, A.M., J.J., M.O., I.G., S.A.T., S.C., G.G., A.A.A. and J.G.; Supervision, G.G. and J.G.; Project administration and funding acquisition, G.G., A.A.A. and J.G. All authors have read and agreed to the published version of the manuscript.
Funding
This work was supported by the Distinguished Scientist Fellowship Program (DSFP) at King Saud University, Riyadh, Saudi Arabia. J.G. was supported by the co-financing of the European Union—FSE-REACT-EU, PON Research and Innovation 2014–2020 DM1062/2021; CUP: E65F21002560001.
Institutional Review Board Statement
The study was conducted in accordance with the Declaration of Helsinki and approved by the Institutional Review Board (or Ethics Committee) of CE Catania 2 (protocol code 802/23 December 2014).
Informed Consent Statement
Informed consent was obtained from all subjects involved in the study.
Data Availability Statement
The data that support the findings of this study are available upon reasonable request.
Conflicts of Interest
The authors declare no conflict of interest. The funders had no role in the design and reporting of the study.
References
- GBD 2019 Risk Factors Collaborators. Global burden of 87 risk factors in 204 countries and territories, 1990–2019: A systematic analysis for the Global Burden of Disease Study 2019. Lancet 2020, 396, 1223–1249. [Google Scholar] [CrossRef] [PubMed]
- GBD 2017 Diet Collaborators. Health effects of dietary risks in 195 countries, 1990-2017: A systematic analysis for the Global Burden of Disease Study 2017. Lancet 2019, 393, 1958–1972. [Google Scholar] [CrossRef] [PubMed]
- Willett, W.; Rockström, J.; Loken, B.; Springmann, M.; Lang, T.; Vermeulen, S.; Garnett, T.; Tilman, D.; DeClerck, F.; Wood, A.; et al. Food in the Anthropocene: The EAT-Lancet Commission on healthy diets from sustainable food systems. Lancet 2019, 393, 447–492. [Google Scholar] [CrossRef]
- Grosso, G.; Laudisio, D.; Frias-Toral, E.; Barrea, L.; Muscogiuri, G.; Savastano, S.; Colao, A. Anti-Inflammatory Nutrients and Obesity-Associated Metabolic-Inflammation: State of the Art and Future Direction. Nutrients 2022, 14, 1137. [Google Scholar] [CrossRef] [PubMed]
- Godos, J.; Currenti, W.; Angelino, D.; Mena, P.; Castellano, S.; Caraci, F.; Galvano, F.; Del Rio, D.; Ferri, R.; Grosso, G. Diet and mental health: Review of the recent updates on molecular mechanisms. Antioxidants 2020, 9, 346. [Google Scholar] [CrossRef] [PubMed]
- Godos, J.; Grosso, G.; Castellano, S.; Galvano, F.; Caraci, F.; Ferri, R. Association between diet and sleep quality: A systematic review. Sleep Med. Rev. 2021, 57, 101430. [Google Scholar] [CrossRef] [PubMed]
- GBD Collaborators. Global burden of 369 diseases and injuries in 204 countries and territories, 1990–2019: A systematic analysis for the Global Burden of Disease Study 2019. Lancet 2020, 396, 1204–1222. [Google Scholar] [CrossRef]
- Clarke, D.M.; Currie, K.C. Depression, anxiety and their relationship with chronic diseases: A review of the epidemiology, risk and treatment evidence. Med. J. Aust. 2009, 190, S54–S60. [Google Scholar] [CrossRef]
- Grosso, G. Effects of Polyphenol-Rich Foods on Human Health. Nutrients 2018, 10, 1089. [Google Scholar] [CrossRef]
- Micek, A.; Godos, J.; Del Rio, D.; Galvano, F.; Grosso, G. Dietary Flavonoids and Cardiovascular Disease: A Comprehensive Dose-Response Meta-Analysis. Mol. Nutr. Food Res. 2021, 65, e2001019. [Google Scholar] [CrossRef]
- Grosso, G.; Micek, A.; Godos, J.; Pajak, A.; Sciacca, S.; Galvano, F.; Giovannucci, E.L. Dietary Flavonoid and Lignan Intake and Mortality in Prospective Cohort Studies: Systematic Review and Dose-Response Meta-Analysis. Am. J. Epidemiol. 2017, 185, 1304–1316. [Google Scholar] [CrossRef]
- Godos, J.; Vitale, M.; Micek, A.; Ray, S.; Martini, D.; Del Rio, D.; Riccardi, G.; Galvano, F.; Grosso, G. Dietary Polyphenol Intake, Blood Pressure, and Hypertension: A Systematic Review and Meta-Analysis of Observational Studies. Antioxidants 2019, 8, 152. [Google Scholar] [CrossRef]
- Guo, X.-F.; Ruan, Y.; Li, Z.-H.; Li, D. Flavonoid subclasses and type 2 diabetes mellitus risk: A meta-analysis of prospective cohort studies. Crit. Rev. Food Sci. Nutr. 2019, 59, 2850–2862. [Google Scholar] [CrossRef] [PubMed]
- Grosso, G.; Godos, J.; Lamuela-Raventos, R.; Ray, S.; Micek, A.; Pajak, A.; Sciacca, S.; D’Orazio, N.; Del Rio, D.; Galvano, F. A comprehensive meta-analysis on dietary flavonoid and lignan intake and cancer risk: Level of evidence and limitations. Mol. Nutr. Food Res. 2017, 61, 1600930. [Google Scholar] [CrossRef] [PubMed]
- Micek, A.; Godos, J.; Brzostek, T.; Gniadek, A.; Favari, C.; Mena, P.; Libra, M.; Del Rio, D.; Galvano, F.; Grosso, G. Dietary phytoestrogens and biomarkers of their intake in relation to cancer survival and recurrence: A comprehensive systematic review with meta-analysis. Nutr. Rev. 2021, 79, 42–65. [Google Scholar] [CrossRef] [PubMed]
- Rodrigo-Gonzalo, M.J.; González-Manzano, S.; Mendez-Sánchez, R.; Santos-Buelga, C.; Recio-Rodríguez, J.I. Effect of polyphenolic complements on cognitive function in the elderly: A systematic review. Antioxidants 2022, 11, 1549. [Google Scholar] [CrossRef]
- Wang, Y.; Wang, K.; Yan, J.; Zhou, Q.; Wang, X. Recent Progress in Research on Mechanisms of Action of Natural Products against Alzheimer’s Disease: Dietary Plant Polyphenols. Int. J. Mol. Sci. 2022, 23, 13886. [Google Scholar] [CrossRef] [PubMed]
- Grosso, G.; Godos, J.; Currenti, W.; Micek, A.; Falzone, L.; Libra, M.; Giampieri, F.; Forbes-Hernández, T.Y.; Quiles, J.L.; Battino, M.; et al. The effect of dietary polyphenols on vascular health and hypertension: Current evidence and mechanisms of action. Nutrients 2022, 14, 545. [Google Scholar] [CrossRef] [PubMed]
- Morén, C.; deSouza, R.M.; Giraldo, D.M.; Uff, C. Antioxidant therapeutic strategies in neurodegenerative diseases. Int. J. Mol. Sci. 2022, 23, 9328. [Google Scholar] [CrossRef]
- Magni, G.; Riboldi, B.; Petroni, K.; Ceruti, S. Flavonoids bridging the gut and the brain: Intestinal metabolic fate, and direct or indirect effects of natural supporters against neuroinflammation and neurodegeneration. Biochem. Pharmacol. 2022, 205, 115257. [Google Scholar] [CrossRef]
- Godos, J.; Ferri, R.; Castellano, S.; Angelino, D.; Mena, P.; Del Rio, D.; Caraci, F.; Galvano, F.; Grosso, G. Specific Dietary (Poly)phenols Are Associated with Sleep Quality in a Cohort of Italian Adults. Nutrients 2020, 12, 1226. [Google Scholar] [CrossRef] [PubMed]
- Godos, J.; Castellano, S.; Ray, S.; Grosso, G.; Galvano, F. Dietary Polyphenol Intake and Depression: Results from the Mediterranean Healthy Eating, Lifestyle and Aging (MEAL) Study. Molecules 2018, 23, 999. [Google Scholar] [CrossRef] [PubMed]
- Grosso, G.; Marventano, S.; D’Urso, M.; Mistretta, A.; Galvano, F. The Mediterranean healthy eating, ageing, and lifestyle (MEAL) study: Rationale and study design. Int. J. Food Sci. Nutr. 2017, 68, 577–586. [Google Scholar] [CrossRef] [PubMed]
- Craig, C.L.; Marshall, A.L.; Sjöström, M.; Bauman, A.E.; Booth, M.L.; Ainsworth, B.E.; Pratt, M.; Ekelund, U.; Yngve, A.; Sallis, J.F.; et al. International physical activity questionnaire: 12-country reliability and validity. Med. Sci. Sports Exerc. 2003, 35, 1381–1395. [Google Scholar] [CrossRef] [PubMed]
- Mistretta, A.; Marventano, S.; Platania, A.; Godos, J.; Galvano, F.; Grosso, G. Metabolic profile of the Mediterranean healthy Eating, Lifestyle and Aging (MEAL) study cohort. Med. J. Nutr. Metab. 2017, 10, 131–140. [Google Scholar] [CrossRef]
- Marventano, S.; Mistretta, A.; Platania, A.; Galvano, F.; Grosso, G. Reliability and relative validity of a food frequency questionnaire for Italian adults living in Sicily, Southern Italy. Int. J. Food Sci. Nutr. 2016, 67, 857–864. [Google Scholar] [CrossRef]
- Buscemi, S.; Rosafio, G.; Vasto, S.; Massenti, F.M.; Grosso, G.; Galvano, F.; Rini, N.; Barile, A.M.; Maniaci, V.; Cosentino, L.; et al. Validation of a food frequency questionnaire for use in Italian adults living in Sicily. Int. J. Food Sci. Nutr. 2015, 66, 426–438. [Google Scholar] [CrossRef]
- Tabelle Composizione Degli Alimenti CREA. Available online: https://www.crea.gov.it/-/tabella-di-composizione-degli-alimenti (accessed on 12 May 2021).
- Godos, J.; Marventano, S.; Mistretta, A.; Galvano, F.; Grosso, G. Dietary sources of polyphenols in the Mediterranean healthy Eating, Aging and Lifestyle (MEAL) study cohort. Int. J. Food Sci. Nutr. 2017, 68, 750–756. [Google Scholar] [CrossRef]
- Godos, J.; Rapisarda, G.; Marventano, S.; Galvano, F.; Mistretta, A.; Grosso, G. Association between polyphenol intake and adherence to the Mediterranean diet in Sicily, southern Italy. NFS J. 2017, 8, 1–7. [Google Scholar] [CrossRef]
- Marventano, S.; Godos, J.; Platania, A.; Galvano, F.; Mistretta, A.; Grosso, G. Mediterranean diet adherence in the Mediterranean healthy eating, aging and lifestyle (MEAL) study cohort. Int. J. Food Sci. Nutr. 2018, 69, 100–107. [Google Scholar] [CrossRef]
- Buysse, D.J.; Reynolds, C.F.; Monk, T.H.; Berman, S.R.; Kupfer, D.J. The Pittsburgh Sleep Quality Index: A new instrument for psychiatric practice and research. Psychiatry Res. 1989, 28, 193–213. [Google Scholar] [CrossRef] [PubMed]
- Cohen, S.; Kamarck, T.; Mermelstein, R. A global measure of perceived stress. J. Health Soc. Behav. 1983, 24, 385–396. [Google Scholar] [CrossRef] [PubMed]
- Radloff, L.S. The use of the Center for Epidemiologic Studies Depression Scale in adolescents and young adults. J. Youth Adolesc. 1991, 20, 149–166. [Google Scholar] [CrossRef] [PubMed]
- Lewinsohn, P.M.; Seeley, J.R.; Roberts, R.E.; Allen, N.B. Center for Epidemiologic Studies Depression Scale (CES-D) as a screening instrument for depression among community-residing older adults. Psychol. Aging 1997, 12, 277–287. [Google Scholar] [CrossRef] [PubMed]
- Kozela, M.; Bobak, M.; Besala, A.; Micek, A.; Kubinova, R.; Malyutina, S.; Denisova, D.; Richards, M.; Pikhart, H.; Peasey, A.; et al. The association of depressive symptoms with cardiovascular and all-cause mortality in Central and Eastern Europe: Prospective results of the HAPIEE study. Eur. J. Prev. Cardiol. 2016, 23, 1839–1847. [Google Scholar] [CrossRef]
- Grosso, G.; Micek, A.; Castellano, S.; Pajak, A.; Galvano, F. Coffee, tea, caffeine and risk of depression: A systematic review and dose-response meta-analysis of observational studies. Mol. Nutr. Food Res. 2016, 60, 223–234. [Google Scholar] [CrossRef]
- Dong, X.; Yang, C.; Cao, S.; Gan, Y.; Sun, H.; Gong, Y.; Yang, H.; Yin, X.; Lu, Z. Tea consumption and the risk of depression: A meta-analysis of observational studies. Aust. N. Z. J. Psychiatry 2015, 49, 334–345. [Google Scholar] [CrossRef]
- Elstgeest, L.E.M.; Visser, M.; Penninx, B.W.J.H.; Colpo, M.; Bandinelli, S.; Brouwer, I.A. Bidirectional associations between food groups and depressive symptoms: Longitudinal findings from the Invecchiare in Chianti (InCHIANTI) study. Br. J. Nutr. 2019, 121, 439–450. [Google Scholar] [CrossRef]
- Fisicaro, F.; Lanza, G.; Pennisi, M.; Vagli, C.; Cantone, M.; Falzone, L.; Pennisi, G.; Ferri, R.; Bella, R. Daily mocha coffee intake and psycho-cognitive status in non-demented non-smokers subjects with subcortical ischaemic vascular disease. Int. J. Food Sci. Nutr. 2022, 73, 821–828. [Google Scholar] [CrossRef]
- Fisicaro, F.; Lanza, G.; Pennisi, M.; Vagli, C.; Cantone, M.; Pennisi, G.; Ferri, R.; Bella, R. Moderate Mocha Coffee Consumption Is Associated with Higher Cognitive and Mood Status in a Non-Demented Elderly Population with Subcortical Ischemic Vascular Disease. Nutrients 2021, 13, 536. [Google Scholar] [CrossRef]
- Pan, C.; Ye, J.; Wen, Y.; Chu, X.; Jia, Y.; Cheng, B.; Cheng, S.; Liu, L.; Yang, X.; Liang, C.; et al. The associations between sleep behaviors, lifestyle factors, genetic risk and mental disorders: A cohort study of 402 290 UK Biobank participants. Psychiatry Res. 2022, 311, 114488. [Google Scholar] [CrossRef] [PubMed]
- Qureshi, F.; Stampfer, M.; Kubzansky, L.D.; Trudel-Fitzgerald, C. Prospective associations between coffee consumption and psychological well-being. PLoS ONE 2022, 17, e0267500. [Google Scholar] [CrossRef] [PubMed]
- Kawada, T. Coffee consumption and psychological wellbeing among Japanese auto factory workers. Work 2021, 69, 1255–1259. [Google Scholar] [CrossRef] [PubMed]
- Vermeulen, E.; Stronks, K.; Visser, M.; Brouwer, I.A.; Schene, A.H.; Mocking, R.J.T.; Colpo, M.; Bandinelli, S.; Ferrucci, L.; Nicolaou, M. The association between dietary patterns derived by reduced rank regression and depressive symptoms over time: The Invecchiare in Chianti (InCHIANTI) study. Br. J. Nutr. 2016, 115, 2145–2153. [Google Scholar] [CrossRef] [PubMed]
- Gea, A.; Beunza, J.J.; Estruch, R.; Sánchez-Villegas, A.; Salas-Salvadó, J.; Buil-Cosiales, P.; Gómez-Gracia, E.; Covas, M.-I.; Corella, D.; Fiol, M.; et al. Alcohol intake, wine consumption and the development of depression: The PREDIMED study. BMC Med. 2013, 11, 192. [Google Scholar] [CrossRef]
- Gea, A.; Martinez-Gonzalez, M.A.; Toledo, E.; Sanchez-Villegas, A.; Bes-Rastrollo, M.; Nuñez-Cordoba, J.M.; Sayon-Orea, C.; Beunza, J.J. A longitudinal assessment of alcohol intake and incident depression: The SUN project. BMC Public Health 2012, 12, 954. [Google Scholar] [CrossRef]
- García-Esquinas, E.; Ortolá, R.; Galán, I.; Soler-Vila, H.; Laclaustra, M.; Rodríguez-Artalejo, F. Moderate alcohol drinking is not associated with risk of depression in older adults. Sci. Rep. 2018, 8, 11512. [Google Scholar] [CrossRef]
- Révész, D.; Bours, M.J.L.; Wegdam, J.A.; Keulen, E.T.P.; Breukink, S.O.; Slooter, G.D.; Vogelaar, F.J.; Weijenberg, M.P.; Mols, F. Associations between alcohol consumption and anxiety, depression, and health-related quality of life in colorectal cancer survivors. J. Cancer Surviv. 2022, 16, 988–997. [Google Scholar] [CrossRef]
- Révész, D.; Bours, M.J.L.; Weijenberg, M.P.; Mols, F. Longitudinal Associations of Former and Current Alcohol Consumption with Psychosocial Outcomes among Colorectal Cancer Survivors 1–15 Years after Diagnosis. Nutr. Cancer 2022, 74, 3109–3117. [Google Scholar] [CrossRef]
- Cosmi, F.; Di Giulio, P.; Masson, S.; Finzi, A.; Marfisi, R.M.; Cosmi, D.; Scarano, M.; Tognoni, G.; Maggioni, A.P.; Porcu, M.; et al. Regular wine consumption in chronic heart failure: Impact on outcomes, quality of life, and circulating biomarkers. Circ. Heart Fail. 2015, 8, 428–437. [Google Scholar] [CrossRef]
- Platania, A.; Castiglione, D.; Sinatra, D.; Urso, M.D.; Marranzano, M. Fluid Intake and Beverage Consumption Description and Their Association with Dietary Vitamins and Antioxidant Compounds in Italian Adults from the Mediterranean Healthy Eating, Aging and Lifestyles (MEAL) Study. Antioxidants 2018, 7, 56. [Google Scholar] [CrossRef] [PubMed]
- Godos, J.; Pluchinotta, F.R.; Marventano, S.; Buscemi, S.; Li Volti, G.; Galvano, F.; Grosso, G. Coffee components and cardiovascular risk: Beneficial and detrimental effects. Int. J. Food Sci. Nutr. 2014, 65, 925–936. [Google Scholar] [CrossRef] [PubMed]
- Khan, N.; Mukhtar, H. Tea polyphenols in promotion of human health. Nutrients 2018, 11, 39. [Google Scholar] [CrossRef] [PubMed]
- Tian, B.; Liu, J. Resveratrol: A review of plant sources, synthesis, stability, modification and food application. J. Sci. Food Agric. 2020, 100, 1392–1404. [Google Scholar] [CrossRef] [PubMed]
- Caruso, G.; Torrisi, S.A.; Mogavero, M.P.; Currenti, W.; Castellano, S.; Godos, J.; Ferri, R.; Galvano, F.; Leggio, G.M.; Grosso, G.; et al. Polyphenols and neuroprotection: Therapeutic implications for cognitive decline. Pharmacol. Ther. 2022, 232, 108013. [Google Scholar] [CrossRef]
- Hall, S.; Desbrow, B.; Anoopkumar-Dukie, S.; Davey, A.K.; Arora, D.; McDermott, C.; Schubert, M.M.; Perkins, A.V.; Kiefel, M.J.; Grant, G.D. A review of the bioactivity of coffee, caffeine and key coffee constituents on inflammatory responses linked to depression. Food Res. Int. 2015, 76, 626–636. [Google Scholar] [CrossRef]
- Rothenberg, D.O.; Zhang, L. Mechanisms Underlying the Anti-Depressive Effects of Regular Tea Consumption. Nutrients 2019, 11, 1361. [Google Scholar] [CrossRef]
- Moore, A.; Beidler, J.; Hong, M.Y. Resveratrol and depression in animal models: A systematic review of the biological mechanisms. Molecules 2018, 23, 2197. [Google Scholar] [CrossRef]
- van der Merwe, M. Gut microbiome changes induced by a diet rich in fruits and vegetables. Int. J. Food Sci. Nutr. 2021, 72, 665–669. [Google Scholar] [CrossRef]
- Chen, K.; Zhao, H.; Shu, L.; Xing, H.; Wang, C.; Lu, C.; Song, G. Effect of resveratrol on intestinal tight junction proteins and the gut microbiome in high-fat diet-fed insulin resistant mice. Int. J. Food Sci. Nutr. 2020, 71, 965–978. [Google Scholar] [CrossRef]
- Mena, P.; Bresciani, L. Dietary fibre modifies gut microbiota: What’s the role of (poly)phenols? Int. J. Food Sci. Nutr. 2020, 71, 783–784. [Google Scholar] [CrossRef] [PubMed]
- Moco, S.; Martin, F.-P.J.; Rezzi, S. Metabolomics view on gut microbiome modulation by polyphenol-rich foods. J. Proteome Res. 2012, 11, 4781–4790. [Google Scholar] [CrossRef]
- Nehlig, A. Effects of Coffee on the Gastro-Intestinal Tract: A Narrative Review and Literature Update. Nutrients 2022, 14, 399. [Google Scholar] [CrossRef] [PubMed]
- Sun, Q.; Cheng, L.; Zhang, X.; Wu, Z.; Weng, P. The interaction between tea polyphenols and host intestinal microorganisms: An effective way to prevent psychiatric disorders. Food Funct. 2021, 12, 952–962. [Google Scholar] [CrossRef] [PubMed]
- Zorraquín, I.; Sánchez-Hernández, E.; Ayuda-Durán, B.; Silva, M.; González-Paramás, A.M.; Santos-Buelga, C.; Moreno-Arribas, M.V.; Bartolomé, B. Current and future experimental approaches in the study of grape and wine polyphenols interacting gut microbiota. J. Sci. Food Agric. 2020, 100, 3789–3802. [Google Scholar] [CrossRef]
- Repossi, G.; Das, U.N.; Eynard, A.R. Molecular basis of the beneficial actions of resveratrol. Arch. Med. Res. 2020, 51, 105–114. [Google Scholar] [CrossRef]
- Zhang, Z.; Zhang, Y.; Li, J.; Fu, C.; Zhang, X. The neuroprotective effect of tea polyphenols on the regulation of intestinal flora. Molecules 2021, 26, 3692. [Google Scholar] [CrossRef]
- Iriondo-DeHond, A.; Uranga, J.A.; Del Castillo, M.D.; Abalo, R. Effects of Coffee and Its Components on the Gastrointestinal Tract and the Brain-Gut Axis. Nutrients 2020, 13, 88. [Google Scholar] [CrossRef]
- Chung, J.Y.; Jeong, J.-H.; Song, J. Resveratrol Modulates the Gut-Brain Axis: Focus on Glucagon-Like Peptide-1, 5-HT, and Gut Microbiota. Front. Aging Neurosci. 2020, 12, 588044. [Google Scholar] [CrossRef]
- Mills, C.E.; Tzounis, X.; Oruna-Concha, M.-J.; Mottram, D.S.; Gibson, G.R.; Spencer, J.P.E. In vitro colonic metabolism of coffee and chlorogenic acid results in selective changes in human faecal microbiota growth. Br. J. Nutr. 2015, 113, 1220–1227. [Google Scholar] [CrossRef]
- Calderón-Pérez, L.; Llauradó, E.; Companys, J.; Pla-Pagà, L.; Pedret, A.; Rubió, L.; Gosalbes, M.J.; Yuste, S.; Solà, R.; Valls, R.M. Interplay between dietary phenolic compound intake and the human gut microbiome in hypertension: A cross-sectional study. Food Chem. 2021, 344, 128567. [Google Scholar] [CrossRef] [PubMed]
- Moreno-Indias, I.; Sánchez-Alcoholado, L.; Pérez-Martínez, P.; Andrés-Lacueva, C.; Cardona, F.; Tinahones, F.; Queipo-Ortuño, M.I. Red wine polyphenols modulate fecal microbiota and reduce markers of the metabolic syndrome in obese patients. Food Funct. 2016, 7, 1775–1787. [Google Scholar] [CrossRef] [PubMed]
- Nash, V.; Ranadheera, C.S.; Georgousopoulou, E.N.; Mellor, D.D.; Panagiotakos, D.B.; McKune, A.J.; Kellett, J.; Naumovski, N. The effects of grape and red wine polyphenols on gut microbiota—A systematic review. Food Res. Int. 2018, 113, 277–287. [Google Scholar] [CrossRef] [PubMed]
- Li, J.; Chen, C.; Yang, H.; Yang, X. Tea polyphenols regulate gut microbiota dysbiosis induced by antibiotic in mice. Food Res. Int. 2021, 141, 110153. [Google Scholar] [CrossRef]
- Cheng, M.; Zhang, X.; Miao, Y.; Cao, J.; Wu, Z.; Weng, P. The modulatory effect of (-)-epigallocatechin 3-O-(3-O-methyl) gallate (EGCG3″Me) on intestinal microbiota of high fat diet-induced obesity mice model. Food Res. Int. 2017, 92, 9–16. [Google Scholar] [CrossRef]
- van de Wouw, M.; Boehme, M.; Lyte, J.M.; Wiley, N.; Strain, C.; O’Sullivan, O.; Clarke, G.; Stanton, C.; Dinan, T.G.; Cryan, J.F. Short-chain fatty acids: Microbial metabolites that alleviate stress-induced brain-gut axis alterations. J. Physiol. 2018, 596, 4923–4944. [Google Scholar] [CrossRef]
- Tang, C.-F.; Wang, C.-Y.; Wang, J.-H.; Wang, Q.-N.; Li, S.-J.; Wang, H.-O.; Zhou, F.; Li, J.-M. Short-Chain Fatty Acids Ameliorate Depressive-like Behaviors of High Fructose-Fed Mice by Rescuing Hippocampal Neurogenesis Decline and Blood-Brain Barrier Damage. Nutrients 2022, 14, 1882. [Google Scholar] [CrossRef]


Disclaimer/Publisher’s Note: The statements, opinions and data contained in all publications are solely those of the individual author(s) and contributor(s) and not of MDPI and/or the editor(s). MDPI and/or the editor(s) disclaim responsibility for any injury to people or property resulting from any ideas, methods, instructions or products referred to in the content. |
© 2023 by the authors. Licensee MDPI, Basel, Switzerland. This article is an open access article distributed under the terms and conditions of the Creative Commons Attribution (CC BY) license (https://creativecommons.org/licenses/by/4.0/).