
Metabolite Profiling of Microwave-Assisted Sargassum fusiforme Extracts with Improved Antioxidant Activity Using Hybrid Response Surface Methodology and Artificial Neural Networking-Genetic Algorithm
 , , , and
Abstract
:1. Introduction
2. Materials and Methods
2.1. Chemicals and Reagents
2.2. Sample Collection and Preparation
2.3. MAE Procedure
2.4. Antioxidant Activities
2.5. Statistical Modeling and Data Calculation
2.5.1. Response Surface Methodology (RSM)
2.5.2. ANN
2.6. Process Optimization Using RSM-GA, ANN-GA and RSM-DF
2.7. Cell Viability Assay
2.8. Intracellular Reactive Oxygen Species (ROS) Measurement
2.9. Western Blotting and Cell Lysate Preparation
2.10. Compounds Identification Using ESI-MS/MS
2.11. Data Processing
2.12. Statistical Analysis
3. Results and Discussion
3.1. RSM Modeling
3.1.1. Effect of MAE-SF Parameters on DPPH and ABTS
3.1.2. Effect of MAE-SF Parameters on TPC and TFC
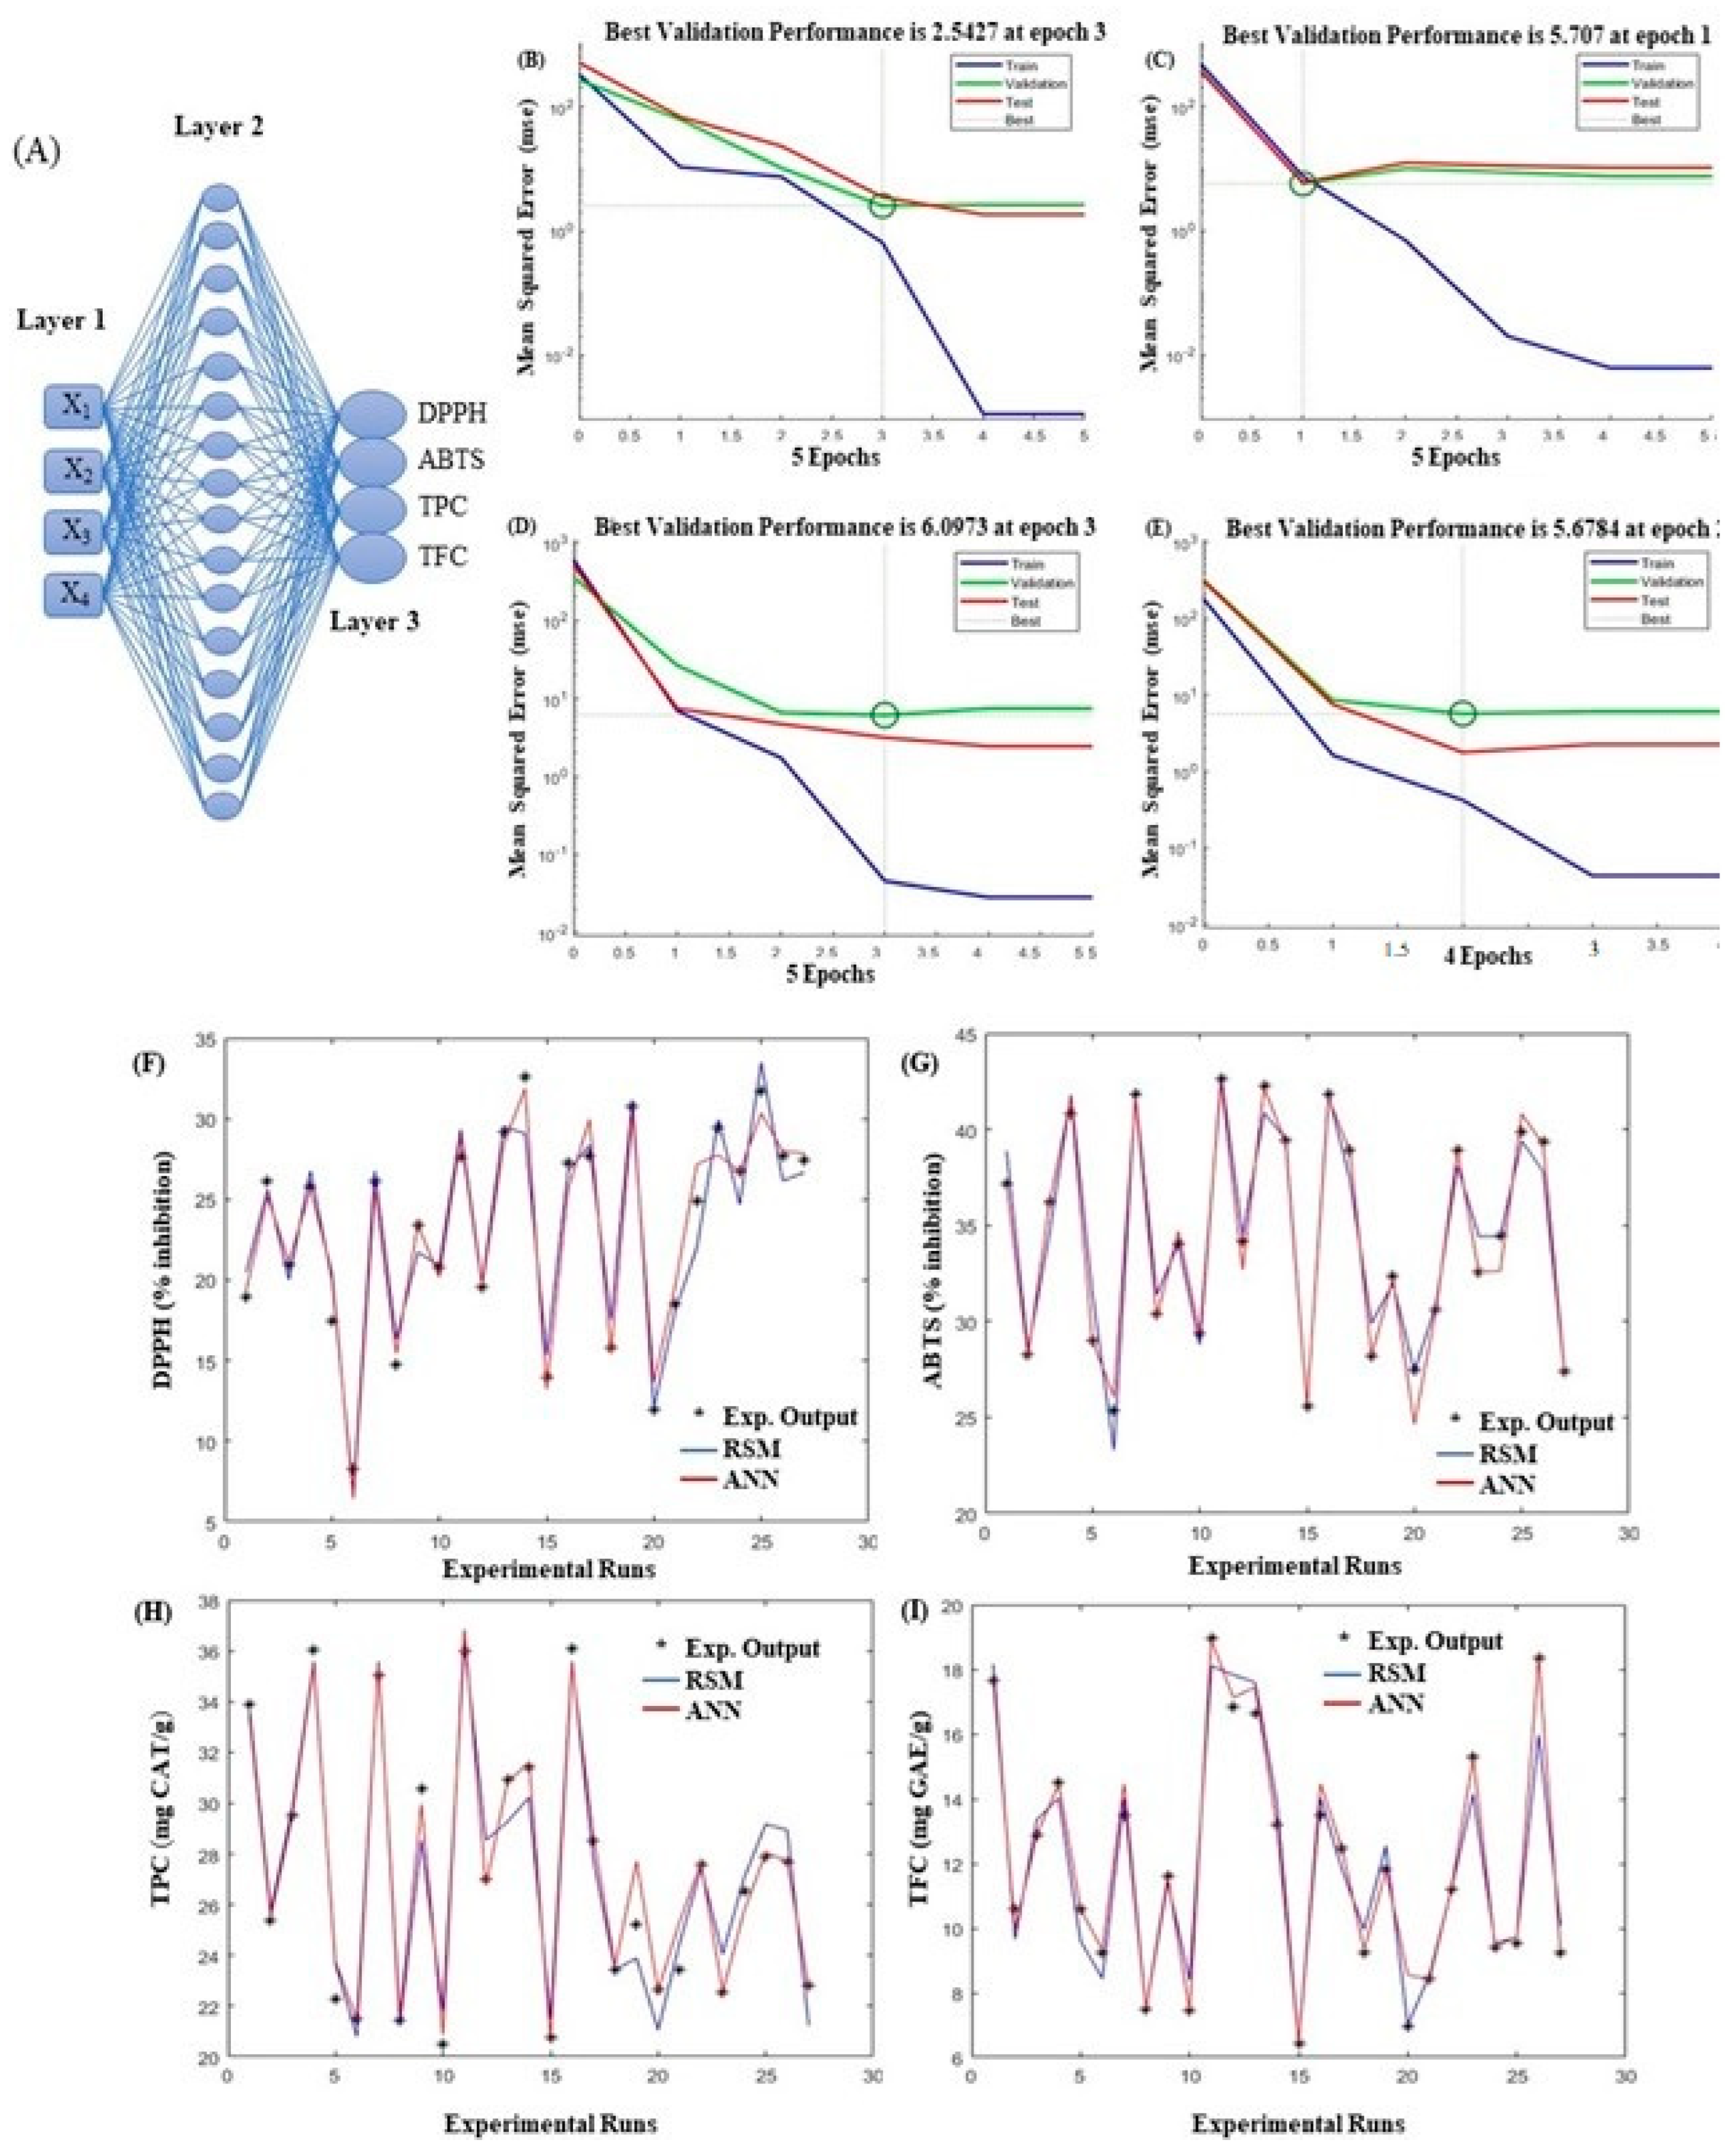
3.2. ANN Modeling
3.3. Process Optimization and Model Validation
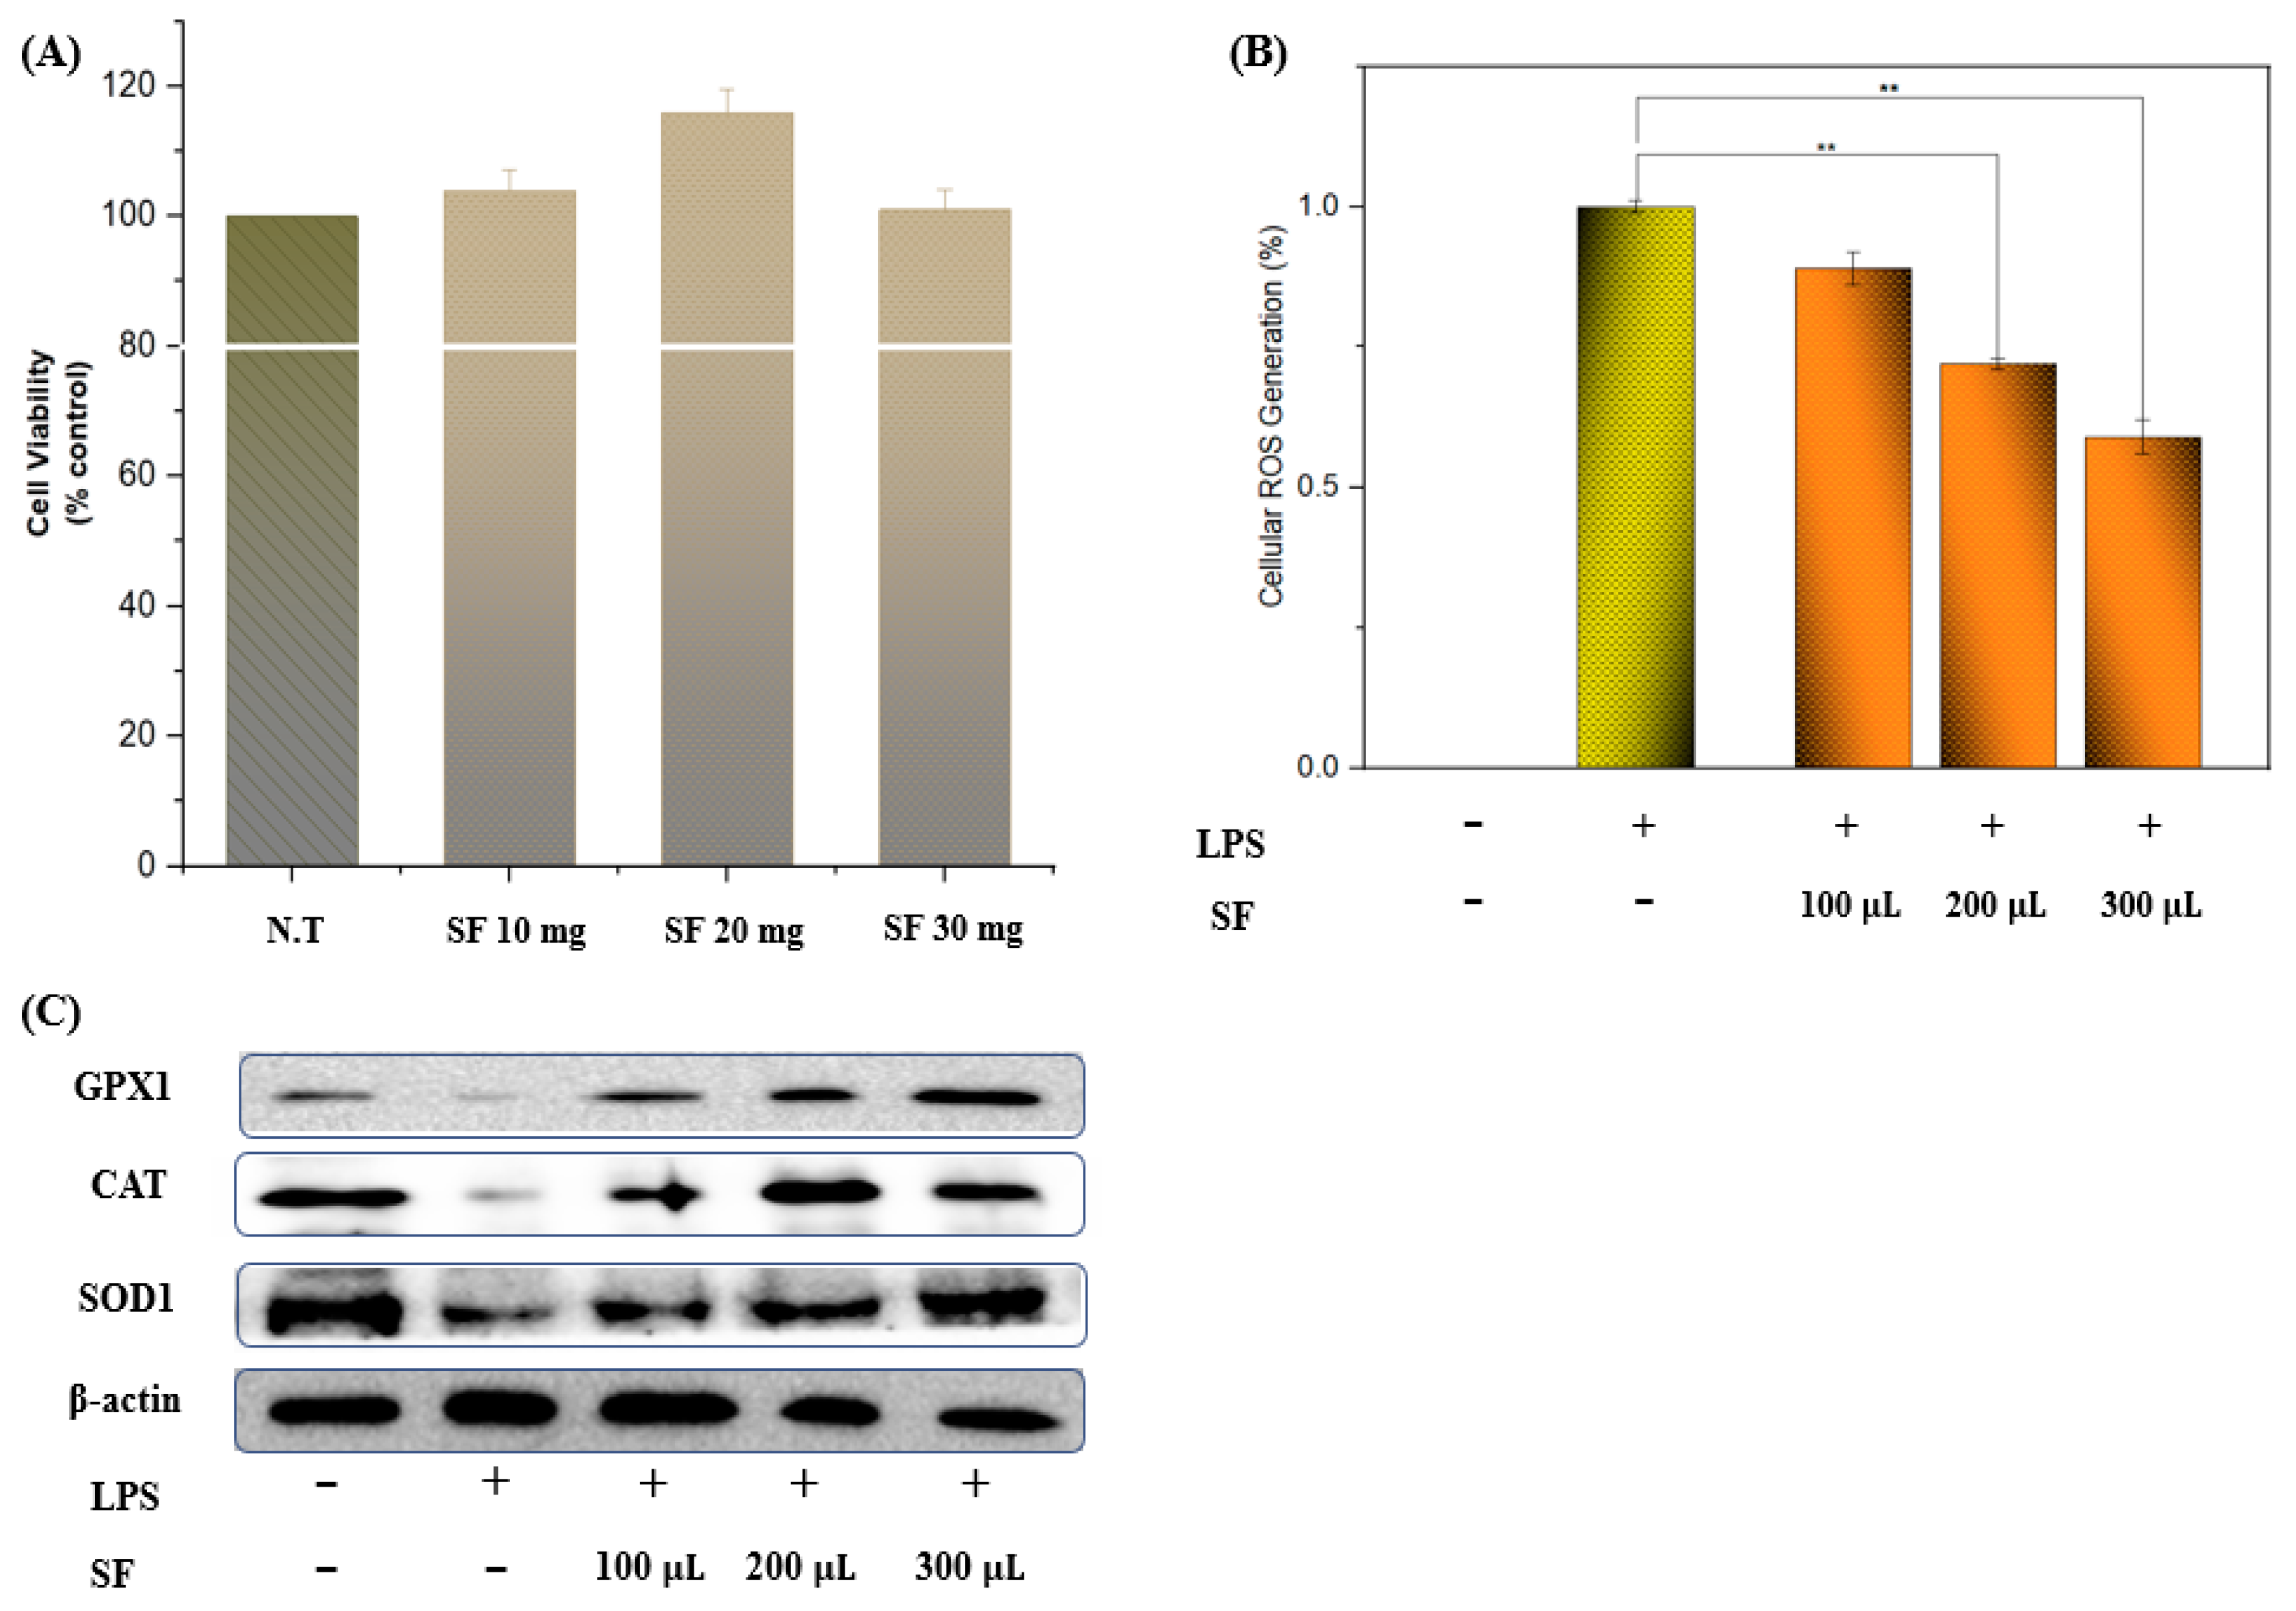
3.4. Cell Viability, ROS Scavenging, and Antioxidant Enzyme Activity
3.5. Metabolite Profiling of SF Extracts Using High-Resolution LC-MS/MS
3.5.1. Phenolic Acids
3.5.2. Flavonoids
3.5.3. Tannins and Terpenoids
3.5.4. Carboxylic Acid, Fatty Acids, Sugars, and Amino Acids
4. Conclusions
Supplementary Materials
Author Contributions
Funding
Institutional Review Board Statement
Informed Consent Statement
Data Availability Statement
Acknowledgments
Conflicts of Interest
Abbreviations
References
- Saeed, F.; Afzaal, M.; Niaz, B.; Arshad, M.U.; Tufail, T.; Hussain, M.B.; Javed, A. Bitter melon (Momordica charantia): A natural healthy vegetable. Int. J. Food Prop. 2018, 21, 1270–1290. [Google Scholar] [CrossRef] [Green Version]
- Sanjeewa, K.K.A.; Kim, E.A.; Son, K.T.; Jeon, Y.J. Bioactive properties and potentials cosmeceutical applications of phlorotannins isolated from brown seaweeds: A review. J. Photochem. Photobiol. B Biol. 2016, 162, 100–105. [Google Scholar] [CrossRef]
- Cong, Q.; Chen, H.; Liao, W.; Xiao, F.; Wang, P.; Qin, Y.; Dong, Q.; Ding, K. Structural characterization and effect on anti-angiogenic activity of a fucoidan from Sargassum fusiforme. Carbohydr. Polym. 2016, 136, 899–907. [Google Scholar] [CrossRef] [PubMed]
- Shojaei, F.; Homaei, A.; Taherizadeh, M.R.; Kamrani, E. Characterization of biosynthesized chitosan nanoparticles from Penaeus vannamei for the immobilization of P. vannamei protease: An eco-friendly nanobiocatalyst. Int. J. Food Prop. 2017, 20, 1413–1423. [Google Scholar] [CrossRef] [Green Version]
- Javed, A.; Hussain, M.B.; Tahir, A.; Waheed, M.; Anwar, A.; Shariati, M.A.; Plygun, S.; Laishevtcev, A.; Pasalar, M. Pharmacological applications of phlorotannins: A comprehensive review. Curr. Drug Discov. Technol. 2020, 18, 282–292. [Google Scholar] [CrossRef] [PubMed]
- Simić, V.M.; Rajković, K.M.; Stojičević, S.S.; Veličković, D.T.; Nikolić, N.; Lazić, M.L.; Karabegović, I.T. Optimization of microwave-assisted extraction of total polyphenolic compounds from chokeberries by response surface methodology and artificial neural network. Sep. Purif. Technol. 2016, 160, 89–97. [Google Scholar] [CrossRef]
- Moslemi, M.; Homaei, A.; Toiserkani, H. Aspartic acid introduce the functional amine groups on the surface of superparamagnetic Fe(OH)3@Fe3O4 nanoparticles for efficient immobilization of Penaeus vannamei protease. Bioprocess Biosyst. Eng. 2018, 41, 749–756. [Google Scholar] [CrossRef]
- Ranjbari, N.; Razzaghi, M.; Fernandez-Lafuente, R.; Shojaei, F.; Satari, M.; Homaei, A. Improved features of a highly stable protease from Penaeus vannamei by immobilization on glutaraldehyde activated graphene oxide nanosheets. Int. J. Biol. Macromol. 2019, 130, 564–572. [Google Scholar] [CrossRef]
- Kashyap, P.; Riar, C.S.; Jindal, N. Optimization of ultrasound assisted extraction of polyphenols from Meghalayan cherry fruit (Prunus nepalensis) using response surface methodology (RSM) and artificial neural network (ANN) approach. J. Food Meas. Charact. 2021, 15, 119–133. [Google Scholar] [CrossRef]
- Patra, A.; Abdullah, S.; Pradhan, R.C. Optimization of ultrasound-assisted extraction of ascorbic acid, protein and total antioxidants from cashew apple bagasse using artificial neural network-genetic algorithm and response surface methodology. J. Food Process. Preserv. 2022, 46, e16317. [Google Scholar] [CrossRef]
- Liazid, A.; Schwarz, M.; Varela, R.M.; Palma, M.; Guillén, D.A.; Brigui, J.; Macías, F.A.; Barroso, C.G. Evaluation of various extraction techniques for obtaining bioactive extracts from pine seeds. Food Bioprod. Process. 2010, 88, 247–252. [Google Scholar] [CrossRef]
- Ghafoor, K.; Park, J.; Choi, Y.H. Optimization of supercritical fluid extraction of bioactive compounds from grape (Vitis labrusca B.) peel by using response surface methodology. Innov. Food Sci. Emerg. Technol. 2010, 11, 485–490. [Google Scholar] [CrossRef]
- Ballard, T.S.; Mallikarjunan, P.; Zhou, K.; O’Keefe, S. Microwave-assisted extraction of phenolic antioxidant compounds from peanut skins. Food Chem. 2010, 120, 1185–1192. [Google Scholar] [CrossRef]
- Li, Y.; Skouroumounis, G.K.; Elsey, G.M.; Taylor, D.K. Microwave-assistance provides very rapid and efficient extraction of grape seed polyphenols. Food Chem. 2011, 129, 570–576. [Google Scholar] [CrossRef] [PubMed]
- Razzaghi, M.; Homaei, A.; Mosaddegh, E. Penaeus vannamei protease stabilizing process of ZnS nanoparticles. Int. J. Biol. Macromol. 2018, 112, 509–515. [Google Scholar] [CrossRef]
- Wen, Y.; Chen, H.; Zhou, X.; Deng, Q.; Zhao, Y.; Zhao, C.; Gong, X. Optimization of the microwave-assisted extraction and antioxidant activities of anthocyanins from blackberry using a response surface methodology. RSC Adv. 2015, 5, 19686–19695. [Google Scholar] [CrossRef]
- Musa, K.H.; Abdullah, A.; Al-Haiqi, A. Determination of DPPH free radical scavenging activity: Application of artificial neural networks. Food Chem. 2016, 194, 705–711. [Google Scholar] [CrossRef]
- Fu, Z.; Li, H.; Liu, H.; Hu, S.; Li, Y.; Wang, M.; Guan, H. Bioassay-guided extraction of crude fucose-containing sulphated polysaccharides from Sargassum fusiforme with response surface methodology. J. Ocean Univ. China 2016, 15, 533–540. [Google Scholar] [CrossRef]
- Li, Y.; Fu, X.; Duan, D.; Liu, X.; Xu, J.; Gao, X. Extraction and identification of phlorotannins from the brown alga, Sargassum fusiforme (Harvey) Setchell. Mar. Drugs 2017, 15, 49. [Google Scholar] [CrossRef] [Green Version]
- Ameer, K.; Bae, S.W.; Jo, Y.; Lee, H.G.; Ameer, A.; Kwon, J.H. Optimization of microwave-assisted extraction of total extract, stevioside and rebaudioside-A from Stevia rebaudiana (Bertoni) leaves, using response surface methodology (RSM) and artificial neural network (ANN) modelling. Food Chem. 2017, 229, 198–207. [Google Scholar] [CrossRef]
- Choi, H.J.; Naznin, M.; Alam, M.B.; Javed, A.; Alshammari, F.H.; Kim, S.; Lee, S.-H. Optimization of the extraction conditions of Nypa fruticans Wurmb. using response surface methodology and artificial neural network. Food Chem. 2022, 381, 132086. [Google Scholar] [CrossRef] [PubMed]
- Alam, M.B.; Ju, M.K.; Lee, S.-H. DNA protecting activities of Nymphaea nouchali (Burm. f) flower extract attenuate t-BHP-induced oxidative stress cell death through Nrf2-mediated induction of heme oxygenase-1 expression by activating MAP-kinases. Int. J. Mol. Sci. 2017, 18, 2069. [Google Scholar] [CrossRef] [Green Version]
- Ahmad, A.; Lajis, M.A.; Yusuf, N.K.; Ab Rahim, S.N. Statistical optimization by the response surface methodology of direct recycled aluminum-alumina metal matrix composite (MMC-AlR) employing the metal forming process. Processes 2020, 8, 805. [Google Scholar] [CrossRef]
- Jovanović, M.; Mudrić, J.; Drinić, Z.; Matejić, J.; Kitić, D.; Bigović, D.; Šavikin, K. Optimization of ultrasound-assisted extraction of bitter compounds and polyphenols from willow gentian underground parts. Sep. Purif. Technol. 2022, 281, 119868. [Google Scholar] [CrossRef]
- Kundu, P.; Paul, V.; Kumar, V.; Mishra, I.M. Formulation development, modelling and optimization of emulsification process using evolving RSM coupled hybrid ANN-GA framework. Chem. Eng. Res. Des. 2015, 104, 773–790. [Google Scholar] [CrossRef]
- Ameer, K.; Ameer, S.; Kim, Y.-M.; Nadeem, M.; Park, M.-K.; Murtaza, M.A.; Khan, M.A.; Nasir, M.A.; Mueen-ud-Din, G.; Mahmood, S.; et al. A hybrid RSM-ANN-GA approach on optimization of ultrasound-assisted extraction conditions for bioactive component-rich Stevia rebaudiana (Bertoni) leaves extract. Foods 2022, 11, 883. [Google Scholar] [CrossRef]
- Alam, M.B.; Ju, M.K.; Kwon, Y.G.; Lee, S.-H. Protopine attenuates inflammation stimulated by carrageenan and LPS via the MAPK/NF-κB pathway. Food Chem. Toxicol. 2019, 131, 110583. [Google Scholar] [CrossRef] [PubMed]
- Alam, M.B.; Kwon, K.R.; Lee, S.H.; Lee, S.-H. Lannea coromandelica (Houtt.) Merr. induces heme oxygenase 1 (HO-1) expression and reduces oxidative stress via the p38/c-Jun N-terminal kinase-nuclear factor erythroid 2-related factor 2 (p38/JNK-NRF2)-mediated antioxidant pathway. Int. J. Mol. Sci. 2017, 18, 266. [Google Scholar] [CrossRef] [Green Version]
- Alam, M.B.; Ra, J.S.; Lim, J.Y.; Song, B.R.; Javed, A.; Lee, S.-H. Lariciresinol displays anti-diabetic activity through inhibition of α-glucosidase and activation and enhancement of insulin signalling. Mol. Nutr. Food Res. 2022, 66, e2100751. [Google Scholar] [CrossRef]
- Alam, M.B.; Ahmed, A.; Islam, S.; Choi, H.J.; Motin, M.A.; Kim, S.; Lee, S.-H. Phytochemical characterization of Dillenia indica L. bark by paper spray ionization-mass spectrometry and evaluation of its antioxidant potential against t-BHP-induced oxidative stress in RAW 264.7 cells. Antioxidants 2020, 9, 1099. [Google Scholar] [CrossRef]
- Medina-Franco, J.L.; Naveja, J.J.; Rico-Hidalgo, M.P. Analysis of a large food chemical database: Chemical space, diversity, and complexity. F1000Research 2018, 7, 993. [Google Scholar] [CrossRef] [Green Version]
- Guijas, C.; Montenegro-Burke, J.R.; Domingo-Almenara, X.; Palermo, A.; Warth, B.; Hermann, G.; Koellensperger, G.; Huan, T.; Uritboonthai, W.; Aisporna, A.E.; et al. METLIN: A technology platform for identifying knowns and unknowns. Anal. Chem. 2018, 90, 3156–3164. [Google Scholar] [CrossRef] [PubMed] [Green Version]
- Wang, F.; Liigand, J.; Tian, S.; Arndt, D.; Greiner, R.; Wishart, D.S. CFM-ID 4.0: More accurate ESI-MS/MS spectral prediction and compound identification. Anal. Chem. 2021, 93, 11692–11700. [Google Scholar] [CrossRef] [PubMed]
- Lahiri, S.K.; Ghanta, K.C. Artificial neural network model with the parameter tuning assisted by a differential evolution technique: The study of the hold-up of the slurry flow in a pipeline. Chem. Ind. Chem. Eng. Q. 2009, 15, 103–117. [Google Scholar] [CrossRef]
- Wang, L.; Yong, R.C.; Lee, H.-G.; Fu, X.; Wang, K.; Xu, J.; Gao, X.; Jeon, Y.-J. Fucoidan isolated from fermented Sargassum fusiforme suppresses oxidative stress through stimulating the expression of superoxidase dismutase and catalase by regulating Nrf2 signalling pathway. Int. J. Biol. Macromol. 2022, 209, 935–941. [Google Scholar] [CrossRef] [PubMed]
- Ostrowski, W.; Wojakowska, A.; Grajzer, M.; Stobiecki, M. Mass spectrometric behaviour of phenolic acids standards and their analysis in the plant samples with LC/ESI/MS system. J. Chromatogr. B Anal. Technol. Biomed. Life Sci. 2014, 967, 21–27. [Google Scholar] [CrossRef] [PubMed]
- Yang, L.; Jia, P.; Li, Q.; Wang, S.; Wang, J.; Bai, Y.; Wang, X.; Xiao, C.; Yu, J.; Zhang, P.; et al. Identification of metabolites of isopropyl 3-(3,4-dihydroxyphenyl)-2-hydroxypropanoate in rats by high-performance liquid chromatography combined with electrospray ionization quadrupole time-of-flight tandem mass spectrometry. Biomed. Chromatogr. 2016, 30, 1042–1051. [Google Scholar] [CrossRef]
- Zhong, B.; Robinson, N.A.; Warner, R.D.; Barrow, C.J.; Dunshea, F.R.; Suleria, H.A.R. LC-ESI-QTOF-MS/MS characterization of seaweed phenolics and their antioxidant potential. Mar. Drugs 2020, 18, 331. [Google Scholar] [CrossRef]
- Salehi, B.; Fokou, P.V.T.; Sharifi-Rad, M.; Zucca, P.; Pezzani, R.; Martins, N.; Sharifi-Rad, J. The therapeutic potential of naringenin: A review of clinical trials. Pharmaceuticals 2019, 12, 11. [Google Scholar] [CrossRef] [Green Version]
- Kim, S.Y.; Ahn, G.; Kim, H.S.; Je, J.G.; Kim, K.N.; Jeon, Y.J. Diphlorethohydroxycarmalol (DPHC) isolated from the brown alga Ishige okamurae acts on inflammatory myopathy as an inhibitory agent of TNF-α. Mar. Drugs 2020, 18, 529. [Google Scholar] [CrossRef]
- Park, C.; Lee, H.; Hong, S.H.; Kim, J.H.; Park, S.K.; Jeong, J.W.; Kim, G.Y.; Hyun, J.W.; Yun, S.J.; Kim, B.W.; et al. Protective effect of diphlorethohydroxycarmalol against oxidative stress-induced DNA damage and apoptosis in retinal pigment epithelial cells. Cutan. Ocul. Toxicol. 2019, 38, 298–308. [Google Scholar] [CrossRef] [PubMed]
- Allwood, J.W.; Evans, H.; Austin, C.; McDougall, G.J. Extraction, enrichment, and LC-MSn-based characterization of phlorotannins and related phenolics from the brown seaweed, Ascophyllum nodosum. Mar. Drugs 2020, 18, 448. [Google Scholar] [CrossRef] [PubMed]
- Vissers, A.M.; Caligiani, A.; Sforza, S.; Vincken, J.P.; Gruppen, H. Phlorotannin Composition of Laminaria digitata. Phytochem. Anal. 2017, 28, 487–495. [Google Scholar] [CrossRef] [PubMed] [Green Version]
- Wagle, A.; Seong, S.H.; Zhao, B.T.; Woo, M.H.; Jung, H.A.; Choi, J.S. Comparative study of selective in vitro and in silico BACE1 inhibitory potential of glycyrrhizin together with its metabolites, 18α- and 18β-glycyrrhetinic acid, isolated from Hizikia fusiformis. Arch. Pharm. Res. 2018, 41, 409–418. [Google Scholar] [CrossRef]
- Wang, S.Y.; Xiang, J.; Wang, Y.M.; Wei, X.; Feng, C.; Fan, Q.; Zhang, C.X. Study on chemical constituents from whole herbs of Sargassum fusiforme. Chin. Tradit. Herb. Drugs 2019, 50, 5670–5676. [Google Scholar] [CrossRef]
- Shanura-Fernando, I.P.; Kim, M.; Son, K.T.; Jeong, Y.; Jeon, Y.J. Antioxidant activity of marine algal polyphenolic compounds: A mechanistic approach. J. Med. Food 2016, 19, 615–628. [Google Scholar] [CrossRef]
- Grina, F.; Ullah, Z.; Kaplaner, E.; Moujahid, A.; Eddoha, R.; Nasser, B.; Terzioğlu, P.; Yilmaz, M.A.; Ertaş, A.; Öztürk, M.; et al. In vitro enzyme inhibitory properties, antioxidant activities, and phytochemical fingerprints of five Moroccan seaweeds. S. Afr. J. Bot. 2020, 128, 152–160. [Google Scholar] [CrossRef]
- Jørgensen, K.; Olesen, P.T. Kainic acid in the seaweed Palmaria palmata (dulse). Food Addit. Contam. Part B Surveill. 2018, 11, 198–200. [Google Scholar] [CrossRef] [Green Version]
- Maheswari, M.U.; Reena, A. Phytochemical profiling of the red seaweed, Halymenia dilatata by GC-MS analysis. Int. J. Pharm. Sci. Res. 2017, 8, 167–172. [Google Scholar]
- Pereira, A.G.; Fraga-Corral, M.; Garcia-Oliveira, P.; Lourenço-Lopes, C.; Carpena, M.; Prieto, M.A.; Simal-Gandara, J. The use of invasive algae species as a source of secondary metabolites and biological activities: Spain as case-study. Mar. Drugs 2021, 19, 178. [Google Scholar] [CrossRef]
- El-Sheekh, M.M.; El-Shenody, R.A.E.K.; Bases, E.A.; El Shafay, S.M. Comparative assessment of antioxidant activity and biochemical composition of four seaweeds, rocky bay of Abu Qir in Alexandria, Egypt. Food Sci. Technol. 2021, 41, 29–40. [Google Scholar] [CrossRef]
- King, J.M.; Muthian, G.; MacKey, V.; Smith, M.; Charlton, C. L-Dihydroxyphenylalanine modulates the steady-state expression of mouse striatal tyrosine hydroxylase, aromatic L-amino acid decarboxylase, dopamine and its metabolites in an MPTP mouse model of Parkinson’s disease. Life Sci. 2011, 89, 638–643. [Google Scholar] [CrossRef] [PubMed]


| Run No | Parameter | DPPH (% Inhibition) | ABTS (% Inhibition) | TPC (mg GAE/g) | TFC (mg CAE/g) | |||||||||||
|---|---|---|---|---|---|---|---|---|---|---|---|---|---|---|---|---|
| X1 (%) | X2 (min) | X3 (°C) | X4 (W) | Experimental Value | RSM Predicted | ANN Predicted | Experimental Value | RSM Predicted | ANN Predicted | Experimental Value | RSM Predicted | ANN Predicted | Experimental Value | RSM Predicted | ANN Predicted | |
| 1 | 70 | 4 | 140 | 600 | 18.94 ± 2.98 | 20.34 | 19.30 | 37.14 ± 0.54 | 38.87 | 37.08 | 33.88 ± 0.62 | 33.77 | 33.45 | 17.67 ± 0.16 | 18.15 | 17.68 |
| 2 | 50 | 3 | 130 | 150 | 26.13 ± 3.12 | 25.84 | 25.15 | 28.30 ± 2.13 | 28.51 | 28.20 | 25.40 ± 0.62 | 25.78 | 25.51 | 10.61 ± 0.44 | 9.67 | 9.96 |
| 3 | 30 | 2 | 110 | 300 | 20.95 ± 1.12 | 19.89 | 21.13 | 36.25 ± 1.87 | 34.58 | 36.20 | 29.55 ± 0.17 | 29.80 | 29.51 | 12.89 ± 0.65 | 13.36 | 12.90 |
| 4 | 50 | 3 | 130 | 450 | 25.75 ± 2.98 | 26.79 | 25.62 | 40.83 ± 1.35 | 41.80 | 41.61 | 36.02 ± 2.15 | 35.58 | 35.44 | 14.49 ± 0.16 | 14.03 | 14.47 |
| 5 | 10 | 3 | 130 | 450 | 17.42 ± 1.29 | 19.86 | 20.49 | 29.00 ± 2.34 | 31.46 | 28.96 | 22.29 ± 0.17 | 23.68 | 23.76 | 10.61 ± 0.33 | 9.61 | 10.60 |
| 6 | 90 | 3 | 130 | 450 | 7.31 ± 1.61 | 6.39 | 6.43 | 25.36 ± 1.77 | 23.30 | 26.08 | 21.50 ± 1.24 | 20.81 | 21.49 | 9.23 ± 0.42 | 8.45 | 9.33 |
| 7 | 50 | 3 | 130 | 450 | 26.13 ± 2.35 | 26.79 | 25.62 | 41.83 ± 1.35 | 41.80 | 41.61 | 35.05 ± 0.79 | 35.58 | 35.44 | 13.49 ± 0.95 | 14.03 | 14.47 |
| 8 | 50 | 3 | 90 | 450 | 14.76 ± 1.64 | 16.51 | 15.45 | 30.37 ± 1.51 | 31.39 | 30.26 | 21.44 ± 1.37 | 21.26 | 21.60 | 7.50 ± 0.75 | 7.50 | 7.51 |
| 9 | 30 | 4 | 110 | 300 | 23.39 ± 2.41 | 21.79 | 23.45 | 34.01 ± 2.07 | 34.03 | 34.68 | 30.55 ± 0.75 | 28.52 | 29.96 | 11.61 ± 0.88 | 11.42 | 11.60 |
| 10 | 30 | 4 | 140 | 300 | 20.76 ± 2.32 | 21.00 | 20.18 | 29.40 ± 3.70 | 28.78 | 29.39 | 20.48 ± 1.72 | 21.83 | 20.88 | 7.45 ± 0.65 | 8.40 | 7.44 |
| 11 | 50 | 3 | 130 | 750 | 27.63 ± 2.61 | 29.44 | 28.90 | 42.61 ± 0.63 | 42.80 | 42.49 | 35.99 ± 0.52 | 36.31 | 36.85 | 18.95 ± 0.44 | 18.11 | 18.90 |
| 12 | 70 | 2 | 140 | 600 | 19.58 ± 2.20 | 19.53 | 19.64 | 34.20 ± 2.40 | 34.47 | 32.69 | 26.99 ± 2.25 | 28.54 | 26.76 | 16.85 ± 0.36 | 17.82 | 17.13 |
| 13 | 30 | 2 | 140 | 600 | 29.21 ± 2.60 | 29.48 | 28.40 | 42.29 ± 2.38 | 40.85 | 42.16 | 30.94 ± 0.17 | 29.27 | 30.85 | 16.65 ± 0.38 | 17.60 | 17.45 |
| 14 | 30 | 4 | 140 | 600 | 32.59 ± 1.12 | 29.20 | 31.87 | 39.39 ± 3.39 | 39.50 | 39.31 | 31.44 ± 1.64 | 30.23 | 31.59 | 13.19 ± 1.10 | 13.90 | 13.18 |
| 15 | 70 | 2 | 110 | 300 | 13.97 ± 2.03 | 15.08 | 13.22 | 25.61 ± 2.02 | 25.61 | 25.66 | 20.74 ± 2.03 | 21.51 | 20.74 | 6.44 ± 1.01 | 6.47 | 6.46 |
| 16 | 50 | 3 | 130 | 450 | 27.25 ± 1.75 | 26.79 | 25.62 | 41.83 ± 1.35 | 41.80 | 41.61 | 36.08 ± 0.34 | 35.58 | 35.44 | 13.49 ± 0.58 | 14.03 | 14.47 |
| 17 | 50 | 5 | 130 | 450 | 27.71 ± 2.62 | 28.68 | 29.97 | 38.89 ± 1.59 | 37.40 | 38.84 | 28.55 ± 1.20 | 27.74 | 28.67 | 12.45 ± 0.98 | 11.80 | 12.43 |
| 18 | 70 | 4 | 140 | 300 | 16.77 ± 2.11 | 17.89 | 15.43 | 28.19 ± 1.90 | 29.89 | 28.21 | 23.41 ± 0.12 | 23.44 | 23.56 | 9.24 ± 0.45 | 9.96 | 9.32 |
| 19 | 30 | 2 | 140 | 300 | 30.79 ± 3.26 | 31.07 | 30.40 | 32.37 ± 1.35 | 31.97 | 32.25 | 25.23 ± 1.30 | 23.89 | 27.72 | 11.82 ± 0.65 | 12.54 | 11.78 |
| 20 | 70 | 2 | 110 | 600 | 11.96 ± 2.20 | 11.85 | 11.66 | 27.48 ± 0.97 | 27.40 | 24.64 | 22.63 ± 0.60 | 21.06 | 22.61 | 6.94 ± 0.74 | 7.00 | 8.54 |
| 21 | 70 | 4 | 110 | 300 | 18.51 ± 0.79 | 18.08 | 19.66 | 30.64 ± 1.78 | 30.82 | 30.56 | 23.41 ± 0.89 | 24.49 | 25.33 | 8.43 ± 0.68 | 8.55 | 8.43 |
| 22 | 30 | 2 | 110 | 600 | 24.84 ± 1.20 | 22.39 | 27.18 | 38.94 ± 1.05 | 38.11 | 38.90 | 27.56 ± 1.64 | 27.43 | 27.64 | 11.21 ± 0.77 | 11.21 | 11.21 |
| 23 | 50 | 1 | 130 | 450 | 29.42 ± 2.33 | 29.96 | 27.75 | 32.54 ± 1.60 | 34.43 | 32.56 | 22.55 ± 0.62 | 24.06 | 22.56 | 15.28 ± 0.36 | 14.15 | 15.28 |
| 24 | 70 | 4 | 110 | 600 | 26.77 ± 1.15 | 24.64 | 26.70 | 34.49 ± 2.10 | 34.44 | 32.63 | 26.55 ± 0.37 | 27.06 | 25.76 | 9.42 ± 0.12 | 9.54 | 9.44 |
| 25 | 30 | 4 | 110 | 600 | 32.74 ± 1.55 | 34.09 | 32.34 | 39.87 ± 1.16 | 39.39 | 40.81 | 27.88 ± 1.26 | 29.18 | 28.04 | 9.52 ± 0.45 | 9.71 | 9.72 |
| 26 | 50 | 3 | 150 | 450 | 27.71 ± 2.30 | 26.24 | 27.96 | 39.33 ± 0.64 | 37.81 | 39.19 | 27.67 ± 0.66 | 28.95 | 27.73 | 15.35 ± 0.64 | 15.97 | 15.38 |
| 27 | 70 | 2 | 140 | 300 | 27.44 ± 1.44 | 28.85 | 27.89 | 27.36 ± 2.30 | 27.33 | 27.32 | 22.80 ± 0.76 | 21.24 | 22.72 | 9.23 ± 0.39 | 10.08 | 9.31 |
| Source | DF | DPPH | ABTS | TPC | TFC |
| Model | 14 | 1068.95 *** | 804.11 *** | 635.00 *** | 302.80 *** |
| Intercept (β0) | 1 | 26.34 | 41.84 | 35.80 | 13.26 |
| Linear terms | |||||
| X1 (β1) | 1 | 0.6782 | 0.9626 * | −0.9867 ** | −0.4032 ** |
| X2 (β2) | 1 | 1.72 ** | 0.4558 | 0.1990 | 1.67 *** |
| X3 (β3) | 1 | −3.42 *** | −2.40 *** | −1.19 ** | −0.6597 ** |
| X4 (β4) | 1 | 1.24 * | 3.13 *** | 1.99 *** | 1.51 *** |
| Quadratic terms | |||||
| X12 (β11) | 1 | 0.6328 | −1.47 *** | −2.42 *** | 0.1636 |
| X22 (β22) | 1 | −1.07 * | −1.72 *** | −2.58 *** | −0.4717 ** |
| X32 (β33) | 1 | −3.42 *** | −3.60 *** | −3.33 *** | −1.15 *** |
| X42 (β44) | 1 | 0.2118 | −1.54 *** | −1.13 *** | 0.0652 |
| Interaction terms | |||||
| X1X2 (β1β2) | 1 | −2.99 *** | −0.6606 | −0.1952 | −0.5511 ** |
| X1X3 (β1β3) | 1 | 0.2740 | 1.44 * | 1.06 ** | 1.01 *** |
| X1X4 (β1β4) | 1 | 2.45 *** | 0.4581 | 0.7562 | 0.1127 |
| X2X3 (β2β3) | 1 | 0.1471 | 1.0 8* | 1.41 ** | 1.11 *** |
| X2X4 (β2β4) | 1 | −1.02 | 1.34 ** | 1.94 *** | 1.80 *** |
| X3X4 (β3β4) | 1 | −1.43 ** | −0.4356 | 0.4797 | 0.6715 ** |
| Lack of fit (probability) | 10 | 0.1138 | 0.0981 | 0.1025 | 0.3556 |
| F-value | 8.18 | 9.58 | 9.15 | 2.18 | |
| R2 | 0.9543 | 0.9608 | 0.9533 | 0.9745 | |
| Adj. R2 | 0.9009 | 0.9151 | 0.8989 | 0.9447 | |
| Adeq. precision | 17.9849 | 15.8235 | 12.9272 | 19.0817 | |
| C.V. (%) | 8.90 | 4.81 | 5.90 | 6.86 |
| Parameters | DPPH | ABTS | TPC | TFC | ||||
|---|---|---|---|---|---|---|---|---|
| RSM | ANN | RSM | ANN | RSM | ANN | RSM | ANN | |
| RMSE | 1.38 | 1.15 | 1.10 | 0.78 | 1.15 | 0.56 | 0.66 | 0.46 |
| R2 | 95.43 | 96.84 | 96.08 | 98.03 | 95.33 | 97.72 | 96.27 | 98.19 |
| AAD | 5.18 | 4.17 | 2.40 | 1.26 | 3.52 | 1.68 | 4.66 | 2.12 |
| SEP | 0.22 | 0.18 | 0.12 | 0.08 | 0.15 | 0.10 | 0.21 | 0.14 |
| Variables | RSM-GA | ANN-GA | RSM-DF (0.92) | |
|---|---|---|---|---|
| Independent variables | Concentration | 47.75 | 47.67 | 47.36 |
| Time | 2.76 | 2.96 | 2.94 | |
| Temperature | 140.79 | 139.54 | 139.71 | |
| Power (W) | 599.99 | 600.00 | 599.99 | |
| Dependent variables | DPPH | 26.31 | 28.01 | 27.94 |
| ABTS | 35.99 | 36.07 | 36.00 | |
| TPC | 42.90 | 43.65 | 43.58 | |
| TFC | 17.84 | 17.67 | 17.63 |
| Group | No. | Compound Name | EF | CM (m/z)−/+ | OM (m/z)−/+ | MS/MS (Negative Mode) |
|---|---|---|---|---|---|---|
| Phenolic acids and derivatives | 1. | Gallic acid | C7H6O5 | 169.0134 | 169.0137 | 125.02 |
| 2. | Vanillic acid | C8H8O4 | 167.0343 | 167.0344 | 108.02, 152.011 | |
| 3. | Isopropyl 3-(3,4-dihydroxyphenyl)-2-hydroxypropanoate # | C12H16O5 | 239.0929 | 239.0925 | 173.03, 123.04 | |
| 4. | 3,4-Dihydroxyphenylglycol # | C8H10O4 | 169.0500 | 169.0506 | 151.03, 123.00 | |
| 5. | Scopoletin # | C10H8O4 | 191.0349 | 191.0350 | 175.03, 147.04 | |
| 6. | Caffeic acid 4-Sulfate # | C9H8O7S | 258.9899 | 258.9912 | 215.00, 179.03, 135.04 | |
| 7. | Cinnamoyl Glucose # | C15H18O7 | 309.0974 | 309.0974 | 147.04, 131.04, 103.05 | |
| Flavonoids | 8. | 3’-O-Methylcatechin | C16H16O6 | 303.0862 | 303.0868 | 271. 07, 163.05 |
| 9. | 4’,7-Dihydroxyisoflavone # | C15H10O4 | 253.0493 | 253.0500 | 225.05,197.06, 143.03 | |
| 10. | Naringenin # | C15H12O5 | 271.0581 | 271.0606 | 229.05, 177.01, 151.00, 119.06 | |
| Tannins | 11. | Phloroglucinol | C6H6O3 | 125.0237 | 125.0238 | 97.04 |
| 12. | Fucophlorethol-A | C18H14O9 | 373.0557 | 373.0559 | 247.05, 233.02, 229.07, 125.03 | |
| 13. | Bifuhalol | C12H10O7 | 264.0345 | 264.0348 | 247.03, 141.07, 111.03, 123.01, 125.03, | |
| 14. | Diphlorethohydroxycarmalol # | C24H15O13 | 511.0510 | 511.0506 | 385.00 | |
| 15. | Dibenzodioxin-1,3,6,8-tetraol # | C12H7O6 | 246.9919 | 246.9914 | 203.05, 121.01 | |
| 16. | Fucophlorethol # | C36H26O14 | 680.1154 | 680.1179 | 610.05,601.03, 495.07, 469.06, 229.03 | |
| Terpenes | 17. | Glycyrrhizin | C42H62O16 | 821.3951 | 821.3959 | 777.40, 627.35, 469.33, 451.32 |
| 18. | β-Glycyrrhetinic acid | C30H46O4 | 469.3330 | 469.3317 | 451.32, 423.32, 409.31 | |
| 19. | Isololiolide | C11H16O3 | 195.1021 | 195.1021 | 161.09, 179.10, 133.10, 105.07 | |
| 20. | Lupenone | C30H48O | 423.3620 | 423.3626 | 408.33,381.33,365.27,257.24 | |
| Carboxylic acids | 21. | Fumaric acid | C4H4O4 | 115.0050 | 115.0037 | 71.01 |
| 22. | Threonic acid | C4H8O5 | 135.0290 | 135.0299 | 117.01, 91.04, 72.99 | |
| 23. | Cinnamic acid | C9H8O2 | 147.0442 | 147.0452 | 129.03, 103.05 | |
| 24. | Gentisic acid | C7H6O4 | 153.0187 | 153.1287 | 152.74, 108.07, 81.05 | |
| 25. | Behenic acid | C22H44O2 | 339.3268 | 339.3263 | 321.31, 295.33,211.24 | |
| 26. | Kainic acid | C10H15NO4 | 212.0922 | 212.0922 | 168.2, 194.1, 150.2 | |
| 27. | Mannuronic acid | C6H10O7 | 193.0353 | 193.0348 | 175.02, 103.00, 72.99 | |
| 28. | Diethyl phthalate | C12H14O4 | 221.0818 | 221.0813 | 193.08, 177.09, 149.09, 121.02 | |
| 29. | Vanillylmandelic acid | C9H10O5 | 197.0449 | 197.0450 | 153.05, 137.02,123.04, 107.01 | |
| 30. | Phthalic acid | C8H6O4 | 165.0188 | 165.0187 | 121.1 26, 119.15, 58.91 | |
| 31. | 3-Oxooctanoic acid | C8H14O3 | 157.0863 | 157.0876 | 139.07, 113.09, 97.06 | |
| 32. | D-Glucaric acid derivate | C12H14O10 | 317.0544 | 317.0509 | 209.08 | |
| 33. | Fukic acid | C11H12O8 | 271.0459 | 271.0453 | 227.05, 197.04, 179.03 | |
| 34. | Mono-(3-carboxypropyl) phthalate | C12H12O6 | 251.0556 | 251.0555 | 233.04, 207.06, 165.01 | |
| 35. | Azelaic acid | C9H16O4 | 187.0969 | 188.0976 | 187.31, 124.91, 169.20, 111.20 | |
| Fatty acids | 36. | Caprylic acid | C8H15O2 | 143.1070 | 143.1072 | 125.09, 99.11, 59.01 |
| 37. | Stearic acid | C18H36O2 | 283.2641 | 283.2637 | 265.25, 239.27, 237.25 | |
| 38. | cis-Vaccenic acid | C18H34O2 | 281.2486 | 281.2487 | 263.23, 223.17, 163.14, 71.01 | |
| 39. | α-Linoleic acid | C18H32O2 | 279.2331 | 279.2330 | 261.22, 235.24, 233.22 | |
| 40. | Oleic acid | C18H34O2 | 281.2487 | 281.2486 | 263.25, 181.21, 127.25 | |
| 41. | Palmitic acid | C16H32O2 | 255.233 | 255.233 | 237.23, 211.24, 197.22 | |
| 42. | Myristic acid | C14H28O2 | 227.2015 | 227.2017 | 209.19, 183.21,179.18 | |
| 43. | Arachidic acid | C20H40O2 | 311.2958 | 311.295 | 297.04, 275.84, 200.85 | |
| 44. | Eicosapentaenoic acid | C20H30O2 | 301.2176 | 301.2173 | 299.20, 283.20, 229.15, 131.08, 71.01 | |
| 45. | Arachidonic acid | C20H32O2 | 303.2333 | 303.233 | 285.2218, 259.24, 257.22 | |
| 46. | 5,8,11-Eicosatrienoic acid | C20H34O2 | 305.2491 | 305.2486 | 287.23, 261.25, 207.21 | |
| 47. | 11,14-Eicosadienoic acid | C20H36O2 | 307.2643 | 307.2643 | 289.25, 249.18, 233.19, 153.09, 71.01 | |
| 48. | Octadecendioic acid | C18H32O4 | 311.223 | 311.2239 | 299.25, 269.24, 251.23, 223.24 | |
| 49. | Methyl arachidonate | C21H34O2 | 317.2487 | 317.2486 | 315.23, 301.21, 243.17, 191.18, 121.10, 73.02 | |
| 50. | 13-keto-9Z,11E-Octadecadienoic acid | C18H30O3 | 293.2125 | 293.2122 | 275.20, 195.13, 113.09 | |
| 51. | 10-Oxooctadecanoic acid | C18H34O3 | 297.2436 | 297.2435 | 279.23, 209.15, 141.12, 127.11 | |
| 52. | 10,16-Dihydroxy-palmitic acid | C16H32O4 | 287.2227 | 287.2222 | 269.21, 257.21, 239.20, 185.11 | |
| 53. | Vernolic acid | C18H32O3 | 295.2278 | 295.2273 | 277.21, 251.23, 195.13, 127.11 | |
| 54. | Octadeca-2,4-dienedioic acid | C18H30O4 | 309.2072 | 309.2071 | 291.19, 265.21, 247.20 | |
| 55. | Palmitaldehyde | C16H32O | 239.092 | 239.0925 | 237.22, 207.21, 153.12, 127.14 | |
| 56. | Myristic aldehyde | C14H28O | 211.2064 | 211.2067 | 209.19, 167.14, 127.14, 99.11, 71.08 | |
| 57. | Heptanal | C7H14O | 113.0962 | 113.0972 | 95.08, 85.10 | |
| 58. | 9-Octadecenal | C18H34O | 265.2544 | 265.2537 | 249.22, 247.24, 235.24 | |
| 59. | 2,4-Decadienal | C10H16O | 151.1119 | 151.1128 | 133.10, 123.11, 119.08, 93.07 | |
| 60. | Nonanal | C9H18O | 141.128 | 141.1285 | 123.11, 113.13, 95.08 | |
| 61. | Ethyl oleate | C20H38O2 | 309.2798 | 309.2799 | 291.26, 281.24, 263.23, 237.25, 45.03 | |
| 62. | 1-Docosanol | C22H46O | 325.3475 | 325.3476 | 309.31, 307.33, 295.33, 267.30 | |
| 63. | (9R,10S,12Z)-9,10-Dihydroxy-8-oxo-12-octadecenoic acid | C18H32O5 | 327.2178 | 327.2177 | 309.20, 283.22, 187.09, 157.08 | |
| 64. | 5,8,12-Trihydroxy-9-octadecenoic acid | C18H34O5 | 329.2338 | 329.2333 | 311.22, 285.24, 267.23, 243.12, 195.17, 145.08 | |
| 65. | 13-Docosenamide | C22H43NO | 336.3274 | 336.3272 | 319.30, 293.3214, 58.02 | |
| 66. | Lauric acid | C12H24O2 | 199.1697 | 199.1698 | 181.1062; 155.0336 | |
| Amino Acids | 67. | L-Proline | C5H9NO2 | 114.0560 | 114.0555 | 70.06 |
| 68. | Glutamic acid | C5H9NO4 | 146.0451 | 146.0453 | 70.06 | |
| 69. | D-Histidine | C6H9N3O2 | 154.0628 | 154.0616 | 82.3, 71.9 | |
| Sugars | 70. | D-Galactose | C6H12O6 | 179.0568 | 179.0555 | 161.04, 143.03, 113.02, 101.02, |
| 71. | Mannitol | C6H14O6 | 181.0712 | 181.0718 | 165.01, 147.03, 129.05, 111.00 | |
| 72. | Gluconic acid | C6H12O7 | 195.0517 | 195.0504 | 177.05, 159.02, 129.05, 98.90 | |
| 73. | Xylitol | C5H12O5 | 151.0618 | 151.0612 | 119, 131, 89.1 | |
| 74. | Maltitol | C12H24O11 | 343.1248 | 343.124 | 283.10, 265.09, 179.05, 161.04, 143.03 | |
| Other compounds | 75. | 4-Octylphenol | C14H22O | 205.1593 | 205.1592 | 135.08, 119.05, 107.05, 93.03 |
| 76. | 2,4-Dibromophenol | C6H4Br2O | 248.8649 | 248.8550 | 248.85, 168.92 | |
| 77. | Dihydroconiferyl alcohol | C10H14O3 | 181.0864 | 181.0864 | 163.07, 135.04 | |
| 78. | Dihydroxyphenylalanine # | C9H10O7NS | 276.0185 | 276.0184 | 259, 231, 215, 196, 179, 150, 135 | |
| 79. | 5-Hydroxybenzofuran-2(3H)-one # | C8H6O3 | 149.0237 | 149.0238 | 121.02, 67.01, 65.00 |
Publisher’s Note: MDPI stays neutral with regard to jurisdictional claims in published maps and institutional affiliations. |
© 2022 by the authors. Licensee MDPI, Basel, Switzerland. This article is an open access article distributed under the terms and conditions of the Creative Commons Attribution (CC BY) license (https://creativecommons.org/licenses/by/4.0/).
Share and Cite
Javed, A.; Naznin, M.; Alam, M.B.; Fanar, A.; Song, B.-R.; Kim, S.; Lee, S.-H. Metabolite Profiling of Microwave-Assisted Sargassum fusiforme Extracts with Improved Antioxidant Activity Using Hybrid Response Surface Methodology and Artificial Neural Networking-Genetic Algorithm. Antioxidants 2022, 11, 2246. https://doi.org/10.3390/antiox11112246
Javed A, Naznin M, Alam MB, Fanar A, Song B-R, Kim S, Lee S-H. Metabolite Profiling of Microwave-Assisted Sargassum fusiforme Extracts with Improved Antioxidant Activity Using Hybrid Response Surface Methodology and Artificial Neural Networking-Genetic Algorithm. Antioxidants. 2022; 11(11):2246. https://doi.org/10.3390/antiox11112246
Chicago/Turabian StyleJaved, Ahsan, Marufa Naznin, Md. Badrul Alam, Alshammari Fanar, Bo-Rim Song, Sunghwan Kim, and Sang-Han Lee. 2022. "Metabolite Profiling of Microwave-Assisted Sargassum fusiforme Extracts with Improved Antioxidant Activity Using Hybrid Response Surface Methodology and Artificial Neural Networking-Genetic Algorithm" Antioxidants 11, no. 11: 2246. https://doi.org/10.3390/antiox11112246