Article

Integrated Metabolomics and Transcriptomic Analysis of Hepatopancreas in Different Living Status Macrobrachium nipponense in Response to Hypoxia

1
Wuxi Fisheries College, Nanjing Agricultural University, Wuxi 214081, China
2
Key Laboratory of Freshwater Fisheries and Germplasm Resources Utilization, Freshwater Fisheries Research Center, Ministry of Agriculture, Chinese Academy of Fishery Sciences, Wuxi 214081, China
*
Author to whom correspondence should be addressed.
Antioxidants 2022, 11(1), 36; https://doi.org/10.3390/antiox11010036
Submission received: 23 November 2021 / Revised: 19 December 2021 / Accepted: 22 December 2021 / Published: 24 December 2021
(This article belongs to the Special Issue Hypoxia and Oxidative Stress)

Abstract

:
As the basic element of aerobic animal life, oxygen participates in most physiological activities of animals. Hypoxia stress is often the subject of aquatic animal research. Macrobrachium nipponense, an economically important aquatic animal in southern China, has been affected by hypoxia for many years and this has resulted in a large amount of economic loss due to its sensitivity to hypoxia; Metabolism and transcriptome data were combined in the analysis of the hepatopancreas of M. nipponense in different physiological states under hypoxia; A total of 108, 86, and 48 differentially expressed metabolites (DEMs) were found in three different comparisons (survived, moribund, and dead shrimps), respectively. Thirty-two common DEMs were found by comparing the different physiological states of M. nipponense with the control group in response to hypoxia. Twelve hypoxia-related genes were identified by screening and analyzing common DEMs. GTP phosphoenolpyruvate carboxykinase (PEPCK) was the only differentially expressed gene that ranked highly in transcriptome analysis combined with metabolome analysis. PEPCK ranked highly both in transcriptome analysis and in combination with metabolism analysis; therefore, it was considered to have an important role in hypoxic response. This manuscript fills the one-sidedness of the gap in hypoxia transcriptome analysis and reversely deduces several new genes related to hypoxia from metabolites. This study contributes to the clarification of the molecular process associated with M. nipponense under hypoxic stress.

1. Introduction

Oxygen is an essential environmental factor participating in the entire life of aquatic animals, including feeding, growth, and reproduction. Aquatic animals are prevented from being widely distributed at high altitudes and in underground regions due to oxygen demand. Since the discovery of the first hypoxia-related gene, erythropoietin (EPO), a series of genes related to hypoxia response mechanisms have been identified [1,2]. The identification of these genes has promoted the study of the hypoxia metabolic pathway in aquatic animals to a certain extent. However, a theoretical system of hypoxia has not formed. Until the discovery of the hypoxia-inducible factor (HIF), the basic molecular mechanisms of the response to hypoxia had not been determined [3,4,5,6]. With further research on HIF, a similar hypoxia metabolic pathway was found between aquatic animals and mammals. Thereafter, the discovery of hypoxia-related genes in aquatic animals entered a new stage, and a lot of hypoxia-related genes in mammals were cloned homologously into aquatic animals. At this stage, some important hypoxia-related genes were identified, including a series of well-known antioxidant genes [7,8,9].
However, as research continued, there were fewer and fewer homologous-cloned genes to be discovered, and the molecular mechanism of hypoxia was still not fully understood. When the research reached an impasse, the maturity of high-throughput DNA sequencing techniques saved the situation in time [10]. The study of hypoxia-related genes began to enter the transcriptome analysis era and this has resulted in a huge amount of available information, including the accuracy of proving that previous homologous-cloned genes are indeed related to hypoxia and a large number of unknown hypoxia related genes [11,12,13,14]. However, such huge amounts of data not only bring with them the hope of revealing the molecular mechanism of hypoxia, but they also increase the difficulty of screening useful genes. To verify the accuracy of the transcriptome and to find hypoxia-related genes quickly, the top differentially expressed genes (DEGs) are usually studied first. This method of artificially selecting DEGs will ignore a large number of DEGs that may play a crucial role in the response to hypoxia. Therefore, to improve screening the results of high-throughput sequencing, the joint analysis of metabolic and transcriptomic analysis has gradually entered the public field of vision. This method has been widely used in animals by searching for differential metabolites and DEGs, respectively, and then jointly analyzing them to find common differential genes to lock in genes that are related to the purpose of the research [15,16,17,18].
Macrobrachium nipponense (de Haan, 1849) is a popular and economically important aquatic shrimp in southern China due to its delicious taste and nutritional value. According to previous studies, the lethal concentration (LC50) of oxygen in M. nipponense is higher than it is in Metapenaeus ensis [19]. The experience of production also confirms that M. nipponense is less tolerant to hypoxia than other crustaceans. Therefore, it is of great importance to understand the molecular mechanism of hypoxia in M. nipponense. Although some studies have investigated the transcriptome of M. nipponense in response to hypoxia, these studies only have a control group and a survival group [20,21]. The limitation of this study is in identifying genes that are involved in the initial adaptation to hypoxia. In a previous study we have recognized these limitations and set up three comparisons between the control group and different states of survival [13]. Several of DEGs were thus identified in the previous study. To further establish whether the DEGs were closely related to hypoxia in previous transcriptomic analysis, a method of combining the analysis of metabolome and transcriptome data is used to further screen the transcriptome results.
To analyze our knowledge, a combined analysis of metabolome and transcriptome data associated with M. nipponense in different physiological states under hypoxia has not been reported previously. This study is devoted to identifying the essential genes that play a key role in response to hypoxia and provide the basic information to improve hypoxic resistance. This manuscript will assist in clarifying the molecular mechanisms used by M. nipponense in response to hypoxia.

2. Materials and Methods

2.1. Sample Preparation and Gather

In total, 100 healthy M.nipponense of about 2.0 ± 0.5 g were obtained from the breeding farm belonging to the Chinese Academy of Fisheries Science. To reduce the influence of transfer and make sure all the shrimps could adapt to the new environment before the hypoxic experiment, the shrimps were bred like those on the farm (18–30 °C, pH ≤ 9). After two weeks, the shrimps were randomly divided into a control group (6.0 ± 0.5 mg⋅L−1) and hypoxia group (1.0 ± 0.2 mg⋅L−1). The oxygen concentration in the hypoxia group was maintained with N2 gas, as previously described [8]. Thirty hepatopancreases were gathered from control, survived, moribund, and dead shrimps after hypoxia for eight h [13]. All the samples were immediately frozen in liquid nitrogen prior to storage at −80 °C.

2.2. Metabolites Extraction

In line with previous studies, the sample was extracted with 0.24 mL of extraction solution, and 10 μL of adonito was added; the sample was then vortexed, homogenized, and subjected to ultrasonication. After centrifugation, 25 μL was transferred to a clean 2 mL GC/MS glass bottle and collected as quality control (QC) samples. The samples were dried completely in a vacuum concentrator without heating. Then 30 μL of Methoxy amination hydrochloride was added and incubated at a constant temperature (70 °C) for 1.5 h. FAMEs (5 μL) was added to the QC sample while it was cooling to room temperature. All samples were analyzed by a gas chromatograph system coupled with a Pegasus HT time-of-flight mass spectrometer (GC-TOF-MS) [22].

2.3. GC-TOF-MS Analysis

GC-TOF-MS analysis was performed using an Agilent 7890 gas chromatograph system coupled with a Pegasus HT time-of-flight mass spectrometer. A corresponding DB-5MS capillary column was used according to the needs of the system. 1 μL of sample was injected in splitless mode and helium was used as the carrier gas. The energy in electron collision mode was −70 ev. After a solvent delay of 6–12 min, mass spectrometry data were obtained in a full scan mode in the m/z range of 50–500 at a rate of 20 spectra per sec. All relevant parameters were set according to previous studies [23].

2.4. Data Preprocessing and Annotation

Chroma TOF 4.3X software of the LECO Corporation and LECO-Fiehn Rtx5 database was used to extract, process, and normalize the original data. Both the mass spectrum match and retention index match were considered in metabolites identification. Peaks detected in <50% of QC samples or RSD > 30% in QC samples were removed.

2.5. Data Validation

2.5.1. RNA-Seq by qRT-PCR

Combined with the previous transcriptome database (PRJNA656359) [14], 12 differential genes (DEGs) were identified based on the common differential metabolites in the three comparative metabolome libraries (control vs. survived, control vs. moribund, control vs. dead). These DEGs were selected to validate the metabolism results. The tissues used for qRT-PCR were the same as those used in the metabolome. In subsequent experiments, the extraction of total RNA, the synthesis of cDNA, and the designs of qRT-PCR primer were completed as described in previous reports [14]. The primers for qRT-PCR are listed in Table S1. In line with previous studies, eukaryotic translation initiation factor 5A (EIF) was selected as the reference gene for qRT-PCR [24]. Three replications were used for each sample. The 2–ΔΔCT method was chosen to calculate the expression of the selected genes.

2.5.2. Identification of Key Metabolites in M. nipponense

Two hypoxia experiments were designed to verify the key metabolites. Firstly, 240 healthy adult M. nipponense were obtained and acclimated, as described above. Four groups were set with different oxygen conditions (1.5 ± 0.2 mg O2 L−1, 3.0 ± 0.2 mg O2 L−1, 4.5 ± 0.2 mg O2 L−1, and 6.0 ± 0.2 mg O2 L−1). After acclimating for two weeks, all the shrimp were randomly divided into four groups. Each group had three biological replications. The oxygen conditions were maintained by the method described before. After 8 h of hypoxia, six hepatopancreas were collected from the surviving prawns in each group. The samples were immediately frozen in liquid nitrogen before storage at −80 °C.
The second experiment was designed to verify the expression of key genes at different time points after hypoxia. About 300 healthy adult M. nipponense (2.0 ± 0.5 g) were prepared, as described previously. These shrimps were randomly divided into normal groups (6.0 ± 0.2 mg O2 L−1) and hypoxia groups (2.0 ± 0.2 mg O2 L−1). Each group had three biological repeats. As described previously, the oxygen conditions were kept constant. The target tissues were collected at 0, 6, 12, and 24 h during the hypoxia process. The method of collecting samples was as described above.
The qRT-PCR verification method of screened hypoxia-related genes in these two experiments was as described above.

2.6. Statistical Analysis

All confirmatory experiments had biological duplication (n = 3, n = 6 in metabolism). The appropriate method, including ANOVA and paired sample t-test of SPSS 20.0, were selected to analyze the variance of all data with p ≤ 0.05 considered to be significant [25].

3. Results

3.1. Principal Component Analysis (PCA) Analysis of Metabolism Profile

As an unsupervised pattern recognition method for multidimensional statistical analysis, PCA is often used as a preliminary method to understand the overall metabolic differences between each group and the degree of variation between samples within the group. The PCA of metabolic profiles for hepatopancreas is shown in Figure 1. It can be clearly observed that the metabolites of different survival states under hypoxia were accumulated, whereas the metabolites in the control group were dispersed (Figure 1A). The metabolic patterns of the moribund and dead groups were clearly different from the control group (Figure 1B,C). However, this trend was not shown in the comparison between the survived group and the control group (Figure 1D).

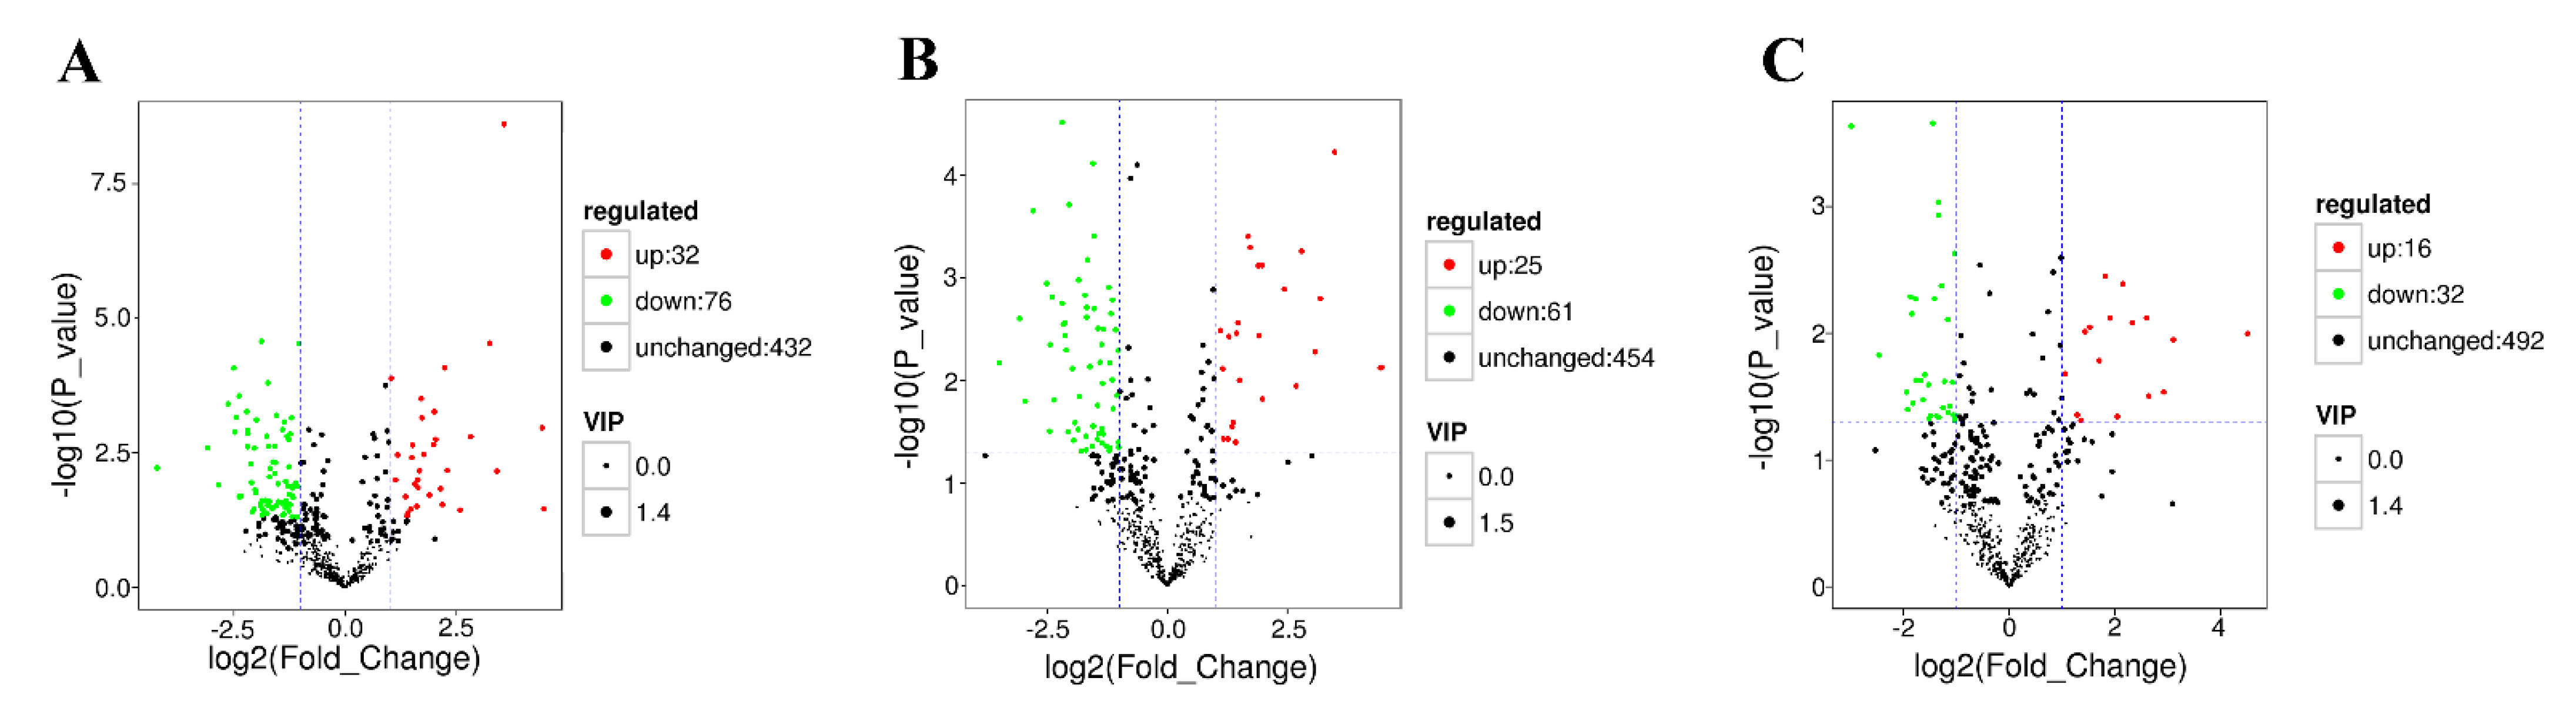
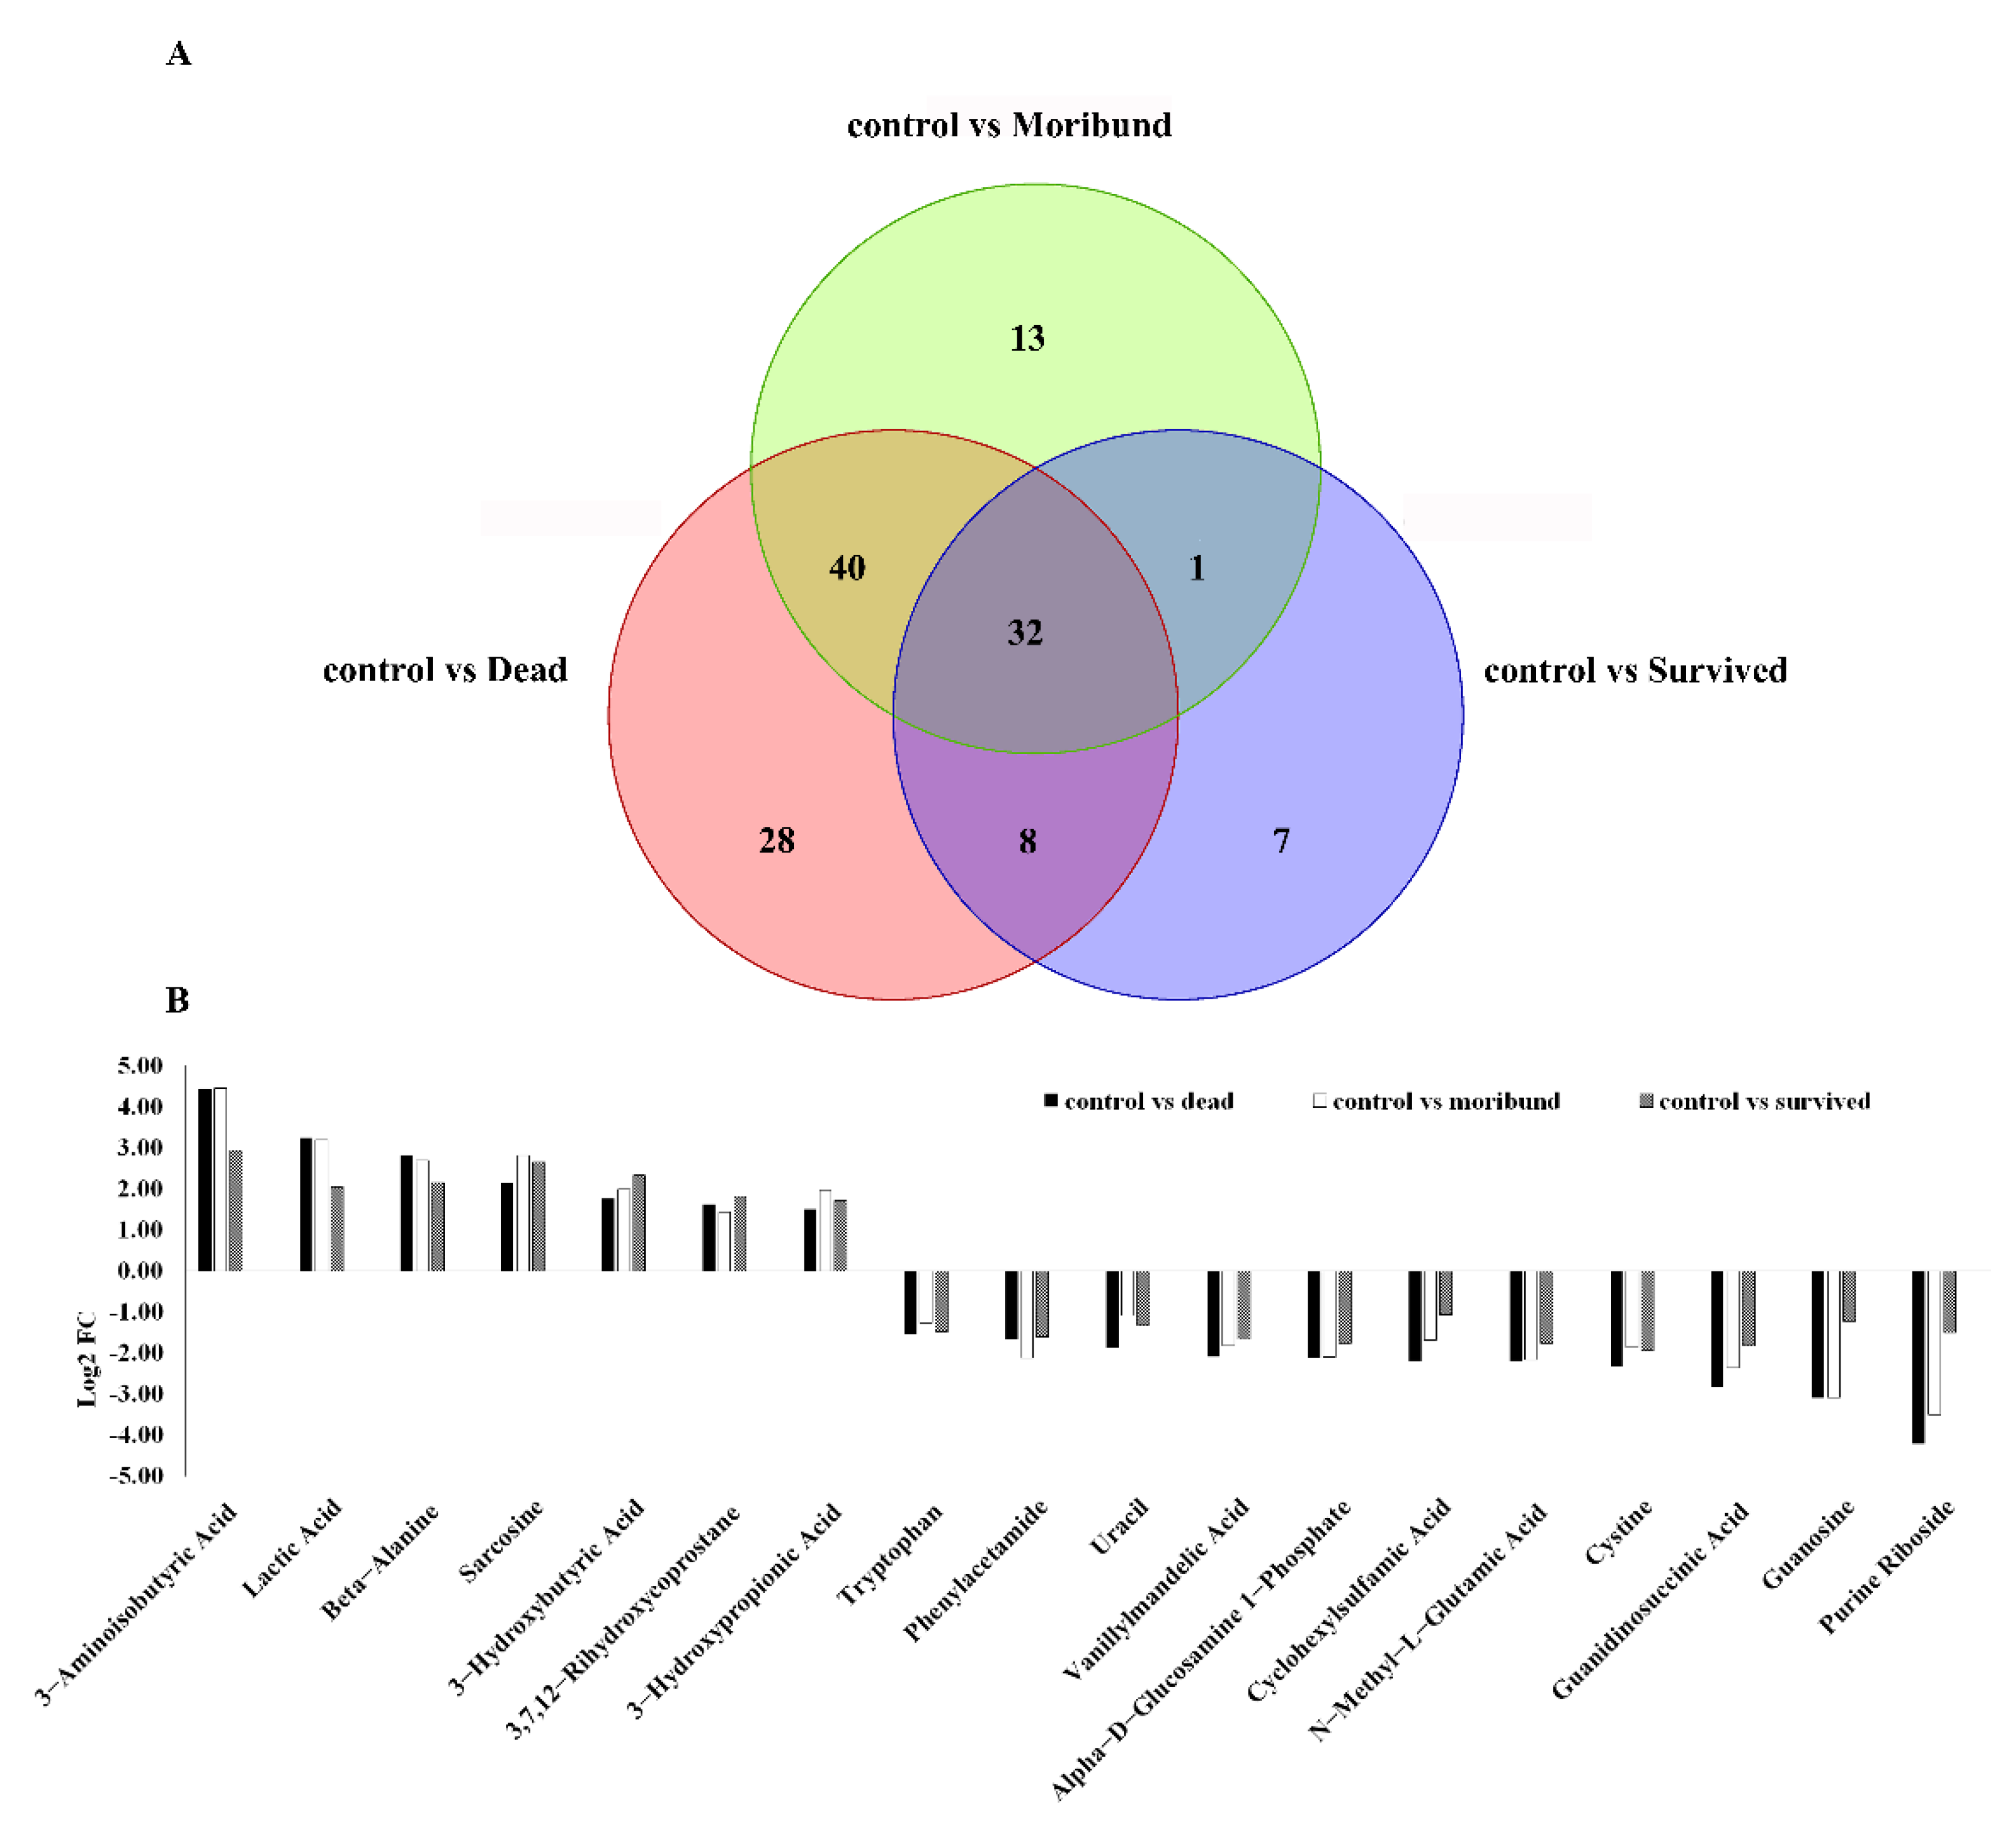
3.2. Significant Metabolites in Response to Hypoxia

A total of 540 metabolites were detected in three comparisons. The number of significantly different metabolites is listed in Table 1. The different metabolites were compared between the different physiological states and the control group. A total of 108 differential metabolites were found between the control group and the dead group, 76 (70.3%) were down-regulated, and 32 (29.7%) were up-regulated. In the comparison between the control group and the moribund group, there were 86 differential metabolites, in which 61 (70.9%) metabolites were significantly decreased and 25 (29.1%) were significantly increased. Of the 48 differential metabolites between the control group and the survived group, 32 (66.7%) metabolites significantly decreased and 16 (33.3%) metabolites significantly increased.
According to the fold change (FC) value, the differential metabolites in the three comparisons are shown by volcano plots (Figure 2). Cluster analysis is a multivariate statistical analysis method used to classify samples or indicators that can easily and intuitively observe data characteristics. First, the quantitative results of all samples were logarithmically transformed (log2), and then the metabolites with the same or similar expression patterns were clustered. The clustering results are shown in Figure S1.
There were 32 common significant metabolites among the three comparisons (p < 0.05). After removing unidentifiable metabolites, only 18 common differential metabolites were found. These substances were analyzed according to their Log2 FC values (Figure 3B).

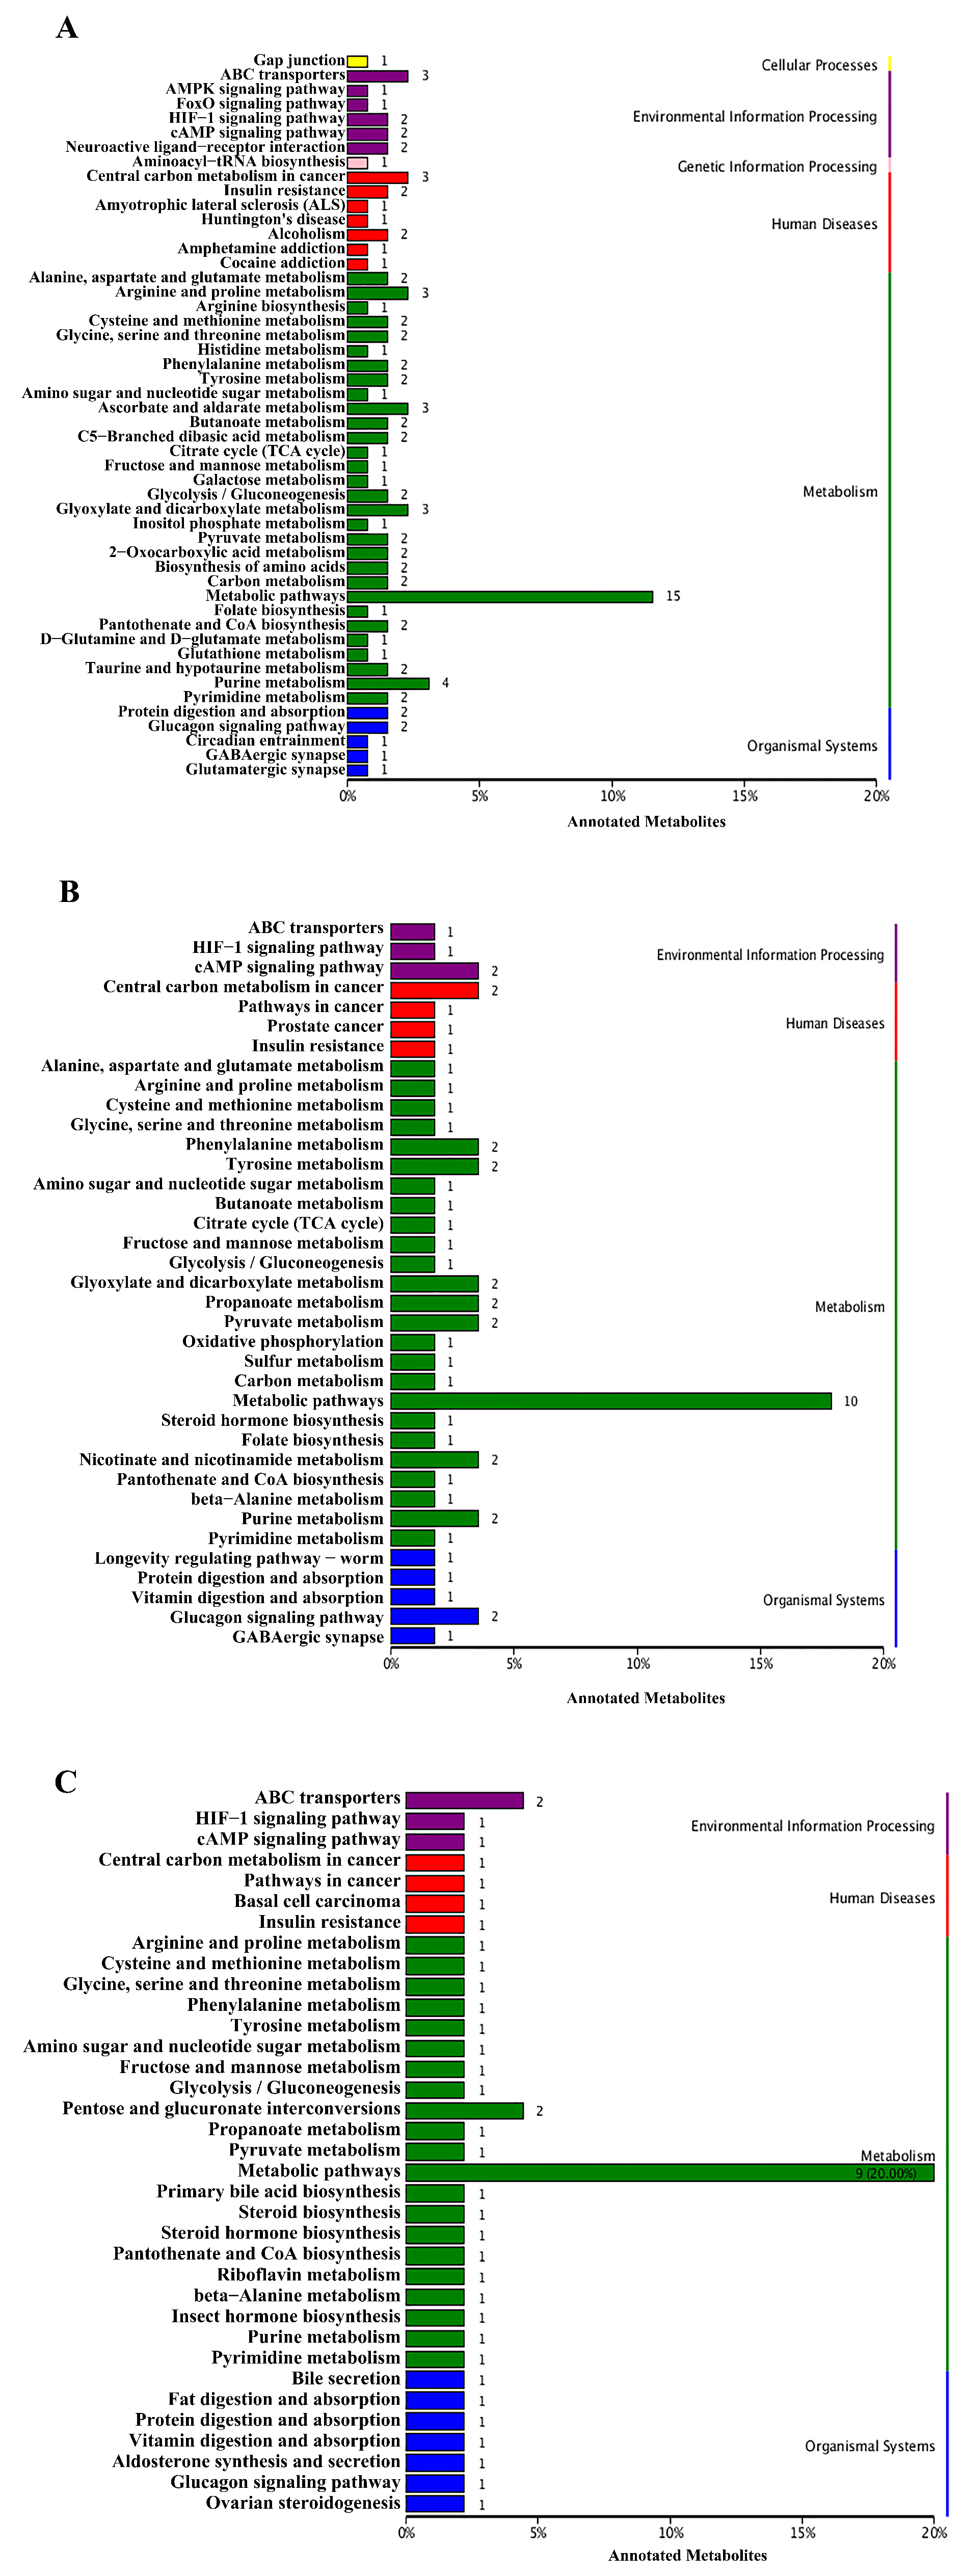
3.3. KEGG Pathway Analysis

All the different metabolites were enriched in different metabolic pathways through KEGG analysis. Most pathways occurred in the comparison between the control group and the dead group (81 pathways). The other two comparisons (control group vs. moribund group, control group vs. survived group) had 37 and 35 pathways, respectively. In total, six types of KEGG pathways were identified in the comparison between the control group and the dead group by enriching metabolites, including environmental information processing, cellular processes, genetic information processing, metabolism, organismal systems, and human diseases. In addition to cellular processes and genetic information processing, other types of pathways also appeared in the remaining two comparison groups, but there were differences in the number of enrichment (Figure 4).

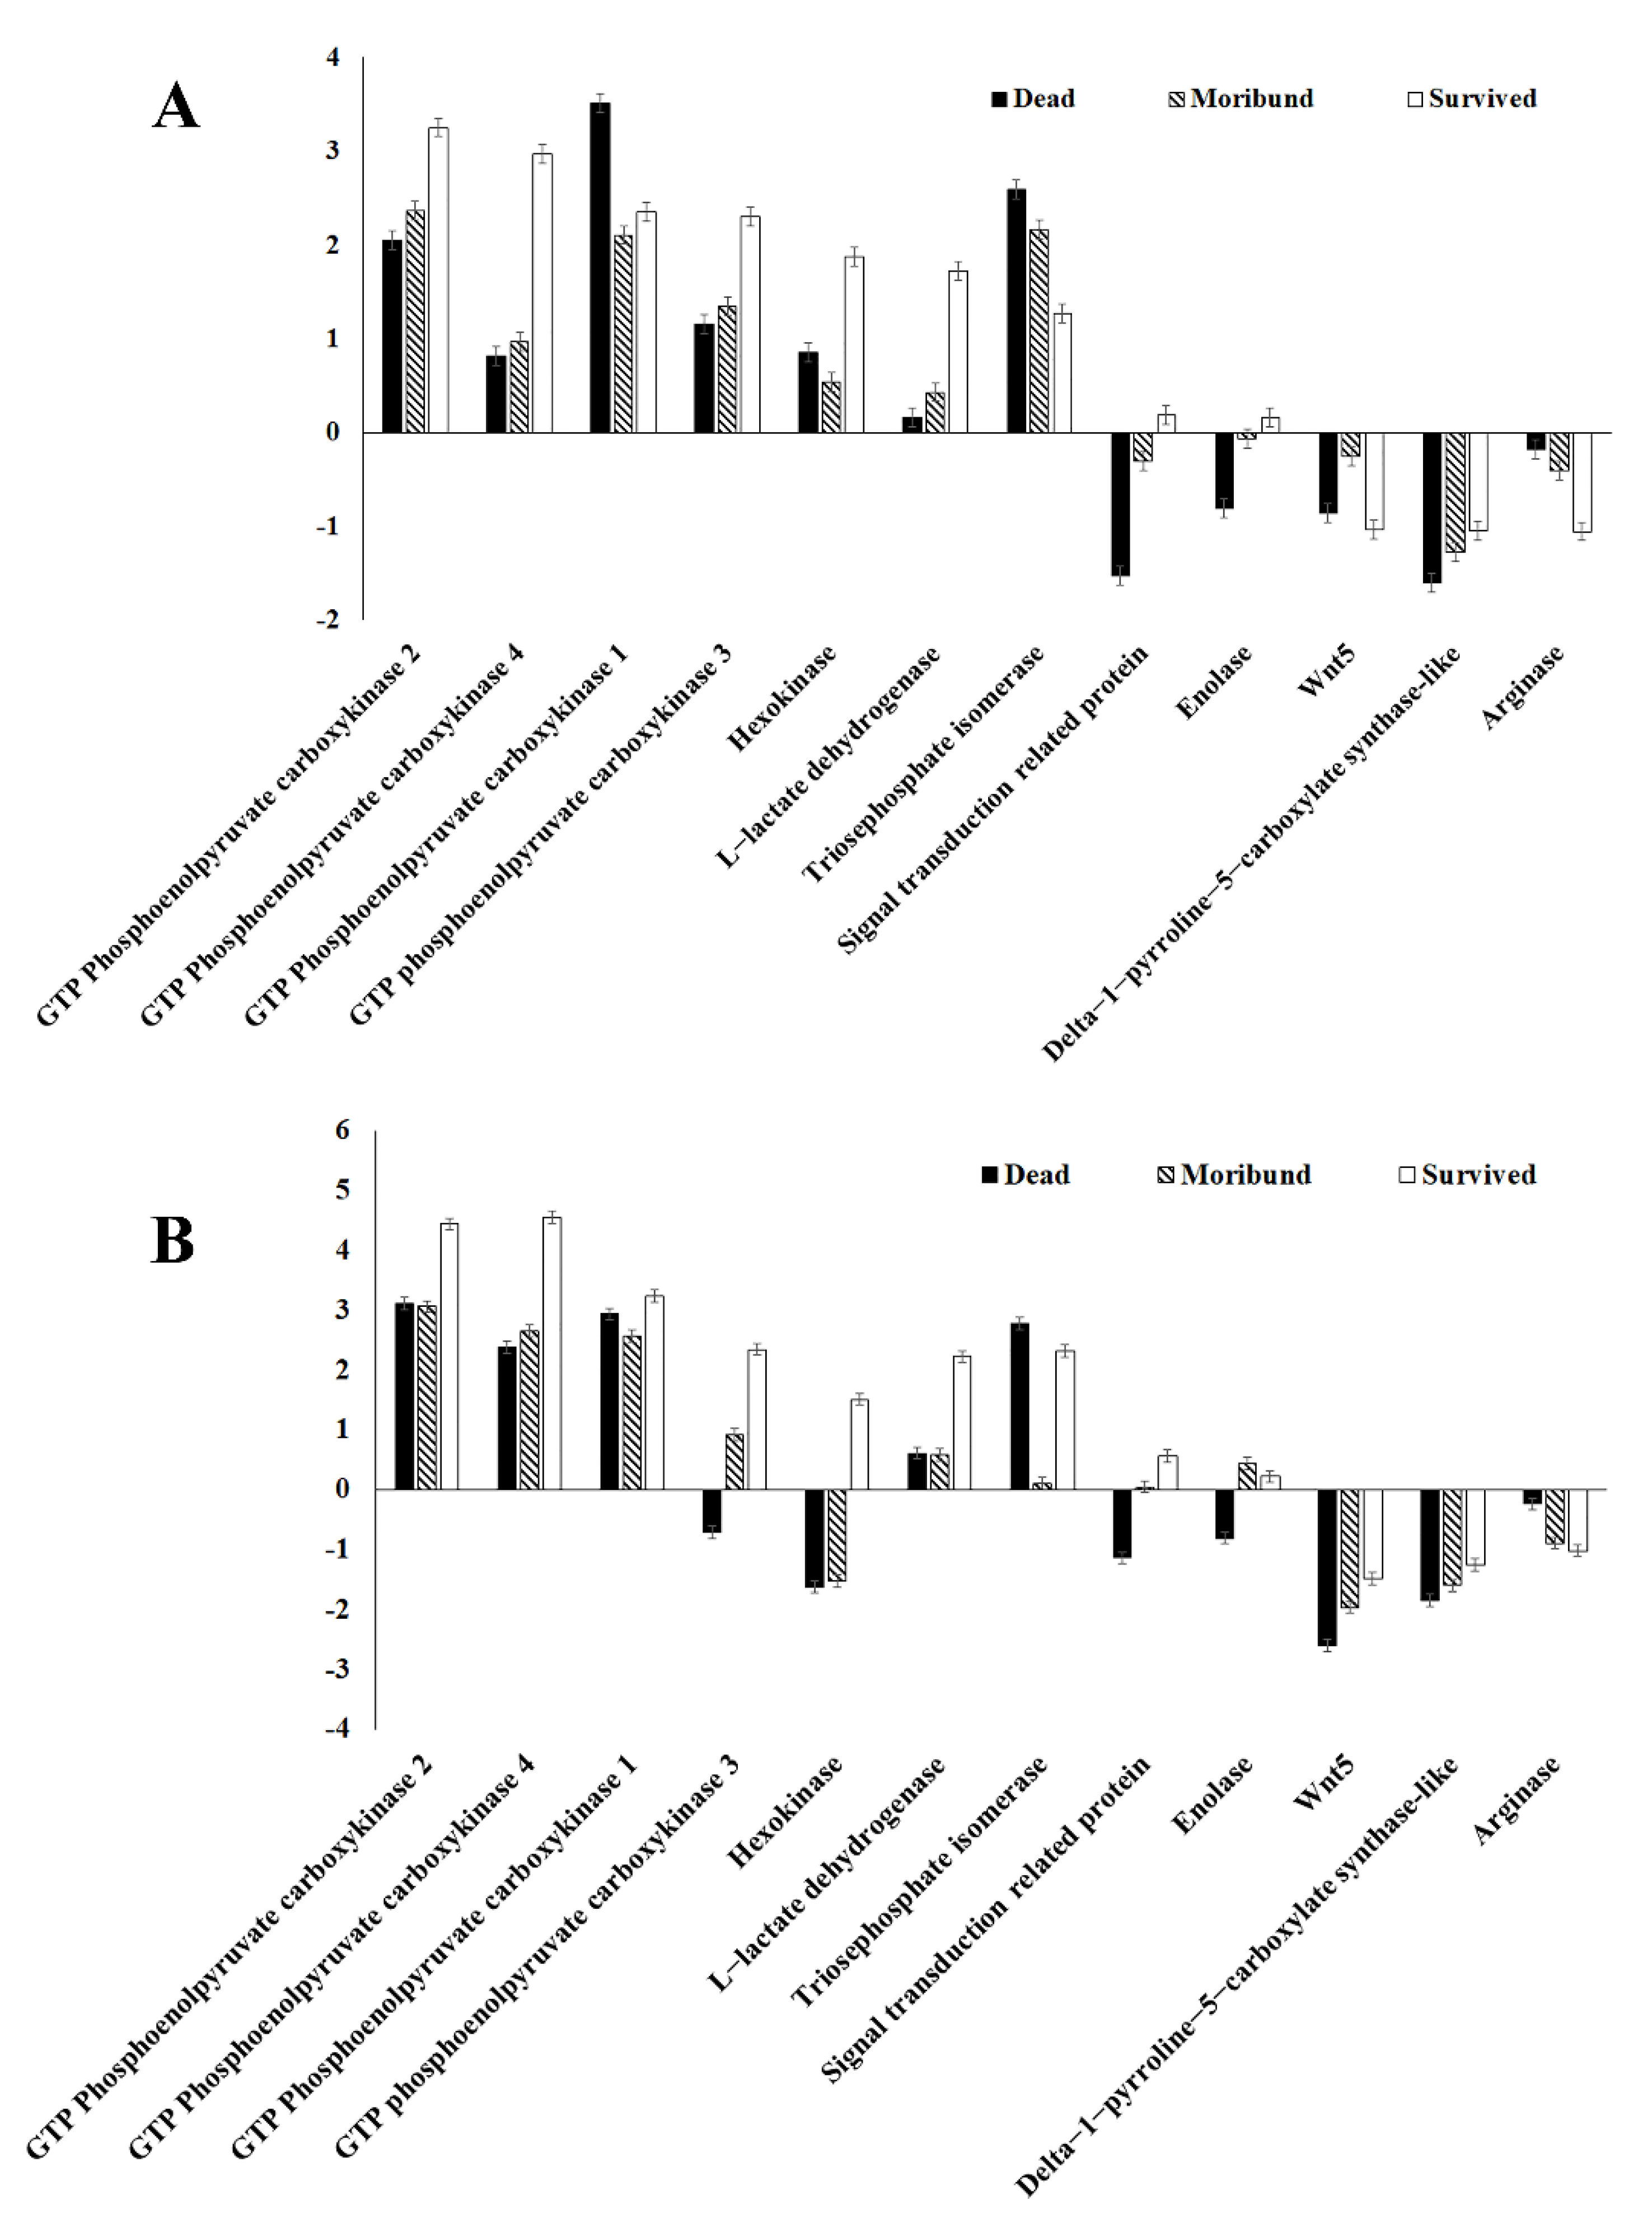
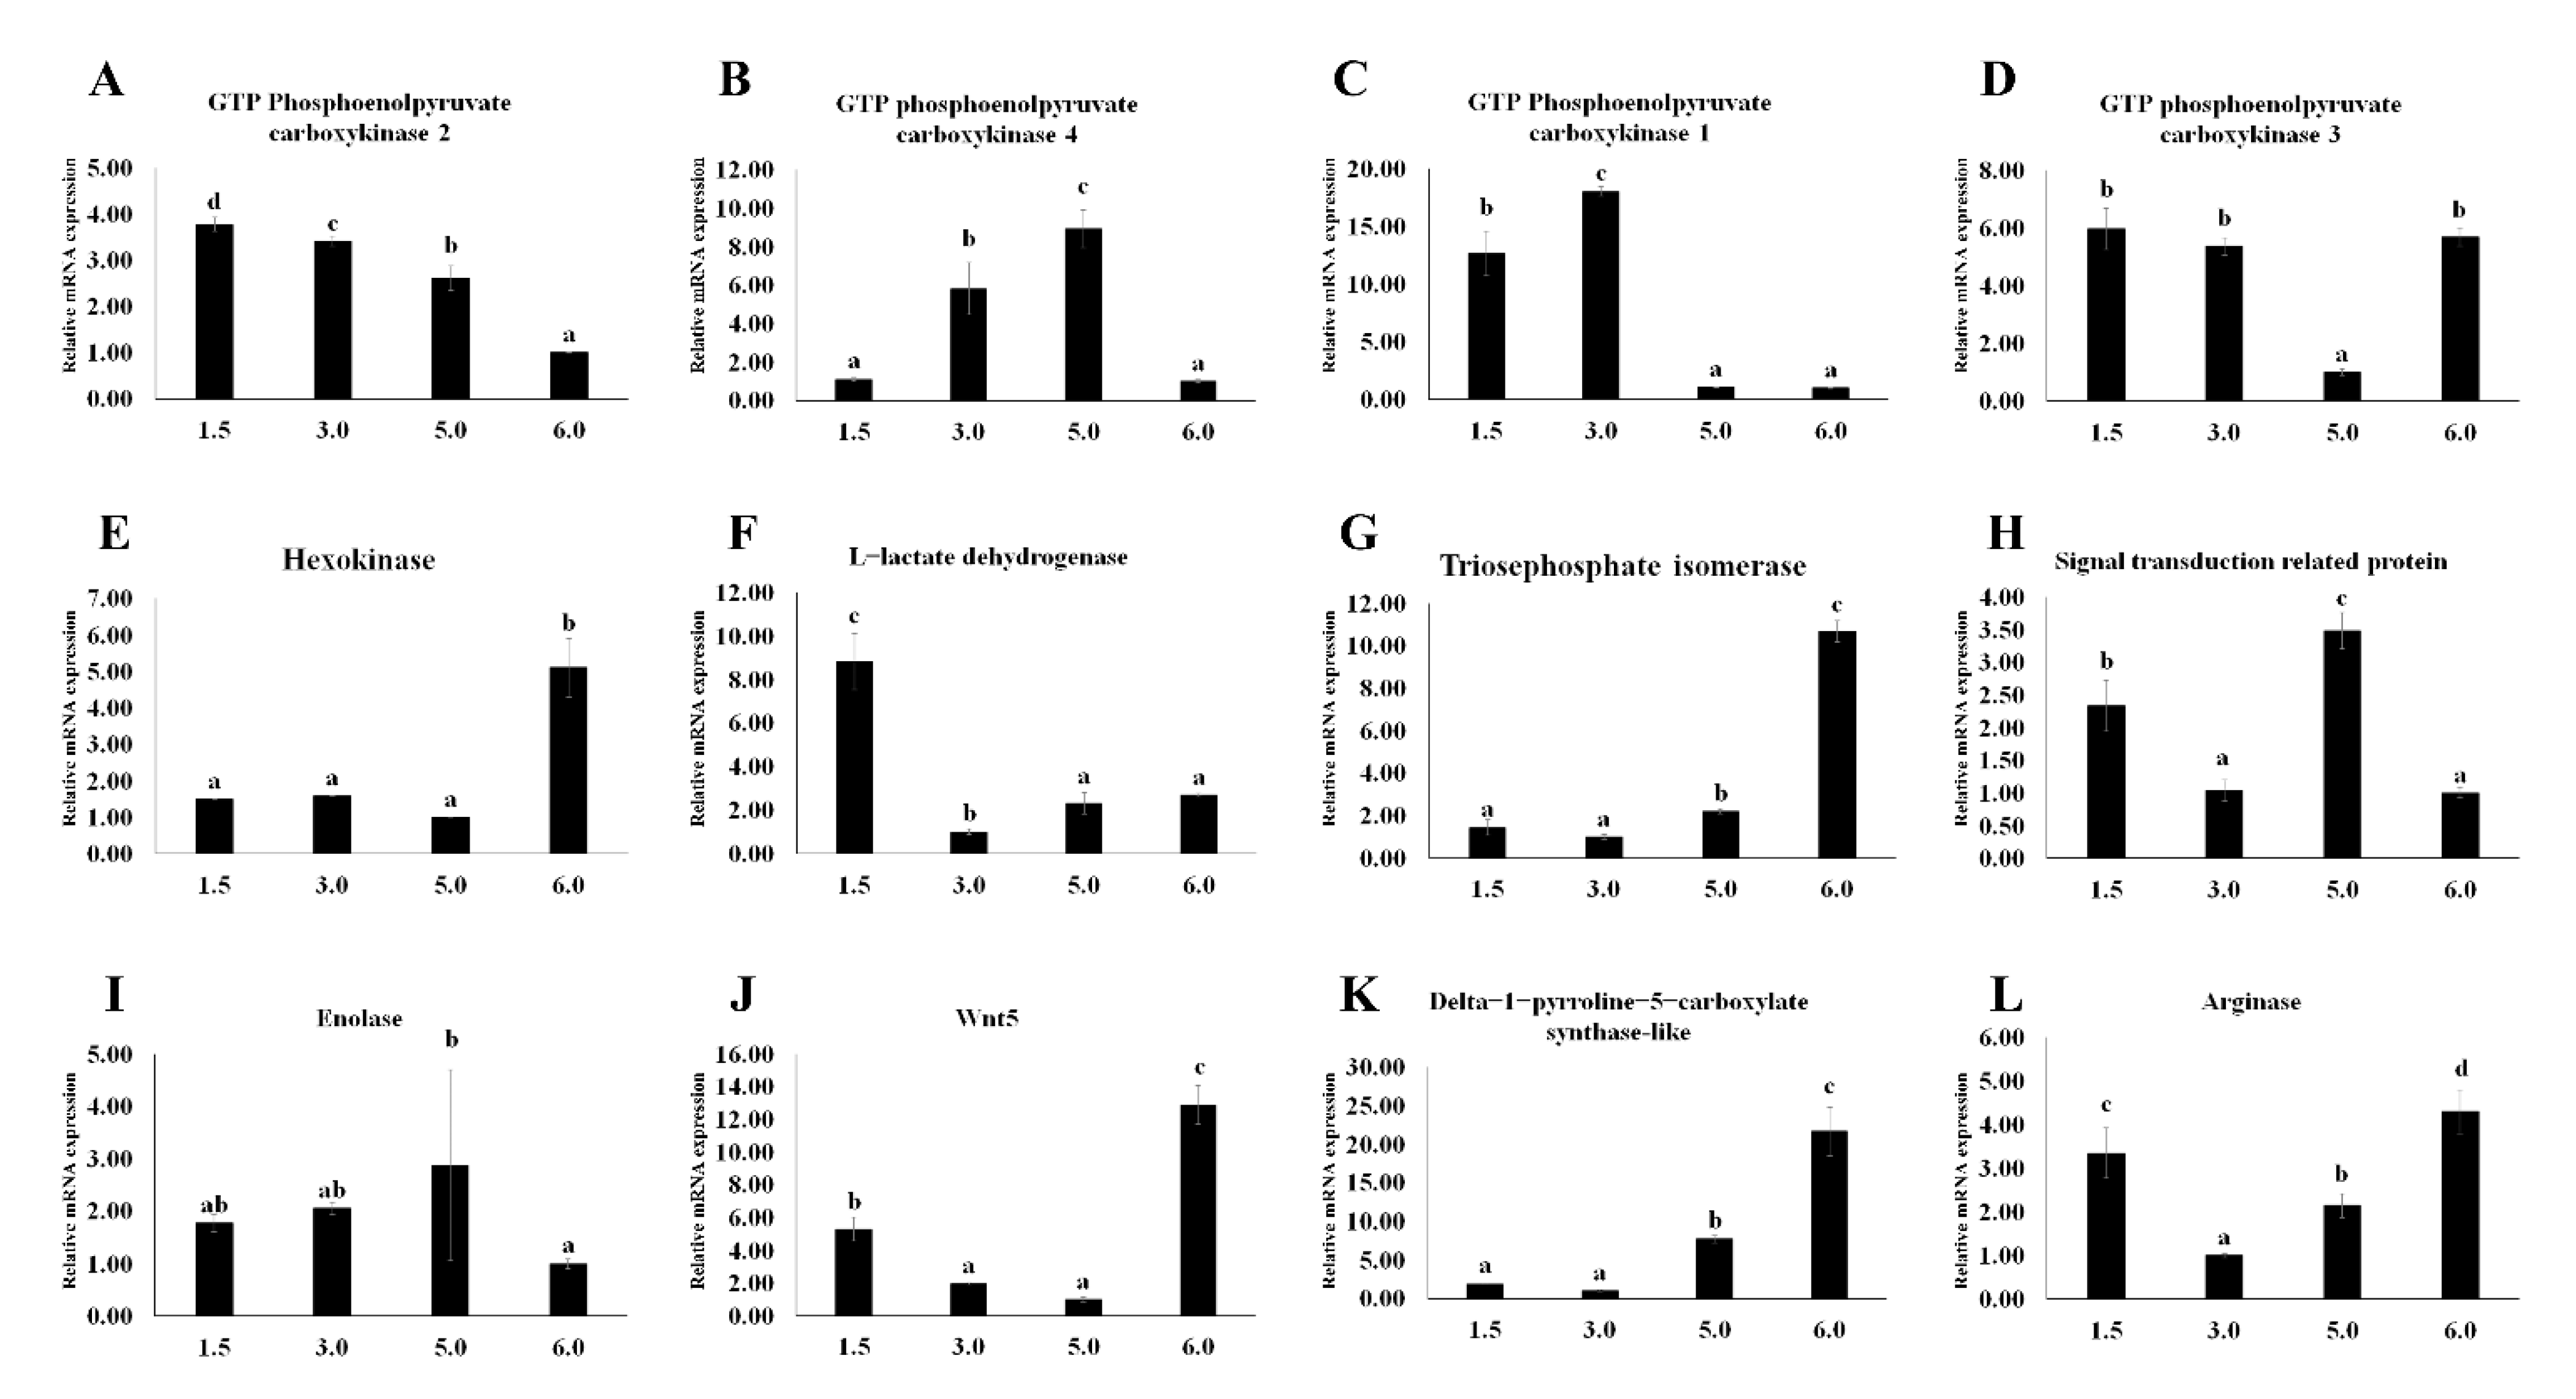
3.4. Gene Expression Validation

According to the result of screening, 18 common differential metabolites were found with relevant annotation. According to the combined analysis with the previous transcriptome database, the metabolites with no related differential gene expression were removed, and the research gradually focused on lactic acid and beta-alanine, which have high differential expression. By retrieving transcriptome data, 12 DEGs were selected to verify the accuracy of the data. The expression trend of these 12 DEGs was consistent with the screened results (Figure 5).

3.5. Subsequent Experimental Verification under Hypoxia

The 12 DEGs mentioned above were also used in subsequent hypoxia experiments. Half of these 12 DEGs showed significant differences between control and other oxygen conditions, including GTP phosphoenolpyruvate carboxykinase-2(Mn-PEPCK2), hexokinase (Mn-HK), triosephosphate isomerase(Mn-TPI), Mn-Wnt5, delta-1-pyrroline-5-carboxylate synthase-like(Mn-P5CS), and arginase(Mn-ARG) (p < 0.05, Figure 6A,E,G,J,K,L). The expression of some DEGs at different oxygen concentrations showed no significant difference between the control group and other groups (p > 0.05, Figure 6B–D,F,H,I). In these DEGs, the expression profiles of Mn-HK and enolase (Mn-ENO) confirmed that there is no significant difference in different hypoxic conditions (p > 0.05, Figure 6E,I).
Compared with the control group, six DEGs showed a trend of first increasing and then decreasing, including Mn-PEPCK1, Mn-PEPCK3, Mn-PEPCK4, Mn-HK, Mn-TPI, and L-lactate dehydrogenase (Mn-LDH) (Figure 7B–G). Even within the same gene family, the expression pattern of Mn-PEPCK2 is different from that of other subtypes. After the decrease of Mn-PEPCK2 expression, an upward trend showed again in the expression profile (Figure 7A). The same trend was also shown in Mn-Wnt5 (Figure 7J). However, the expression pattern of the remaining DEGs was completely opposite to that of the DEGs mentioned above, which first decreased and then increased (Figure 7H,I,K,L).

4. Discussion

The DEMs were divided into two categories according to the level of expression: significantly up-regulated and significantly down-regulated. The top three DEMs were selected for further screening. The DEMs were combined with data from the previous transcriptome libraries, and those were not enriched with DEGs that were removed. Finally, lactic acid and sarcosine were selected as differential metabolites for further experimental analysis. These two metabolites were significantly up-regulated and were highly ranked. Through the joint analysis with the transcriptome, it was found that there were several DEGs in the metabolic pathways of these two metabolites.
Lactic acid is widely known as the main product of anaerobic metabolism. When oxygen is scarce, pyruvate cannot be further oxidized and is reduced to lactic acid, a process called anaerobic fermentation. Previous studies have identified 12 enzymes in the glycolysis pathway that catalyze the anaerobic fermentation of glycogen into lactic acid [26]. In general, the expression level of lactic acid will increase when the tissue cannot obtain enough oxygen or process oxygen fast enough. This trend has also been confirmed in this experiment. It is clearly shown that lactic acid increased in a hypoxic environment. Meanwhile, lactic acid accumulates with the gradual deterioration of survival status (Figure 3B). As the research has developed in this field, Mn-LDH and Mn-ENO, which are directly related to lactate, have become more prominent in the field of vision. Mn-LDH reduces pyruvate to lactic acid under hypoxia, preventing the inhibition of glycolysis and ATP synthesis due to the buildup of pyruvate [27]. It was clearly observed that Mn-LDH decreased with the gradual deterioration of survival status under hypoxia (Figure 5). The same trend was shown in rats [28]. In line with a previous study, Mn-LDH is considered in this study to be the A subtype among the many subtypes of LDH [28]. Compared with the LDH in Eriocheir sinensis (H. Milne Edwards, 1853), which increased gradually after hypoxia, Mn-LDH in M. nipponense decreased six hours after reaching a peak (Figure 7F) [29]. These results suggest that with the deterioration of survival status and the extension of time in hypoxia, large amounts of lactate dehydrogenase are consumed in response to hypoxia. This inference is demonstrated in Figure 7F. When facing a mild and moderate hypoxic environment (3.0 ± 0.2 mg O2 L−1 and 4.5 ± 0.2 mg O2 L−1, respectively), Mn-LDH in M. nipponense can adequately transform the pyruvate accumulation caused by hypoxia. However, Mn-LDH in M. nipponense needs to increase its secretion to reduce the increased pyruvate severe hypoxia (1.5 ± 0.2 mg O2 L−1). This also explain why pyruvate does not appear in the common DEMs of the three groups. Pyruvate was only found in the comparison between the dead group and control groups.
As one of the many downstream genes of the HIF-signaling pathways, ENO increases the tolerance of hypoxia by participating in anaerobic metabolism [30,31]. It was clearly observed that the expression of Mn-ENO significantly increased with the decrease of oxygen concentration (Figure 6, p < 0.05), indicating that ENO plays an important role in promoting the anaerobic metabolism in M. nipponense after hypoxia. The rising trend of Mn-ENO in M. nipponense is the same as it is in Ruditapes philippinarum (Adams et Reeve, 1850) [27]. However, different from R. philippinarum, the expression of Mn-ENO in the hypoxia group was always lower than that in the control group (Figure 7, p < 0.05). Combining the results above, it can be reasonably inferred that when challenged with a hypoxic environment, abundant Mn-ENO in M. nipponense will be preferentially consumed to increase anaerobic metabolism to adapt to the hypoxia. This theory has also been mentioned in human cancer studies [32]. A gene with hypoxia response elements (HRE) that is recognized by HIF as ENO has been, HK has also been studied widely [33]. Although the relationship between HK and HIF has been researched in previous studies by RNA inference technology [34], there is no research about the specific expression profile of HK in M. nipponense under hypoxia. It was clearly observed that Mn-HK increased after 6 h of hypoxia and then decreased (Figure 7E, p < 0.05). This trend also appeared in other crustaceans under different environmental conditions, such as Carcinus maenas (Linnaeus, 1758) and Litopenaeus vannamei (Boone, 1931) during the moult cycle, and L. vannamei under different levels of salinity [35,36,37]. Combined with the result under different hypoxia conditions, it is indicated that Mn-HK will be consumed with the duration of hypoxia, and Mn-HK is considered to be one of the early genes responding to hypoxia.
As an indispensable enzyme in the gluconeogenic pathway, PEPCK has been regarded as essential in humans and mice [38,39]. Interestingly, compared with the previous transcriptome analysis, four PEPCK genes were found in the joint analysis of the metabolome and transcriptome [13]. Although the expression patterns of these Mn-PEPCKs (except Mn-PEPCK3) were different under different hypoxic conditions, the overall trend of the subtypes is that the expression in the hypoxia group is significantly higher than it is in the control group (Figure 6A–D, p < 0.05). Previous experiments have shown that hypoxia could induce gluconeogenesis in the liver of rats and humans through the increase of PEPCK expression under hypoxia [40]. These experiments further demonstrated that gluconeogenesis is regulated by PEPCK [41,42,43]. The same expression patterns also appeared in M. nipponense, indicating that Mn-PEPCK1, Mn-PEPCK2, and Mn-PEPCK4 are involved in promoting gluconeogenesis. However, the expression of Mn-PEPCK3 appeared significant under different time points, indicating that Mn-PEPCK3 is also participating in the adaptation to hypoxia. Therefore, it is reasonable to hypothesize that different subtypes of genes may be activated in response to hypoxia under different conditions. Alternatively, PEPCK may deal with hypoxia by processes other than gluconeogenesis. Recent research has obtained two subtypes of PEPCK in L. vannamei, which showed completely opposite expression profiles in response to hypoxia [44]. These results indicate that Mn-PEPCK3 might be similar to one of these two PEPCK genes and that there are more than two subtypes of Mn-PEPCK in M. nipponense. It should be noted that PEPCK is the only DEG that ranked highly both in transcriptome analysis alone and when combined with metabolome analysis. These results suggest that PEPCK may play an essential role in M. nipponense in their response to hypoxia.
As an important enzyme involved in gluconeogenic, TPI is studied widely. TPI can catalyze the conversion between dihydroxyacetone phosphate and glyceraldehyde-3-phos-phate (G3P) [45]. Previous studies have demonstrated that TPI is an ideal internal standard gene for RT-PCR in Fenneropenaeus chinensis (Osbeck, 1765) under challenges by White Spot Syndrome Virus (WSSV) [46]. However, TPI was very unstable when Penaeus vannamei (Boone, 1931) responded to high temperature [47]. These results indicate that the stability of TPI has significant differences in different populations. It is clearly shown that Mn-TPI increased with the length of hypoxia and increased with the content of oxygen in M. nipponense. This indicates that, compared with TPI in F. chinensis, Mn-TPI is more similar to TPI in P. vannamei. In previous studies, it was found that glycolysis-gluconeogenesis-related enzymes, including triosephosphate isomerase, G3P, LDH, acetyl-coenzyme A (acetyl-CoA), significantly decreased under light conditions. Relevant experiments have confirmed that the synthesis pathway of glycolysis/gluconeogenesis was inhibited [48]. This opposite trend suggested that the synthesis pathway of glycolysis/gluconeogenesis was induced under hypoxia, and Mn-TPI is considered to be used for pyruvate metabolism in response to hypoxia.
Previous studies have suggested that Wnt5 plays various roles in vertebrate development and participates in initiating meiosis for ovarian follicular growth in mammals [49,50,51,52]. However, in invertebrates, Wnt5 shows a completely different function. Six Wnt genes were obtained in L. vannamei, including LvWnt4, LvWnt5, LvWnt6, LvWnt7, LvWnt10, and LvWnt16. It has been proved that LvWnt5 was regulated by WSSV in L. vannamei [53]. In the subsequent study, more Wnt genes were found participating in the immune response in L. vannamei [54]. As a negative regulator of virus-induced innate immune responses [55], Wnt5 was found to be related to hypoxia for the first time in M. nipponense. Compared with the expression patterns of six LvWnts, the expression trend of Mn-Wnt5 is familiar with LvWnt5 in response to WSSV and ammonia–N stress [53,56]. This result indicated that Mn-Wnt5 may be involved in the immune response caused by the accumulation of toxic substances under hypoxia. However, a link between Wnt5 and hypoxia has been discovered before. A previous study had shown that Wnt5 increased significantly under ischemia and reperfusion injury in rat liver BRL-3A cells [57]. The same trend was also observed in ischemic brain damage of newborn rats under hypoxia [58].
P5CS is a mitochondrial enzyme that catalyzes the coupled phosphorylation and reduction-conversion of L-glutamate to delta-1-pyrroline-5-carboxylate (P5C) [59]. P5CS plays an important role in the biosynthesis of proline, ornithine, and arginine [60]. Previous studies have proved that people can develop progressive neurodegeneration due to a deficiency of P5CS [60]. The knockout of P5CS has indicated that it is necessary for mitochondrial respiratory complex organization [61]. With the development of research, P5CS in wheat has been found to respond to changes in salinity in the environment [62]. However, the expression profile of P5CS in wheat is the complete opposite of Mn-P5CS in M. nipponense under hypoxia. This result indicated that P5CS may have several subtypes or it may perform different functions in different species. Although there is no research about P5CS in crustaceans, there are some studies about P5C dehydrogenase (P5CDh) in crustaceans, especially in L. vannamei [63]. Unlike P5CS, which catalyzes the reduction of glutamic acid (Glu) to glutamic-γ-semialdehyde and pyrroline-5-carboxylate, P5CDh converts the latter two to the former [64]. Different from the expression of P5CDh in L. vannamei in response to environmental changes, the expression of P5CS in M. nipponense increased gradually after reaching the lowest level 6 h after hypoxia. Previous studies have found that LvP5CDh plays a key role in immune defense and antioxidant response [63]. These results suggest that P5CS and P5CDh may act as a pair of antagonistic genes to regulate biological homeostasis in response to environmental changes, including changes in oxygen, pH, and salinity.
Arginase (ARG) is an enzyme that can metabolize L-arginine into L-ornithine and it exists widely in various organisms. L-arginine is the substrate for nitric oxide (NO) synthase that generates NO with L-citrulline [65]. In animals with closed tube circulation, endogenous NO maintains vascular integrity by maintaining vasodilator tone and modulating vascular smooth muscle cell proliferation [66,67,68]. Two subtypes of arginase are reported in humans, ARGⅠ and ARGⅡ. ARGⅠ is a cytosolic enzyme that is highly expressed in the living and ARGⅡ is a mitochondrial protein [69]. These two subtypes both exist in the lung [70]. It was clearly observed that ARGⅡ in pulmonary artery smooth muscle cells (PASMC) significantly increased under hypoxia [69]. Subsequent experiments have identified that the silencing of HIF-2, but not HIF-1, prevents the activation of ARGⅡ by hypoxia [71]. Although there are various reports about the relationship between hypoxia and ARG in humans, few studies are related to the involvement of ARG in hypoxia in crustaceans. This manuscript is the first one to propose a relationship between ARG and hypoxia in M. nipponense. Combined with the result that there are two subtypes of HIF-1 in M. nipponense, the focus of subsequent experiments will be understanding the relationship between the two HIF-1s and ARG.

5. Conclusions

In this manuscript, metabolism and transcriptome analyses were combined for the first time to analyze the different physiological states of M. nipponense under hypoxia. Through the screening of common metabolites across three comparisons and in combination with differential genes, 12 genes closely related to hypoxia in M. nipponense were detected. In addition to those widely known in hypoxia, GTP phosphoenolpyruvate carboxykinase, hexokinase, L-lactate dehydrogenase, and triosephosphate isomerase were found in this manuscript. Genes, such as Mn-Wnt5, delta-1-pyrroline-5-carboxylate synthase-like, enolase, and arginase have not previously been proved to be related to hypoxia in crustaceans, or previously found in M. nipponense. This manuscript fills a gap in hypoxia transcriptome analysis and reversely deduces genes related to hypoxia from metabolites. It enriches our understanding of the hypoxia response model of M. nipponense and provides a theoretical basis for the subsequent resolution of apoptosis caused by hypoxia.

Supplementary Materials

The following supporting information can be downloaded at: https://www.mdpi.com/article/10.3390/antiox11010036/s1. Figure S1: Cluster analysis of three comparisons between control and dead group (A), control and moribund group (B), and control and survived group (C) in Macrobrachium nipponense, Table S1: Primers for qRT-PCR.

Author Contributions

Conceptualization, L.X. and H.F.; methodology, L.X. and H.F.; software, L.X. and Y.G.; validation, L.X.; formal analysis, L.X.; investigation, L.X.; resources, S.J. (Sufei Jiang) and Y.X.; data curation, L.X.; writing—original draft preparation, L.X.; writing—review and editing, H.F., H.Q. and S.J. (Shubo Jin); visualization, L.X. and H.F.; supervision, H.F. and W.Z.; project administration, H.F., H.Q. and W.Z.; funding acquisition, H.F. All authors have read and agreed to the published version of the manuscript.

Funding

This research was supported by grants from the National Key R&D Program of China (2018YFD0901303); Central Public-interest Scientific Institution Basal Research Fund CAFS (2020TD36); Jiangsu Agricultural Industry Technology System; the China Agriculture Research System-48 (CARS-48); the New cultivar breeding Major Project of Jiangsu province (PZCZ201745).

Institutional Review Board Statement

All experimental protocols, methods were approved in October 2019 (Authorization NO. 20191015006) by the Animal Care and Use Ethics Committee in the Freshwater Fisheries Research Center (Wuxi, China).

Informed Consent Statement

Not applicable.

Data Availability Statement

Data is contained within the article and supplementary materials.

Acknowledgments

Thank you for the Jiangsu Province Platform for the Conservation and Utilization of Agricultural Germplasm.

Conflicts of Interest

The authors declare no conflict of interest.

References

  1. Garlo, E.V.; Milstein, C.B.; Jahn, A.E. Impact of hypoxic conditions in the vicinity of little egg inlet, New Jersey in summer 1976. Estuar. Coast. Mar. Sci. 1979, 8, 421–432. [Google Scholar] [CrossRef]
  2. Xu, Q.; Zhang, C.; Zhang, D.; Jiang, H.; Peng, S.; Liu, Y.; Zhao, K.; Wang, C.; Chen, L. Analysis of the erythropoietin of a tibetan plateau schizothoracine fish (Gymnocypris dobula) reveals enhanced cytoprotection function in hypoxic environments. BMC Evol. Biol. 2016, 16, 11. [Google Scholar] [CrossRef] [Green Version]
  3. Law, S.H.; Wu, R.S.; Ng, P.K.; Richard, M.; Kong, R.Y. Cloning and expression analysis of two distinct HIF-alpha isoforms–gcHIF-1alpha and gcHIF-4alpha–from the hypoxia-tolerant grass carp, Ctenopharyngodon idellus. BMC Mol. Biol. 2006, 7, 15. [Google Scholar] [CrossRef] [Green Version]
  4. Rojas, D.A.; Perez-Munizaga, D.A.; Centanin, L.; Antonelli, M.; Wappner, P.; Allende, M.L.; Reyes, A.E. Cloning of hif-1a and hif-2a and mRNA expression pattern during development in zebrafish. Gene Expr. Patterns 2007, 7, 339–345. [Google Scholar] [CrossRef]
  5. Saydur Rahman, M.; Thomas, P. Molecular cloning, characterization and expression of two hypoxia-inducible factor alpha subunits, HIF-1αa and HIF-2α, in a hypoxia-tolerant marine teleost, Atlantic croaker (Micropogonias undulatus). Gene 2007, 396, 273–282. [Google Scholar] [CrossRef] [PubMed]
  6. Chen, N.; Chen, L.P.; Zhang, J.; Chen, C.; Wei, X.L.; Gul, Y.; Wang, W.M.; Wang, H.L. Molecular characterization and expression analysis of three hypoxia-inducible factor alpha subunits, HIF-1a/2a/3a of the hypoxia-sensitive freshwater species, Chinese sucker. Gene 2012, 498, 81–90. [Google Scholar] [CrossRef] [PubMed]
  7. Xu, L.; Yang, M.; Fu, H.; Sun, S.; Qiao, H.; Zhang, W.; Gong, Y.; Jiang, S.; Xiong, Y.; Jin, S. Molecular cloning, expression, and in situ hybridization analysis of MnGPx-3 and MnGPx-4 from oriental river prawn, Macrobrachium nipponense, in response to hypoxia and reoxygenation. PLoS ONE 2020, 15, e0229171. [Google Scholar] [CrossRef] [PubMed] [Green Version]
  8. Xu, L.; Yang, M.; Fu, H.; Sun, S.; Qiao, H.; Zhang, W.; Gong, Y.; Jiang, S.; Xiong, Y.; Jin, S. Molecular cloning and expression of MnGST-1 and MnGST-2 from oriental river prawn, Macrobrachium nipponense, in response to hypoxia and reoxygenation. Int. J. Mol. Sci. 2018, 19, 3102. [Google Scholar] [CrossRef] [PubMed] [Green Version]
  9. Chen, C.F.; Tsai, S.Y.; Ma, M.C.; Wu, M.S. Hypoxic preconditioning enhances renal superoxide dismutase levels in rats. J. Physiol. 2003, 552, 561–569. [Google Scholar] [CrossRef]
  10. Metzker, M.L. Sequencing technologies—the next generation. Nat. Rev. Genet. 2010, 11, 31–46. [Google Scholar] [CrossRef] [PubMed] [Green Version]
  11. Saetan, W.; Ye, M.; Lin, X.; Zhang, Y.; Huang, Y.; Du, T.; Li, G.; Tian, C. Comparative transcriptome analysis of heart tissue in response to hypoxia in Silver Sillago (Sillago sihama). J. Ocean Univ. China 2021, 20, 949–958. [Google Scholar] [CrossRef]
  12. Shi, W.; Wang, P.; Hu, R.; Wan, X.; Shen, H.; Li, H.; Wang, L.; Qiao, Y.; Jiang, G.; Cheng, J.; et al. Transcriptome analysis reveals hub genes in the hepatopancreas of Exopalaemon carinicauda in response to hypoxia and reoxygenation. Aqu. Int. 2021, 1–27. [Google Scholar] [CrossRef]
  13. Xu, L.; Fu, Y.; Fu, H.; Zhang, W.; Qiao, H.; Jiang, S.; Xiong, Y.; Jin, S.; Gong, Y.; Wang, Y.; et al. Transcriptome analysis of hepatopancreas from different living states oriental river prawn (Macrobrachium nipponense) in response to hypoxia. Comp. Biochem. Physiol. Part D 2021, 40, 100902. [Google Scholar] [CrossRef] [PubMed]
  14. Xu, Y.; Miao, Z.; Li, X.; Lin, H.; Cheng, Y.; Pan, J.; Xu, Z. Hypoxia-reoxygenation stress modulates the hepatopancreas transcriptome of Chinese mitten crab Eriocheir sinensis. Gene 2021, 771, 145361. [Google Scholar] [CrossRef] [PubMed]
  15. Sun, X.; Tu, K.; Li, L.; Wu, B.; Wu, L.; Liu, Z.; Zhou, L.; Tian, J.; Yang, A. Integrated transcriptome and metabolome analysis reveals molecular responses of the clams to acute hypoxia. Mar. Environ. Res. 2021, 168, 105317. [Google Scholar] [CrossRef] [PubMed]
  16. Yang, T.; Yuan, G.; Zhang, Q.; Xuan, L.; Li, J.; Zhou, L.; Shi, H.; Wang, X.; Wang, C. Transcriptome and metabolome analyses reveal the pivotal role of hydrogen sulfide in promoting submergence tolerance in Arabidopsis. Environ. Exp. Bot. 2021, 183, 104365. [Google Scholar] [CrossRef]
  17. Su, L.; Yang, C.; Meng, J.; Zhou, L.; Zhang, C. Comparative transcriptome and metabolome analysis of Ostrinia furnacalis female adults under UV-A exposure. Sci. Rep. 2021, 11, 1–14. [Google Scholar] [CrossRef] [PubMed]
  18. Peixoto, A.; Freitas, R.; Ferreira, D.; Relvas-Santos, M.; Paulo, P.; Cardoso, M.; Soares, J.; Gaiteiro, C.; Palmeira, C.; Teixeira, F.; et al. Metabolomics, transcriptomics and functional glycomics reveals bladder cancer cells plasticity and enhanced aggressiveness facing hypoxia and glucose deprivation. bioRxiv 2021. [Google Scholar] [CrossRef]
  19. Yang, M.; Sun, S.; Fu, H.; Qiao, H.; Zhang, W.; Gong, Y.; Jiang, S.; Xiong, Y.; Xu, L.; Zhao, C.; et al. Hypoxia and reoxygenation on antioxidant enzyme activities and histological structure of Macrobrachium nipponense. J. Fish Sci. China 2019, 26, 493–503. [Google Scholar] [CrossRef]
  20. Sun, S.; Xuan, F.; Fu, H.; Zhu, J.; Ge, X.; Gu, Z. Transciptomic and histological analysis of hepatopancreas, muscle and gill tissues of oriental river prawn (Macrobrachium nipponense) in response to chronic hypoxia. BMC Genom. 2015, 16, 491. [Google Scholar] [CrossRef] [Green Version]
  21. Sun, S.; Xuan, F.; Ge, X.; Fu, H.; Zhu, J.; Zhang, S. Identification of differentially expressed genes in hepatopancreas of oriental river prawn, Macrobrachium nipponense exposed to environmental hypoxia. Gene 2014, 534, 298–306. [Google Scholar] [CrossRef]
  22. Chen, W.; Gong, L.; Guo, Z.; Wang, W.; Zhang, H.; Liu, X.; Yu, S.; Xiong, L.; Luo, J. A Novel Integrated Method for Large-Scale Detection, Identification, and Quantification of Widely Targeted Metabolites: Application in the Study of Rice Metabolomics. Mol. Plant 2013, 6, 1769–1780. [Google Scholar] [CrossRef] [PubMed] [Green Version]
  23. Garcia, A.; Barbas, C. Gas chromatography-mass spectrometry (GC-MS)-based metabolomics. Metab. Profiling Hum. Press 2011, 191–204. [Google Scholar] [CrossRef]
  24. Hu, Y.; Fu, H.; Qiao, H.; Sun, S.; Zhang, W.; Jin, S.; Jiang, S.; Gong, Y.; Xiong, Y.; Wu, Y. Validation and evaluation of reference genes for quantitative real-time PCR in Macrobrachium nipponense. Int. J. Mol. Sci. 2018, 19, 2258. [Google Scholar] [CrossRef] [Green Version]
  25. Li, F.; Qiao, H.; Fu, H.; Sun, S.; Zhang, W.; Jin, S.; Jiang, S.; Gong, Y.; Xiong, Y.; Wu, Y.; et al. Identification and characterization of opsin gene and its role in ovarian maturation in the oriental river prawn Macrobrachium nipponense. Comp. Biochem. Physiol. Part B 2018, 218, 1–12. [Google Scholar] [CrossRef] [PubMed]
  26. Webster, K.A. Evolution of the coordinate regulation of glycolytic enzyme genes by hypoxia. J. Exp. Biol. 2003, 206, 2911–2922. [Google Scholar] [CrossRef] [Green Version]
  27. Nie, H.; Wang, H.; Jiang, K.; Yan, X. Transcriptome analysis reveals differential immune related genes expression in Ruditapes philippinarum under hypoxia stress: Potential HIF and NF-κB crosstalk in immune responses in clam. BMC Genom. 2020, 21, 1–16. [Google Scholar] [CrossRef] [Green Version]
  28. McClelland, G.B.; Brooks, G.A. Changes in MCT 1, MCT 4, and LDH expression are tissue specific in rats after long-term hypobaric hypoxia. J. Appl. Physiol. 2002, 92, 1573–1584. [Google Scholar] [CrossRef] [PubMed] [Green Version]
  29. Bao, J.; Li, X.; Yu, H.; Jiang, H. Respiratory metabolism responses of Chinese mitten crab, Eriocheir sinensis and Chinese grass shrimp, Palaemonetes sinensis, subjected to environmental hypoxia stress. Front. Physiol. 2018, 9, 1559. [Google Scholar] [CrossRef] [PubMed]
  30. Pancholi, V. Multifunctional alpha-enolase: Its role in diseases. Cell Mol. Life Sci. 2001, 58, 902–920. [Google Scholar] [CrossRef] [PubMed]
  31. Semenza, G.L.; Jiang, B.H.; Leung, S.W.; Passantino, R.; Concordet, J.; Maire, P.; Giallongo, A. Hypoxia response elements in the aldolase A.; enolase 1, and lactate dehydrogenase A gene promoters contain essential binding sites for hypoxia-inducible factor 1. J. Biol. Chem. 1996, 271, 32529–32537. [Google Scholar] [CrossRef] [Green Version]
  32. Sedoris, K.C.; Thomas, S.D.; Miller, D.M. Hypoxia induces differential translation of enolase/MBP-1. BMC Cancer 2010, 10, 1–14. [Google Scholar] [CrossRef] [Green Version]
  33. Riddle, S.R.; Ahmad, A.; Ahmad, S.; Deeb, S.S.; Malkki, M.; Schneider, B.K.; Allen, C.B.; White, C.W. Hypoxia induces hexokinase II gene expression in human lung cell line A549. Am. J. Physiol. Lung Cell Mol. Physiol. 2000, 278, L407–L416. [Google Scholar] [CrossRef] [PubMed] [Green Version]
  34. Sun, S.; Xuan, F.; Fu, H.; Zhu, J.; Ge, X. Molecular cloning and functional characterization of a hexokinase from the oriental river prawn Macrobrachium nipponense in response to hypoxia. Int. J. Mol. Sci. 2017, 18, 1256. [Google Scholar] [CrossRef] [PubMed] [Green Version]
  35. Rosas, C.; Cuzon, G.; Gaxiola, G.; Le Priol, Y.; Pascual, C.; Rossignyol, J.; Contreras, F.; Sa’nchez, A.; van Wormhoudt, A. Metabolism and growth of juveniles of Litopenaeus vannamei: Effect of salinity and dietary carbohydrates level. J. Exp. Mar. Biol. Ecol. 2001, 259, 1–22. [Google Scholar] [CrossRef]
  36. Rossignol, F.; Solares, M.; Balanza, E.; Coudert, J.; Clottes, E. Expression of lactate dehydrogenase A and B genes in different tissues of rats adapted to chronic hypobaric hypoxia. J. Cell. Biochem. 2003, 89, 67–79. [Google Scholar] [CrossRef] [PubMed]
  37. Gaxiola, G.; Cuzon, G.; Garcia, T.; Taboada, G.; Brito, R.; Chimal, M.E.; Paredes, A.; Soto, L.; Rosas, C.; van Wormhoudt, A. Factorial effects of salinity, dietary carbohydrate and moult cycle on digestive carbohydrases and hexokinases in Litopenaeus vannamei (Boone, 1931). Comp. Biochem. Physiol. A 2005, 140, 29–39. [Google Scholar] [CrossRef] [PubMed]
  38. Leegood, R.C.; Walker, R.P. Regulation and roles of phosphoenolpyruvate carboxykinase in plants. Arch. Biochem. Biophys. 2003, 414, 204–210. [Google Scholar] [CrossRef]
  39. Westermeier, F.; Holyoak, T.; Gatica, R.; Martínez, F.; Negron, Ḿ.; Yánez, Ã.J.; Nahmias, D.; Nualart, F.; Burbulis, I.; Bertinat, R. Cytosolic phosphoenolpyruvate carboxykinase is expressed in a-cells from human and murine pancreas. J. Cell. Physiol. 2020, 235, 166–175. [Google Scholar] [CrossRef]
  40. Hara, Y.; Watanabe, N. Changes in expression of genes related to glucose metabolism in liver and skeletal muscle of rats exposed to acute hypoxia. Heliyon 2020, 6, e04334. [Google Scholar] [CrossRef] [PubMed]
  41. Martin-Requero, A.; Ayuso, M.S.; Parrilla, R. Rate-limiting steps for hepatic gluconeogenesis mechanism of oxamate inhibition of mitochondrial pyruvate metabolism. J. Biol. Chem. 1986, 261, 13973–13978. [Google Scholar] [CrossRef]
  42. Gabbay, R.A.; Sutherland, C.; Gnudi, L.; Kahn, B.B.; O’brien, R.M.; Granner, D.K.; Flier, J.S. Insulin regulation of phosphoenolpyruvate carboxykinase gene expression does not require activation of the Ras/mitogen-activated protein kinase signaling pathway. J. Biol. Chem. 1996, 271, 1890–1897. [Google Scholar] [CrossRef] [PubMed] [Green Version]
  43. Owczarek, A.; Gieczewska, K.; Jarzyna, R.; Jagielski, A.K.; Kiersztan, A.; Gruza, A.; Winiarska, K. Hypoxia increases the rate of renal gluconeogenesis via hypoxia-inducible factor-1-dependent activation of phosphoenolpyruvate carboxykinase expression. Biochimie 2020, 171, 31–37. [Google Scholar] [CrossRef] [PubMed]
  44. Reyes-Ramos, C.A.; Peregrino-Uriarte, A.B.; Cota-Ruiz, K.; Valenzuela-Soto, E.M.; Leyva Carrillo, L.; Yepiz-Plascencia, G. Phosphoenolpyruvate carboxykinasecytosolic and mitochondrial isoforms are expressed and active during hypoxia in thewhite shrimp Litopenaeus vannamei. Comp. Biochem. Physiol. B Biochem. Mol.Biol. 2018, 226, 1–9. [Google Scholar] [CrossRef] [PubMed]
  45. Wierenga, R.K.; Kapetaniou, E.G.; Venkatesan, R. Triosephosphate isomerase: A highly evolved biocatalyst. Cell Mol Life Sci. 2010, 67, 3961–9682. [Google Scholar] [CrossRef]
  46. Wang, B.; Li, F.; Dong, B.; Zhang, X.; Zhang, C.; Xiang, J. Discovery of the genes in response to white spot syndrome virus (WSSV) infection in Fenneropenaeus chinensis through cDNA microarray. Mar. Biotechnol. 2006, 8, 491–500. [Google Scholar] [CrossRef] [PubMed]
  47. Lopez-Zavala, A.A.; Carrasco-Miranda, J.S.; Ramirez-Aguirre, C.D.; López-Hidalgo, M.; Benitez-Cardoza, C.G.; Ochoa-Leyva, A.; Cardona-Felix, C.S.; Diaz-Quezada, C.; Rudiño-Piñera, E.; SoteloMundo, R.R.; et al. Structural insights from a novel invertebrate triosephosphate isomerase from Litopenaeus Vannamei. Biochim. Biophys. Acta BBA-Proteins Proteom. 2016, 1864, 1696–1706. [Google Scholar] [CrossRef] [Green Version]
  48. Li, N.; Zhou, J.; Wang, H.; Mu, C.; Shi, C.; Liu, L.; Wang, C. Transcriptome analysis of genes and pathways associated with metabolism in Scylla paramamosain under different light intensities during indoor overwintering. BMC Genom. 2020, 21, 1–15. [Google Scholar] [CrossRef]
  49. Prathibha, Y.; Senthilkumaran, B. Expression of wnt4/5 during reproductive cycle of catfish and wnt5 promoter analysis. J. Endocrinol. 2017, 232, 1–13. [Google Scholar] [CrossRef] [PubMed]
  50. Kim, H.; Schleiffarth, J.; Jessurun, J.; Sumanas, S.; Petryk, A.; Lin, S.; Ekker, S. Wnt5 signaling in vertebrate pancreas development. BMC Biol. 2005, 3, 23. [Google Scholar] [CrossRef] [PubMed] [Green Version]
  51. Huang, L.; Xiao, A.; Choi, S.Y.; Kan, Q.; Zhou, W.; Chacon-Heszele, M.F.; Ryu, Y.K.; McKenna, S.; Zuo, X.; Kuruvilla, R.; et al. Wnt5a is necessary for normal kidney development in zebrafish and mice. Nephron Exp. Nephrol. 2014, 128, 80–88. [Google Scholar] [CrossRef] [PubMed]
  52. Kilian, B.; Mansukoski, H.; Barbosa, F.; Ulrich, F.; Tada, M.; Heisenberg, C. The role of Ppt/Wnt5 in regulating cell shape and movement during zebrafish gastrulation. Mech. Dev. 2003, 120, 467–476. [Google Scholar] [CrossRef] [PubMed]
  53. Zhang, S.; Li, C.Z.; Yang, Q.H.; Dong, X.; Chi, S.; Liu, H.; Shi, L.; Tan, B. Molecular cloning, characterization and expression analysis of Wnt4, Wnt5, Wnt6, Wnt7, Wnt10 and Wnt16 from Litopenaeus Vannamei. Fish Shellfish. Immunol. 2016, 54, 445–455. [Google Scholar] [CrossRef]
  54. Du, J.; Zhang, X.; Yuan, J.; Zhang, X.; Li, F.; Xiang, J. Wnt gene family members and their expression profiling in Litopenaeus Vannamei. Fish Shellfish. Immunol. 2018, 77, 233–243. [Google Scholar] [CrossRef]
  55. Baril, M.; Es-Saad, S.; Chatel-Chaix, L.; Fink, K.; Pham, T.; Raymond, V.A.; Audette, K.; Guenier, A.; Duchaine, J.; Servant, M.; et al. Genome-wide RNAi screen reveals a new role of a WNT/CTNNB1 signalingpathway as negative regulator of virus-induced innate immune responses. PLoS Pathog. 2013, 9, e1003416. [Google Scholar] [CrossRef] [Green Version]
  56. Zhang, X.; Pan, L.; Wei, C.; Tong, R.; Li, Y.; Ding, M.; Wang, H. Crustacean hyperglycemic hormone (CHH) regulates the ammonia excretion and metabolism in white shrimp, Litopenaeus vannamei under ammonia-N stress. Sci. Total Environ. 2020, 723, 138128. [Google Scholar] [CrossRef]
  57. Hu, X.; Zhou, C.; He, G.; Cheng, Y.; Pan, M.; Gao, Y. Inhibition of Frizzled-2 by small interfering RNA protects rat hepatic BRL-3A cells against cytotoxicity and apoptosis induced by Hypoxia/Reoxygenation. Gastroenterol. Y Hepatol. 2020, 43, 107–116. [Google Scholar] [CrossRef] [PubMed]
  58. Shi, J.; Tang, J.; Mu, D.Z. Bioinformatic Analysis of Differentially Expressed Genes Involved in the Post-hypoxic Ischemic Brain Damage of Newborn Rats. J. Sichuan Univ. 2016, 47, 722–726. [Google Scholar]
  59. Hu, C.A.A.; Khalil, S.; Zhaorigetu, S.; Liu, Z.; Tyler, M.; Wan, G.; Valle, D. Human Δ 1-pyrroline-5-carboxylate synthase: Function and regulation. Amino Acids 2008, 35, 665–672. [Google Scholar] [CrossRef] [Green Version]
  60. Baumgartner, M.R.; Rabier, D.; Nassogne, M.-C.; Dufier, J.-L.; Padovani, J.-P.; Kamoun, P.; Valle, D.; Saudubray, J.-M. Δ1-pyrroline-5-carboxylate synthase deficiency: Neurodegeneration, cataracts and connective tissue manifestations combined with hyperammonaemia and reduced ornithine, citrulline, arginine and proline. Eur. J. Pediatrics 2005, 164, 31–36. [Google Scholar] [CrossRef]
  61. Yang, Z.; Zhao, X.; Shang, W.; Liu, Y.; Ji, J.F.; Liu, J.P.; Tong, C. Pyrroline-5-carboxylate synthase senses cellular stress and modulates metabolism by regulating mitochondrial respiration. Cell Death Differ. 2021, 28, 303–319. [Google Scholar] [CrossRef] [PubMed]
  62. Goharrizi, K.J.; Baghizadeh, A.; Afroushteh, M.; Amirmahani, F.; Kermani, S.G. Effects of salinity stress on proline content and expression of Δ1-pyrroline-5-carboxylate synthase and vacuolar-type H+ subunit E genes in wheat. Plant Genet. Resour. 2020, 18, 334–342. [Google Scholar] [CrossRef]
  63. Liang, Q.J.; Wu, X.J.; Yang, P.; Kong, J.; Wei, W.; Qiao, X.; Liu, Y.; Wang, W. The role of delta-1-pyrroline-5-carboxylate dehydrogenase (P5CDh) in the Pacific white shrimp (Litopenaeus vannamei) during biotic and abiotic stress. Aquat. Toxicol. 2019, 208, 1–11. [Google Scholar] [CrossRef] [PubMed]
  64. Hu, C.A.; Hou, Y. Mammalian P5CR and P5CDH protein structure and disease associationc. Am. For. 2014, 1, 1935–1937. [Google Scholar] [CrossRef]
  65. Palmer, R.; Ashton, A.; Moncada, S. Vascular endothelial cells synthesize nitric oxide from l-arginine. Nature 1998, 333, 664–666. [Google Scholar] [CrossRef]
  66. Ignarro, L.F.; Buga, G.M.; Wei, L.H.; Bauer, P.M.; Wu, G.; del Soldato, P. Role of the arginine-nitric oxide pathway in the regulation of vascular smooth muscle cell proliferation. Proc. Natl. Acad. Sci. USA 2001, 98, 4202–4208. [Google Scholar] [CrossRef] [Green Version]
  67. Kourembanas, S.; McQuillan, L.P.; Leung, G.K.; Faller, D.V. Nitric oxide regulates the expression of vasoconstrictors and growth factors by vascular endothelium under both normoxia and hypoxia. J. Clin. Investig. 1993, 92, 99–104. [Google Scholar] [CrossRef] [PubMed]
  68. Pietra, G.G.; Capron, F.; Stewart, S.; Leone, O.; Humbert, M.; Robbins, I.M.; Reid, L.M.; Tuder, R. Pathologic assessment of vasculopathies in pulmonary hypertension. J. Am. Coll. Cardiol. 2004, 43, 25S–32S. [Google Scholar] [CrossRef] [PubMed] [Green Version]
  69. Chen, B.; Calvert, A.E.; Cui, H.; Nelin, L.D. Hypoxia promotes human pulmonary artery smooth muscle cell proliferation through induction of arginase. Am. J. Physiol.-Lung Cell. Mol. Physiol. 2009, 297, L1151–L1159. [Google Scholar] [CrossRef] [Green Version]
  70. Nelin, L.D.; Chicoine, L.G.; Reber, K.M.; English, B.K.; Young, T.L.; Liu, Y. Cytokine-induced endothelial arginase expression is dependent on epidermal growth factor receptor. Am. J. Respir. Cell. Mol. Biol. 2005, 33, 394–401. [Google Scholar] [CrossRef] [Green Version]
  71. Ino, Y.; Yamazaki-Itoh, R.; Oguro, S.; Shimada, K.; Kosuge, T.; Zavada, J.; Kanai, Y.; Hiraoka, N. Arginase II expressed in cancer-associated fibroblasts indicates tissue hypoxia and predicts poor outcome in patients with pancreatic cancer. PLoS ONE 2013, 8, e55146. [Google Scholar] [CrossRef] [PubMed] [Green Version]
Figure 1. PCA analysis of all the samples (A). PCA analysis of specific samples from dead group (B), moribund group (C), and survived group (D) of Macrobrachium nipponense.
Antioxidants 11 00036 g001
Figure 2. Volcanic map of differential metabolites from three comparisons between control and dead group (A), control and moribund group (B), and control and group (C) of Macrobrachium nipponense. The x- and y-axis are the log2-fold change and the log10 p-value of student’s T test between the two compared groups. Red points represent up-regulated metabolites. Green points represent down-regulated metabolites. Black points represent detected but insignificant differences.
Antioxidants 11 00036 g002
Figure 3. Venn diagram of different metabolites in each group (A) and expression of common differential metabolites in three comparisons (B) examined in Macrobrachium nipponense.
Antioxidants 11 00036 g003
Figure 4. KEGG enrichment of different metabolites between control and dead group (A), control and moribund group (B), and control and survived group (C) in Macrobrachium nipponense.
Antioxidants 11 00036 g004
Figure 5. Metabolism validation of selected genes by RNA-seq (A) and qRT-PCR (B) in Macrobrachium nipponense.
Antioxidants 11 00036 g005
Figure 6. Expression of selected genes in different oxygen concentrations in Macrobrachium nipponense by qRT-PCR. (A): Mn-PEPCK2, (B): Mn-PEPCK4, (C): Mn-PEPCK1, (D): Mn-PEPCK3, (E) Mn-HK, (F) Mn-LDH, (G) Mn-TPI, (H) Mn-STP, (I) Mn-ENO, (J) Mn-Wnt5, (K) Mn-P5CS, (L) Mn-ARG. Data are shown as means ± SD of three replicates in various tissues. Statistical analyses are shown with one-way ANOVA. Different letters indicate a significant difference of the same gene in different tissues (p < 0.05).
Antioxidants 11 00036 g006
Figure 7. Expression of selected genes in Macrobrachium nipponense at different time points under hypoxia by qRT-PCR. (A): Mn-PEPCK2, (B): Mn-PEPCK4, (C): Mn-PEPCK1, (D): Mn-PEPCK3, (E) Mn-HK, (F) Mn-LDH, (G) Mn-TPI, (H) Mn-STP, (I) Mn-ENO, (J) Mn-Wnt5, (K) Mn-P5CS, (L) Mn-ARG. Data are shown as means ± SD of three replicates in various tissues. Statistical analyses are shown with paired t test. Data indicated with asterisks are significantly different (p < 0.05) between treatment and control groups.
Antioxidants 11 00036 g007
Table 1. Number of significantly different metabolites down-regulated (Down) and up-regulated (Up) in different comparisons examined in Macrobrachium nipponense.
All Different MetabolitesDownUpNumber of Pathways
Control vs. Dead108763281
Control vs. Moribund86612537
Control vs. Survived48321635
Publisher’s Note: MDPI stays neutral with regard to jurisdictional claims in published maps and institutional affiliations.

