
Reduced Liver Autophagy in High-Fat Diet Induced Liver Steatosis in New Zealand Obese Mice

 , ,
, ,  and
and 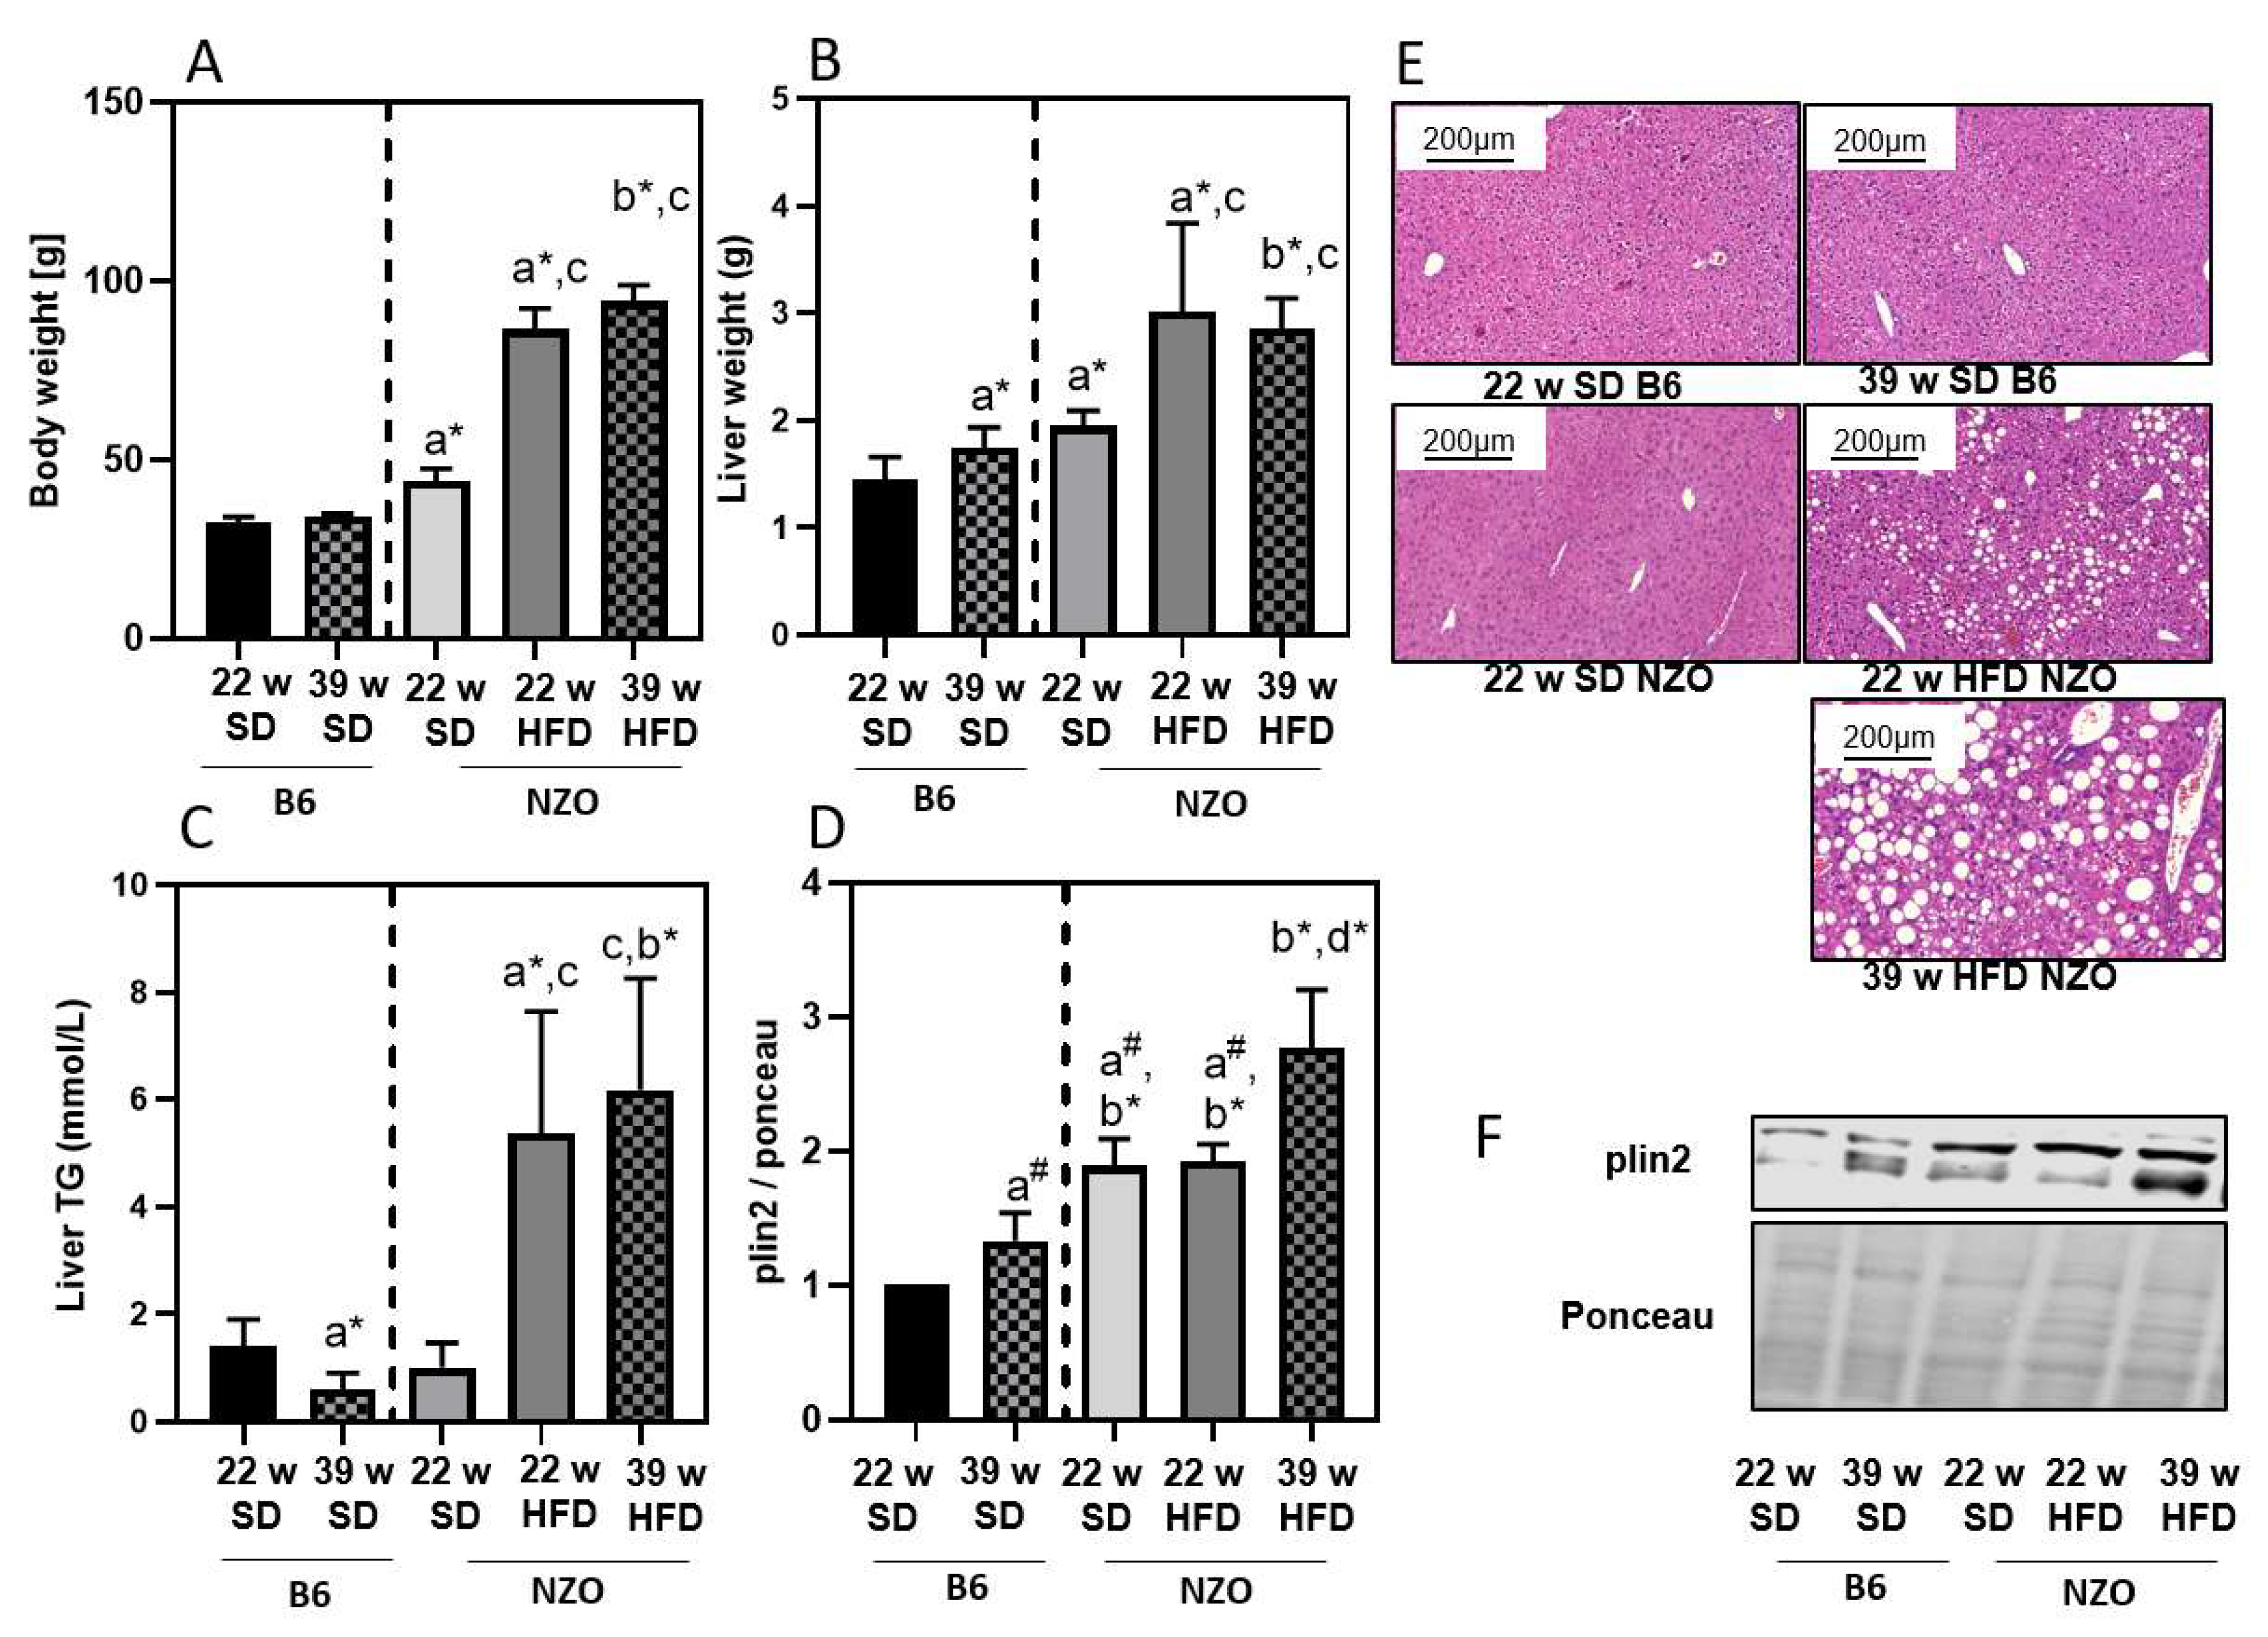
Abstract
1. Introduction
2. Methods
2.1. Animal Experimental Procedure
2.2. Immunoblotting
2.3. Immunohistochemistry: H/E Staining
2.4. Proteasomal Activity
2.5. Lysosomal Activity
2.6. Statistics
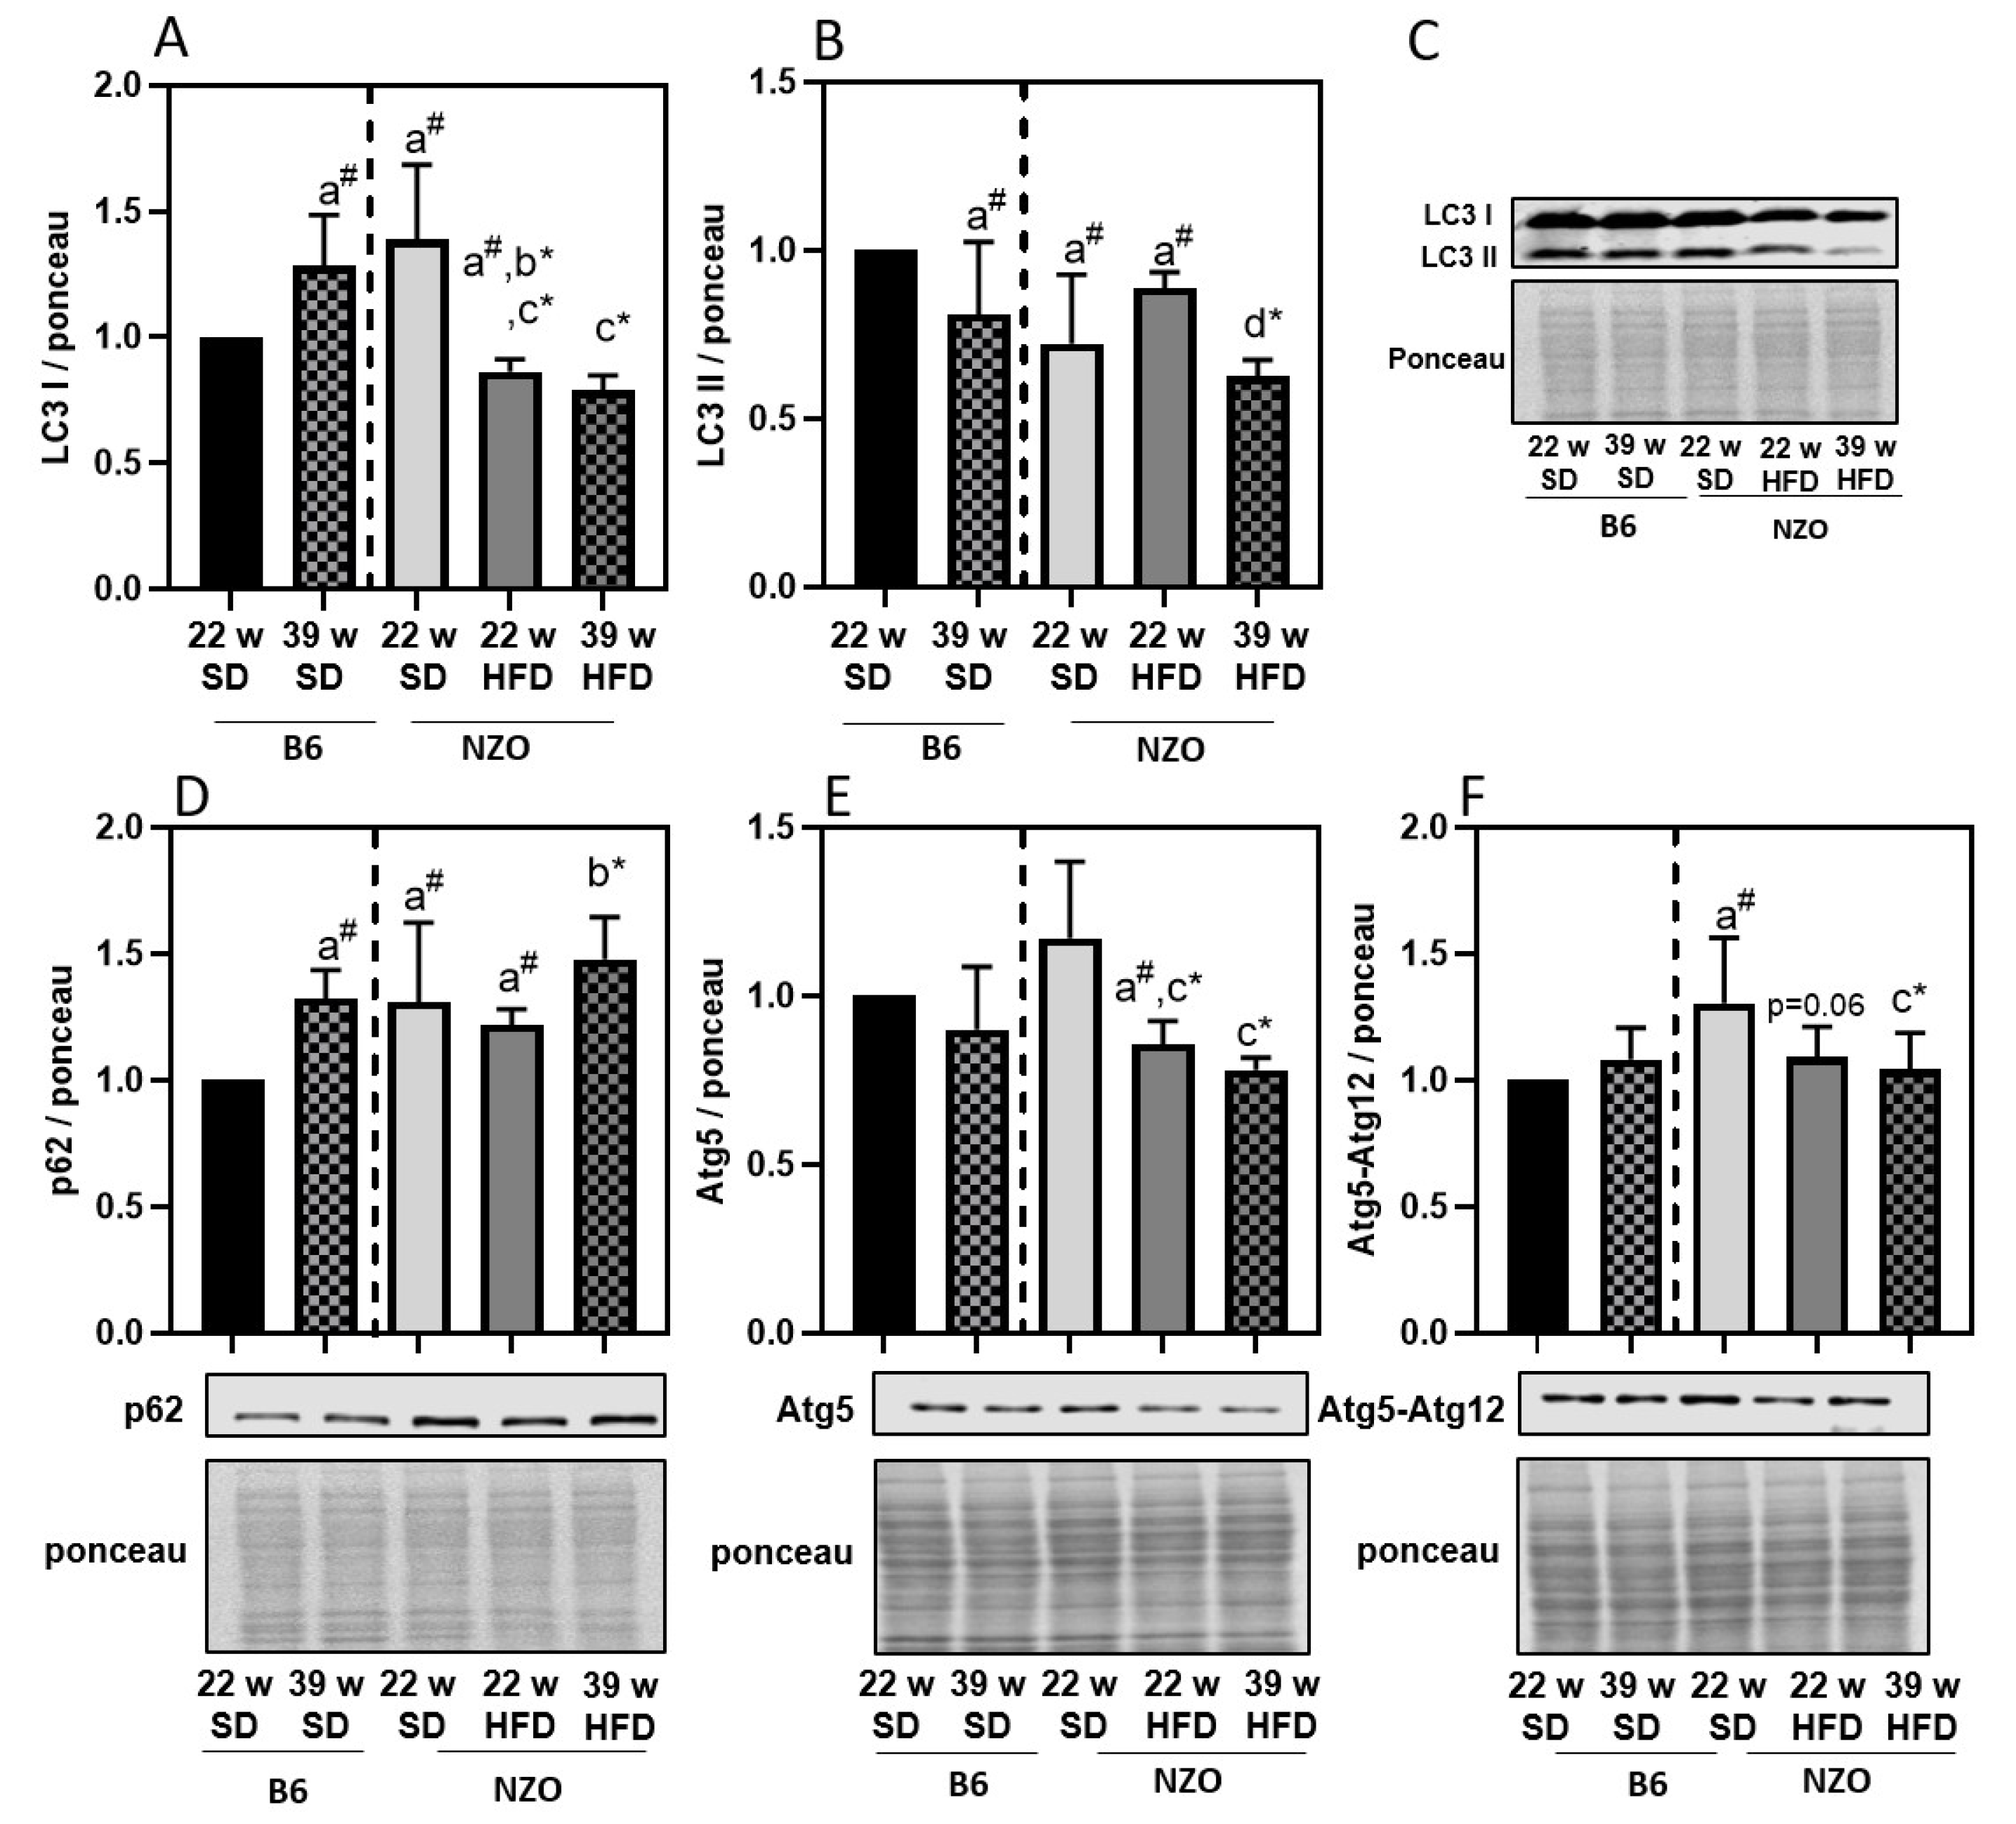
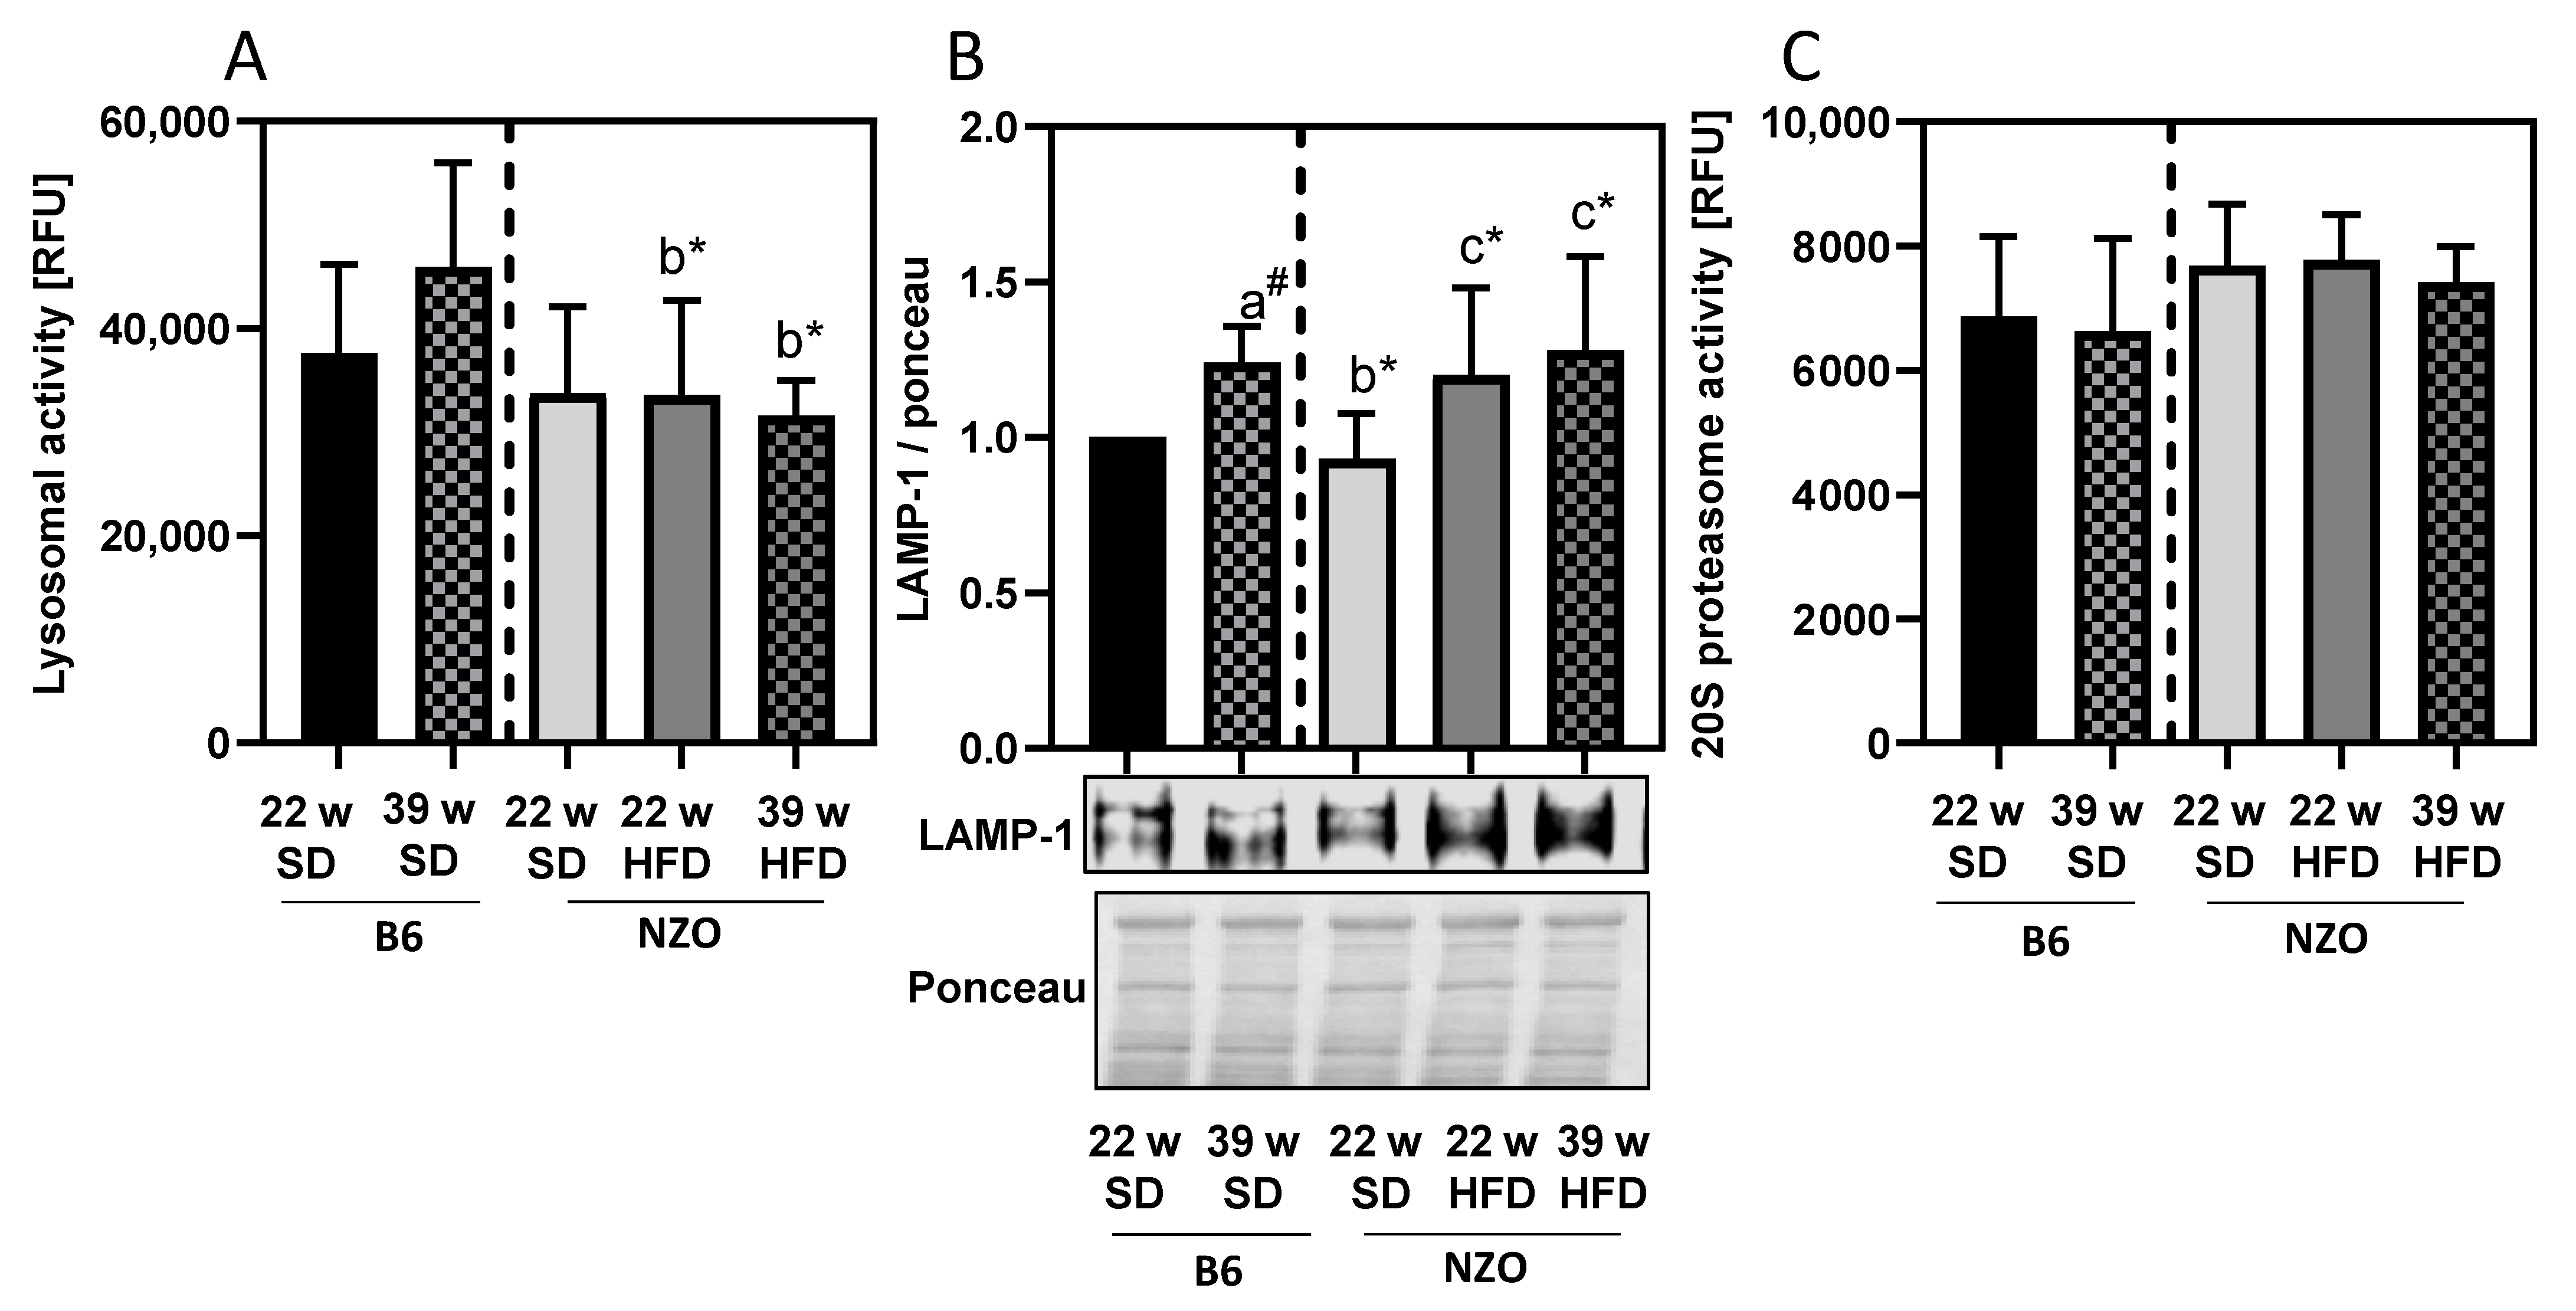
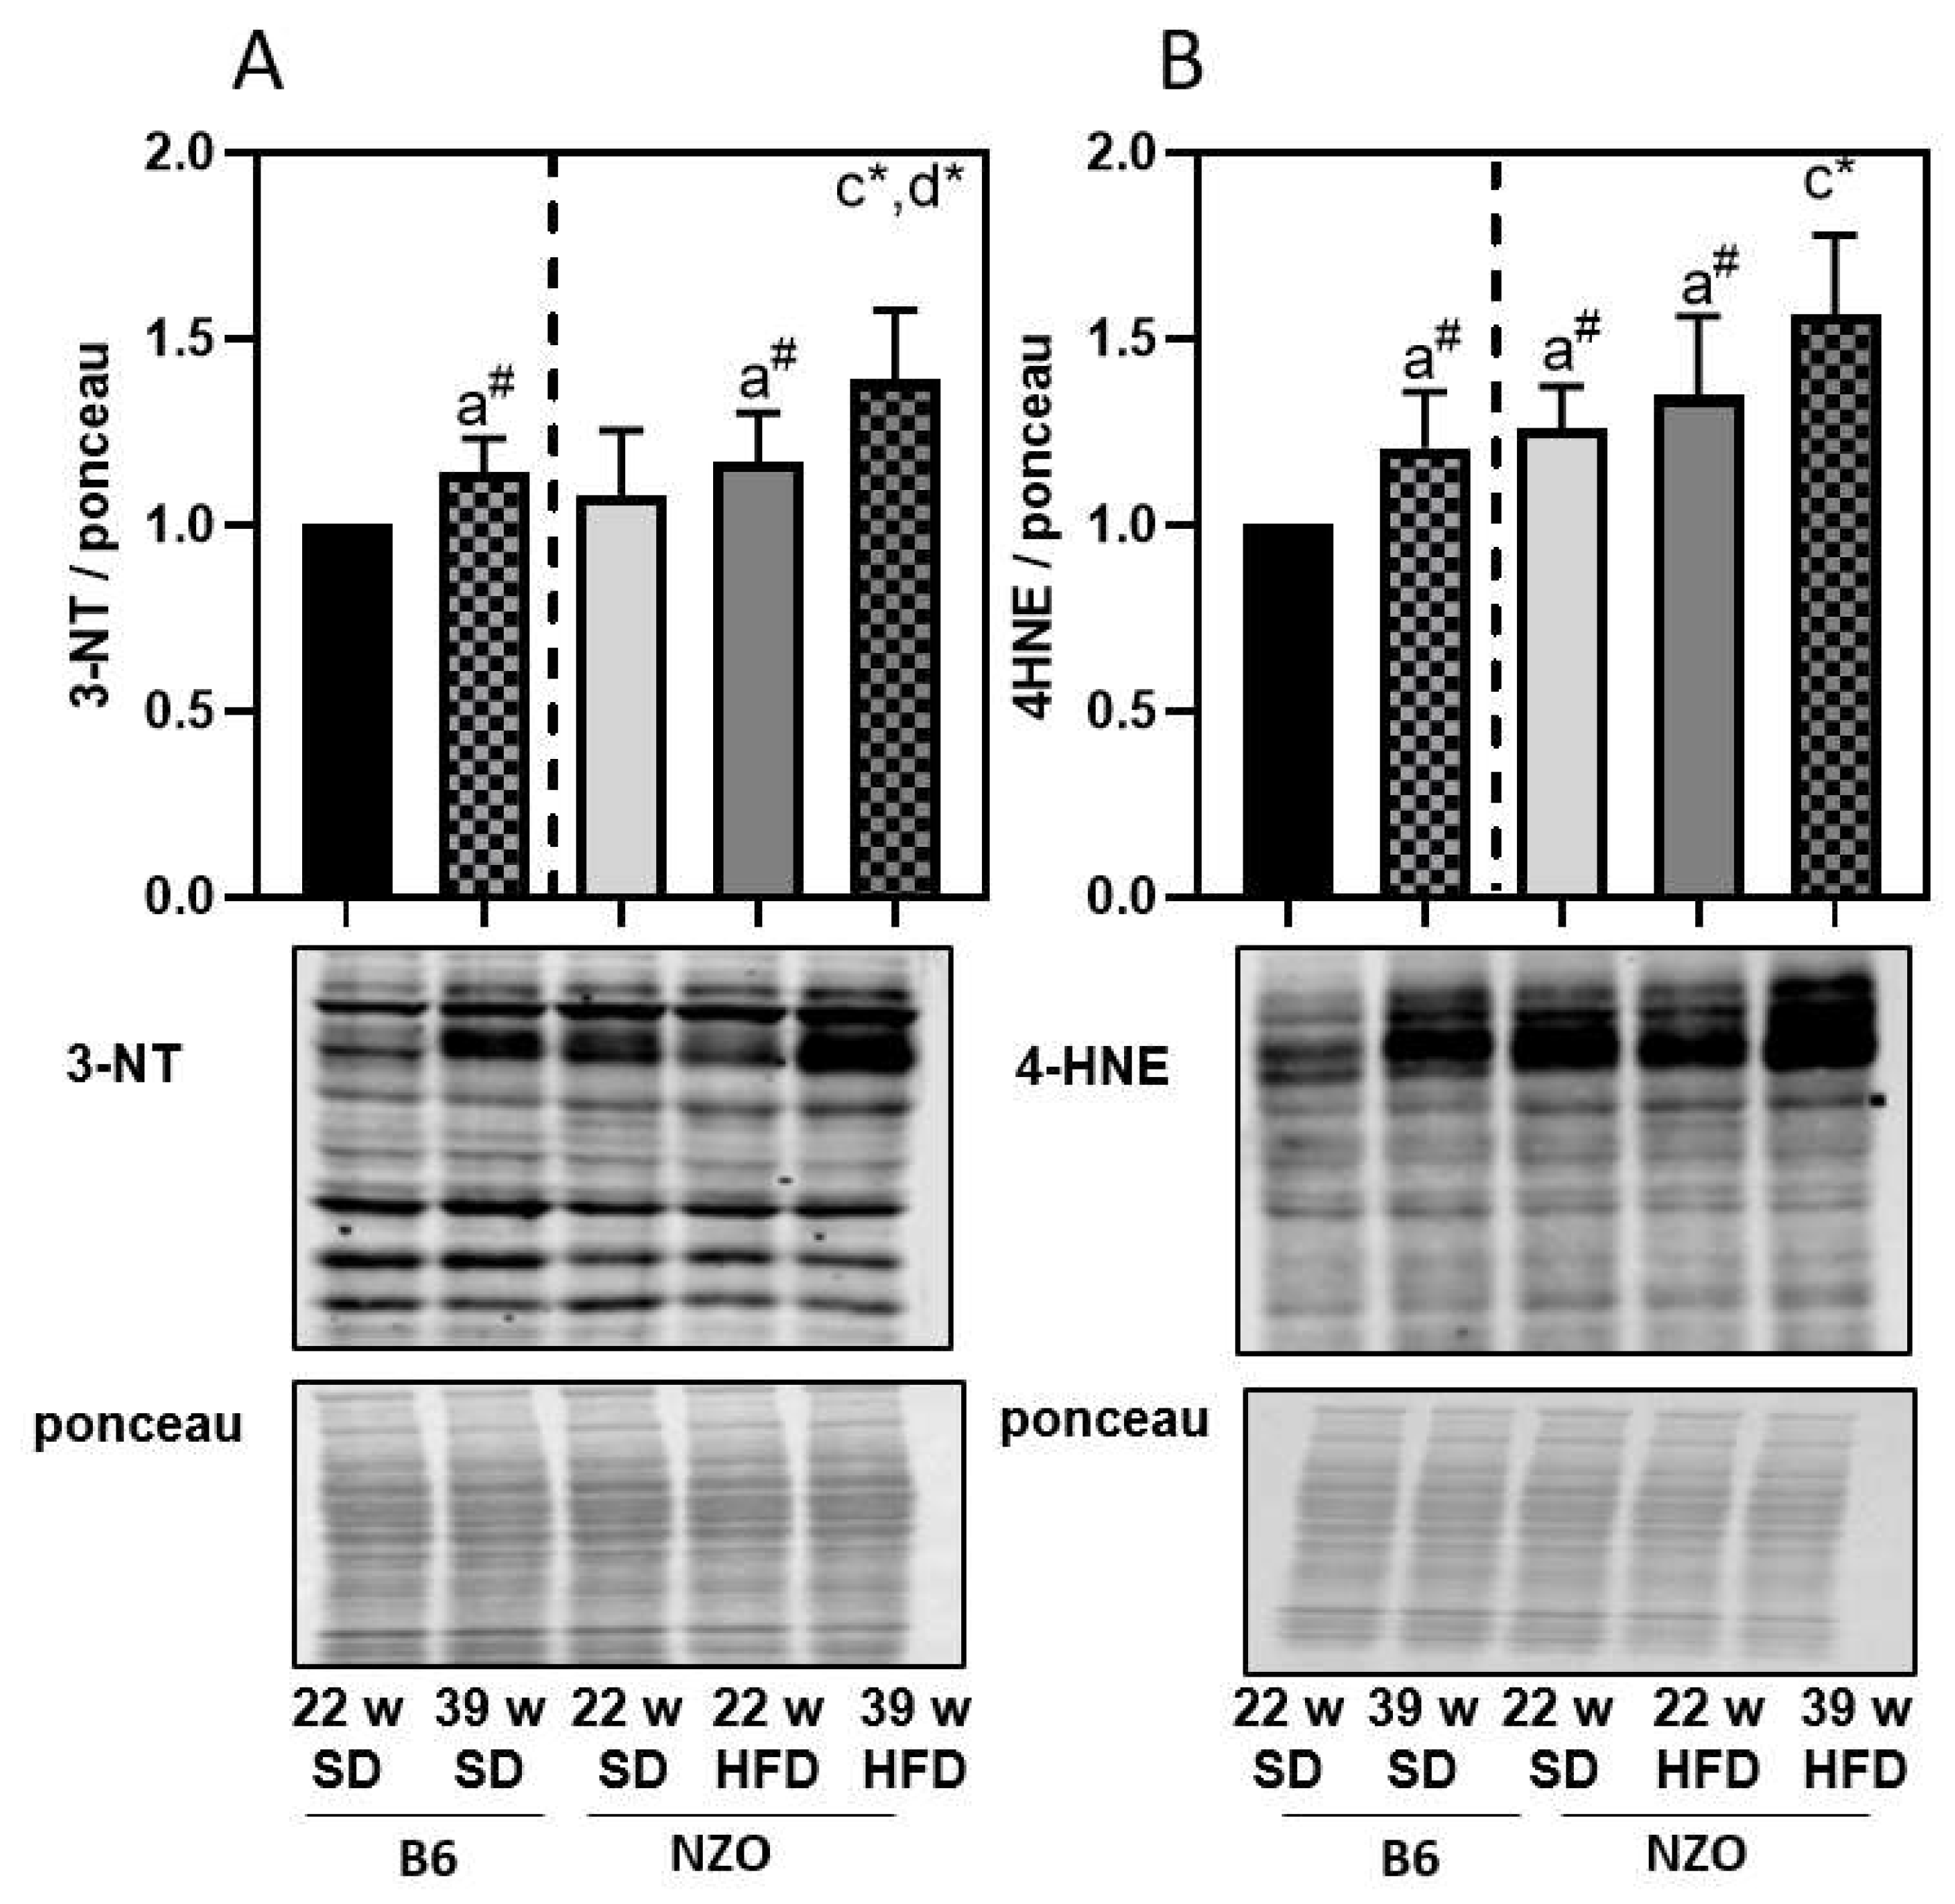
3. Results
4. Discussion
Author Contributions
Funding
Institutional Review Board Statement
Informed Consent Statement
Data Availability Statement
Acknowledgments
Conflicts of Interest
Abbreviations
| ALS | Autophagy-Lysosomal System |
| AMC | 7-amino-4-methylcoumarin |
| Atg | Autophagy-Related Gene |
| B6 | C57BL/6J Mouse |
| HFD | High-Fat Diet |
| 4-HNE | 4-hydroxynonenal |
| LAMP | Lysosomal-Associated Membrane Protein |
| LC3 | Microtubule-Associated Proteins Light Chain 3 |
| NAFLD | Non-Alcoholic Fatty Liver Disease |
| NZO | New Zealand Obese |
| plin2 | Perilipin 2 |
| RNS/ROS | Reactive Nitrogen/Oxygen Species |
| SD | Standard Diet |
| UPS | Ubiquitin-Proteasomal System |
References
- Engin, A. Eat and death: Chronic over-eating. Adv. Exp. Med. Biol. 2017, 960, 53–80. [Google Scholar]
- Gluchowski, N.L.; Becuwe, M.; Walther, T.C.; Farese, R.V., Jr. Lipid droplets and liver disease: From basic biology to clinical implications. Nat. Rev. Gastroenterol. Hepatol. 2017, 14, 343–355. [Google Scholar] [CrossRef] [PubMed]
- Ogawa, Y.; Imajo, K.; Honda, Y.; Kessoku, T.; Tomeno, W.; Kato, S.; Fujita, K.; Yoneda, M.; Saito, S.; Saigusa, Y.; et al. Palmitate-induced lipotoxicity is crucial for the pathogenesis of nonalcoholic fatty liver disease in cooperation with gut-derived endotoxin. Sci. Rep. 2018, 8, 1–14. [Google Scholar] [CrossRef]
- Xu, S.; Zhang, X.; Liu, P. Lipid droplet proteins and metabolic diseases. Biochim. Biophys. Acta (BBA) Mol. Basis Dis. 2018, 1864 Pt B, 1968–1983. [Google Scholar] [CrossRef]
- Zhang, X.; Wang, Y.; Liu, P. Omic studies reveal the pathogenic lipid droplet proteins in non-alcoholic fatty liver disease. Protein Cell 2017, 8, 4–13. [Google Scholar] [CrossRef]
- Itabe, H.; Yamaguchi, T.; Nimura, S.; Sasabe, N. Perilipins: A diversity of intracellular lipid droplet proteins. Lipids Health Dis. 2017, 16, 83. [Google Scholar] [CrossRef]
- Zhou, L.; Xu, L.; Ye, J.; Li, D.; Wang, W.; Li, X.; Wu, L.; Wang, H.; Guan, F.; Li, P. Cidea promotes hepatic steatosis by sensing dietary fatty acids. Hepatology 2012, 56, 95–107. [Google Scholar] [CrossRef]
- Klionsky, D.J.; Abdelmohsen, K.; Abe, A.; Abedin, M.J.; Abeliovich, H.; Arozena, A.A.; Adachi, H.; Adams, C.M.; Adams, P.D.; Adeli, K.; et al. Guidelines for the use and interpretation of assays for monitoring autophagy (3rd edition). Autophagy 2016, 12, 1–222. [Google Scholar] [CrossRef]
- Dikic, I. Proteasomal and autophagic degradation systems. Annu. Rev. Biochem. 2017, 86, 193–224. [Google Scholar] [CrossRef] [PubMed]
- Konig, J.; Grune, T.; Ott, C. Assessing autophagy in murine skeletal muscle: Current findings to modu-late and quantify the autophagic flux. Curr. Opin. Clin. Nutr. Metab. Care 2019, 22, 355–362. [Google Scholar] [CrossRef] [PubMed]
- Jung, T.; Catalgol, B.; Grune, T. The proteasomal system. Mol. Asp. Med. 2009, 30, 191–296. [Google Scholar] [CrossRef] [PubMed]
- Chondrogianni, N.; Petropoulos, I.; Grimm, S.; Georgila, K.; Catalgol, B.; Friguet, B.; Grune, T.; Gonos, E.S. Protein damage, repair and proteolysis. Mol. Asp. Med. 2014, 35, 1–71. [Google Scholar] [CrossRef] [PubMed]
- Bandookwala, M.; Sengupta, P. 3-Nitrotyrosine: A versatile oxidative stress biomarker for major neuro-degenerative diseases. Int. J. Neurosci. 2020, 130, 1047–1062. [Google Scholar] [CrossRef]
- Mattson, M.P. Roles of the lipid peroxidation product 4-hydroxynonenal in obesity, the metabolic syndrome, and associated vascular and neurodegenerative disorders. Exp. Gerontol. 2009, 44, 625–633. [Google Scholar] [CrossRef]
- Moldogazieva, N.T.; Mokhosoev, I.M.; Mel’Nikova, T.I.; Porozov, Y.B.; Terentiev, A.A. Oxidative stress and advanced lipoxidation and glycation end products (ALEs and AGEs) in aging and age-related diseases. Oxidative Med. Cell. Longev. 2019, 2019, 3085756. [Google Scholar] [CrossRef]
- Czaja, M.J. Function of autophagy in nonalcoholic fatty liver disease. Dig. Dis. Sci. 2016, 61, 1304–1313. [Google Scholar] [CrossRef] [PubMed]
- Lavallard, V.J.; Gual, P. Autophagy and non-alcoholic fatty liver disease. BioMed Res. Int. 2014, 2014, 120179. [Google Scholar] [CrossRef]
- Kehm, R.; Jähnert, M.; Deubel, S.; Flore, T.; König, J.; Jung, T.; Stadion, M.; Jonas, W.; Schürmann, A.; Grune, T.; et al. Redox homeostasis and cell cycle activation mediate beta-cell mass expansion in aged, diabe-tes-prone mice under metabolic stress conditions: Role of thioredoxin-interacting protein (TXNIP). Redox Biol. 2020, 37, 101748. [Google Scholar] [CrossRef]
- Pelusi, S.; Valenti, L. Hepatic fat as clinical outcome and therapeutic target for nonalcoholic fatty liver disease. Liver Int. 2018, 39, 250–256. [Google Scholar] [CrossRef]
- Kluth, O.; Matzke, D.; Kamitz, A.; Jähnert, M.; Vogel, H.; Scherneck, S.; Schulze, M.; Staiger, H.; Machicao, F.; Häring, H.-U.; et al. Identification of four mouse diabetes candidate genes altering beta-cell proliferation. PLoS Genet. 2015, 11, e1005506. [Google Scholar] [CrossRef]
- Jurgens, H.S.; Neschen, S.; Ortmann, S.; Scherneck, S.; Schmolz, K.; Schüler, G.; Schmidt, S.; Blüher, M.; Klaus, S.; Perez-Tilve, D.; et al. Development of diabetes in obese, insulin-resistant mice: Essential role of dietary carbo-hydrate in beta cell destruction. Diabetologia 2007, 50, 1481–1489. [Google Scholar] [CrossRef] [PubMed]
- Kluth, O.; Mirhashemi, F.; Scherneck, S.; Kaiser, D.; Kluge, R.; Neschen, S.; Joost, H.-G.; Schürmann, A. Dissociation of lipotoxicity and glucotoxicity in a mouse model of obesity associated diabetes: Role of forkhead box O1 (FOXO1) in glucose-induced beta cell failure. Diabetologia 2010, 54, 605–616. [Google Scholar] [CrossRef]
- Kluth, O.; Stadion, M.; Gottmann, P.; Aga, H.; Jähnert, M.; Scherneck, S.; Vogel, H.; Krus, U.; Seelig, A.; Ling, C.; et al. Decreased expression of cilia genes in pancreatic islets as a risk factor for type 2 diabetes in mice and humans. Cell Rep. 2019, 26, 3027–3036.e3. [Google Scholar] [CrossRef]
- Kluth, O.; Matzke, D.; Schulze, G.; Schwenk, R.W.; Joost, H.-G.; Schürmann, A. Differential transcriptome analysis of diabetes-resistant and -sensitive mouse islets reveals significant overlap with human diabetes susceptibility genes. Diabetes 2014, 63, 4230–4238. [Google Scholar] [CrossRef]
- Nocetti, D.; Espinosa, A.; La Fuente, F.P.-D.; Sacristán, C.; Bucarey, J.L.; Ruiz, P.; Valenzuela, R.; Chouinard-Watkins, R.; Pepper, I.; Troncoso, R.; et al. Lipid droplets are both highly oxidized and Plin2-covered in hepatocytes of diet-induced obese mice. Appl. Physiol. Nutr. Metab. 2020, 45, 1368–1376. [Google Scholar] [CrossRef]
- Coleman, R.A. The “discovery” of lipid droplets: A brief history of organelles hidden in plain sight. Biochim. Biophys. Acta Mol. Cell Biol. Lipids 2020, 1865, 158762. [Google Scholar] [CrossRef]
- Kounakis, K.; Chaniotakis, M.; Markaki, M.; Tavernarakis, N. Emerging roles of lipophagy in health and disease. Front. Cell Dev. Biol. 2019, 7, 185. [Google Scholar] [CrossRef]
- Nguyen, K.T.; Lee, C.-S.; Mun, S.-H.; Truong, N.T.; Park, S.K.; Hwang, C.-S. N-terminal acetylation and the N-end rule pathway control degradation of the lipid droplet protein PLIN2. J. Biol. Chem. 2019, 294, 379–388. [Google Scholar] [CrossRef]
- Lass, A.; Zimmermann, R.; Oberer, M.; Zechner, R. Lipolysis—A highly regulated multi-enzyme complex mediates the catabolism of cellular fat stores. Prog. Lipid Res. 2011, 50, 14–27. [Google Scholar] [CrossRef] [PubMed]
- Singh, R.; Cuervo, A.M. Lipophagy: Connecting autophagy and lipid metabolism. Int. J. Cell Biol. 2012, 2012, 282041. [Google Scholar] [CrossRef] [PubMed]
- Singh, R.; Kaushik, S.; Wang, Y.; Xiang, Y.; Novak, I.; Komatsu, M.; Tanaka, K.; Cuervo, A.M.; Czaja, M.J. Autophagy regulates lipid metabolism. Nature 2009, 458, 1131–1135. [Google Scholar] [CrossRef]
- Komatsu, M.; Waguri, S.; Ueno, T.; Iwata, J.; Murata, S.; Tanida, I.; Ezaki, J.; Mizushima, N.; Ohsumi, Y.; Uchiyama, Y.; et al. Impairment of starvation-induced and constitutive autophagy in Atg7-deficient mice. J. Cell Biol. 2005, 169, 425–434. [Google Scholar] [CrossRef] [PubMed]
- Korovila, I.; Jung, T.; Deubel, S.; Grune, T.; Ott, C. Punicalagin attenuates palmitate-induced lipid droplet content by simultaneously im-proving autophagy in hepatocytes. Mol. Nutr. Food Res. 2020, 64, e2000816. [Google Scholar] [CrossRef] [PubMed]
- Decleves, A.E.; Zolkipli, Z.; Satriano, J.; Wang, L.; Nakayama, T.; Rogac, M.; Le, T.P.; Nortier, J.L.; Farquhar, M.G.; Naviaux, R.K.; et al. Regulation of lipid accumulation by AMP-activated kinase [corrected] in high fat diet-induced kidney injury. Kidney Int. 2014, 85, 611–623. [Google Scholar] [CrossRef] [PubMed]
- Kormanovski, A.; Lara-Padilla, E.; Gutiérrez-Camacho, L.R.; Castillo-Hernández, M.D.C.; Guevara-Balcázar, G. Alterations in glutathione, nitric oxide and 3-nitrotyrosine levels following exercise and/or hyperbaric oxygen treatment in mice with diet-induced diabetes. Biomed. Rep. 2020, 12, 222–232. [Google Scholar]
- García-Ruiz, I.; Solís-Muñoz, P.; Fernández-Moreira, D.; Grau, M.; Colina, F.; Muñoz-Yagüe, T.; Solís-Herruzo, J.A. High-fat diet decreases activity of the oxidative phosphorylation complexes and causes nonalcoholic steatohepatitis in mice. Dis. Model. Mech. 2014, 7, 1287–1296. [Google Scholar] [CrossRef] [PubMed]
- Lieber, C.S.; Leo, M.A.; Mak, K.M.; Xu, Y.; Cao, Q.; Ren, C.; Ponomarenko, A.; DeCarli, L.M. Model of nonalcoholic steatohepatitis. Am. J. Clin. Nutr. 2004, 79, 502–509. [Google Scholar] [CrossRef]
- Chakravarti, B.; Chakravarti, D.N. Protein tyrosine nitration: Role in aging. Curr. Aging Sci. 2017, 10, 246–262. [Google Scholar] [CrossRef]
- Zhang, H.; Forman, H.J. 4-hydroxynonenal-mediated signaling and aging. Free. Radic. Biol. Med. 2017, 111, 219–225. [Google Scholar] [CrossRef]
- Xu, C.; Markova, M.; Seebeck, N.; Loft, A.; Hornemann, S.; Gantert, T.; Kabisch, S.; Herz, K.; Loske, J.; Ost, M.; et al. High-protein diet more effectively reduces hepatic fat than low-protein diet despite lower au-tophagy and FGF21 levels. Liver Int. 2020, 40, 2982–2997. [Google Scholar] [CrossRef]
- Themanns, M.; Mueller, K.M.; Kessler, S.M.; Golob-Schwarzl, N.; Mohr, T.; Kaltenecker, D.; Bourgeais, J.; Paier-Pourani, J.; Friedbichler, K.; Schneller, D.; et al. Hepatic deletion of janus kinase 2 counteracts oxidative stress in mice. Sci. Rep. 2016, 6, 34719. [Google Scholar] [CrossRef] [PubMed]


Publisher’s Note: MDPI stays neutral with regard to jurisdictional claims in published maps and institutional affiliations. |
© 2021 by the authors. Licensee MDPI, Basel, Switzerland. This article is an open access article distributed under the terms and conditions of the Creative Commons Attribution (CC BY) license (http://creativecommons.org/licenses/by/4.0/).
Share and Cite
Korovila, I.; Höhn, A.; Jung, T.; Grune, T.; Ott, C. Reduced Liver Autophagy in High-Fat Diet Induced Liver Steatosis in New Zealand Obese Mice. Antioxidants 2021, 10, 501. https://doi.org/10.3390/antiox10040501
Korovila I, Höhn A, Jung T, Grune T, Ott C. Reduced Liver Autophagy in High-Fat Diet Induced Liver Steatosis in New Zealand Obese Mice. Antioxidants. 2021; 10(4):501. https://doi.org/10.3390/antiox10040501
Chicago/Turabian StyleKorovila, Ioanna, Annika Höhn, Tobias Jung, Tilman Grune, and Christiane Ott. 2021. "Reduced Liver Autophagy in High-Fat Diet Induced Liver Steatosis in New Zealand Obese Mice" Antioxidants 10, no. 4: 501. https://doi.org/10.3390/antiox10040501
APA StyleKorovila, I., Höhn, A., Jung, T., Grune, T., & Ott, C. (2021). Reduced Liver Autophagy in High-Fat Diet Induced Liver Steatosis in New Zealand Obese Mice. Antioxidants, 10(4), 501. https://doi.org/10.3390/antiox10040501