1. Introduction
Meat and meat products constitute a food group of great nutritional importance due to their high content of protein, essential amino acids, Fe, Zn, and B-complex vitamins. However, the wide use of synthetic additives as preservatives in meat products poses a risk to human health due to their potential harmful effects after a long and continued consumption [
1].
The main substrate that initiates the lipid peroxidation reactions in the meat is fat, which is also an essential ingredient for its organoleptic quality [
2]. Due to its composition, meat is prone to oxidation reactions that result in a loss of quality during storage, as a consequence of the oxidation of lipids, proteins, and pigments such as myoglobin, which reduce the shelf life of the product by exerting a detrimental effect on color, flavor, texture, and nutritional value [
3]. For this reason, the food industry has used synthetic antioxidants to control oxidation reactions, but, due to toxicity concerns, research is being conducted on the use of natural antioxidants that do not induce these harmful effects on health [
1].
One of the main strategies to develop clean label meat products is the replacement of these additives by products of natural origin, such as plant extracts that are rich in polyphenols and flavonoids, and therefore have antioxidant and antimicrobial properties. These natural antioxidants act by preventing the formation of reactive oxygen species in the food and decreasing the oxidative processes in vivo, exerting a protective effect against many diseases [
3]. Advances in this field can give meat industry the opportunity to produce clean label products free of synthetic antioxidants and preservatives [
4].
This new trend has emerged because consumers are largely demanding healthy products that provide beneficial effects for human health by increasing their nutritional value. This fact is leading the food industry to search for compounds that enable the development of functional foods with added value [
5].
One of these compounds is hydroxytyrosol, a by-product from olive oil production that could replace synthetic antioxidants, since it has a high antioxidant capacity and numerous beneficial effects on health. This phytochemical can be obtained from olive oil (organic origin), or from the hydrolysis of oleuropein (synthetic origin) [
6]. In this way, the hydroxytyrosol of chemical synthesis has a purity higher than 90% and is able to alleviate the undesirable own flavors from olive tree and derivatives, while organic extract of hydroxytyrosol has a maximum purity of 20%, and its application also provides many other compounds that can decrease the sensory quality of the food product.
In this sense, the preservative capacity of hydroxytyrosol can be compared with known antioxidant extracts, such as hesperidin from citrus species, which has been demonstrated to act as antioxidant and antimicrobial in fresh and dry-cured pork meat products [
7,
8,
9,
10].
Dry-cured meat products are ripened during a period in which dehydration and microbiological changes are produced. These changes allow the development of their characteristic odor and flavor. This flavor development is also due to the incorporation of different additives, spices, and condiments. Fuet is a traditional fermented sausage which is made with minced pork fat and meat seasoned with salt and pepper, among other spices. Starter cultures are also incorporated into its formula, in order to control the presence of microorganisms that can alter their quality. Finally, it is stuffed into a thin pork casing with a caliber of 34–36 mm.
This product is typical from the Catalan gastronomy, and several researchers have included natural extracts and new technologies to prolong the shelf-life of these kind of products (three months, approximately). For example, Hospital et al. [
11] studied the toxigenesis of
Clostridium botulinum in nitrate and nitrite-reduced dry fermented sausages (“salchichón” and “fuet”) for 28 days. In a similar product, Lorenzo et al. [
12] demonstrated that grape seed and chestnut extracts were more effective than synthetic antioxidants (BHT) against lipid oxidation in dry-cured “chorizo”. Moreover, the incorporation of rosemary and citric extracts into the formulation of clean-label dry-cured meat products has demonstrated to be effective against microbiological growth and the production of volatile compounds in Spanish “chorizo” [
7,
13] and in “Cinta Senese” dry-fermented sausages [
9,
10]. Additionally, chitosan essential oil has improved the microbiological, physicochemical, and sensory characteristics of Turkish fermented sausages (sucuk) [
14].
The main objective of the present study was to know the preservative activity of hydroxytyrosol extracts from different sources and citric extract in a dry-cured sausage: traditional “fuet”. For that, lipid and protein oxidative damage, microbiological growth, and sensory perception were measured with the aim of evaluating the quality of a cured meat product enriched with natural extracts with potential health benefits. For that, the natural extracts used were previously tested in a pork meat model system, and the antioxidant activity of the final product (fuet) was also tested.
2. Materials and Methods
2.1. Preservative Extracts
Hydroxytyrosol (HTo), obtained from vegetation waters of olive (Olea europaea) with 7.26% pure bioactive compound and citric (Citrus sinensis L.) (C) with 55.1% hesperidin were supplied by Nutrafur-Frutarom, S. A. (Alcantarilla, Murcia, Spain). The antioxidant activity of these extracts was compared to hydroxytyrosol (HTs), which was synthetized by acid hydrolysis of oleuropein from DOPAC. In this way, this extract had a purity of 99.2% hydroxytyrosol and 0.3% hydroxytyrosol acetate. HTs was supplied by Seprox Biotech, S. L. (Fuente Álamo, Murcia, Spain).
2.2. Protein Oxidation in an Oxidized Pork Meat Model System
2.2.1. Oxidation Pork Meat Model System
A total of 500 g of pork loin was purchased from a local supermarket (Hipercor, S.A., Murcia, Spain). Fat was removed and meat was minced, using a grinder (12 °C, 2 min, 500 rpm). Minced meat was vacuum-packed in bags of 20 g and stored at −18 °C until analysis. Then, 1.5 g of minced meat was homogenized in 12.5 mL of 0.05 M MES buffer, pH =5.8, together with 200 ppm of extracts (HTo, HTs, and C). During homogenization using an Ultra Turrax T25 at 11,500 rpm for 30 s, samples were kept on ice, to minimize the oxidation rate. After that, the azo-initiators, 2,2′-azobis (2-amidinopropane) dihydrochloride (AAPH) diluted in Milli-Q water (0.54 mM) or 2,2′-azobis (2,4-dimethylvaleronitrile (AMVN) diluted in 99.9% EtOH (3 mM), were added as hydrophilic oxidation initiator (OXAAPH), or lipophilic oxidation initiator (OXAMVN), respectively. Immediately after addition of the azo-initiators, samples were placed in a water bath, under agitation, at 37 °C, for 200 min to oxidize the meat model system. The control used with no oxidizers was called Control NO-OX. After oxidation, thiol groups were quantified.
2.2.2. Thiol Analysis
The thiol groups’ concentration is related to the protein oxidation and was determined after derivatization by 5,5′-dithiobis (2-nitrobenzoic acid) (DTNB) [
15]. The method carried out to the analysis of thiol groups’ concentration was previously described by Martínez et al. [
8].
2.3. Elaboration of Cured Meat Product: Fuet
The fuet samples (N = 160) were divided into four different batches of fuet (40 samples per batch, 5 samples of each batch per day of analysis). For that, pork minced meat and fat were purchased in a local supermarket, Hipercor, S.A. (Murcia, Spain). The “commercial mix” used for the preparation of Control fuet samples contains the following ingredients: salt, dextrin, dextrose, stabilizer: sodium phosphate (E-451), spices and spice extract, flavor, antioxidants: sodium ascorbate (E-301) and sodium citrate (E-331), preservatives: potassium nitrate (E-252) and sodium nitrite (E-250). This “commercial mix” was provided by Catalina Food Solutions S.L. (El Palmar, Murcia, Spain). The same “commercial mix” with no sodium ascorbate (E-301) and sodium citrate (E-331) was used for the reformulated samples. Microsan-R (a commercial starter culture) composed of Pediococcus (50%), Staphylococcus xylosus (25%), and Staphylococcus carnosus (25%) was also purchased from Catalina Food Solutions S.L. (El Palmar, Murcia, Spain) and used to enable fermentation. The lyophilized culture was rehydrated for 8 h prior to product manufacture (50 g in 750 mL in Milli-Q water) and sown in the mass at 6 × 10⁷ CFU/g.
The meat was chopped and mixed with the rest of ingredients and extracts at concentrations described in
Table 1. Then, the paste was stuffed into swine casing, using an automatic stuffer (Silvercrest
® kitchen tools, Barcelona, Spain). The natural pork casing (40–42 mm ø) was previously desalted and washed with Milli-Q water. Each sample weighed 250 g, approximately. After elaboration, the fuet samples were labeled, weighed, and placed in an air-drying chamber Binder 115 redLine RI (Tuttlingen, Germany) set at 22 ± 1 °C and 90 ± 5% RH for two days. After the 2nd day of storage, temperature and humidity were adjusted to 14 ± 1 °C and 70 ± 5% RH for 12 days. Analysis was carried out in two phases: during ripening at 0, 7, and 14; and after curation process for 150 days, when samples were stored into plastic bags in aerobic conditions at 5 ± 1 °C, 65 ± 5% RH. Analysis during the refrigerated storage was carried out on days 21, 35, 50, and 100 after elaboration.
2.4. Proximal Composition
Fuet samples were analyzed for their moisture, ash, lipid, and total protein contents according to AOAC methods [
16] on the same day of elaboration. The mineral concentrations of fuet samples were measured by plasma spectroscopy (ICP-OES) using an ICAP THERMO DUO 6500 computer.
2.5. Physicochemical Determinations during Ripening Process
Samples were weighed to measure losses because of airing during the ripening process, which was calculated as percent by the difference of weight from day 0 to 21. pH was measured using Crison GLP21 equipment (Crison Instruments S.A., Barcelona, Spain). Water activity (aw) was measured during the ripening process using the Lab Partner-aw (Novasina, A.G., Lachen, Switzerland). Analysis of airborne losses, pH, and water activity were carried out at days 0, 7, 14, 21, 35, 50, and 100 from elaboration.
2.6. Oxidation Shelf-Life Study for 100 Days
A Konica Minolta CR 400 colorimeter was used for color evaluation. Each day of analysis was calibrated with a standardized plate. This instrument uses the CIELab system, which provides data on lightness (L *), chroma coordinates a * (green–red chromaticity) and b * (blue–yellow chromaticity), chroma (C *), and hue (h). The measurements were made in triplicate on different parts of each sample at days 0, 7, 14, 21, 35, 50, and 100 after elaboration.
The thiol groups concentration is related to the protein oxidation and was determined after derivatization by 5,5′-dithiobis (2-nitrobenzoic acid) (DTNB) [
15]. The method carried out to the analysis of thiol groups concentration in fuet samples was previously described by Martínez, Ros and Nieto [
17]. The measurements were made in triplicate at days 0, 7, 14, 21, 35, 50, and 100 after elaboration.
Lipid oxidation was related to thiobarbituric acid reactive substances (TBARs) content, which were measured following the method described by Martínez, Ros and Nieto [
17]. The TBARs value was reported in mg MDA/kg sample. The measurements were made in triplicate at days 0, 7, 14, 21, 35, 50, and 100 after elaboration.
2.7. Microbiological Analysis
Analysis of total vial count (TVC), total coliform count (TCC), and Escherichia coli were performed on day 21 of the study. All the samples were analyzed in triplicate, and the counts were expressed as colony forming units per gram (CFU/g). Samples were prepared in a horizontal laminar flow cabinet (Telstar, BIO-II-A, Spain) sterilized by UV irradiation. All media (PCA to determine TVC and Rapid E. Coli to determine TCC and E. coli) were prepared and sterilized at 121 °C, for 20 min, according to product indications. Peptone water (OXOID, Ltd. CM0087 Basingstoke, Hampshire, UK) was used to make the dilutions. After mass seeding, plates were incubated for 48 h, at 37 °C, for TVC; 24 h, at 37 °C, for TCC; and 48 h, at 45 °C, for E. coli.
2.8. Sensory Analysis
The tasting room for sensory evaluation was air-conditioned and free of disturbing factors. The fuet samples were cut in slices of 3–5 mm thickness. Sensory analysis was carried out at 21 days after elaboration.
Previously, ten panelists were trained according to the ISO guide [
18] to carry out a quantitative descriptive sensory analysis. In total, there were two training sessions, where different descriptors related to the odor and flavor of samples were quantified and identified by the panelists. These attributes were evaluated using an intensity scale from 1 (minimum: undetectable) to 4 (maximum score: very intense). Samples were coded with random three digits and were presented individually to the panelists. Mineral water and stick breads were provided for mouth rinsing between samples. The attributes measured for the color, odor, and taste characteristics were as follows: “Red Color”, “Brown Color”, “Extract Color”, “Brightness”, “Own Odor”, “Cured Odor”, “Rancid Odor”, “Extract Odor”, “Own Flavor”, “Cured Flavor”, “Extract Flavor”, “Rancid Flavor”, “Hardness”, “Chewability”, “Juiciness”, and “Granularity”. “Acceptability” of fuet samples was measured by a panel of twenty consumers following an intensity scale from 1 (minimum: I do not like it) to 4 (maximum: I like it very much/I would by it) [
19].
2.9. Antioxidant Capacity of Cured Meat Product
Previously to analysis, extracts of each fuet sample were obtained. For that, 2 g of sample was placed in plastic tubes with 10 mL of ethanol/Milli-Q water (25/75). This solution was mixed during 1 h, at 500 rpm, in an ice bath, and centrifuged at 3500 rpm, at 4 °C, for 4 min. The supernatant was filtered (0.2 µm) and kept at −80 °C until analysis [
20]. Extractions were carried out with samples at day 21 after elaboration.
The total phenolic content (TPC) was determined quantitatively by using the Folin–Ciocalteu reagent and gallic acid as the standard [
21]. The TPC was expressed as mg gallic acid equivalents (GAEs) per g of extract.
The ferric-ion-reducing antioxidant power assay (FRAP) was also performed [
22]. The FRAP reagent was daily prepared with 20 mL of 300 mmol/L acetate buffer, pH = 3.6, 2 mL 20 mmol/L FeCl
3 6 H
2O, and 2 mL 10 mmol/L TPTZ (2,4,6-tripyridyl-s-triazine) in 40 mmol/L HCl. Trolox standard solutions at different concentrations were used as standard curve, in order to compare obtained results of the samples. The antioxidant power was expressed as µM Trolox equivalents (TE) per g extract.
The hydrophilic antioxidant capacity was measured by using the ORAC (Oxygen Radical Absorbance Capacity) method [
23]. For that, the method described by González et al. [
20] was carried out. All dilution samples were prepared in triplicate. The antioxidant activity of the sample was expressed as µM of Trolox equivalents (TE) per 100 g of sample.
2.10. Statistical Analysis
Data were analyzed with the statistical package SPSS 15.0 (Statistical Package for the Social Science for Window (IBM, Armonk, NY, USA). The obtained results of in vitro antioxidant capacity and shelf-life study were analyzed, using ANOVA. The obtained results of the sensory evaluations were analyzed, using ANOVA, considering the effect of panelist and replicate. A value of p < 0.05 was considered statistically significant. The Scheefe test was applied, to test differences among groups.
4. Discussion
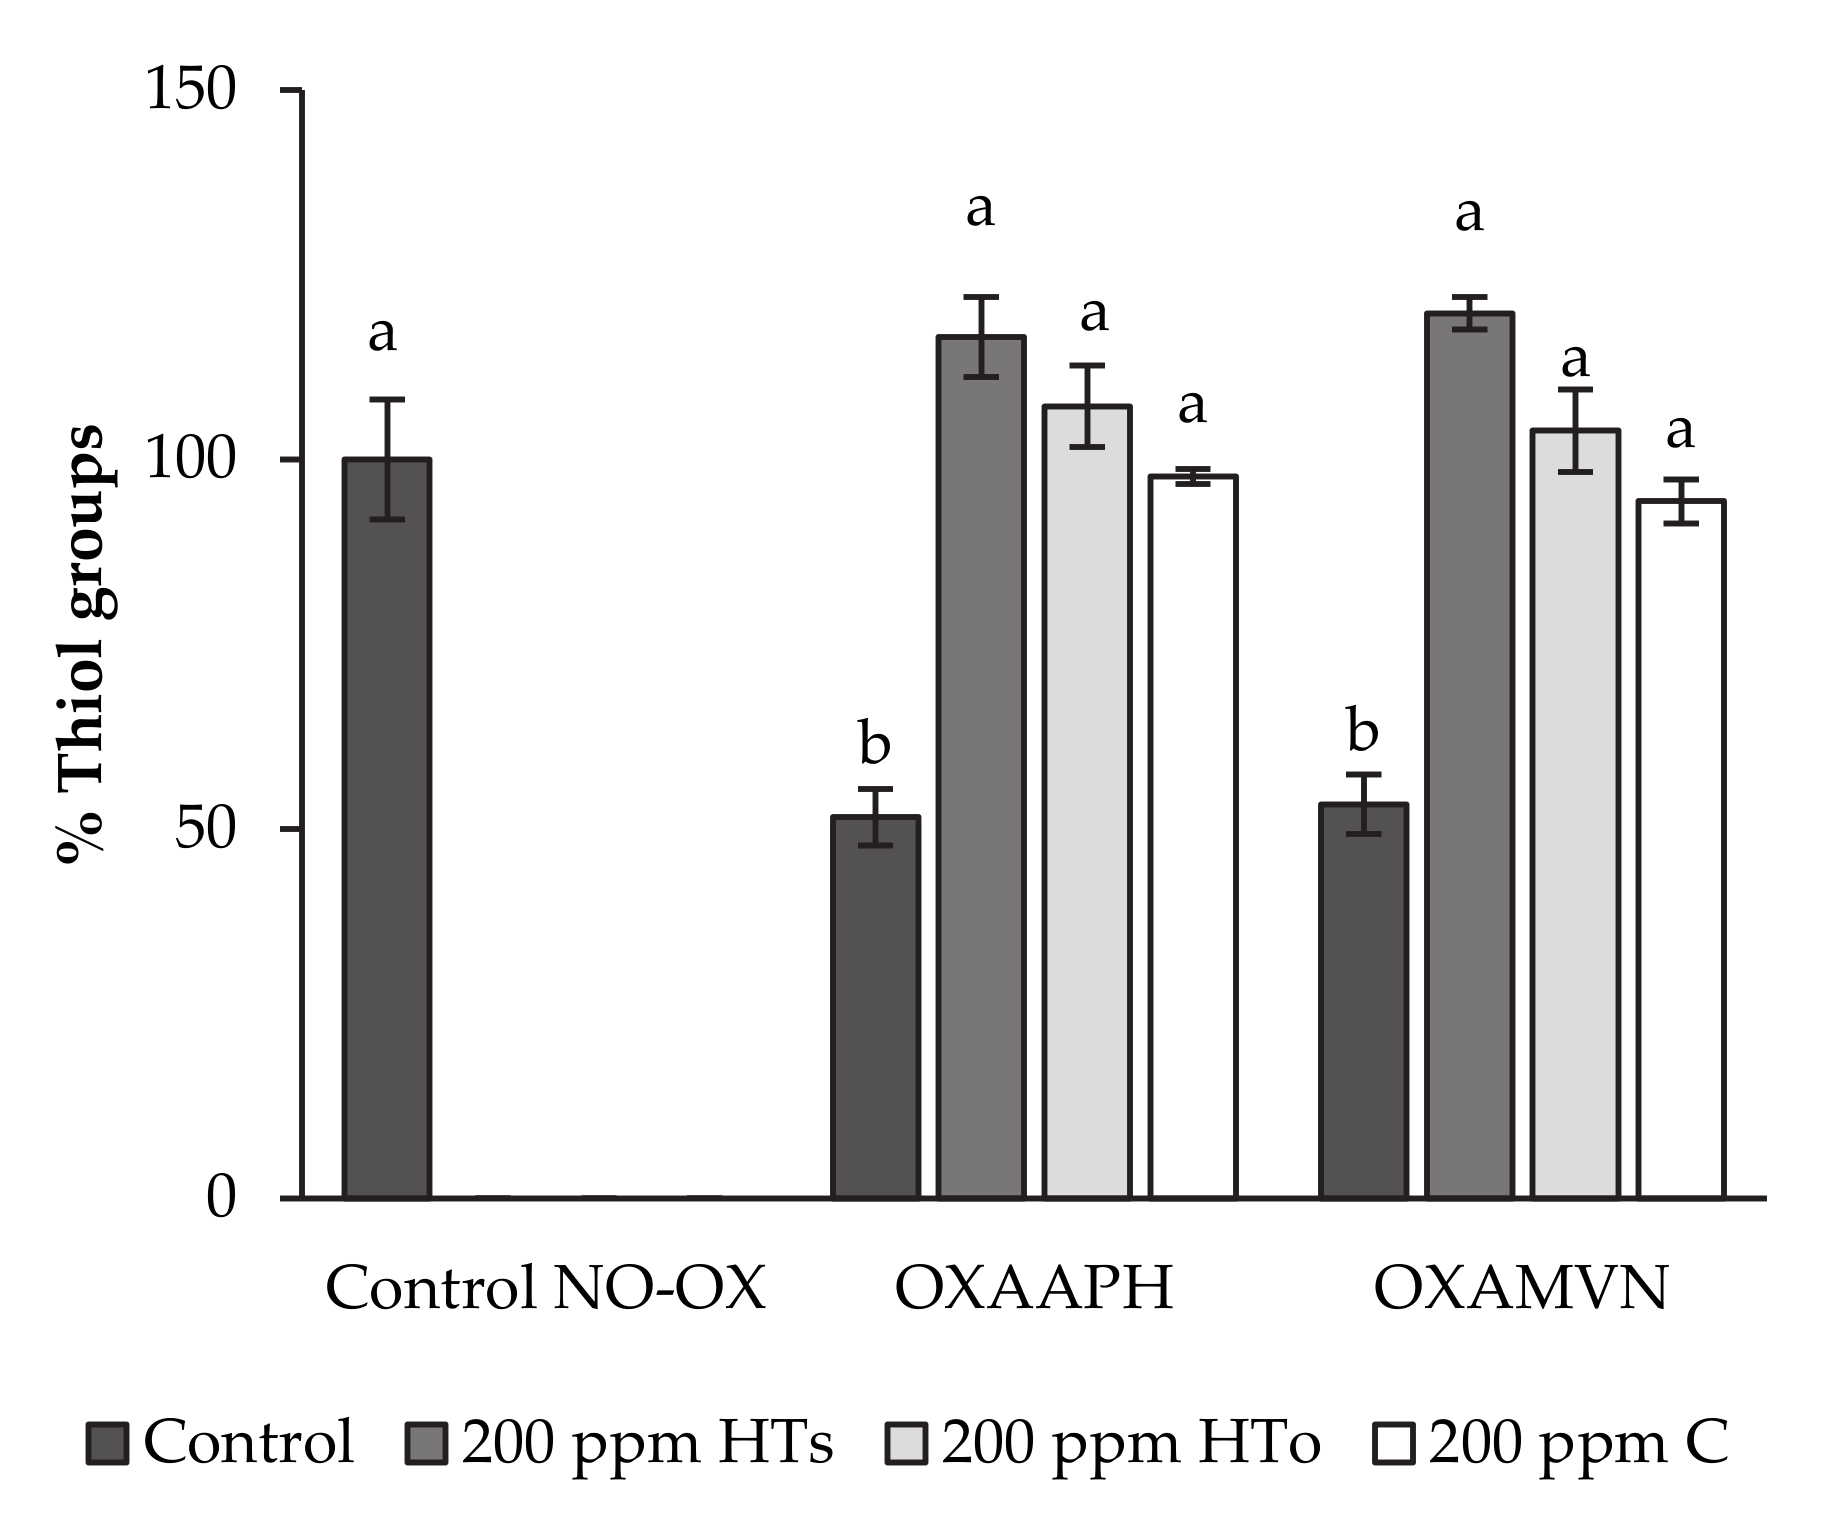
The concentration of protein thiols in the control pork meat model system (Control NO-OX) was 46.7 ± 3.8 mmol/mg protein (100%), and is comparable to previous results reported by Martínez et al. [
8] in a similar pork meat model system. In
Figure 1, it is presented that HT
s, HT
o, and C extracts inhibited the protein oxidation, directly related with thiol loss, in presence of oxidizer agents (AAPH and AMVN) in the pork meat model system. In fact, HT is widely known as one of the most antioxidant compounds [
4,
24]. This bioactivity can be explained by its chemistry structure, which is formed by a phenol group and a hydroxyl group, which produce phenoxyl radicals in the presence of oxidizer agents. For that, this promising molecule, from HT
s (99% purity) and HT
o (7% purity), is able to avoid the thiol oxidation in the oxidized pork meat model, and, as a consequence, it could be a good protector against protein oxidation in processed meat products. Similarly, the antioxidant capacity of C is possibly attributed to its high concentration of hesperidin (55%). Actually, hesperidin is a bioflavonoid glycoside whose antioxidant capacity lies in the high number of hydroxyl groups. As well as HT extracts, the chemical structure of its main compound can justify the radical scavenging and antioxidant activity in the pork meat model system subjected to external oxidizers, such as AAPH and AMVN (
Figure 1), protecting thiol groups from oxidative reactions and maintaining the thiol concentration at the same level that Control NO-OX. Obtained results by C agree with those obtained by us in a similar meat model system after incorporation of 500 ppm citrus extract [
8].
With regards to the proximal composition, obtained results of fuet samples can be supported by Herrero et al. [
25], who analyzed dry cured fermented sausages, such as chorizo, salchichón, salami, fuet, and mini-fuet. Herrero et al. [
25] found 70% dry matter and 30% fat content, which are comparable with that of the present study (32% moisture and 27% fat content). As described, a significant increase (
p < 0.05) was obtained with regard to Fe, Mn, and Si content of studied samples. These finding can be explained by the affinity of hydroxytyrosol to link to certain minerals, such as Fe in black olives, in order to catalyze the oxidation of gluconate Fe (II). Therefore, hydroxytyrosol may influence biological availability of some minerals [
26]. Moreover, Martínez, Ros and Nieto [
27] demonstrated that the presence of hydroxytyrosol in chicken meat emulsions increased the uptake of Fe by Caco-2 cells (in vitro). Due to this affinity between minerals and phenolics, an increase of Fe, Mn, or Si after hydroxytyrosol incorporation can be justified.
Similar to the present study, obtained values of air losses, a
w, and pH (
Table 3) can be supported by Herrero et al. [
25], who also showed comparable values in dry-cured fuet samples of different brands (a
w = 0.778 and pH = 5.42). In addition, similar conclusions were also reached by Hospital et al. [
11] in nitrate and nitrite-reduced dry fermented Spanish sausages (“salchichón” and “fuet”) with regards to a
w values.
Besides this, as it is widely known about dry-fermented sausages, starter cultures incorporated into dry-cured products, which are composed of lactic acid bacteria (
Pediococcus (50%),
Staphylococcus xylosus (25%), and
Staphylococcus carnosus (25%), in this case), result in the fermentation of sugars, which produces a descent of pH values close to 5, in order to avoid the growth of pathogenic microorganisms, such as
Clostridium botulinum [
28]. Moreover, the antimicrobial effect of nitrites is higher at pH around 4.5 and 5.5. Therefore, all studied samples were within the optimal range of pathogenic microorganism inhibition by nitrites.
Table 4 shows obtained values of color development during ripening and refrigerated storage. The development of the characteristic reddish color (a *) of the fuet did not present any type of incidence, both in the Control sample and in those incorporating HT and C. In the case of C sample, a decrease in the development of the reddish color (a *) (from day 35 to the end of the study) showing a paler appearance, while no effects on variation of red color during storage were observed after incorporation of HT and C, which was also noticeable in
Figure 2. The color is one of the most decisive aspects in the process of choosing a cured sausage and the use of hydroxytyrosol does not seem to alter its development. These results agree with that of Chaves-López et al. [
29] and Nieto et al. [
30], where the addition of hydroxytyrosol maintained and increased the appearance of the reddish color in pork fermented sausages and chicken sausages, respectively.
Regarding the results showed in
Table 5, TBARs’ values were kept below the limit of 1 mg MDA/kg of product, from which rancid taste is generated in the product. Then, this rancid taste did not develop in the first 50 days of analysis. However, the Control and C samples exceeded this value at day 100 of the shelf-life study, while HT extracts preserved fuet samples even after this date (
p < 0.05). In agree with this fact, Cofrades et al. [
31] showed as the addition of 100 ppm of hydroxytyrosol reduced lipid oxidation similarly to BHA/BHT in both Frankfurt sausages and cooked meat. Moreover, Muíño et al. [
5] demonstrated that the addition of 100, 200, and 400 ppm of hydroxytyrosol reduced lipid oxidation in lamb pies in a similar way to the Control sample made with synthetic preservatives. Moreover, our previous researcher has demonstrated the reduction of lipid oxidation after the incorporation of hydroxytyrosol extracts in chicken sausages [
30], chicken nuggets [
17], and fish patties [
32]. Therefore, the antioxidant capacity of hydroxytyrosol in the protein matrix has been repeatedly demonstrated and it justifies the results presented in the present study.
Moreover,
Table 5 shows obtained results of protein oxidation, which is directly related to concentration of free thiol groups [
33]. The concentration of the Control sample at the beginning of the shelf-life study was 54.1 ± 3.2 mmol/mg protein, and no significant differences were found among studied samples at day 0. However, a great descent (50%) (
p < 0.05) was produced from this moment to the end of the ripening process, at day 21. This fact occurs as a result of the protein oxidation produced when free thiols form bounds among proteins, which changes protein structure increasing the hardness of the product as a consequence of curation process. In this way, after one hundred days of shelf-life, the study’s HT
s samples did not present significant differences with regard to the Control sample, while HT
o and C slightly decreased the concentration regarding those samples. These results agree with antioxidant capacity of studied extracts after application in an oxidized pork meat model system (
Figure 1). As previously described, HT and C extracts completely inhibited the action of AAPH and AMVN; therefore, it is clear not to have great differences among fuet samples after incorporation of antioxidants extracts (HT
s, HT
o, and C).
The microbial content of fuet samples measured at day 21 of the shelf-life study (
Table 6) showed as HT
s inhibited by 90% TVC and by 44% TCC (
p < 0.05). This behavior is widely known due to the antimicrobial activity of this compound. Otherwise, HT
o showed a lower antimicrobial capacity because of the purity of the organic extract (only 7% in comparison to 99% of HT
s). The antibacterial and preservative action of hydroxytyrosol has previously demonstrated by several authors. For instance, Azaizeh et al. [
34] showed as 400 μg/mL HT extract inhibited by 100% the growth of
Streptococcus pyogenes, Staphylococcus aureus, Escherichia coli, and
Klebsiella pneumoniae. In fact, this behavior has been also reported as food preservative in chicken nuggets for twelve months of frozen storage [
17] and fish patties for eleven days of refrigerated storage [
32,
35] applied at 750 and 200 ppm, respectively.
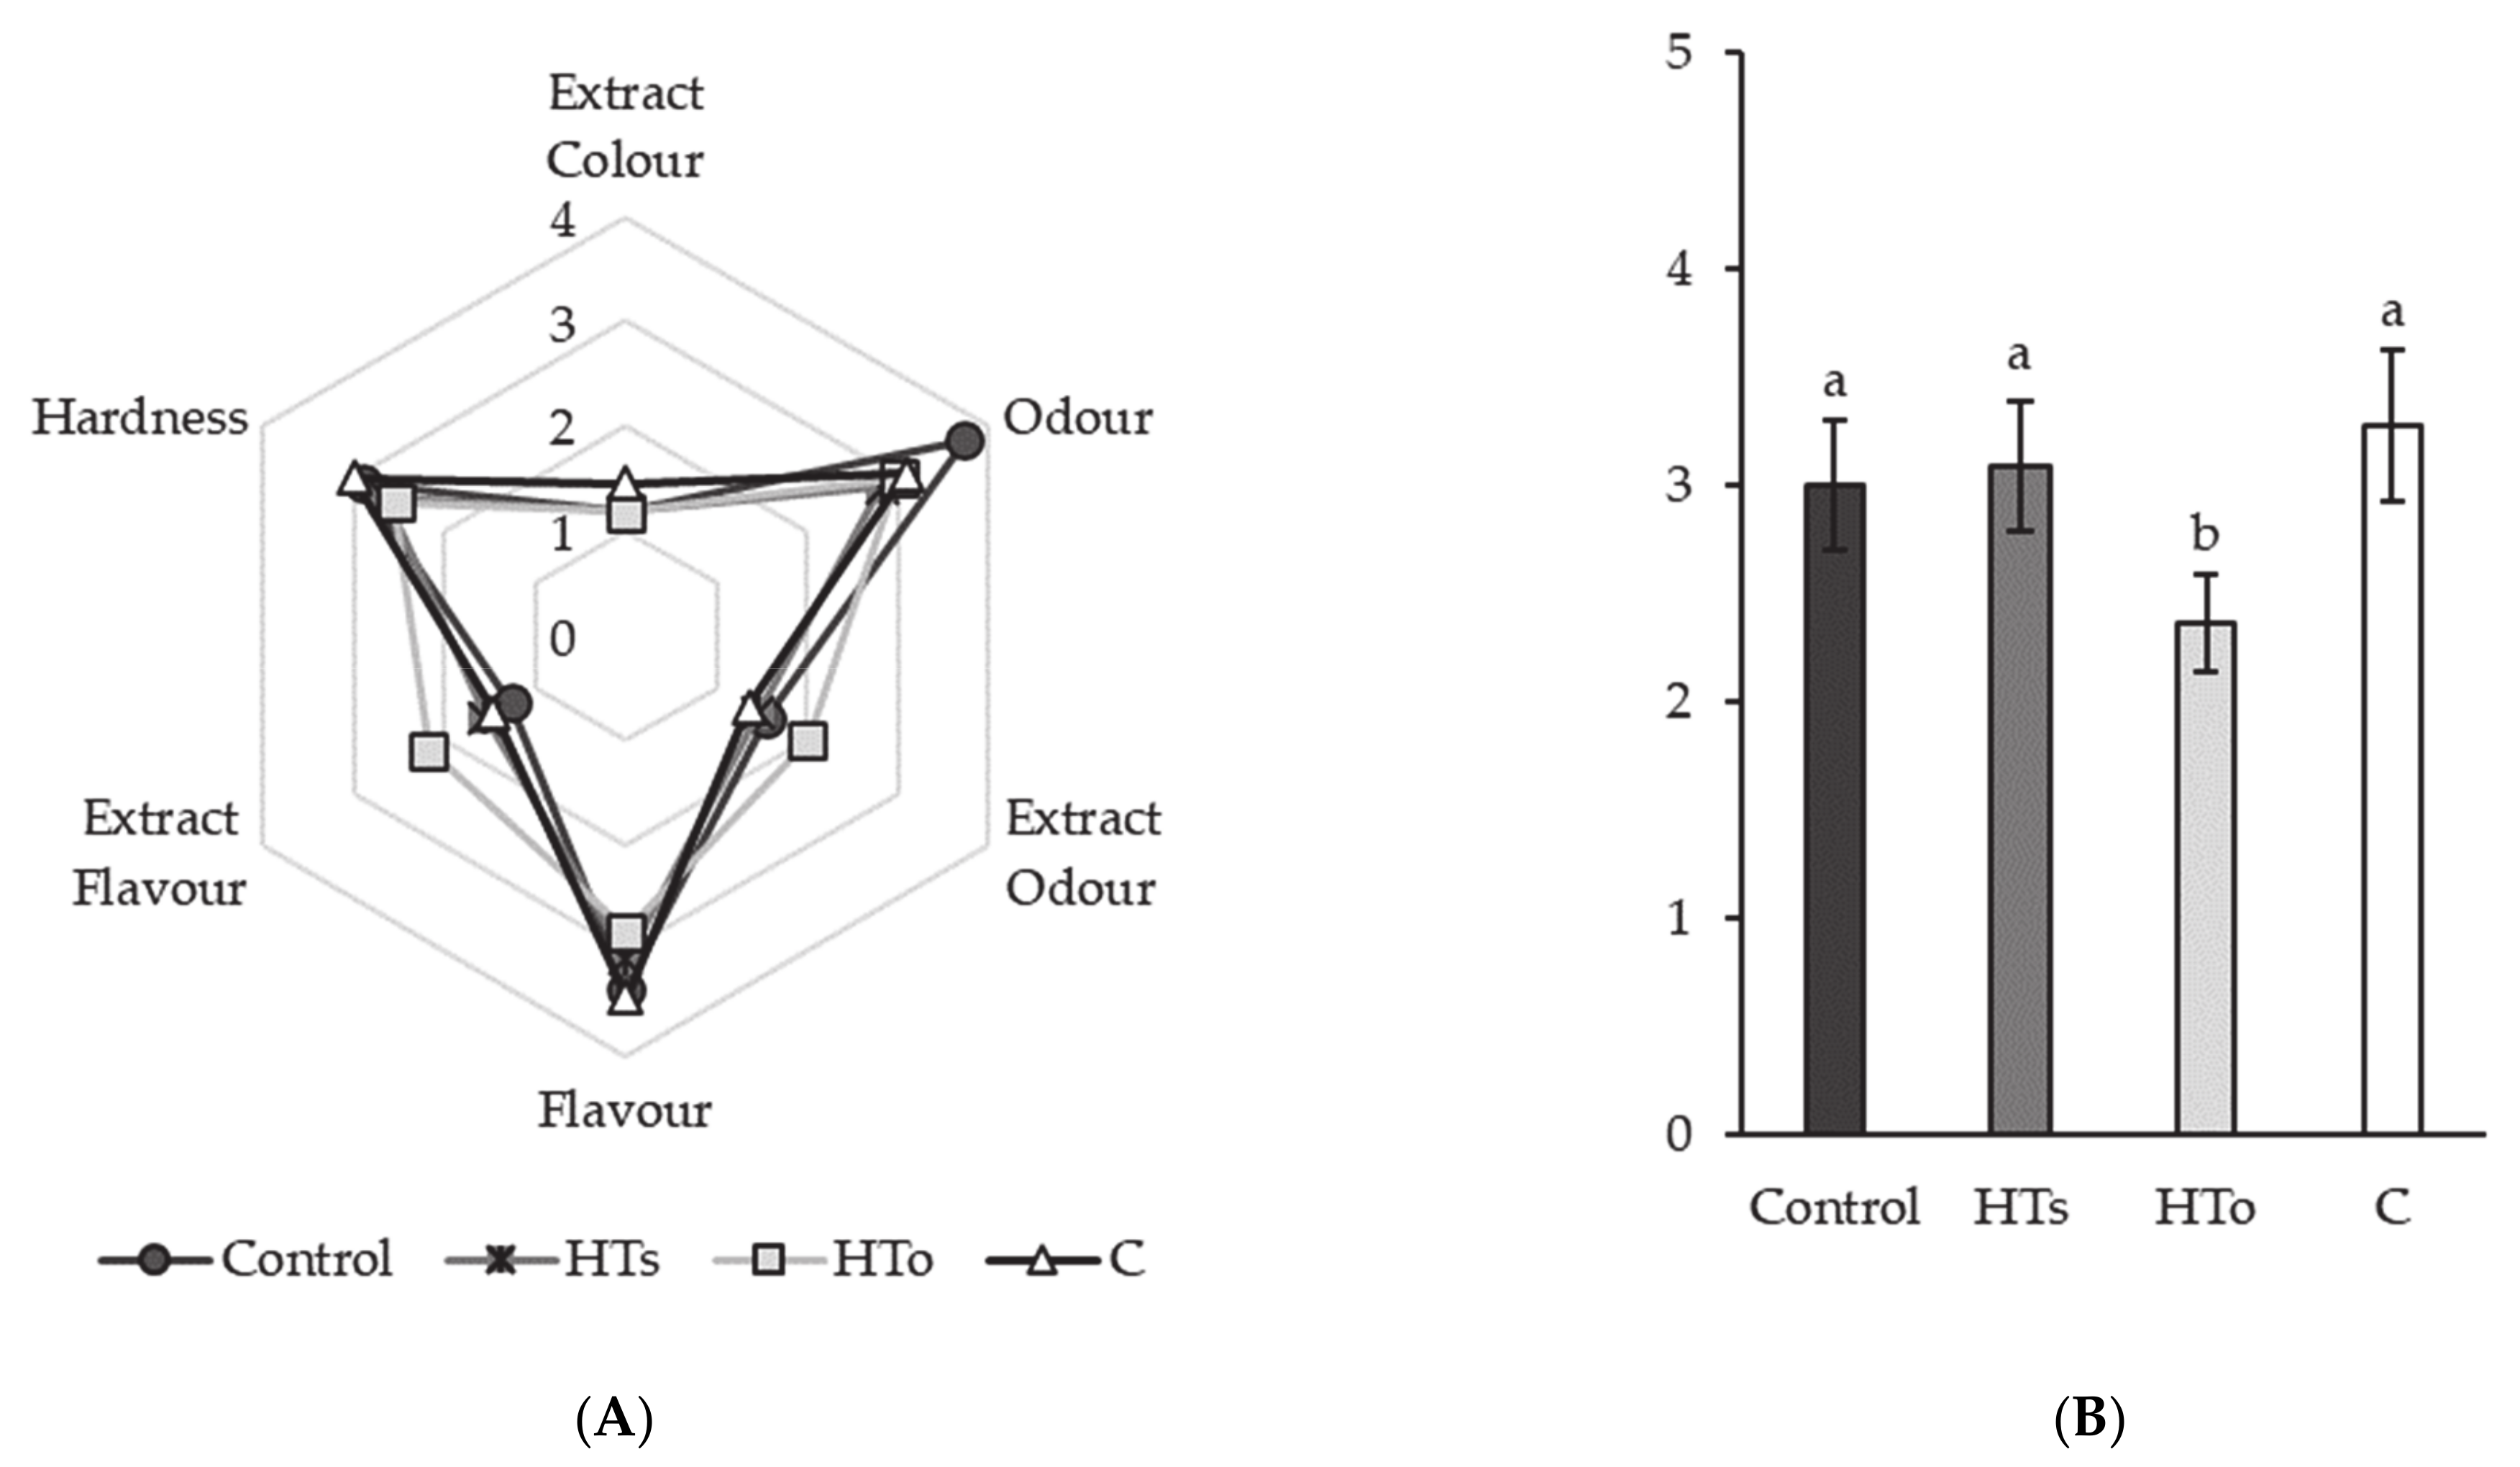
Sensory description of reformulated fuet samples is shown in
Figure 2. As previously described, acceptability of HT
o decreased by 25% (
Figure 3B) due to “Extract Flavor”. This parameter obtained a higher perception by panelists (
p < 0.05) (2.2 score) than the rest of reformulated samples (
Figure 3A). However, the high acceptability reported by HT
s and C samples was remarkable, because there were no significant differences with regard to the Control sample. This fact can be justified by the purity of HT
s, which did not contain phenolic derivatives from olive tree, as HT
o did, causing the bitter and strange taste that these fuet samples presented. This behavior was previously described by Nieto, Martínez and Ros [
30], who reported strange flavors in chicken sausages after incorporation of 50 ppm hydroxytyrosol extracts obtained from olive leaf combined to 2.5% walnuts. In addition, there were not found significant differences among studied samples regarding the rest of evaluated parameters. Moreover, as observed in
Figure 2, there were no apparent differences among the reformulated fuet, so from a visual point of view all the samples were also equally accepted.
Finally, the incorporation of HT and C extracts increased the total phenolic content in fuet samples (
p < 0.05), which also improved the total antioxidant activity measured by ORAC and FRAP methods (
Table 6). This fact demonstrated the functionality of studied fuets, because those parameters were increased even two times regarding the Control sample (
p < 0.05). Obtained results can be supported by the rest of the assessed characteristics where the antioxidant and antimicrobial capacities of HT were demonstrated (
Figure 1,
Table 5 and
Table 6). Additionally, the antioxidant activity of HT has been repeatedly demonstrated by several authors, as in vitro [
36,
37,
38], as in vivo [
39,
40,
41,
42,
43,
44] or as a preserver in a food matrix [
17,
30,
31,
32,
35,
45,
46,
47]. For that, incorporation of this kind of products in a balanced Mediterranean Diet could report significant health benefits of consumers in comparison with usual manufactured meat products rich in synthetic additives.


