Review

A Meta-Analysis of Relationships between Measures of Wisconsin Card Sorting and Intelligence

1
Department of Neurology, Hannover Medical School, Carl-Neuberg-Straße 1, 30625 Hannover, Germany
2
Behavioral Engineering Research Group, KU Leuven, Naamsestraat 69, 3000 Leuven, Belgium
*
Author to whom correspondence should be addressed.
Brain Sci. 2019, 9(12), 349; https://doi.org/10.3390/brainsci9120349
Submission received: 14 November 2019 / Revised: 25 November 2019 / Accepted: 26 November 2019 / Published: 29 November 2019
(This article belongs to the Special Issue Collection on Cognitive Neuroscience)

Abstract

:
The Wisconsin Card Sorting Test (WCST) represents a widely utilized neuropsychological assessment technique for executive function. This meta-analysis examined the discriminant validity of the WCST for the assessment of mental shifting, considered as an essential subcomponent of executive functioning, against traditional psychometric intelligence tests. A systematic search was conducted, resulting in 72 neuropsychological samples for the meta-analysis of relationships between WCST scores and a variety of intelligence quotient (IQ) domains. The study revealed low to medium-sized correlations with IQ domains across all WCST scores that could be investigated. Verbal/crystallized IQ and performance/fluid IQ were indistinguishably associated with WCST scores. To conclude, the WCST assesses cognitive functions that might be partially separable from common conceptualizations of intelligence. More vigorous initiatives to validate putative indicators of executive function against intelligence are required.

1. Introduction

Psychological functions of the frontal lobes of the human brain remain enigmatic despite decades of research (see [1,2,3,4,5] for overviews). A substantial part of this research was based on the Wisconsin Card Sorting Test (WCST), which was originally developed in the 1940s [6,7]. The WCST requires sorting cards and using feedback to shift between different task rules. It consists of cards depicting simple geometric figures that vary in color, shape, and number. Examinees have to sort cards in accordance with one of three viable rules, i.e., according to the color, shape, or number of the depicted object(s). In order to identify the currently valid sorting rule, examinees have to rely on verbal feedback, which is provided by the examiner on each trial. Positive feedback indicates that cards were matched according to the correct rule on the current trial, whereas negative feedback indicates that the applied rule was invalid. The examiner changes the task rule after a number of successively correct card sorts have been conducted by the examinee. In this regard, the WCST bears similarities to task-switching paradigms that are often utilized in experimental psychology ([8] for overview; [9,10,11]). Popular WCST scores include (1) the number of completed runs of correct card sorts (usually referred to as ‘categories’), (2) the number of perseverative errors or responses, (3) the number of non-perseverative errors, (4) the number of failures to maintain a rule (or ‘set’), and (5) the number of total errors (see [12,13] for overviews).
The WCST was introduced to neuropsychology in the 1950s for assessing higher visual functions [14]. Based on this study, it was originally thought that performance on the WCST was sensitive to (traumatic) posterior brain lesions. However, Milner’s seminal study [15] revealed that the presence of (massive, unilateral) prefrontal excisions was associated with frequently occurring rule perseverations on the WCST, despite preserved indicators of intelligence. (Milner’s publication [15] does not designate the specific intelligence test (e.g., FSIQ, VIQ, PIQ) that was utilized for the quantification of intelligence. Given that the patients were doubtlessly studied in the 1950s, and given the information provided in the related paper [16], the most probable interpretation of ‘the IQ’ in Milner’s study is that this acronym represents the IQ that was obtained from the Wechsler–Bellevue Intelligence Scale [17]. A longstanding criticism of intelligence tests such as the early versions of the Wechsler batteries (up to WAIS-R) was that there was disproportionate emphasis on measures of Gc. By contrast, these early versions of the Wechsler batteries had weaker representation of measures of Gf.) Hence, this study laid the ground for the proposition that frontal lobe functions can be assessed behaviorally by means of the WCST [18,19,20]. In the decades to follow, the idea that the WCST measures frontal lobe functions was successively replaced by the conception of the WCST as a test of executive function (EF), thereby relaxing the otherwise strong constraints about the neuroanatomical substrates of WCST performance (see [21,22,23,24,25] for reviews). EFs encompass higher cognitive functions, usually defined as a set of domain-general cognitive control mechanisms supporting goal-directed behavior (e.g., [26]), but their exact nature remains a matter of debate [27,28,29,30]. The unity/diversity model of EF, which represents a well-validated individual differences model of EF, proposes that specific EF factors of updating and shifting exist next to a general factor that is involved in all EF tasks [31,32,33,34]. Applying an early version of their model, Miyake and colleagues [35] showed that the number of perseverative errors committed on the WCST specifically reflected individual differences in the shifting factor.
Since the time of Milner’s study [15], the WCST has received several modifications (most notably by [36]) and multiple standardizations [37,38,39]. The availability of standardized test versions, as well as the prevalent acceptance of the EF construct, may have contributed to widespread dissemination of the WCST in clinical neuropsychology. The WCST is currently the most popular assessment instrument for EF [13]. Behavioral performance on the WCST is commonly interpreted in terms of mental shifting, a process which represents an important subcomponent of EF, and ensures cognitive flexibility in accordance with task requirements.
The dissociation between WCST performance and intelligence that has been reported in Milner’s study [15] might also have contributed to the widely held belief that EF represents a psychological construct that is separable from intelligence (e.g., [26]). While a detailed discussion of the facets of human intelligence goes beyond the scope of this article, a few remarks seem justified here. David Wechsler once defined intelligence as the “the global capacity of the individual to act purposefully, to think rationally and to deal effectively with his environment” [40] (p. 3). From this definition, it is evident that intelligence and EF share substantial conceptual overlap.
Psychological science of the 20th century evidenced a controversy about the most reasonable theoretical model of intelligence [41]. Spearman initially identified a single general ability that he named g (for “general factor” [42,43], but see [44]). Meanwhile, a consensus regarding the dimensionality of intelligence has only been achieved insofar as most researchers agree with the assumption of a hierarchical structure of cognitive abilities that underlie intelligence, with g at its highest level. Cattell [45] distinguished two types of cognitive abilities that are relevant for intelligence in a revision of Spearman’s concept of g. Fluid intelligence (Gf) was hypothesized as the ability to solve novel problems by using reasoning, and crystallized intelligence (Gc) was hypothesized as a knowledge-based ability that was heavily dependent on education. After Horn [46] identified a number of broad cognitive abilities in a revision of the Gf-Gc theory, Carroll [47] proposed a hierarchical model with three levels, which is now known as the CHC (Cattell–Horn–Carroll) model of intelligence [48]. The bottom level consists of highly specialized, task-specific abilities. The second level consists of a number of broad cognitive abilities, including Gf and Gc. Carroll accepted Spearman’s concept of g as a representation of the highest level, affecting performance on any particular test solely via its influence on identified broad cognitive abilities [47]. The CHC model of intelligence forms the basis of many contemporary cognitive test batteries [49].
Regardless of one’s preferred theoretical model of intelligence, the most widely utilized tests of intelligence are the Wechsler Adult Intelligence Scale (WAIS) and the Wechsler Intelligence Scale for Children (WISC). The initial version of the WAIS was released in 1955 [50], followed by the WAIS-R (1981) [51], WAIS-III (1997) [52], and WAIS-IV (2008) [53]. The initial version of the WISC was released in 1949 [54], followed by the WISC-R (1974) [55], WISC-III (1991) [56], and WISC-IV (2003) [57]. Apart from an estimate of general intelligence (i.e., Full Scale IQ, FSIQ), Wechsler tests were often used to obtain sub-scores of Verbal intelligence (VIQ) and Non-verbal Performance intelligence (PIQ). The concepts of VIQ and PIQ are closely related to the CHC abilities Gc and Gf, respectively. (The verbal VIQ and the non-verbal PIQ represent concepts that are a little bit broader than Gc and Gf. In the case of the WAIS-R, the VIQ includes the subtests {information, comprehension, arithmetic, digit span, similarities, and vocabulary}, while the PIQ includes the subtests {picture arrangement, picture completion, block design, object assembly, and digit symbol}. This is similar for the WAIS-III because here the subtests that comprise the WAIS-III VIQ, which are labeled verbal comprehension {vocabulary, similarities, information, comprehension} and working memory {arithmetic, digit span, letter-number sequencing}, confer to Gc plus Gsm (short-term memory; see [58], Table 5). The subtests that comprise the WAIS-III PIQ, which are labeled perceptual organization {picture completion, block design, matrix reasoning} and processing speed {digit-symbol coding, symbol search}, confer to Gf, Gv (visuospatial abilities) plus Gs (processing speed; see [58], Table 5)).
Other IQ tests focus more directly on the assessment of CHC-compatible broad cognitive abilities. For example, the National Adult Reading Test [59] (NART) is often used to assess Gc in clinical neuropsychology, under the assumption that this education-dependent facet of intelligence is relatively insensitive to neurological alterations, and can thus serve as an estimate of the premorbid level of crystallized intelligence [26]. Crawford et al. [60] found that the NART predicted 72% of WAIS-VIQ variance, but only 33% of the WAIS-PIQ variance. Raven’s Progressive Matrices [61] (RPM) and the Culture Fair Test [62] (CFT) are often considered as quintessential measures of fluid intelligence (e.g., [43]). The RPM and the CFT are also closely related to the PIQ since both tests utilize non-verbal materials. In the remainder of this article, we have thus considered the NART as a proxy for the VIQ (both rather focusing on the assessment of Gc), and the RPM/CFT as proxies for the PIQ (all rather focusing on the assessment of Gf).
A number of authors have tried to unify intelligence and neuropsychological assessment based on the CHC model [58,63,64,65,66,67,68,69,70,71]. For example, Jewsbury et al. [65] showed that popular neuropsychological EF tests were subsumable under CHC broad cognitive abilities based on factor analytic methods, although particular EF tests were related to distinct CHC constructs. Most importantly in the present context, WCST perseverative errors were found to be related to GvGf, i.e., visuospatial (Gv) and fluid (Gf) facets of intelligence in that study (see also [64]). The conclusion that WCST performance and fluid intelligence are highly correlated was also corroborated by a neuropsychological study: Roca et al. [72] showed that when patients suffering from frontal lobe lesions and controls were matched on the CFT, i.e., on a measure of Gf, the frequency of WCST total errors no longer differed between these groups. The authors took these data to suggest that the unique variance in WCST performance was negligible once the variance that this measure shared with fluid intelligence was accounted for. The conclusion drawn by Roca and colleagues [72] lies in obvious conflict with Milner’s [15] assertion that the WCST allows for the detection of frontal dysfunctions in the absence of noticeable declines in intelligence.
The question to what degree WCST performance is separable from measures of intelligence is of vital importance for the concept of EF. EF would be an unnecessary psychological construct if discriminant validation of WCST scores against indicators of intelligence should fail. Cronbach characterized the issue in the following words:
“To defend the proposition that a test measures a certain variable defined by a theory, one looks basically for two things. The first is convergence of indicators. […] The second kind of evidence is divergence of indicators that are supposed to represent different constructs. If a test is said to measure “ability to reason with numbers,” it should not rank pupils in the order a test of sheer computation gives, because the computation test cannot reasonably be interpreted as a reasoning test. The test interpretation should also be challenged if the correlation with a test of verbal reasoning is very high, because this would suggest that general reasoning ability accounts for the ranking, so that specialized ability to reason with numbers is an unnecessary concept.” ([73], p. 144; italics in the original text)
According to Cronbach’s example, the construct of numerical reasoning would be unnecessary in the case that discriminant validation against computational abilities or verbal reasoning should fail. In general, any worthwhile cognitive construct (e.g., numerical reasoning) requires discriminant validation against related cognitive constructs (e.g., computational ability, general reasoning). We referred to this prerequisite of designing an evidence-based cognitive architecture as ‘Cronbach’s hurdle’. Of importance for the present study, putative EF tests (such as the WCST) had to demonstrate discriminant validity against measures of intelligence in order for the EF construct to take the hurdle. The provision of empirical support for discriminant validity of the WCST has been a relatively neglected topic [74]. Some of the few exceptions to that rule were discussed above in detail. These studies had their methodological grounding in factor analytic methods [64,65,68,69,70], in regression methods [71], or in neuropsychological patient studies [15,72].
The present meta-analysis complements the hitherto available evidence with regard to the discriminant validity of WCST scores against intelligence. For that purpose, our meta-analysis focused on the correlations between popular WCST scores (i.e., number of categories, frequency of various types of errors) and a variety of IQ domains (i.e., FSIQ, PIQ, VIQ). Individual studies often fail to obtain reliable estimates of correlations due to insufficient sample sizes [75]. By pooling data from these studies using meta-analytical techniques, one cannot only arrive at more reliable correlation estimates, but also examines potential origins of between-study variability in the strength of these correlations [76]. Thus, the present meta-analysis of correlations between WCST scores and IQ domains informed the ongoing discussion (a) about the construct validity of the WCST, and, by way of this, (b) about the overlap between EF and intelligence in a more general sense.

2. Materials and Methods

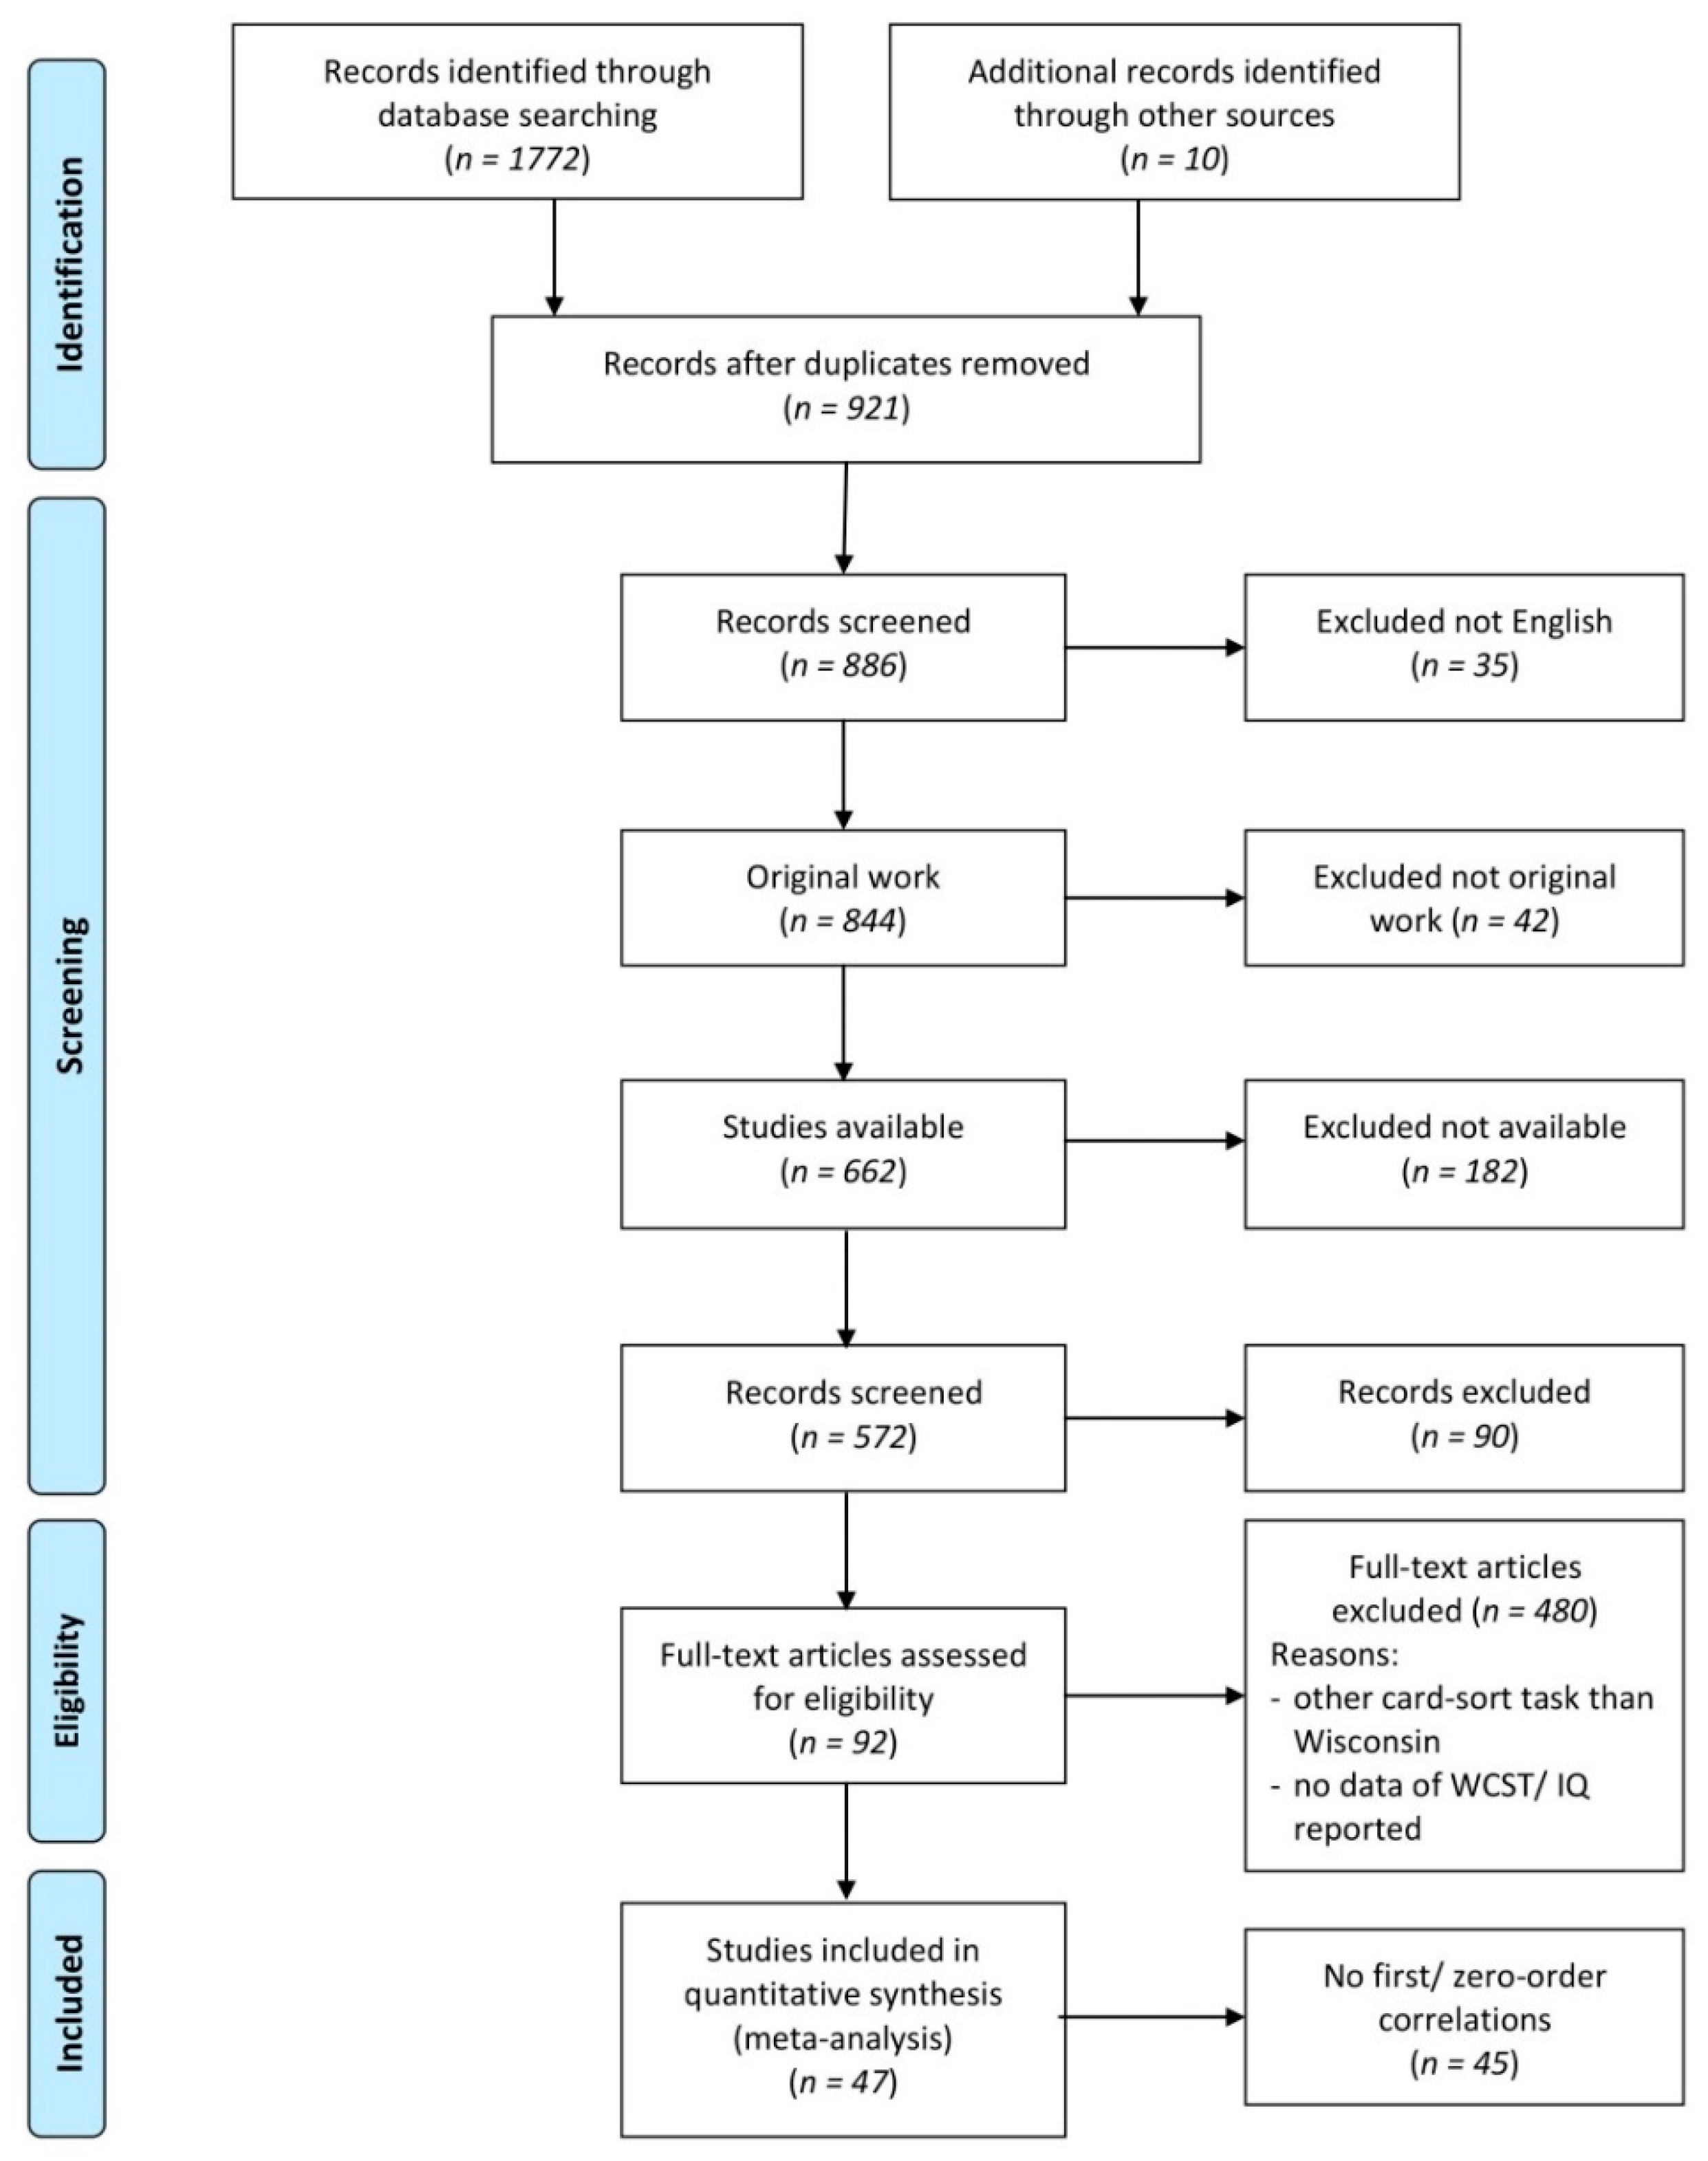
2.1. Search Strategy

A systematic literature review was conducted in 2017 by MH and updated in July 2018 by NM. We searched for records including the term “card sort *” in combination with any of the following keywords regarding intelligence domains and tests: “intelligence”, “iq”, “fsiq”, “viq”, “piq”, “WAIS”, “WISC”, “normative”, “progressive matrices”, “Raven’s matrices” and “Raven’s”. PubMed (705 studies), Science Direct (326 studies), Web of Science (741 studies) and, in addition, the Compendium of Neuropsychological Tests [77] (10 studies) yielded a total of (1782 studies) hits for these combinations of search keywords (Figure 1). First of all, double appearances (861 studies) were excluded. Thirty-five additional papers were published in languages other than English and therefore had to be excluded. We screened the titles and abstracts of the remaining records and excluded studies that did not involve an assessment of original data from the WCST and intelligence domains (e.g., reviews or meta-analyses). 182 studies of the left over 844 studies remained inaccessible via local university libraries or open access.
In total, we accessed 662 full texts, and we checked whether the data reported in these papers included correlation coefficients for the relationship between any scores of WCST performance and any domains of intelligence. At this step, studies were excluded when it became apparent that they did not administer the WCST, or when they did not report data from the WCST and at least one domain of intelligence. Papers that only reported test statistics for group difference involving WCST scores and intelligence domains, without reports of correlative relationships between WCST and intelligence, were also excluded at this step.
Of the remaining 92 studies, 45 did not report correlations between WCST scores and intelligence domains and were therefore excluded. The studies that had to be excluded at this final step either reported the results of multivariate statistics (e.g., regression analyses or factor analyses) that did not allow for the estimation of bivariate correlations, or they did not include a measure that could be utilized for estimating the FSIQ, VIQ, or PIQ domains. Forty-seven studies remained for the final meta-analysis.

2.2. Data Extraction and Coding

2.2.1. WCST Scores

The extracted studies reporting correlations between WCST performance and intelligence reported a large variety of different WCST scores. To guarantee adequate statistical power for all analyses, we decided to focus on the WCST scores that had been reported in at least five independent studies. All those excluded (such as conceptual level responses or numbers of trials required to complete the first category) were found to be reported in a maximum of two studies. Analyzed scores included:
  • the number of categories completed (correct sequences of 6 or 10 consecutive correct matches to the criterion sorting category; the sequence length depends on the test version)
  • the frequency of perseverative errors or responses (persisting to respond to an incorrect stimulus characteristic)
  • the frequency of non-perseverative errors (errors that are not considered as perseverative errors)
  • the frequency of failures to maintain the set (e.g., when five or more consecutive correct matches are made, followed by at least one error prior to successfully completing the category) and
  • the frequency of total errors.
We did not distinguish between absolute and relative scores of the different error types (e.g., between the number and the percentage of perseverative errors). These scores are typically highly correlated and pooling data across these two types of measures allowed for a more powerful analysis of the relationship between the respective facet of WCST performance and intelligence. When a study reported both absolute and relative figures for a particular error type, we extracted the correlations involving the absolute figures. Similarly, to avoid redundancy and increase statistical power, we selected only one perseveration score for each study and did not further distinguish between perseverative errors and perseverative responses (see [21]). When multiple scores of perseveration were reported, we extracted the correlations involving perseverative errors [11]. One included study distinguished between two types of perseverative errors and we averaged correlation coefficients across both types to extract a single score representing perseveration for this study. Some studies did not report the total frequency of errors, but the total frequency of correct responses. For those studies, we changed the sign of the correlation coefficients involving the total frequency of correct responses to obtain an estimate for the correlation coefficients involving the total frequency of errors.

2.2.2. IQ Domains

We distinguished between three domains of intelligence, verbal intelligence (VIQ), performance intelligence (PIQ), and full-scale intelligence (FSIQ). With regard to VIQ, most studies reported correlations involving VIQ scores from a version of the WAIS or WISC. When studies reported only correlations involving VIQ subdomains, this information was used to estimate the correlation between VIQ and WCST scores. When multiple VIQ subdomains were reported (e.g., similarities and information), we computed average correlations across them. When only a single VIQ subdomain was reported (e.g., vocabulary) we took its correlation as the best estimate of the correlation between VIQ and WCST performance. Vocabulary tests that are used to assess premorbid intelligence (i.e., the NART and the MWT [78]) were also considered to be measures of VIQ as was the Ammons Quick Test [79].
Similarly, values for the PIQ category were obtained by extracting reported Wechsler PIQ aggregate scores or by estimating PIQ based on the reported Wechsler PIQ subdomains. The remaining measures in the PIQ category included the CFT (and its matrix subtest), the RPM, the Shipley Abstraction test [80], the matrices subtest of the Stanford–Binet Intelligence Scale [81], and the reasoning subtest of Thurstone’s Primary Mental Abilities [82].
One study reported two indices of VIQ and two other studies reported two indices of PIQ. For these studies, we extracted the correlations involving the more common domain (i.e., the one that was more frequently reported in the other included studies) and conducted robustness tests using the alternative domain.
The FSIQ category consisted exclusively of FSIQ aggregate scores obtained from the intelligence tests of Wechsler and Kaufman [83]. Some studies reported data from established short versions of a Wechsler test and others created ad hoc short versions by combining scores from subtests of the VIQ and PIQ domains (e.g., Vocabulary and Block Design). They were all considered as FSIQ domains for the present set of analyses.

2.3. Correlation Coefficients

Given the selection of five WCST scores and three domains of intelligence, we extracted a theoretical maximum of 15 correlation coefficients per independent study sample. Some studies reported multiple correlation coefficients per measure combination as a result of investigating this correlation in independent subgroups (e.g., patients vs. control participants). For these studies, we extracted correlation coefficients separately for every independent sample of participants. Most of the included studies reported Pearson’s r or Spearman’s rho correlation coefficients, one study reported Kendall’s tau, and another study reported a mix of parametric and non-parametric correlations (see Table 1).
We did not invert the sign of the extracted correlation coefficients, that is, positive correlations between IQ and the number of completed WCST categories and negative correlations between IQ and WCST error scores indicated that WCST performance improved with increasing IQ. When a study did not report the size of a correlation coefficient, but only that this coefficient was not statistically significant, we excluded this coefficient from our analyses. However, we ran additional robustness analyses to test whether our results changed when these coefficients were included as correlations of r = 0.

2.4. Basic Meta-Analysis

Mean effect sizes and confidence intervals for the relationships between the five selected WCST scores and three selected intelligence domains were calculated using the random-effects model method (with inverse variance weights) proposed by Hedges and Vevea [130] and implemented by Field and Gillett [76]. Heterogeneity of effect sizes were examined using Cochran’s Q and the I2 index [131]. By comparing Cochran’s Q (estimated under fixed-effect assumptions) to a χ2 distribution, we tested whether heterogeneity among studies was significant. The I2 index served as an estimate of between-study heterogeneity in true effect sizes, with I2 values of about 25%, 50% and 75% indicating low, moderate, and high heterogeneity, respectively [131].

2.5. Moderator Analyses

We examined whether the strength of the correlation between domains of intelligence and WCST performance were moderated by the sample and study characteristics that were routinely reported in neuropsychological studies on the WCST-IQ relationship. To guarantee a minimum statistical power for these analyses, we focused on the correlations involving the two most frequently reported WCST scores, that is, the number of completed WCST categories and the frequency of perseverations. We extracted the following variables as potential moderators of the WCST-IQ relationship: (1) the mean age of participants, (2) the standard deviation of participants’ age, (3) the proportion of female participants in the sample, (4) clinical status, (5) the WCST version used, (6) the WCST administration method used, and (7) the intelligence test used.
Demographic variables (mean age, standard deviation of age as well as proportion of female participants) were treated as continuous predictors. For illustrative purposes, we also created three groups of studies including participants from different age categories (mean age <18 years, 18–50 years, >50 years) and repeated our analyses with mean age as a categorical predictor. Some studies reported WCST and IQ data from a sample that was smaller than the sample for which they provided demographic data (i.e., not all participants completed all neuropsychological measures). For these studies, we estimated the age and sex distribution of the sample of interest (i.e., the sample underlying the computation of WCST-IQ correlations) by extracting the demographic data for the total sample. When studies did not provide the standard deviation of participants’ age, standard deviations were estimated from range data (minimum, maximum) according to the procedure described by Wan, Wang, Liu, and Tong [132].
Regarding the moderating role of clinical status, we tested whether correlations between IQ domains and WCST scores were stronger in samples of patients with psychiatric or neurological disorders than they were in samples of healthy participants. Some studies reported correlation coefficients from mixed samples of patients and healthy controls. These studies were excluded for the analysis of the moderating role of clinical status.
With regard to the WCST version used in the individual studies, we distinguished (a) between the Heaton version [37,38] and the Nelson version [36] of the test and (b) between computerized and non-computerized WCST versions. IQ domains were contrasted based on their comprehensiveness. With regard to FSIQ, we distinguished between studies that used an abbreviated version (established or ad hoc) of an FSIQ test (i.e., an aggregate of a subset of subtests) and studies that used full version FSIQ tests. With regard to VIQ tests, we distinguished between pure vocabulary tests (NART, MWT-B, Ammons Quick Test, Wechsler vocabulary subtests) and more comprehensive VIQ tests (i.e., aggregates of at least two Wechsler subtests). With regard to PIQ tests, we distinguished between culture-reduced (matrices) tests (Cattell’s matrices, CFT, RPM, RCPM) and Wechsler scores (aggregated across at least two subtests).
The relationship between potential moderators and the size of the WCST-IQ correlation was examined using separate weighted multiple regression analyses (random-effects model with inverse variance weights [76]). Continuous moderator variables (i.e., mean age, standard deviation of age, proportion of female participants) were z-transformed to facilitate comparisons between regression coefficients.

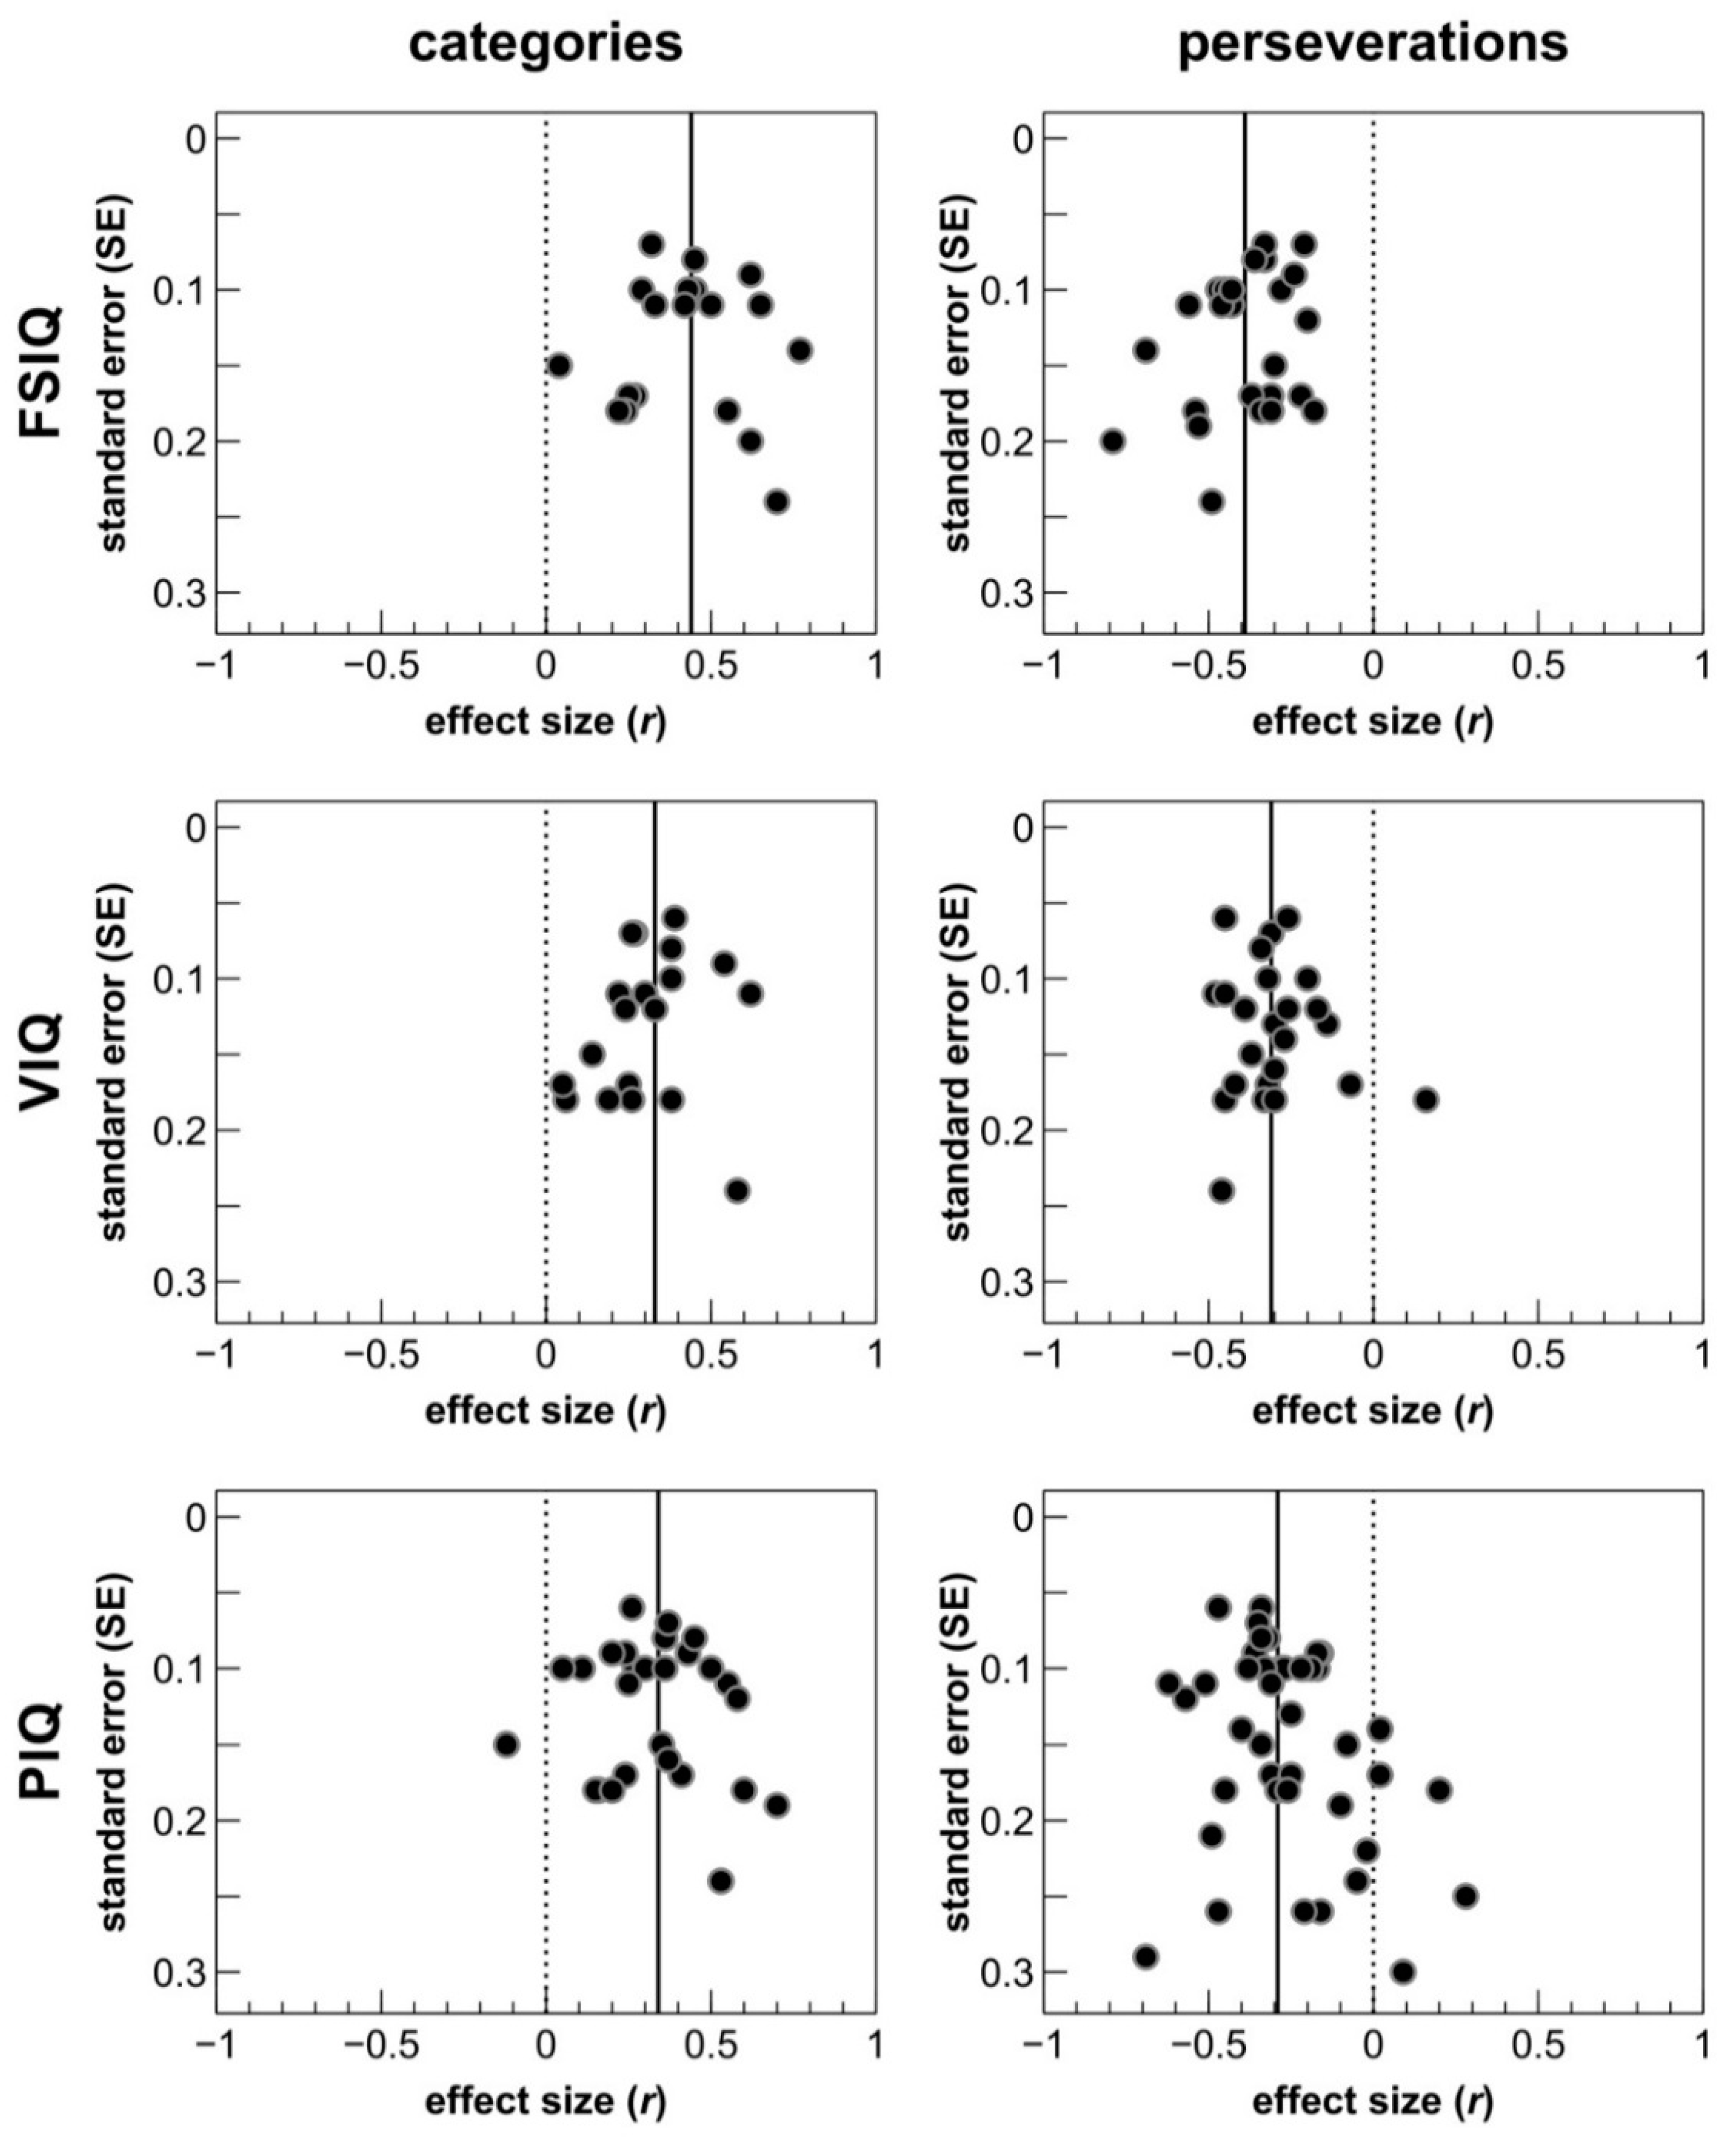
2.6. Publication Bias Analysis

The Begg and Mazumdar rank correlation test was calculated as implemented in the syntax by Field and Gillett [76] to examine the relationship between effect sizes and their standard errors. A positive correlation between these two variables was indicative of a small-study effect (i.e., the tendency for studies with smaller samples to produce larger effect size estimates). Such an overrepresentation of small studies with large effect sizes can be the result of publication bias [133] and it would likely contribute to an overestimation of the true effect size. Note that this logic only applied when the effect size in question was positive (e.g., as expected for the correlation between WCST categories and IQ tests). With regard to negative average effect sizes (e.g., as expected for the correlation between WCST error scores and IQ domains), negative correlations between effect sizes and standard errors were indicative of small-study effects.

2.7. Partial Correlations

Partial correlations were used to examine a) the age-corrected relationship between WCST performance and IQ and b) the IQ-corrected relationship between age and WCST performance. Partial correlations were either directly extracted from the publication or calculated based on zero-order correlations using http://vassarstats.net/ [134]. Only 11 studies reported the information necessary to be included into one of our meta-analyses on partial correlations and we decided to pool these data across WCST scores and IQ domains. For this purpose, the former was recoded so that larger values indicated better performance. When partial correlations involving multiple WCST scores were reported, the average partial correlation across them was extracted.

3. Results

The results of our random-effects meta-analysis of the correlation between IQ domains and WCST performance is displayed in Table 2. An inspection of Table 2 reveals that most of the analyzed WCST scores were significantly related to all IQ domains. With the notable exception of weak correlations between IQ and WCST failures to maintain set, the size of WCST-IQ correlations ranged from small-to-medium (r = 0.19) to medium-to-large (r = 0.44) [135]. Correlations appeared to be stronger when they involved (a) a general (i.e., categories, total errors) versus more specific (i.e., perseverations, non-perseverative errors) WCST performance score, and (b) a general (i.e., FSIQ) versus more specific (i.e., VIQ, PIQ) domain of IQ. Note, however, that most of the 95% confidence intervals surrounding the corresponding effect sizes overlapped substantially.
Robustness analyses revealed that average correlation coefficients increased slightly (by r = 0.002 to r = 0.021) when alternative IQ tests were included (see Section 2.2.2) and decreased slightly (by r = 0.009 to r = 0.023) when coefficients that were described as non-significant were included as coefficients of r = 0. The negligible magnitude of these changes suggested that the results displayed in Table 2 were largely invariant to the analytical choices we made when extracting effect sizes from individual studies.
Rank correlation tests did not find any of the significant WCST-IQ correlations to be significantly affected by small-study effects. In combination with the funnel plots displayed in Figure 2, these results suggest that meta-analytical correlation coefficients are unlikely to be substantially overestimated due to publication bias. This notion receives further support from the observation that many of the publications included in this meta-analysis reported non-significant correlations between WCST scores and IQ domains (see Table 2).

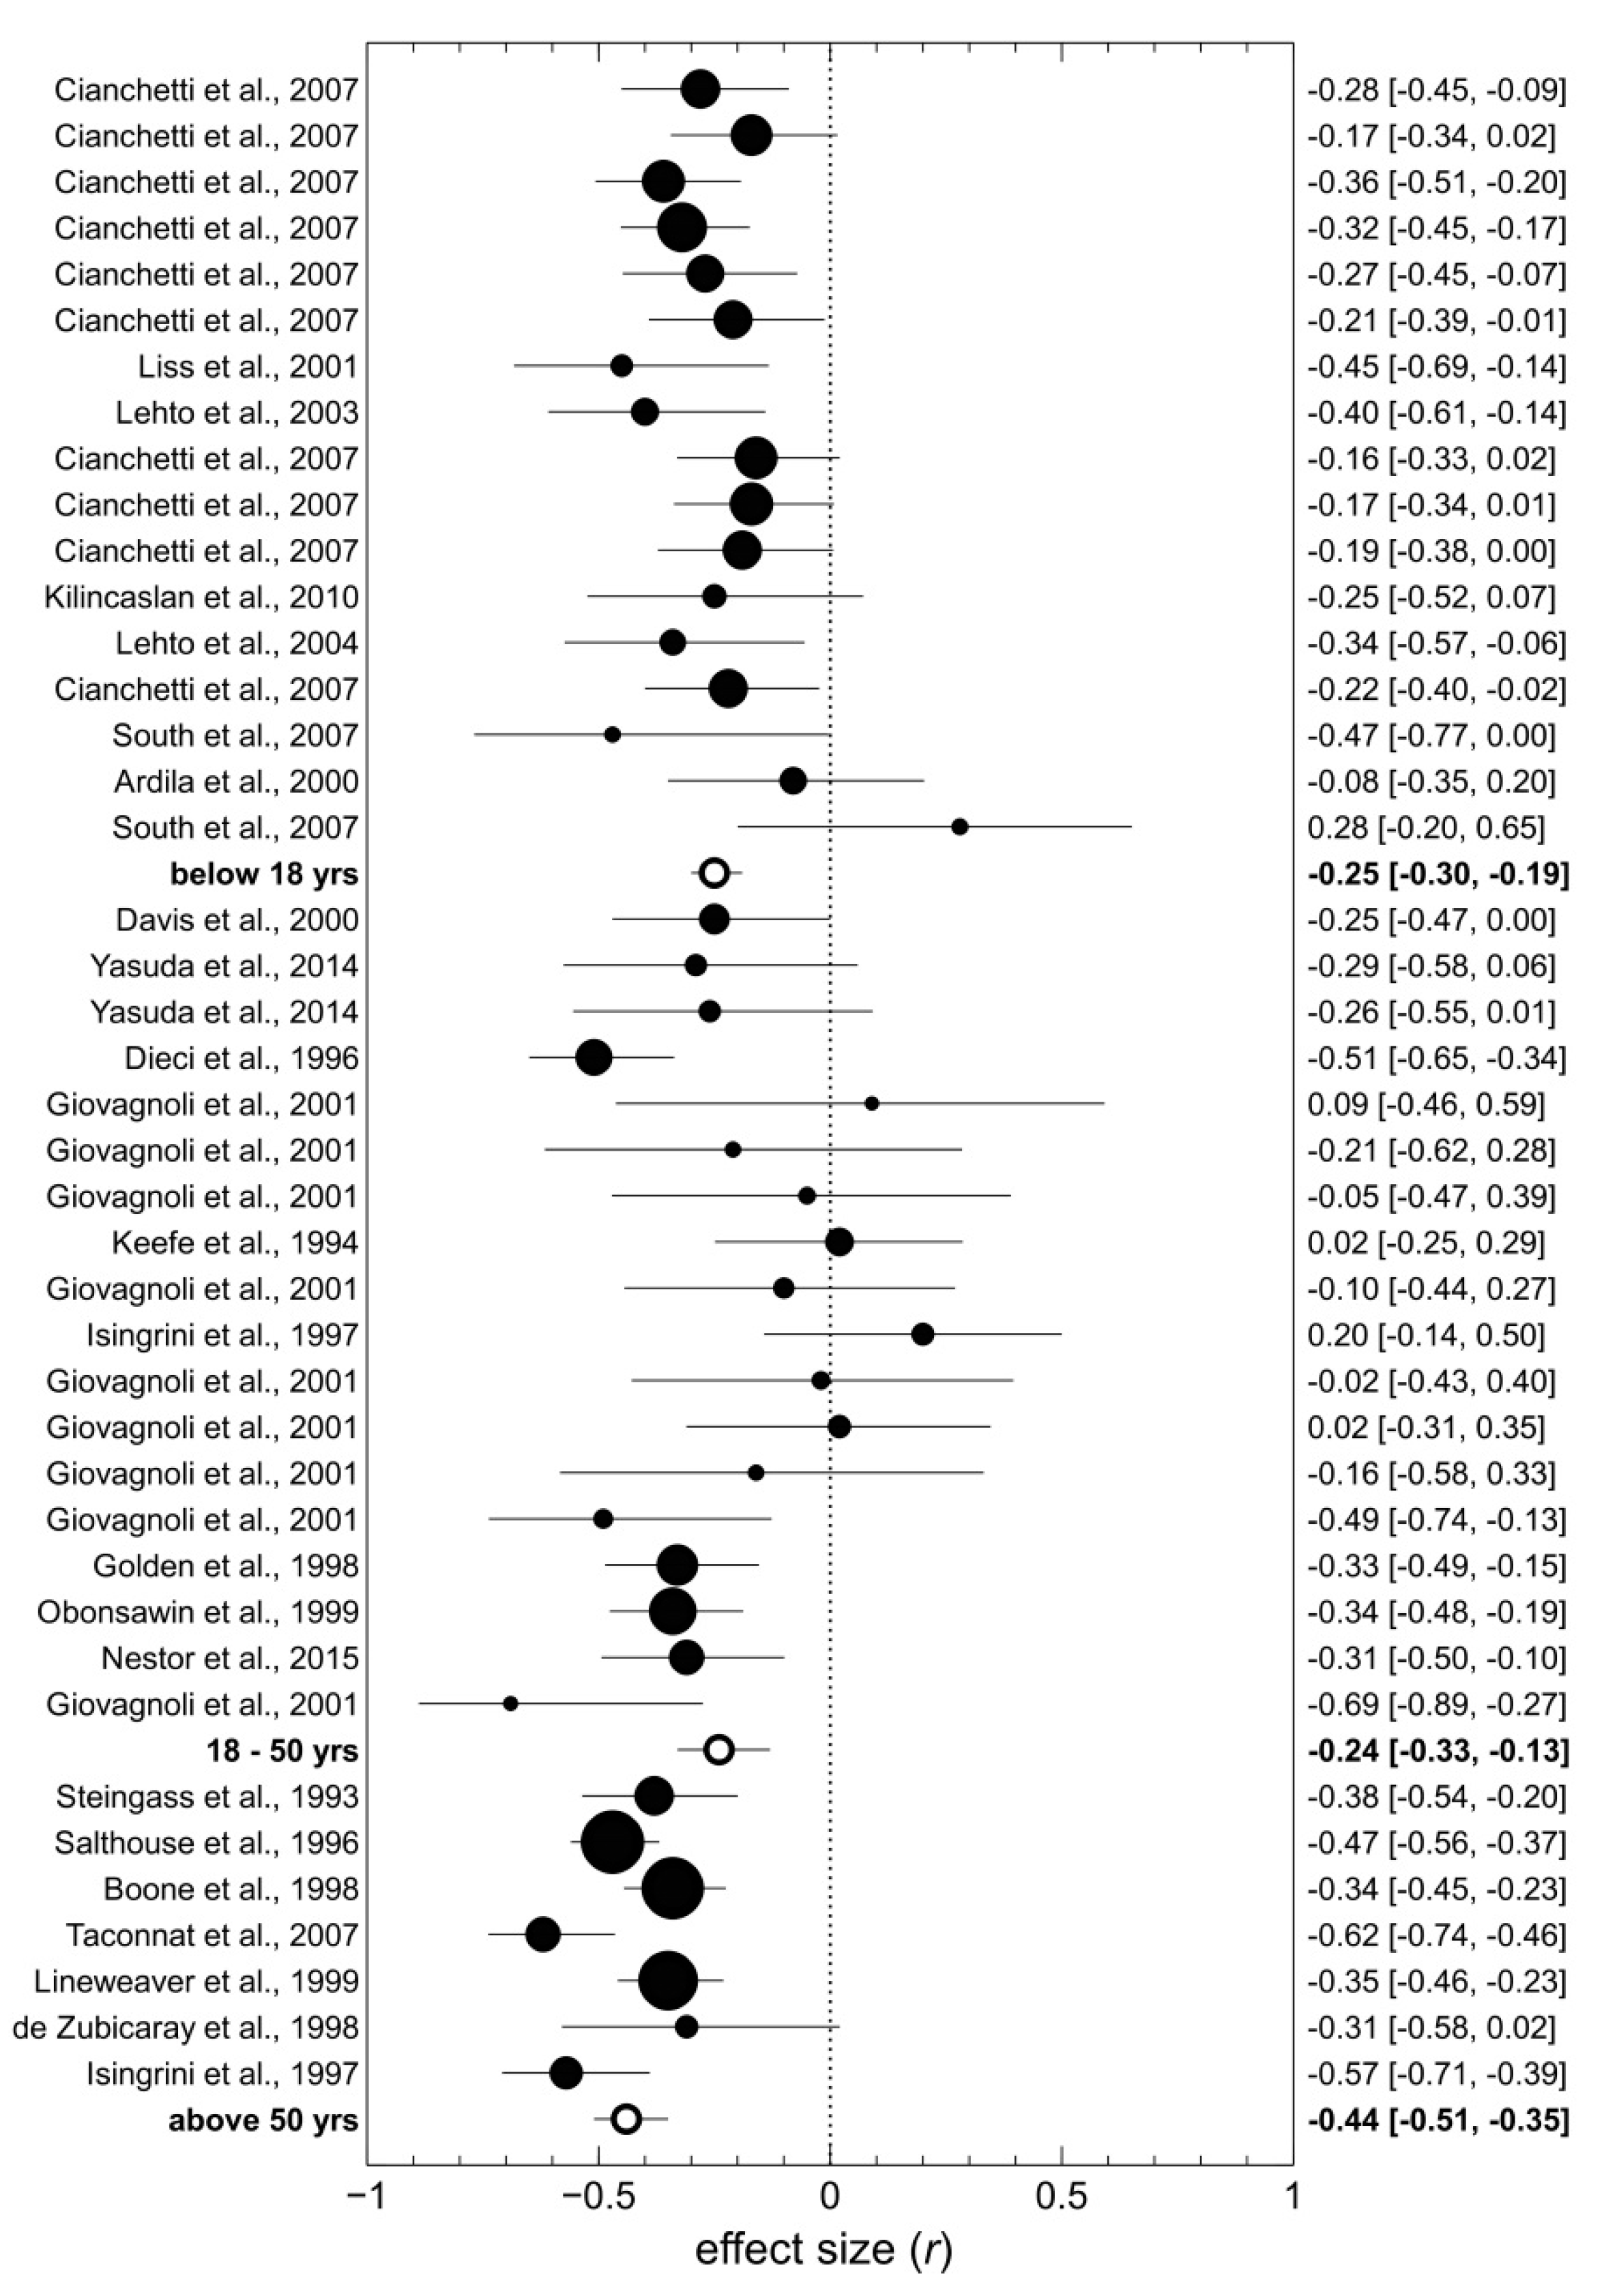
3.1. Moderator Analyses

Effect-size heterogeneity was moderate (i.e., around I² = 50%) for most of the analyzed WCST-IQ correlations. These results indicated that the size of these correlations may vary as a function of sample or study characteristics. Our moderator analyses (see Table 3) identified some of the factors that contributed to heterogeneity in the size of WCST-IQ correlations.
First, we found the correlation between WCST perseverations and PIQ domains to depend on the mean age of participants in the sample, β = −0.07, t (39) = −3.05, p = 0.004. Correlations were markedly stronger in samples with a mean age above 50 years, k = 7, r = −0.44, 95% CI [−0.51, −0.35], I2 = 57%, than they were in samples of younger adults (18−50 years), k = 18, r = −0.24, 95% CI [−0.33, −0.13], I2 = 49%, or in samples of children and adolescents (below 18 years), k = 17, r = −0.25, 95% CI [−0.30, −0.19], I2 = 4%, as shown in Figure 3.
Second, moderator analyses revealed the size of the correlation between WCST perseverations and FSIQ domains to be related to participants’ clinical status, χ2(1) = 4.76, p = 0.029. Correlations were stronger in samples of patients, k = 9, r = −0.49, 95% CI [−0.60, −0.36], I2 = 62%, than they were in samples of healthy individuals, k = 11, r = −0.34, 95% CI [−0.39, −0.27], I2 = 17%.
Finally, we did not find the size of WCST-IQ correlations to depend significantly on the WCST version or IQ test administered in the original studies. This lack of effect-size difference cannot be considered conclusive given the small number of studies involved in these comparisons. However, it is worth noting that irrespective of the administered test versions, WCST-IQ correlations remained significant. For both categories and perseverations, we found exclusively significant correlations with all IQ domains for both Heaton versions, |r| = 0.33–0.46, all p < 0.001, and Nelson versions, |r| = 0.26–0.45, all p < 0.001, of the WCST. Similarly, all WCST-IQ correlations were substantial when involving traditional, non-computerized WCST variants, |r| = 0.29–0.47, all p < 0.001, as well as in the small number of studies involving computerized WCST versions, |r| = 0.23–0.34, all p < 0.026. With regard to IQ test variants, comprehensive Wechsler-type measures of FSIQ, VIQ, and PIQ were found to correlate significantly with WCST categories and perseverations, |r| = 0.30–0.43, all p < 0.001. Correlations were also substantial (p < 0.001) in the smaller samples of studies administering short-version FSIQ tests, categories: r = 0.37; perseverations: r = −0.31, vocabulary VIQ tests as indicators of premorbid intelligence, categories: r = 0.27; perseverations: r = −0.29, or culture-reduced (matrices) PIQ tests, categories: r = 0.32, 95%, perseverations: r = −0.27.

3.2. Partial Correlation Analyses

Meta-analysis of partial correlation coefficients revealed a significant relationship between WCST and IQ performance when controlling for age, k = 10, r = 0.36, 95% CI [0.25, 0.46], I2 = 70%. A rank correlation test did not find this relationship to be significantly affected by small-study effects, r = 0.20, p = 0.421. The correlation between age and WCST performance was not significant when controlling for IQ, k = 9, r = −0.04, 95% CI [−0.24, 0.17], I2 = 91%. Of note, this overall null-correlation resulted from a positive IQ-corrected relationship between age and WCST performance in samples of children and adolescents, k = 3, r = 0.35, 95% CI [0.15, 0.52], I2 = 67%, and a negative IQ-corrected relationship between age and WCST performance in adult samples, k = 6, r = −0.22, 95% CI [−0.32, −0.11], I2 = 49%.

4. Discussion

The present meta-analysis examined discriminant validity of WCST scores against common domains of intelligence. We found robust, low to medium-sized correlations between WCST performance and IQ across all WCST scores and IQ domains that we investigated. Solely the average correlations between WCST failures to maintain set and IQ amounted to coefficients very close to zero. Average correlations between WCST non-perseverative errors and IQ were higher (|r| = 0.19–0.30), and correlations between the most commonly utilized WCST scores (number of categories, total errors, perseverations) and IQ were generally the highest. Average correlations between these WCST scores and FSIQ were somewhat higher (|r| = 0.39–0.44) than those between them and VIQ (|r| = 0.31–0.37) and PIQ (|r| = 0.29–0.36), respectively. Taken together, the present meta-analysis revealed modest correlations between most of the WCST scores and IQ domains, based on sample sizes that varied between N = 260 and N = 3256.

4.1. Discriminant Validity of the WCST

If one thinks about the observed correlations in terms of the proportion of the variance in WCST scores that is predictable from IQ, the calculation of r squared reveals about 0 (failures to maintain set) to 19 (categories) percent shared variance, leaving 81 to 100 percent unique WCST variance, i.e., variance unaccounted for by common measures of intelligence. Our findings therefore suggest that WCST and FSIQ, VIQ, PIQ represent partially separable measures of cognitive abilities. One possibility to account for these results lies in the referral to the unity/diversity model of EF that we shortly presented in the Introduction. According to the latest revision of the model, performance on EF tasks can be accounted for by a general EF factor, an updating-specific factor, and a shifting-specific factor. Both the general EF factor and the updating-specific factor seem to share substantial variance with measures of intelligence. In contrast, the shifting factor, which has been shown to underlie perseverative errors on the WCST [35], appears to be largely unrelated to intelligence [31,136].
A second possibility to account for these results is grounded in the distinction between measures and constructs, and the argument that less than perfect measurement reliability attenuates the actual correlations that may exist at the construct level [137,138]. Yet, even when we corrected for potential attenuation of the correlations that might result from imperfect reliabilities of WCST scores and IQ domains, the unique portion of WCST variance surpassed the portion of WCST variance that was shared with variance in IQ. As an example, consider the strongest correlation that we found in our meta-analysis, that is, the correlation between WCST categories and FSIQ (rxy = 0.44). Based on a quite conservative estimate for the reliability of the IQ tests that were studied (rxx = 0.90), and a computed average reliability of WCST categories (about ryy = 0.60; see Table A1 and Table A2 in the Appendix A), this observed correlation can be ‘disattenuated’ to yield an estimated correlation of rxtyt = 0.60 at the construct level. These numbers imply 36 percent shared variance between WCST categories and FSIQ at the construct level in comparison to 19 percent that shared variance at the measurement level (the Appendix A provides more details for disattenuation analyses). While these numbers indicate that the proportion of shared variance at the construct level might be about two times higher than the proportion of shared variance at the measurement level, they also indicate that—at best—about one third of the variability in mental shifting (i.e., the presumed construct behind performance on the WCST) can be accounted for by variability in the common construct of intelligence. The results from these disattenuation analyses hence suggest that the mental shifting construct is not identical to the commonly presumed intelligence construct. We conclude that WCST scores and IQ domains represent partially independent constructs, even if the attenuation of the correlations between them is taken into account. These results support the idea that, despite conceptual overlap between accepted definitions of intelligence and executive functioning, the WCST assesses cognitive abilities that are partially separable from intelligence.
One of the reviewers asked for a report of internal reliability indices of a WCST version since our literature review concerning this matter was fruitless, as discussed above (the literature reports only indices of test-retest reliability). The question that arises here is whether the assumption of WCST internal reliability estimates of at least ryy = 0.60 is defendable because otherwise the construct-level correlation between WCST scores and IQ domains would surpass the calculated estimate of rxtyt = 0.60. Note, that we recently published internal reliability estimates of WCST scores, and that these estimates fell well above r = 0.90, suggesting that ryy = 0.60 yields a well-defendable estimate for the upper bound of construct-level correlations between WCST scores and IQ domains [9].
Hence, the WCST surpasses Cronbach’s hurdle of sufficient discriminant validity against common intelligence tests, thereby justifying the utilization of the mental shifting construct in the context of the WCST. Viewed from this broader perspective, the overlap between EF (or at least, a more specific EF shifting factor, represented by the WCST) and intelligence (represented by the most popular IQ tests) seems to corroborate earlier conclusions that were drawn from individual differences studies [31,35].

4.2. Differential Associations between WCST Scores and IQ Domains

The correlations between distinct WCST scores and the FSIQ showed some differences that may be worth a short comment. The average correlation between WCST categories and FSIQ was highest (r = 0.44), followed by the correlations between WCST total errors (r = −0.42), WCST perseverations (r = −0.39), WCST NPE (r = −0.29) and FSIQ, with the lowest correlations (close to zero) between WCST FMS and FSIQ (r = −0.05). Hence, differential correlations between WCST categories, total errors, perseverations and FSIQ appear negligible. Comparable correlations with FSIQ suggested that these WCST scores reflected, at least to some degree, a common cognitive ability (e.g., shifting, general EF, or general understanding of the task). This common cognitive ability seemed to be less relevant for the other two WCST scores that we analyzed (i.e., NPE and FMS), as suggested by lower correlations with FSIQ. Given the interdependencies of WCST scores, it seems plausible that a deficit which relates to an increase in the number of committed perseverations also increases total errors and decreases WCST categories, while leaving NPE and FMS more or less unaffected.
Alternatively, the differential correlations between two groups of WCST scores (categories, total errors, perseverations vs. NPE, FMS) and FSIQ might be related to differences in their psychometric properties. Specifically, the first group of WCST scores may on average provide more reliable estimates in comparison with the second group (see Appendix A). In this case, the attenuation effect that was discussed above in detail would more strongly affect the second group of WCST scores than the first group. Hence, it is possible that all analyzed WCST measures are indicators of the ability that causes WCST performance to correlate with FSIQ, but that these indicators simply differ in how reliably they assess this ability.
The issue of differential associations between WCST scores and IQ remains to be substantiated by future studies. This research should not only be concerned with differential associations between specific WCST scores and intelligence, but it should also be concerned with their reliability. As we have seen, inferences about validity hinge upon knowledge about the reliability that can be assumed for the scores under consideration.
The correlations between WCST scores and distinct IQ domains followed the pattern rWCST-FSIQ > rWCST-VIQ = rWCST-PIQ (see Table 2). The FSIQ advantage over verbal and non-verbal domains was of little surprise, given that the FSIQ yielded more reliable estimates (with an average split-half reliability across age groups of 0.98; cited following [13]) compared to the VIQ (with an average split-half reliability across age groups of 0.97 [13]), and compared to the PIQ (with an average split-half reliability across age groups of 0.94 [13]). Given the fact that the FSIQ comprised both, verbal and non-verbal domains, this difference in reliability was probably due to the positive effects of additional items on scale reliability [139]. The attenuation effect therefore exerted a slightly stronger influence on the WCST-VIQ and WCST-PIQ correlations compared to the WCST-FSIQ correlation.
WCST-VIQ and WCST-PIQ correlations were almost identical, perhaps with a marginal advantage for the verbal compared to the non-verbal domains. This finding may be interpreted as indicating that the predictability of WCST variance based on verbal domains, which are more closely related to Gc, does not differ from the predictability of WCST variance based on non-verbal domains, which are more closely related to Gf. The irrelevance of the contents of the particular IQ domains on the WCST-IQ correlations seems to be at odds with the common assumption that EF in general, and WCST scores in particular, are preferentially correlated with Gf, while the correlation with Gc is negligible [43,72,140]. However, reliability coefficients were slightly higher for the verbal domains compared to the non-verbal ones (see above; also, estimates of the NART test-retest reliability exceeded 0.95 [60], whereas reliability estimates for the RPM and CFT seemed to lie in the interval between 0.80 and 0.90; see [62] (cited after [141]) and [13], but see [142] for RPM test-retest reliability estimates > 0.90). Given the available reliability estimates, the predictability of WCST variance from verbal IQ domains may be actually lower than the predictability of WCST variance from non-verbal IQ domains, but this difference may be counteracted by differential degrees of attenuation due to slight differences in verbal and non-verbal IQ reliabilities.
We suggest conducting specifically designed studies for a better understanding of the relationship between WCST scores and tests of crystallized and fluid intelligence. Notice that the conductance of such a study would be of theoretical importance since the enigma of unimpaired IQ in patients with frontal lobe damage and WCST deficits [15] was explained by shortcomings in the utilized intelligence tests, and specifically, insufficient measurement of fluid intelligence at that time [140]. Other researchers emphasized the association between the frontal lobes and fluid intelligence [43,72,143]. Tranel et al. [140], however, did not find evidence for an association between the presence of frontal lesions and decrements in the Matrix Reasoning subtest of the WAIS-III, rendering the issue controversial to what degree Gf mediated the association between frontal lesions and EF. Later work from this group [144,145] and other groups [43] pointed to the direction that general intellectual abilities draw on a circumscribed, albeit distributed, network in frontal and parietal lobes. A deeper review of the neural mechanisms of intelligence would go beyond the scope of this article, and the interested reader is referred to the relevant literature [43,146,147,148].

4.3. The Role of Moderator Variables

We also found considerable effect-size heterogeneity, and our moderator analyses could only account for small portions of this heterogeneity. Despite the fact that substantial portions of the study-by-study variability remain unexplained, our moderator analyses led to the identification of two potentially interesting moderators (i.e., age, clinical status). First, the correlations between WCST perseverations and non-verbal IQ were markedly stronger in samples with a mean age above 50 years than they were in samples of younger adults (18–50 years) or in samples of children and adolescents. Second, correlations between WCST perseverations and the FSIQ were larger in patient samples than in control samples. One account of these moderator effects holds generalized cognitive decline responsible, which could occur in some of the studied individuals, regardless of whether one looks at samples of healthy elderly people or at clinically relevant disease states. Generalized cognitive decline in some elderly or ill individuals should increase inter-individual variability on WCST scores and in IQ in these samples as compared to the usually more homogenous samples of young and healthy participants. To the extent that this cognitive decline is generalized, additional variance in WCST scores and in IQ domains would be shared, thereby increasing the correlation between them in elderly and ill samples. However, these moderator effects should be interpreted with caution, due to the low statistical power of the comparisons that we were able to carry out. Cautiousness is also suggested by the fact that these relationships did not occur consistently across all WCST-IQ combinations.
The number of data available for the analysis of partial, age-corrected WCST-IQ correlations was severely limited. Yet, there seemed to exist substantial WCST-IQ correlations even if the age of the participants was partialed out of the raw WCST-IQ correlations (r = 0.36). Note that these partial correlations might be larger for some WCST-IQ combinations. However, we had to pool the data across all available WCST scores and IQ domains, a procedure which implied that the partial correlation might have been attenuated through the inclusion of WCST scores that showed weaker correlations with IQ (i.e., WCST FMS).

4.4. Limitations of the Present Meta-Analysis and Suggestions for Future Studies

The opportunity to obtain more conclusive evidence from the present meta-analysis was restrained by a number of obstacles: First, most of the studies that we analyzed comprised relatively small sample sizes. The effect-size estimates that we could provide were based on quite a variable Ns, ranging from N = 260 (WCST FMS-VIQ) to N = 3256 (WCST perseverations-PIQ). Although our bias analyses did not suggest that the size of the correlations covaried with the within-study standard errors (see Figure 2), the presence of these strongly unbalanced Ns calls for more systematic studies. These studies should not only explore plausible associations (i.e., WCST perseverations-Gf, WCST perseverations-PIQ), but also less plausible associations (WCST FMS-Gc, WCST FMS-VIQ) with identical rigor in order to facilitate valid inferences about differential associations.
Second, a lack of conceptual sharpness with regard to the structure of intelligence that was apparent in many studies prevented firm conclusions about differential associations of theoretical importance between WCST scores and crystallized and fluid intelligence, respectively. Neither EF, nor intelligence, can be considered as a unitary construct. In the case of EF, the available evidence points into the direction that WCST scores load on an isolable mental shifting factor [35,149]. Yet, it remains a viable possibility that mental shifting abilities share substantial portions of variance with a hitherto not identified cognitive ability that also underlies performance on common intelligence tests. As an example, studies of ‘relational’ reasoning that manipulated the number of to-be-integrated relations revealed that frontal lobes are critical for the integration of multiple relations [150,151,152,153,154] Successful WCST performance requires a comparable integration of information from multiple dimensions. Future studies should be more specifically designed toward theory-driven research questions, and they should primarily be concerned with isolating more circumscribed facets of WCST performance and intelligence alike.
Third, the role of reliability in understanding construct validity seems to be underrated. In fact, Schmidt and Hunter’s methods of meta-analysis [155] could not be applied due to the currently less than satisfactory knowledge about reliabilities of the WCST scores. No information about internal reliability was available in any of the published studies, and the data about test-retest reliability are by and large discouraging [9]. The apparently low reliability of WCST scores is certainly below levels considered acceptable in clinical practice (but see [9]), supporting the idea to merge them to a global index of executive functioning (as in Schretlen’s modified WCST version [39]). Further research should try to circumvent the reliability limitations of the WCST scores by appropriate efforts at improving this useful assessment technique. Future studies of WCST-IQ associations should preferably be conducted using psychometrically matched [156,157] measures of crystallized and fluid intelligence.
Taken together, these considerations imply the necessity to conduct large-scale, theory-driven, and psychometrically sound studies of EF-IQ associations in both healthy and clinical samples. We consider these studies of importance because construct validity increasingly gains importance in the field [74,158,159,160,161]. This is particularly true with regard to the discriminant validity of neuropsychological tests that are assumed to assess EF as a construct separable from standard conceptualizations of intelligence. The demand for construct validation, in particular the assurance of discriminant validity, is due to the progressively disregarded role of criterion validity, where evidence for a frontal localization of dysexecutive symptoms serves as a major criterion for test validity.

5. Conclusions

The analyzed data revealed low to medium-sized associations between WCST scores and IQ, which were not simply mediated by effects of age, suggesting that the two types of assessment shared portions of variance to a modest degree. The major finding of our meta-analysis was that, at best, about one third of the variability in the EF facet measured by the WCST (i.e., mental shifting [35,149]) could be accounted for by variability in common indicators of intelligence.
Our conclusion is that, despite conceptual overlap between accepted definitions of intelligence and executive functioning, the WCST assesses cognitive abilities that are partially separable from intelligence. Furthermore, our findings provide little evidence, if at all, for differential associations between distinct WCST scores and IQ. Although some of them (categories, total errors, perseverations) showed somewhat stronger associations with IQ than others (non-perseverative errors, failures to maintain set), it remains to be seen whether this differential association should be attributed to their contents, or alternatively, to their psychometric properties. WCST scores were associated in comparable strength with verbal and non-verbal IQ domains, thus not supporting the idea that the former were preferably associated with non-verbal/fluid intelligence. Overall, our meta-analysis represents a step toward evidence-based neuropsychology [162,163] by shedding light on the hitherto understudied discriminant validity of a widely used test of executive functions.

Author Contributions

Conceptualization, B.K.; methodology, B.K. and F.L.; software, F.L.; validation, B.K., N.M., J.F.S., M.H. and F.L.; formal analysis, F.L.; investigation, N.M. and M.H.; resources, B.K.; data curation, N.M., M.H. and F.L.; writing—original draft preparation, B.K. and F.L.; writing—review and editing, B.K., J.F.S. and F.L.; visualization, N.M., M.H. and F.L.; supervision, B.K.; project administration, B.K., N.M., J.F.S., M.H. and F.L.; funding acquisition, B.K. and F.L.

Funding

This research was funded by a research grant from the Karlheinz-Hartmann-Foundation, Hannover, Germany (awarded to B.K.) and by the FWO and European Union’s Horzion 2020 Research and Innovation Programme under the Marie Skłodowska-Curie grant agreement (No.665501; awarded to F.L.).

Acknowledgments

The datasets used and/or analyzed during the current study are available from the corresponding author upon reasonable request.

Conflicts of Interest

The authors declare no conflicts of interest.

Appendix A

The available reliability studies of common WCST measures are summarized in Table A1. It is worth noting that our compilation of reliability studies does not pretend being exhaustive because our search for suitable studies was not systematic. Inspection of Table A1 reveals that estimates of WCST internal consistency remained completely unavailable.
All studies relied on repeated administration of the WCST, estimating test-retest-reliabilities with variable retest periods. Nine studies examined the administration of a WCST version in non-clinical populations (cumulative N = 568), implying that the five studies of clinical populations achieved a cumulative N of only 120 patients. In addition, the diagnoses under consideration were quite heterogeneous (traumatic brain injury, sleep apnoe syndrome, autism, learning disability). Very little is known about test-retest reliability when the WCST is administered in clinical populations that are of major interest for neuropsychologists. In that regard, one has to rely on the estimates from those two studies that looked at patients who suffered from traumatic brain injury (cumulative N = 57 [164,165]. However, the results from these two studies can hardly be considered as being convergent.
Many different coefficients were considered across these studies (Pearson’s r, Spearman’s rho, Kendall’s tau, intra-class correlations, generalizability coefficients). Most of the studies were based on quite small sample sizes. Charter [166] showed that precise reliability estimates presuppose sample sizes of N > 400. In order to obtain reliable estimates of WCST test-retest reliabilities, we averaged across all available studies, thereby ignoring the methodological differences between them, including the population under study, the duration of the retest period, the WCST version, and the type of coefficient under consideration. Given that reliability is the result of a test administered under particular circumstances to the sample under study, we also report averaged WCST test-retest reliability coefficients separately for samples (non-clinical, clinical) and test versions. The results are shown in Table A2.
Table A1. A summary of published studies on the WCST reliability.
StudyYearPopulationNType of ReliabilityTest-Retest IntervalWCST VersionWCST MeasureCoefficientType of Correlation
Basso et al. [167]1999Non-clinical50Test-retest12 monthsHeaton et al. 1993CAT
TE
PE, P
FMS
0.54
0.50
0.52, 0.50
−0.02
6
6
6
6
Bird et al. [85]2004Non-clinical90Test-retest1 monthNelson 1976TE
PE
0.34
0.38
1
1
Bowden et al. [168]1998Non-clinical75Test-retest(‘alternate’ forms)Same dayHeaton et al. 1981CAT
TE
PE, P
NPE
0.60
0.51
0.32, 0.30
0.43
2
2
2
2
de Zubicaray et al. [91]1998Non-clinical36Test-retest7.5 monthsNelson 1976CAT
TE
PE
NPE
FMS
0.28
0.36
0.27
0.38
0.49
2
2
2
2
2
Greve et al. [164]2002TBI34Test-retest66 weeksHeaton et al. 1993CAT
TE
PE, P
NPE
FMS
0.53
0.82
0.80, 0.78
0.50
0.26
3
2
2
2
3
Heaton et al. [38]1993Non-clinical46Test-retest33 daysHeaton et al. 1993TE
PE, P
NPE
0.71
0.52, 0.53
0.72
5
5
5
Ingram et al. [169]1998Sleep apnoe patients29Test-retest12 daysComputerized WCSTCAT
TE
PE, P
FMS
0.70
0.79
0.83, 0.79
0.50
2
2
2
2
Lineweaver et al. [108]1999Non-clinical142Test-retest24 monthsNelson 1976CAT
PE
NPE
0.56
0.64
0.46
1
1
1
Ozonoff [169]1995Autistic children17Test-retest30 monthsStandard WCSTTE
P
0.94
0.93
5
5
Learning disabled children and adolescents17Test- retest30 monthsStandard WCSTTE
P
0.90
0.94
5
5
Paolo et al. [170]1996Non-clinical87Test-retest12 monthsHeaton et al. 1981CAT
TE
PE, P
NPE
FMS
0.65
0.66
0.65, 0.63
0.55
0.13
3
3
3
3
Steinmetz et al. [171]2010Non-clinical22Test-retestSame dayHeaton et al. 1993TE
PE
FMS
0.68
0.72
0.16
6
6
6
Tate et al. [165]1998Non-clinical20Test-retest8 monthsHeaton et al. 1993CAT
TE
PE, P
NPE
FMS
0.88
0.79
0.72, 0.68
0.74
−0.04
2
4
4
4
4
TBI23Test-retest10 monthsHeaton et al. 1993CAT
TE
PE, P
0.29
0.39
0.34, 0.33
2
4
4
NPE
FMS
0.32
−0.32
4
4
Note. CAT = categories; TE = total errors; PE, P = perseveration errors, perseverations; NPE = non-perseverative errors; FMS = failures to maintain set; TBI = traumatic brain injury; 1 = Pearson’s r, 2 = Spearman’s rho, 3 = Kendall’s tau, 4 = intra-class coefficient, 5 = generalizability coefficient, 6 = unspecified; * Study-wise N served as the weighting factor.
Several observations deserve comments: First, average weighted test-retest reliabilities of WCST number of categories, total errors, and perseverations appeared to be very similar, and these coefficients achieved average values close to 0.60. Non-perseverative errors seem to show slightly lower average test-retest reliabilities (about 0.50). Failures to maintain set achieved a very low average test-retest reliability of about 0.15.
Table A2. Summary statistics of WCST reliability estimates.
Overall and Sample-SpecificWCST MeasureCumulative NUnweighted AverageWeighted Average *
all (14) available samplesCAT
TE
PE, P
NPE
FMS
496
546
688
463
301
0.56
0.65
0.61
0.51
0.15
0.55
0.58
0.56
0.50
0.16
non-clinical (9) samplesCAT
TE
PE, P
NPE
FMS
410
426
568
406
215
0.59
0.57
0.52
0.55
0.14
0.58
0.53
0.52
0.51
0.14
clinical (5) samplesCAT
TE
PE, P
NPE
FMS
86
120
120
57
86
0.51
0.77
0.76
0.41
0.15
0.52
0.76
0.77
0.43
0.19
Test Versions (excl. cWCST)WCST MeasureCumulative NUnweighted AverageWeighted Average *
Heaton et al. version (10) samplesCAT
TE
PE, P
NPE
FMS
345
391
391
285
236
0.58
0.69
0.64
0.54
0.03
0.59
0.65
0.57
0.53
0.06
Nelson version (3) samplesCAT
TE
PE, P
NPE
FMS
178
126
268
178
36
0.42
0.35
0.43
0.42
0.49
0.50
0.35
0.50
0.44
0.49
Note. cWCST = computerized WCST; CAT = categories; TE = total errors; PE, P = perseverations; NPE = non-perseverative errors; FMS = failures to maintain set; *Study-wise N served as the weighting factor.
Second, reliability estimates appeared to be higher in clinical (0.7 < r < 0.8) in comparison to non-clinical (0.5 < r < 0.55) samples on two WCST measures (i.e., ‘number of total errors’, ‘perseverations’). The apparently low reliability of WCST measures often brings the argument forward that the WCST should not be utilized in clinical practice. However, these numbers suggest that appropriate studies should be conducted to reappraise the relatively good reliability of WCST perseverations in clinical samples because this measure represents the theoretically and clinically most relevant WCST measure.
Third, there was a general tendency toward lower test-retest reliability coefficients when retest periods were short: The Pearson correlation between the duration of that period (in days) and the reported coefficient for WCST perseverations amounted to r = 0.57 (p < 0.05 with N = 14 duration-coefficient pairings), indicating that procedural learning during the first test administration affects task performance on the second test administration over brief retest periods. This finding supports the idea that the WCST is a one-shot test that can only be administered once with any particular patient over brief time periods [13].
Fourth, with the remarkable exception of ‘failures to maintain set’, the Heaton and colleagues’ WCST versions [37,38] achieved slightly higher test-retest reliability coefficients compared to the Nelson version [36]. This putative version effect, if true, should probably be attributed to test length [139] because Heaton and colleagues’ WCST versions utilize 64 or 128 trials, whereas Nelson’s version is based on 48 trials.
Table A3 shows construct-level WCST-IQ correlations for a set of observed IQ-WCST correlations (0.05 < rxy < 0.50, reflecting the range of observed coefficients that we found in our meta-analysis). Construct-level WCST-IQ correlations result from the application of Spearman’s attenuation formula [137]
r x t y t = r x y r x x r y y r x t y t = r x y r x x r y y
with r x t y t representing a construct-level correlation, r x y representing an observed, measurement-level correlation, and r x x and r y y representing reliabilities of variables x (IQ; 0.90 < rxx < 0.99) and y (WCST; 0.10 < ryy < 0.60), respectively.
Table A3. Construct-level correlations, for different values of observed correlations (0.05, 0.1, 0.15, …, 0.5), IQ reliability (0.90, 0.95, 0.99), and WCST reliability (0.1, 0.2, 0.3, 0.4, 0.5, 0.6).
Observed CorrelationIQ ReliabilityWCST Reliability
0.100.200.300.400.500.60
0.050.900.1670.1180.0960.0830.0750.068
0.950.1620.1150.0940.0810.0730.066
0.990.1590.1120.0920.0790.0710.065
0.100.900.3330.2360.1920.1670.1490.136
0.950.3240.2290.1870.1620.1450.132
0.990.3180.2250.1830.1590.1420.130
0.150.900.5000.3540.2890.2500.2240.204
0.950.4870.3440.2810.2430.2180.199
0.990.4770.3370.2750.2380.2130.195
0.200.900.6670.4710.3850.3330.2980.272
0.950.6490.4590.3750.3240.2900.265
0.990.6360.4490.3670.3180.2840.259
0.250.900.8330.5890.4810.4170.3730.340
0.950.8110.5740.4680.4060.3630.331
0.990.7950.5620.4590.3970.3550.324
0.300.901.000.7070.5770.5000.4470.408
0.950.9730.6880.5620.4870.4350.397
0.990.9530.6740.5500.4770.4260.389
0.350.901.000.8250.6740.5830.5220.476
0.951.000.8030.6560.5680.5080.464
0.991.000.7870.6420.5560.4970.454
0.400.901.000.9430.7700.6670.5960.544
0.951.000.9180.7490.6490.5800.530
0.991.000.8990.7340.6360.5690.519
0.450.901.001.000.8660.7500.6710.612
0.951.001.000.8430.7300.6530.596
0.991.001.000.8260.7150.6400.584
0.500.901.001.000.9620.8330.7450.680
0.951.001.000.9370.8110.7250.662
0.991.001.000.9170.7950.7110.649
Note. IQ = intelligence quotient; WCST = Wisconsin Card Sorting Test.

References

  1. Fuster, J. The Prefrontal Cortex, 5th ed.; Academic Press: New York, NY, USA, 2015. [Google Scholar]
  2. Miller, B.L.; Cummings, J.L. The Human Frontal Lobes: Functions and Disorders, 3rd ed.; The Guilford Press: New York, NY, USA, 2018. [Google Scholar]
  3. Passingham, R.E.; Wise, S.P. The Neurobiology of the Prefrontal Cortex; Oxford University Press: Oxford, MS, USA, 2012. [Google Scholar]
  4. Stuss, D.T.; Knight, R.T. Principles of Frontal Lobe Function; Oxford University Press: Oxford, MA, USA, 2013. [Google Scholar]
  5. Szczepanski, S.M.; Knight, R.T. Insights into Human Behavior from Lesions to the Prefrontal Cortex. Neuron 2014, 83, 1002–1018. [Google Scholar] [CrossRef] [PubMed]
  6. Grant, D.A.; Berg, E. A behavioral analysis of degree of reinforcement and ease of shifting to new responses in a Weigl-type card-sorting problem. J. Exp. Psychol. 1948, 38, 404–411. [Google Scholar] [CrossRef] [PubMed]
  7. Berg, E.A. A Simple Objective Technique for Measuring Flexibility in Thinking. J. Gen. Psychol. 1948, 39, 15–22. [Google Scholar] [CrossRef] [PubMed]
  8. Grange, J.; Houghton, G. Task Switching and Cognitive Control; Oxford University Press: New York, NY, USA, 2014. [Google Scholar]
  9. Kopp, B.; Lange, F.; Steinke, A. The Reliability of the Wisconsin Card Sorting Test in Clinical Practice. Assessment 2019, 1–16. [Google Scholar] [CrossRef] [PubMed]
  10. Lange, F.; Seer, C.; Müller, D.; Kopp, B. Cognitive caching promotes flexibility in task switching: Evidence from event-related potentials. Sci. Rep. 2015, 5, 1–12. [Google Scholar] [CrossRef] [PubMed]
  11. Lange, F.; Brückner, C.; Knebel, A.; Seer, C.; Kopp, B. Executive dysfunction in Parkinson’s disease: A meta-analysis on the Wisconsin Card Sorting Test literature. Neurosci. Biobehav. Rev. 2018, 93, 38–56. [Google Scholar] [CrossRef]
  12. Mitrushina, M.; Boone, K.B.; Razani, J.; D’Elia, L.F. Handbook of Normative Data for Neuropsychological Assessment, 2nd ed.; Oxford University Press: New York, NY, USA, 2005. [Google Scholar]
  13. Sherman, E.; Tan, J.; Hrabok, M. A Compendium of Neuropsychological Tests. Fundamentals of Neuropsychological Assessment and Test Reviews for Clinical Practice, 4th ed.; Oxford University Press: Oxford, MS, USA, 2020. [Google Scholar]
  14. Teuber, H.K.; Battersby, W.S.; Bender, M.B. Performance of complex visual tasks after cerebral lesions. J. Nerv. Ment. Dis. 1951, 114, 413–429. [Google Scholar]
  15. Milner, B. Effects of Different Brain Lesions on Card Sorting. Arch. Neurol. 1963, 9, 90–100. [Google Scholar] [CrossRef]
  16. Scoville, W.B.; Milner, B. Loss of recent memory after bilateral hippocampal lesions. J. Neurol. Neurosurg. Psychiatry 1957, 20, 11–21. [Google Scholar] [CrossRef]
  17. Wechsler, D. The Measurement of Adult Intelligence; Williams and Wilkins: Baltimore, MA, USA, 1939. [Google Scholar]
  18. Luria, A.R. Two kinds of motor perseveration in massive injury of the frontal lobes. Brain 1965, 88, 1–10. [Google Scholar] [CrossRef]
  19. Pribram, K.H. The Primate Frontal Cortex—Executive of the Brain. In Psychophysiology of the Frontal Lobes; Pribram, K.H., Luria, A.R., Eds.; Academic Press: New York, NY, USA, 1973; pp. 293–314. [Google Scholar]
  20. Teuber, H.L. Unity and diversity of frontal lobe functions. Acta Neurobiol. Exp. (Wars). 1972, 32, 615–656. [Google Scholar] [PubMed]
  21. Demakis, G.J. A meta-analytic review of the sensitivity of the Wisconsin Card Sorting Test to frontal and lateralized frontal brain damage. Neuropsychology 2003, 17, 255–264. [Google Scholar] [CrossRef] [PubMed]
  22. Lange, F.; Seer, C.; Salchow, C.; Dengler, R.; Dressler, D.; Kopp, B. Meta-analytical and electrophysiological evidence for executive dysfunction in primary dystonia. Cortex 2016, 82, 133–146. [Google Scholar] [CrossRef] [PubMed]
  23. Lange, F.; Seer, C.; Müller-Vahl, K.; Kopp, B. Cognitive flexibility and its electrophysiological correlates in Gilles de la Tourette syndrome. Dev. Cogn. Neurosci. 2017, 27, 78–90. [Google Scholar] [CrossRef]
  24. Lange, F.; Kip, A.; Klein, T.; Müller, D.; Seer, C.; Kopp, B. Effects of rule uncertainty on cognitive flexibility in a card-sorting paradigm. Acta Psychol. (Amst). 2018, 190, 53–64. [Google Scholar] [CrossRef]
  25. Nyhus, E.; Barceló, F. The Wisconsin Card Sorting Test and the cognitive assessment of prefrontal executive functions: A critical update. Brain Cogn. 2009, 71, 437–451. [Google Scholar] [CrossRef]
  26. Lezak, M.D.; Howieson, D.B.; Bigler, E.D.; Tranel, D. Neuropsychological Assessment, 5th ed.; Press, O.U., Ed.; Oxford University Press: Oxford, MS, USA, 2012. [Google Scholar]
  27. Banich, M.T. Executive Function: The Search for an Integrated Account. Curr. Dir. Psychol. Sci. 2009, 18, 89–94. [Google Scholar] [CrossRef]
  28. Diamond, A. Executive Functions. Annu. Rev. Psychol. 2013, 64, 135–168. [Google Scholar] [CrossRef]
  29. Miller, E.K.; Cohen, J.D. An Integrative Theory of Prefrontal Cortex Function. Annu. Rev. Neurosci. 2001, 24, 167–202. [Google Scholar] [CrossRef]
  30. Suchy, Y. Executive Functioning: Overview, Assessment, and Research Issues for Non-Neuropsychologists. Ann. Behav. Med. 2009, 37, 106–116. [Google Scholar] [CrossRef]
  31. Friedman, N.P.; Miyake, A.; Young, S.E.; DeFries, J.C.; Corley, R.P.; Hewitt, J.K. Individual differences in executive functions are almost entirely genetic in origin. J. Exp. Psychol. Gen. 2008, 137, 201–225. [Google Scholar] [CrossRef] [PubMed]
  32. Friedman, N.P.; Miyake, A.; Altamirano, L.J.; Corley, R.P.; Young, S.E.; Rhea, S.A.; Hewitt, J.K. Stability and change in executive function abilities from late adolescence to early adulthood: A longitudinal twin study. Dev. Psychol. 2016, 52, 326–340. [Google Scholar] [CrossRef] [PubMed]
  33. Miyake, A.; Friedman, N.P. The Nature and Organization of Individual Differences in Executive Functions. Curr. Dir. Psychol. Sci. 2012, 21, 8–14. [Google Scholar] [CrossRef]
  34. Friedman, N.P.; Miyake, A. Unity and diversity of executive functions: Individual differences as a window on cognitive structure. Cortex 2017, 86, 186–204. [Google Scholar] [CrossRef]
  35. Miyake, A.; Friedman, N.P.; Emerson, M.J.; Witzki, A.H.; Howerter, A.; Wager, T.D. The Unity and Diversity of Executive Functions and Their Contributions to Complex “Frontal Lobe” Tasks: A Latent Variable Analysis. Cogn. Psychol. 2000, 41, 49–100. [Google Scholar] [CrossRef]
  36. Nelson, H.E. A Modified Card Sorting Test Sensitive to Frontal Lobe Defects. Cortex 1976, 12, 313–324. [Google Scholar] [CrossRef]
  37. Heaton, R.K. Wisconsin Card Sorting Test (WCST); Psychological Assessment Ressources: Odessa, Ukraine, 1981. [Google Scholar]
  38. Heaton, R.K.; Chelune, G.; Talley, J.L.; Kay, G.G.; Curtis, G. Wisconsin Card Sorting Test Manual: Revised and Expanded; Psychological Assessment Resources: Odessa, Ukraine, 1993. [Google Scholar]
  39. Schretlen, D.J. Modified Wisconsin Card Sorting Test (m-WCST); Psychological Assessment Resources: Lutz, Germany, 2010. [Google Scholar]
  40. Wechsler, D. Measurement of Adult Intelligence, 3rd ed.; Williams and Wilkins: Baltimore, MD, USA, 1944. [Google Scholar]
  41. Deary, I.J. Intelligence. Annu. Rev. Psychol. 2012, 63, 453–482. [Google Scholar] [CrossRef]
  42. Spearman, C. "General intelligence”, objectively determined and measured. Am. J. Psychol. 1904, 15, 201–292. [Google Scholar] [CrossRef]
  43. Duncan, J. How Intelligence Happens; Yale University Press: London, UK, 2010. [Google Scholar]
  44. Jensen, A.R. The G Factor: The Science of Mental Ability; Praeger: New York, NY, USA, 1998. [Google Scholar]
  45. Cattell, R.B. Some theoretical issues in adult intelligence testing. Psychol. Bull. 1941, 38, 592. [Google Scholar]
  46. Horn, J.L.; Cattell, R.B. Refinement and test of the theory of fluid and crystallized general intelligences. J. Educ. Psychol. 1966, 57, 253–270. [Google Scholar] [CrossRef]
  47. Carroll, J.B. Human Cognitive Abilities: A Survey of Factor-Analytic Studies; Oxford University Press: New York, NY, USA, 1993. [Google Scholar]
  48. McGrew, K.S. CHC theory and the human cognitive abilities project: Standing on the shoulders of the giants of psychometric intelligence research. Intelligence 2009, 37, 1–10. [Google Scholar] [CrossRef]
  49. Schneider, W.J.; McGrew, K.S. The Cattell–Horn–Carroll Model of Intelligence. In Contemporary Intellectual Assessment: Theories, Tests, and Issues; Flanagan, D.P., Harrison, P.L., Eds.; Guilford Press: New York, NY, USA, 2012; pp. 99–144. [Google Scholar]
  50. Wechsler, D. Wechsler Adult Intelligence Scale: Manual; The Psychological Corporation: New York, NY, USA, 1955. [Google Scholar]
  51. Wechsler, D. Wechsler Adult Intelligence Scale–Revised; The Psychological Corporation: New York, NY, USA, 1981. [Google Scholar]
  52. Wechsler, D. Wechsler Adult Intelligence Scale (WAIS-III): Administration and Scoring Manual; The Psychological Corporation: San Antonio, TX, USA, 1997. [Google Scholar]
  53. Wechsler, D. Wechsler Adult Intelligence Scale (WAIS–IV); The Psychological Corporation: San Antonio, TX, USA, 2008. [Google Scholar]
  54. Wechsler, D. Wechsler Intelligence Scale for Children (WISC): Manual; The Psychological Corporation: New York, NY, USA, 1949. [Google Scholar]
  55. Wechsler, D. Manual of the Wechsler Intelligence Scale for Children–Revised; The Psychological Corporation: New York, NY, USA, 1974. [Google Scholar]
  56. Wechsler, D. WISC-III Wechsler Intelligence Scale for Children: Manual; The Psychological Corporation: San Antonio, TX, USA, 1991. [Google Scholar]
  57. Wechsler, D. Wechsler Intelligence Scale for Children (WISC-IV); The Psychological Corporation: San Antonio, TX, USA, 2003. [Google Scholar]
  58. Jewsbury, P.A.; Bowden, S.C.; Duff, K. The Cattell–Horn–Carroll Model of Cognition for Clinical Assessment. J. Psychoeduc. Assess. 2017, 35, 547–567. [Google Scholar] [CrossRef]
  59. Nelson, H.E. The National Adult Reading Test (NART): Test Manual; NFER-Nelson: Windsor, UK, 1982. [Google Scholar]
  60. Crawford, J.R.; Parker, D.M.; Stewart, L.E.; Besson, J.A.O.; De Lacey, G. Prediction of WAIS IQ with the National Adult Reading Test: Cross-validation and extension. Br. J. Clin. Psychol. 1989, 28, 267–273. [Google Scholar] [CrossRef]
  61. Raven, J.C.; Court, J.; Raven, J. Manual for Raven’s Progressive Matrices; H. K. Lewis: London, UK, 1976. [Google Scholar]
  62. Cattell, R.B.; Cattell, A.K. Measuring Intelligence with the Culture Fair Tests; Institute for Personality and Ability Testing: Champaign, IL, USA, 1973. [Google Scholar]
  63. Floyd, R.G.; Bergeron, R.; Hamilton, G.; Parra, G.R. How do executive functions fit with the Cattell-Horn-Carroll model? Some evidence from a joint factor analysis of the Delis-Kaplan Executive Function System and the Woodcock-Johnson III tests of cognitive abilities. Psychol. Sch. 2010, 47, 721–738. [Google Scholar] [CrossRef]
  64. Hoelzle, J.B. Neuropsychological Assessment and the Cattell-Horn-Carroll (CHC) Cognitive Abilities Model; University of Toledo: Toledo, Spain, 2008. [Google Scholar]
  65. Jewsbury, P.A.; Bowden, S.C.; Strauss, M.E. Confirmatory factor analysis of executive function models: A Cattell-Horn-Carroll based reanalysis integrating the switching, inhibition, and updating model of executive function with the Cattell–Horn–Carroll model. J. Exp. Psychol. Gen. 2016, 145, 220–245. [Google Scholar] [CrossRef] [PubMed]
  66. Roberds, E.L. Evaluating the Relationship Between CHC Factors and Executive Functioning, Ball State University. Available online: http://cardinalscholar.bsu.edu/handle/123456789/199524 (accessed on 2 May 2015).
  67. Salthouse, T.A. Relations Between Cognitive Abilities and Measures of Executive Functioning. Neuropsychology 2005, 19, 532–545. [Google Scholar] [CrossRef]
  68. van Aken, L.; Kessels, R.P.C.; Wingbermühle, E.; Wiltink, M.; van der Heijden, P.T.; Egger, J.I.M. Exploring the incorporation of executive functions in intelligence testing : Factor analysis of the WAIS-III and traditional tasks of executive functioning. Int. J. Appl. Psychol. 2014, 4, 73–80. [Google Scholar]
  69. van Aken, L.; Kessels, R.P.C.; Wingbermühle, E.; van der Veld, W.M.; Egger, J.I.M. Fluid intelligence and executive functioning more alike than different? Acta Neuropsychiatr. 2016, 28, 31–37. [Google Scholar] [CrossRef]
  70. van Aken, L.; van der Heijden, P.T.; van der Veld, W.M.; Hermans, L.; Kessels, R.P.C.; Egger, J.I.M. Representation of the Cattell–Horn–Carroll Theory of Cognitive Abilities in the Factor Structure of the Dutch-Language Version of the WAIS-IV. Assessment 2017, 24, 458–466. [Google Scholar] [CrossRef]
  71. van Aken, L.; van der Heijden, P.T.; Oomens, W.; Kessels, R.P.C.; Egger, J.I.M. Predictive Value of Traditional Measures of Executive Function on Broad Abilities of the Cattell–Horn–Carroll Theory of Cognitive Abilities. Assessment 2017, 26, 1375–1385. [Google Scholar] [CrossRef] [Green Version]
  72. Roca, M.; Parr, A.; Thompson, R.; Woolgar, A.; Torralva, T.; Antoun, N.; Manes, F.; Duncan, J. Executive function and fluid intelligence after frontal lobe lesions. Brain 2010, 133, 234–247. [Google Scholar] [CrossRef] [PubMed]
  73. Cronbach, L.J. Essentials of Psychological Testing, 3rd ed.; Harper & Row: New York, NY, USA, 1970. [Google Scholar]
  74. Jewsbury, P.A.; Bowden, S.C. Construct Validity has a Critical Role in Evidence-Based Neuropsychological Assessment. In Neuropsychological Assessment in the Age of Evidence-Based Practice; Oxford University Press: New York, NY, USA, 2017; pp. 33–63. [Google Scholar]
  75. Schönbrodt, F.D.; Perugini, M. At what sample size do correlations stabilize? J. Res. Pers. 2013, 47, 609–612. [Google Scholar] [CrossRef] [Green Version]
  76. Field, A.P.; Gillett, R. How to do a meta-analysis. Br. J. Math. Stat. Psychol. 2010, 63, 665–694. [Google Scholar] [CrossRef] [PubMed]
  77. Strauss, E.; Sherman, E.M.S.; Spreen, O. A Compendium of Neuropsychological Tests: Administration, Norms, and Commentary; Oxford University Press: New York, NY, USA, 2006. [Google Scholar]
  78. Lehrl, S. Mehrfach-Wortschatz-Intelligenztest (MWT-B): Handbuch; Straube: Erlangen, Germany, 1977. [Google Scholar]
  79. Ammons, R.B.; Ammons, C.H. The Quick Test (QT): Provisional Manual. Psychol. Rep. 1962, 11, 111–118. [Google Scholar] [CrossRef]
  80. Zachary, R.A.; Shipley, W.C. Shipley Institute of Living Scale: Revised Manual, 4th ed.; Western Psychological Services: Los Angeles, CA, USA, 1986. [Google Scholar]
  81. Thorndike, R.L. The Stanford-Binet Intelligence Scale: Guide for Administering and Scoring; The Riverside Publishing Company: Chicago, IL, USA, 1986. [Google Scholar]
  82. Thurstone, L.; Thurstone, T. SRA Primary Mental Abilities Test; Science Research Associates: Chicago, IL, USA, 1949. [Google Scholar]
  83. Kaufman, A.S.; Kaufman, N.L. Kaufman Brief Intelligence Test: Manual; American Guidance Service: Circle Pines, MN, USA, 1990. [Google Scholar]
  84. Ardila, A.; Pineda, D.; Rosselli, M. Correlation Between Intelligence Test Scores and Executive Function Measures. Arch. Clin. Neuropsychol. 2000, 15, 31–36. [Google Scholar] [CrossRef]
  85. Bird, C.M.; Papadopoulou, K.; Ricciardelli, P.; Rossor, M.N.; Cipolotti, L. Monitoring cognitive changes: Psychometric properties of six cognitive tests. Br. J. Clin. Psychol. 2004, 43, 197–210. [Google Scholar] [CrossRef]
  86. Boone, K.B.; Pontón, M.O.; Gorsuch, R.L.; González, J.J.; Miller, B.L. Factor Analysis of Four Measures of Prefrontal Lobe Functioning. Arch. Clin. Neuropsychol. 1998, 13, 585–595. [Google Scholar] [CrossRef]
  87. Chien, C.C.; Huang, S.F.; Lung, F.W. Maximally efficient two-stage screening: Determining intellectual disability in Taiwanese military conscripts. J. Multidiscip. Healthc. 2009, 2, 39–44. [Google Scholar]
  88. Cianchetti, C.; Corona, S.; Foscoliano, M.; Contu, D.; Sannio-Fancello, G. Modified Wisconsin Card Sorting Test (MCST, MWCST): Normative Data in Children 4–13 Years Old, According to Classical and New Types of Scoring. Clin. Neuropsychol. 2007, 21, 456–478. [Google Scholar] [CrossRef]
  89. Crawford, J.R.; Bryan, J.; Luszcz, M.A.; Obonsawin, M.C.; Stewart, L. The Executive Decline Hypothesis of Cognitive Aging: Do Executive Deficits Qualify as Differential Deficits and Do They Mediate Age-Related Memory Decline? Aging, Neuropsychol. Cogn. 2000, 7, 9–31. [Google Scholar] [CrossRef]
  90. Davis, R.N.; Nolen-Hoeksema, S. Cognitive Inflexibility Among Ruminators and Nonruminators. Cognit. Ther. Res. 2000, 24, 699–711. [Google Scholar] [CrossRef] [Green Version]
  91. de Zubicaray, G.I.; Smith, G.A.; Chalk, J.B.; Semple, J. The Modified Card Sorting Test: Test-retest stability and relationships with demographic variables in a healthy older adult sample. Br. Psychol. Soc. 1998, 37, 457–466. [Google Scholar] [CrossRef]
  92. Dieci, M.; Vita, A.; Silenzi, C.; Caputo, A.; Comazzi, M.; Ferrari, L.; Ghiringhelli, L.; Mezzetti, M.; Tenconi, F.; Invernizzi, G. Non-selective impairment of Wisconsin Card Sorting Test performance in patients with schizophrenia. Schizophr. Res. 1997, 25, 33–42. [Google Scholar] [CrossRef]
  93. Dolan, M.; Millington, J.; Park, I. Personality and Neuropsychological Function in Violent, Sexual and Arson Offenders. Med. Sci. Law 2002, 42, 34–43. [Google Scholar] [CrossRef] [PubMed]
  94. Evans, L.D.; Kouros, C.D.; Samanez-Larkin, S.; Garber, J. Concurrent and Short-Term Prospective Relations among Neurocognitive Functioning, Coping, and Depressive Symptoms in Youth. J. Clin. Child Adolesc. Psychol. 2016, 45, 6–20. [Google Scholar] [CrossRef] [Green Version]
  95. Giovagnoli, A.R. Relation of sorting impairment to hippocampal damage in temporal lobe epilepsy. Neuropsychologia 2001, 39, 140–150. [Google Scholar] [CrossRef]
  96. Golden, C.J.; Kushner, T.; Lee, B.; McMorrow, M.A. Searching for the meaning of the category test and the wisconsin card sort test: A Comparative analysis. Int. J. Neurosci. 1998, 93, 141–150. [Google Scholar] [CrossRef]
  97. Han, G.; Helm, J.; Iucha, C.; Zahn-Waxler, C.; Hastings, P.D.; Klimes-Dougan, B. Are Executive Functioning Deficits Concurrently and Predictively Associated with Depressive and Anxiety Symptoms in Adolescents? J. Clin. Child Adolesc. Psychol. 2016, 45, 44–58. [Google Scholar] [CrossRef]
  98. Heinrichs, R.W. Variables associated with Wisconsin Card Sorting Test performance in neuropsychiatric patients referred for assessment. Neuropsychiatry, Neuropsychol. Behav. Neurol. 1990, 3, 107–112. [Google Scholar]
  99. Ilonen, T.; Taiminen, T.; Lauerma, H.; Karlsson, H.; Helenius, H.Y.M.; Tuimala, P.; Leinonen, K.-M.; Wallenius, E.; Salokangas, R.K.R. Impaired Wisconsin Card Sorting Test performance in first-episode schizophrenia: Resource or motivation deficit? Compr. Psychiatry 2000, 41, 385–391. [Google Scholar] [CrossRef]
  100. Isingrini, M.; Vazou, F. Relation between Fluid Intelligence and Frontal Lobe Functioning in Older Adults. Int. J. Aging Hum. Dev. 1997, 45, 99–109. [Google Scholar] [CrossRef] [PubMed]
  101. Keefe, R.S.E.; Silverman, J.M.; Lees Roitman, S.E.; Harvey, P.D.; Duncan, M.A.; Alroy, D.; Siever, L.J.; Davis, K.L.; Mohs, R.C. Performance of nonpsychotic relatives of schizophrenic patients on cognitive tests. Psychiatry Res. 1994, 53, 1–12. [Google Scholar] [CrossRef]
  102. Kilincaslan, A.; Motavalli Mukkaddes, N.; Kücükyazici, G.S.; Gürvit, H. Assessment of executive/attentional performance in Asperger’s disorder. Turkish J. Psychiatry 2010, 21, 289–299. [Google Scholar]
  103. Lee, S.J.; Lee, H.-K.; Kweon, Y.-S.; Lee, C.T.; Lee, K.-U. The Impact of Executive Function on Emotion Recognition and Emotion Experience in Patients with Schizophrenia. Psychiatry Investig. 2009, 6, 156–162. [Google Scholar] [CrossRef] [PubMed] [Green Version]
  104. Lehto, J.E.; Elorinne, E. Gambling as an Executive Function Task. Appl. Neuropsychol. 2003, 10, 234–238. [Google Scholar] [CrossRef]
  105. Lehto, J.E. A Test for Children’s Goal-Directed Behavior: A Pilot Study. Percept. Mot. Skills 2004, 98, 223–236. [Google Scholar] [CrossRef]
  106. LeMonda, B.C.; Holtzer, R.; Goldman, S. Relationship between executive functions and motor stereotypies in children with autistic disorder. Res. Autism Spectr. Disord. 2012, 6, 1099–1106. [Google Scholar] [CrossRef] [Green Version]
  107. Lichtenstein, J.D.; Erdodi, L.A.; Rai, J.K.; Mazur-Mosiewicz, A.; Flaro, L. Wisconsin Card Sorting Test embedded validity indicators developed for adults can be extended to children. Child Neuropsychol. 2018, 24, 247–260. [Google Scholar] [CrossRef]
  108. Lineweaver, T.T.; Bondi, M.W.; Thomas, R.G.; Salmon, D.P. A Normative Study of Nelson’s (1976) Modified Version of the Wisconsin Card Sorting Test in Healthy Older Adults. Clin. Neuropsychol. 1999, 13, 328–347. [Google Scholar] [CrossRef]
  109. Liss, M.; Fein, D.; Allen, D.; Dunn, M.; Feinstein, C.; Morris, R.; Waterhouse, L.; Rapin, I. Executive Functioning in High-functioning Children with Autism. J. Child Psychol. Psychiatry 2001, 42, 261–270. [Google Scholar] [CrossRef]
  110. Lucey, J.V.; Burness, C.E.; Costa, D.C.; Gacinovic, S.; Pilowsky, L.S.; Ell, P.J.; Marks, I.M.; Kerwin, R.W. Wisconsin Card Sorting Task (WCST) errors and cerebral blood flow in obsessive-compulsive disorder (OCD). Br. J. Med. Psychol. 1997, 70, 403–411. [Google Scholar] [CrossRef] [PubMed]
  111. Minshew, N.J.; Meyer, J.; Goldstein, G. Abstract reasoning in autism: A dissociation between concept formation and concept identification. Neuropsychology 2002, 16, 327–334. [Google Scholar] [CrossRef] [PubMed]
  112. Mullane, J.C.; Corkum, P.V. The Relationship Between Working Memory, Inhibition, and Performance on the Wisconsin Card Sorting Test in Children With and Without ADHD. J. Psychoeduc. Assess. 2007, 25, 211–221. [Google Scholar] [CrossRef]
  113. Nestor, P.G.; Nakamura, M.; Niznikiewicz, M.; Levitt, J.J.; Newell, D.T.; Shenton, M.E.; McCarley, R.W. Attentional Control and Intelligence: MRI Orbital Frontal Gray Matter and Neuropsychological Correlates. Behav. Neurol. 2015, 2015, 1–8. [Google Scholar] [CrossRef] [PubMed]
  114. Obonsawin, M.C.; Crawford, J.R.; Page, J.; Chalmers, P.; Low, G.; Marsh, P. Performance on the Modified Card Sorting Test by normal, healthy individuals: Relationship to general intellectual ability and demographic variables. Br. J. Clin. Psychol. 1999, 38, 27–41. [Google Scholar] [CrossRef]
  115. Obonsawin, M.; Crawford, J.R.; Page, J.; Chalmers, P.; Cochrane, R.; Low, G. Performance on tests of frontal lobe function reflect general intellectual ability. Neuropsychologia 2002, 40, 970–977. [Google Scholar] [CrossRef]
  116. Owashi, T.; Iwanami, A.; Nakagome, K.; Higuchi, T.; Kamijima, K. Thought Disorder and Executive Dysfunction in Patients with Schizophrenia. Int. J. Neurosci. 2009, 119, 105–123. [Google Scholar] [CrossRef]
  117. Perry, W.; Braff, D.L. A multimethod approach to assessing perseverations in schizophrenia patients. Schizophr. Res. 1998, 33, 69–77. [Google Scholar] [CrossRef]
  118. Roca, M.; Manes, F.; Chade, A.; Gleichgerrcht, E.; Gershanik, O.; Arévalo, G.G.; Torralva, T.; Duncan, J. The relationship between executive functions and fluid intelligence in Parkinson’s disease. Psychol. Med. 2012, 42, 2445–2452. [Google Scholar] [CrossRef] [Green Version]
  119. Rossell, S.L.; Coakes, J.; Shapleske, J.; Woodruff, P.W.R.; David, A.S. Insight: Its relationship with cognitive function, brain volume and symptoms in schizophrenia. Psychol. Med. 2003, 33, 111–119. [Google Scholar] [CrossRef] [Green Version]
  120. Salthouse, T.A.; Fristoe, N.; Rhee, S.H. How localized are age-related effects on neuropsychological measures? Neuropsychology 1996, 10, 272–285. [Google Scholar] [CrossRef]
  121. Schiebener, J.; García-Arias, M.; García-Villamisar, D.; Cabanyes-Truffino, J.; Brand, M. Developmental changes in decision making under risk: The role of executive functions and reasoning abilities in 8- to 19-year-old decision makers. Child Neuropsychol. 2015, 21, 759–778. [Google Scholar] [CrossRef] [PubMed]
  122. Shura, R.D.; Miskey, H.M.; Rowland, J.A.; Yoash-Gantz, R.E.; Denning, J.H. Embedded Performance Validity Measures with Postdeployment Veterans: Cross-Validation and Efficiency with Multiple Measures. Appl. Neuropsychol. Adult 2016, 23, 94–104. [Google Scholar] [CrossRef] [PubMed]
  123. South, M.; Ozonoff, S.; Mcmahon, W.M. The relationship between executive functioning, central coherence, and repetitive behaviors in the high-functioning autism spectrum. Autism 2007, 11, 437–451. [Google Scholar] [CrossRef]
  124. Steingass, H.-P.; Sartory, G.; Canavan, A.G.M. Chronic alcoholism and cognitive function: General decline or patterned impairment? Pers. Individ. Dif. 1994, 17, 97–109. [Google Scholar] [CrossRef]
  125. Sweeney, J.A.; Keilp, J.G.; Haas, G.L.; Hill, J.; Weiden, P.J. Relationships between medication treatments and neuropsychological test performance in schizophrenia. Psychiatry Res. 1991, 37, 297–308. [Google Scholar] [CrossRef]
  126. Syngelaki, E.M.; Moore, S.C.; Savage, J.C.; Fairchild, G.; Van Goozen, S.H.M. Executive Functioning and Risky Decision Making in Young Male Offenders. Crim. Justice Behav. 2009, 36, 1213–1227. [Google Scholar] [CrossRef]
  127. Taconnat, L.; Clarys, D.; Vanneste, S.; Bouazzaoui, B.; Isingrini, M. Aging and strategic retrieval in a cued-recall test: The role of executive functions and fluid intelligence. Brain Cogn. 2007, 64, 1–6. [Google Scholar] [CrossRef]
  128. Whiteside, D.M.; Kealey, T.; Semla, M.; Luu, H.; Rice, L.; Basso, M.R.; Roper, B. Verbal Fluency: Language or Executive Function Measure? Appl. Neuropsychol. Adult 2016, 23, 29–34. [Google Scholar] [CrossRef]
  129. Yasuda, Y. Cognitive inflexibility in Japanese adolescents and adults with autism spectrum disorders. World J. Psychiatry 2014, 4, 42. [Google Scholar] [CrossRef] [Green Version]
  130. Hedges, L.V.; Vevea, J.L. Fixed-and random-effects models in meta-anylsis. Psychol. Methods 1998, 3, 486–504. [Google Scholar] [CrossRef]
  131. Higgins, J.P.T.; Thompson, S.G.; Deeks, J.J.; Altman, D.G. Measuring inconsistency in meta-analyses. BMJ 2003, 327, 557–560. [Google Scholar] [CrossRef] [PubMed] [Green Version]
  132. Wan, X.; Wang, W.; Liu, J.; Tong, T. Estimating the sample mean and standard deviation from the sample size, median, range and/or interquartile range. BMC Med. Res. Methodol. 2014, 14, 135. [Google Scholar] [CrossRef] [PubMed] [Green Version]
  133. Carter, E.C.; McCullough, M.E. Publication bias and the limited strength model of self-control: Has the evidence for ego depletion been overestimated? Front. Psychol. 2014, 5, 1–11. [Google Scholar] [CrossRef] [Green Version]
  134. VassarStats: Website for Statistical Computation. Available online: http://vassarstats.net/ (accessed on 16 April 2018).
  135. Cohen, J. A power primer. Psychol. Bull. 1992, 112, 115–159. [Google Scholar] [CrossRef]
  136. Friedman, N.P.; Miyake, A.; Robinson, J.L.; Hewitt, J.K. Developmental trajectories in toddlers’ self-restraint predict individual differences in executive functions 14 years later: A behavioral genetic analysis. Dev. Psychol. 2011, 47, 1410–1430. [Google Scholar] [CrossRef] [Green Version]
  137. Spearman, C. The proof and measurement of association between two things. Am. J. Psychol. 1904, 15, 72–101. [Google Scholar] [CrossRef]
  138. Hunter, J.E.; Schmidt, F.L. Cumulative research knowledge and social policy formulation: The critical role of meta-analysis. Psychol. Public Policy, Law 1996, 2, 324–347. [Google Scholar] [CrossRef]
  139. Nunnally, J.C.; Bernstein, I.H. Psychometric Theory (Vol. 3); McGraw-Hill: New York, NY, USA, 1994. [Google Scholar]
  140. Tranel, D.; Manzel, K.; Anderson, S.W. Is the Prefrontal Cortex Important For Fluid Intelligence? A Neuropsychological Study Using Matrix Reasoning. Clin. Neuropsychol. 2008, 22, 242–261. [Google Scholar] [CrossRef]
  141. Nenty, H.J.; Dinero, T.E. A Cross-Cultural Analysis of the Fairness of the Cattell Culture Fair Intelligence Test Using the Rasch Model. Appl. Psychol. Meas. 1981, 5, 355–368. [Google Scholar] [CrossRef] [Green Version]
  142. Burke, H.R. Raven’s Progressive Matrices: Validity, Reliability, and Norms. J. Psychol. 1972, 82, 253–257. [Google Scholar] [CrossRef]
  143. Duncan, J.; Seitz, R.J.; Kolodny, J.; Bor, D.; Herzog, H.; Ahmed, A.; Newell, F.N.; Emslie, H. A Neural Basis for General Intelligence. Science (80-. ). 2000, 289, 457–460. [Google Scholar] [CrossRef] [PubMed]
  144. Gläscher, J.; Tranel, D.; Paul, L.K.; Rudrauf, D.; Rorden, C.; Hornaday, A.; Grabowski, T.; Damasio, H.; Adolphs, R. Lesion Mapping of Cognitive Abilities Linked to Intelligence. Neuron 2009, 61, 681–691. [Google Scholar] [CrossRef] [PubMed] [Green Version]
  145. Gläscher, J.; Rudrauf, D.; Colom, R.; Paul, L.K.; Tranel, D.; Damasio, H.; Adolphs, R. Distributed neural system for general intelligence revealed by lesion mapping. Proc. Natl. Acad. Sci. 2010, 107, 4705–4709. [Google Scholar] [CrossRef] [Green Version]
  146. Basten, U.; Hilger, K.; Fiebach, C.J. Where smart brains are different: A quantitative meta-analysis of functional and structural brain imaging studies on intelligence. Intelligence 2015, 51, 10–27. [Google Scholar] [CrossRef]
  147. Deary, I.J.; Penke, L.; Johnson, W. The neuroscience of human intelligence differences. Nat. Rev. Neurosci. 2010, 11, 201–211. [Google Scholar] [CrossRef] [PubMed]
  148. Euler, M.J. Intelligence and uncertainty: Implications of hierarchical predictive processing for the neuroscience of cognitive ability. Neurosci. Biobehav. Rev. 2018, 94, 93–112. [Google Scholar] [CrossRef] [PubMed]
  149. Lange, F.; Seer, C.; Kopp, B. Cognitive flexibility in neurological disorders: Cognitive components and event-related potentials. Neurosci. Biobehav. Rev. 2017, 83, 496–507. [Google Scholar] [CrossRef]
  150. Christoff, K.; Prabhakaran, V.; Dorfman, J.; Zhao, Z.; Kroger, J.K.; Holyoak, K.J.; Gabrieli, J.D.E. Rostrolateral Prefrontal Cortex Involvement in Relational Integration during Reasoning. Neuroimage 2001, 14, 1136–1149. [Google Scholar] [CrossRef]
  151. Kroger, J.K.; Sabb, F.W.; Fales, C.L.; Bookheimer, S.Y.; Cohen, M.S.; Holyoak, K.J. Recruitment of Anterior Dorsolateral Prefrontal Cortex in Human Reasoning: A Parametric Study of Relational Complexity. Cereb. Cortex 2002, 12, 477–485. [Google Scholar] [CrossRef] [Green Version]
  152. Morrison, R.G.; Krawczyk, D.C.; Holyoak, K.J.; Hummel, J.E.; Chow, T.W.; Miller, B.L.; Knowlton, B.J. A Neurocomputational Model of Analogical Reasoning and its Breakdown in Frontotemporal Lobar Degeneration. J. Cogn. Neurosci. 2004, 16, 260–271. [Google Scholar] [CrossRef] [PubMed] [Green Version]
  153. Waltz, J.A.; Knowlton, B.J.; Holyoak, K.J.; Boone, K.B.; Mishkin, F.S.; de Menezes Santos, M.; Thomas, C.R.; Miller, B.L. A System for Relational Reasoning in Human Prefrontal Cortex. Psychol. Sci. 1999, 10, 119–125. [Google Scholar] [CrossRef]
  154. Waltz, J.A.; Knowlton, B.J.; Holyoak, K.J.; Boone, K.B.; Back-Madruga, C.; McPherson, S.; Masterman, D.; Chow, T.; Cummings, J.L.; Miller, B.L. Relational Integration and Executive Function in Alzheimer’s Disease. Neuropsychology 2004, 18, 296–305. [Google Scholar] [CrossRef] [PubMed]
  155. Schmidt, F.L.; Hunter, J.E. Methods of Meta-Analysis: Correcting Error and Bias in Research Findings, 3rd ed.; Sage publications: London, UK, 2015. [Google Scholar]
  156. Chapman, L.J.; Chapman, J.P. Problems in the measurement of cognitive deficits. Psychol. Bull. 1973, 79, 380–385. [Google Scholar] [CrossRef] [PubMed] [Green Version]
  157. Chapman, L.J.; Chapman, J.P. The measurement of differential deficit. J. Psychiatr. Res. 1978, 14, 303–311. [Google Scholar] [CrossRef]
  158. Greve, K.M.; Ingram, F.; Bianchini, K.J.; Stanford, M.S. Latent Structure of the Wisconsin Card Sorting Test in a Clinical Sample. Arch. Clin. Neuropsychol. 1998, 13, 597–609. [Google Scholar] [CrossRef]
  159. Greve, K.W.; Stickle, T.R.; Love, J.M.; Bianchini, K.J.; Stanford, M.S. Latent structure of the Wisconsin Card Sorting Test: A confirmatory factor analytic study. Arch. Clin. Neuropsychol. 2005, 20, 355–364. [Google Scholar] [CrossRef] [Green Version]
  160. Paolo, A.; Tröster, A.I.; Axelrod, N.; Koller, W.C. Construct validity of the WCST in normal elderly and persons with Parkinson’s disease. Arch. Clin. Neuropsychol. 1995, 10, 463–473. [Google Scholar] [CrossRef]
  161. Sánchez-Cubillo, I.; Periáñez, J.A.; Arover-Roig, D.; Rodríguez-Sánchez, J.M.; Ríos-Lago, M.; Tirapu, J.; Barceló, F. Construct validity of the Trail Making Test: Role of task-switching, working memory, inhibition/interference control, and visuomotor abilities. J. Int. Neuropsychol. Soc. 2009, 15, 438–450. [Google Scholar] [CrossRef] [Green Version]
  162. Bowden, S.C. Neuropsychological Assessment in the Age of Evidence-Based Practice; Oxford University Press: New York, NY, USA, 2017. [Google Scholar]
  163. Chelune, G.J. Evidence-Based Practices in Neuropsychology. In Neuropsychological Assessment in the Age of Evidence-Based Practice; Bowden, S.C., Ed.; Oxford University Press: New York, NY, USA, 2017; pp. 155–181. [Google Scholar]
  164. Greve, K.W.; Love, J.M.; Sherwin, E.; Mathias, C.W.; Houston, R.J.; Brennan, A. Temporal Stability of the Wisconsin Card Sorting Test in a Chronic Traumatic Brain Injury Sample. Assessment 2002, 9, 271–277. [Google Scholar] [CrossRef]
  165. Tate, R.L.; Perdices, M.; Maggiotto, S. Stability of the Wisconsin Card Sorting Test and the Determination of Reliability of Change in Scores. Clin. Neuropsychol. 1998, 12, 348–357. [Google Scholar] [CrossRef]
  166. Charter, R.A. Sample Size Requirements for Precise Estimates of Reliability, Generalizability, and Validity Coefficients. J. Clin. Exp. Neuropsychol. 1999, 21, 559–566. [Google Scholar] [CrossRef] [PubMed]
  167. Basso, M.R.; Bornstein, R.A.; Lang, J.M. Practice Effects on Commonly Used Measures of Executive Function Across Twelve Months. Clin. Neuropsychol. 1999, 13, 283–292. [Google Scholar] [CrossRef]
  168. Bowden, S.C.; Fowler, K.S.; Bell, R.C.; Whelan, G.; Clifford, C.C.; Ritter, A.J.; Long, C.M. The Reliability and Internal Validity of the Wisconsin Card Sorting Test. Neuropsychol. Rehabil. 1998, 8, 243–254. [Google Scholar] [CrossRef]
  169. Ingram, F.; Greve, K.W.; Ingram, P.T.F.; Soukup, V.M. Temporal stability of the Wisconsin Card Sorting Test in an untreated patient sample. Br. J. Clin. Psychol. 1999, 38, 209–211. [Google Scholar] [CrossRef] [PubMed]
  170. Paolo, A.M.; Axelrod, B.N.; Tröster, A.I. Test-Retest Stability of the Wisconsin Card Sorting Test. Assessment 1996, 3, 137–143. [Google Scholar] [CrossRef]
  171. Steinmetz, J.-P.; Brunner, M.; Loarer, E.; Houssemand, C. Incomplete psychometric equivalence of scores obtained on the manual and the computer version of the Wisconsin Card Sorting Test? Psychol. Assess. 2010, 22, 199–202. [Google Scholar] [CrossRef] [PubMed]
Figure 1. Flow chart depicting the selection of articles for our meta-analysis.
Brainsci 09 00349 g001
Figure 2. Funnel plots illustrating the relationships between effect sizes and their standard errors. Straight vertical lines indicate the average meta-analytical effect size obtained for the respective correlation between a WCST score (categories, perseverations) and intelligence domain (FSIQ, VIQ, PIQ). Dotted vertical lines display zero effects for comparison. WCST = Wisconsin Card Sorting Test, FSIQ = full scale IQ, VIQ = verbal IQ, PIQ = performance IQ.
Brainsci 09 00349 g002
Figure 3. Effect sizes of the correlation between WCST perseverations and performance IQ as a function of participants’ mean age. Effect sizes are sorted from youngest (top) to oldest (bottom) sample. The size of black-filled circles is proportional to sample size. White-filled circles indicate average effect sizes across age groups. WCST = Wisconsin Card Sorting Test.
Brainsci 09 00349 g003
Table 1. Overview of the studies included in the meta-analysis.
First AuthorYearNSample% FemAge (M)Age (SD)WCST VersionFSIQVIQPIQCor
Ardila [84]200050children (healthy)0.014.41.0Heaton, 1981WISC-RWISC-RWISC-R
Bird [85]200490adults (healthy)62.257.08.3Nelson, 1976 NART mix
Boone [86]1998250adults (healthy and patients, psy & neuro)46.055.515.5Heaton, 1981 WAIS-RWAIS-R
Chien [87]200999adults (healthy)0.020.20.6Heaton, 1993 (c)WAIS-R
Cianchetti [88]2007101children (healthy)52.54.00.0Nelson, 1976 RPMP
Cianchetti2007113children (healthy)50.45.00.0Nelson, 1976 RPMP
Cianchetti2007119children (healthy)47.16.00.0Nelson, 1976 RPMP
Cianchetti2007161children (healthy)52.87.00.0Nelson, 1976 RPMP
Cianchetti200794children (healthy)52.18.00.0Nelson, 1976 RPMP
Cianchetti200798children (healthy)50.09.00.0Nelson, 1976 RPMP
Cianchetti2007119children (healthy)50.410.00.0Nelson, 1976 RPMP
Cianchetti2007122children (healthy)48.411.00.0Nelson, 1976 RPMP
Cianchetti2007100children (healthy)50.012.00.0Nelson, 1976 RPMP
Cianchetti200799children (healthy)48.513.00.0Nelson, 1976 RPMP
Crawford [89] 2000123adults (healthy)61.039.413.4Nelson, 1976WAIS-RWAIS-R P
Crawford199990adults (healthy)55.672.86.5Nelson, 1976WAIS-R (s) P
Davis [90]200062adults (healthy)51.620.31.5Heaton et al., 1993 WAIS-III (s)PMA (s)P
de Zubicaray [91]199836adults (healthy)66.770.15.6Nelson, 1976WAIS-RWAIS-RWAIS-RS
Dieci [92]199788adults (healthy and patients, psy)28.427.37.0Heaton, 1981WAIS-RWAIS-RWAIS-RS
Dolan [93]200260adults (patients, psy)0.029.86.6Heaton, 1981 NART S
Evans [94]2016192children (healthy)52.112.41.8Heaton et al., 1993WASI (s) P
Giovagnoli [95]200126adults (patients, neuro) 36.810.9Nelson, 1976 RPMS
Giovagnoli200121adults (patients, neuro) 33.311.2Nelson, 1976 RPMS
Giovagnoli200118adults (patients, neuro) 36.613.4Nelson, 1976 RPMS
Giovagnoli200115adults (patients, neuro) 41.49.8Nelson, 1976 RPMS
Giovagnoli200114adults (patients, neuro) 30.78.8Nelson, 1976 RPMS
Giovagnoli200118adults (patients, neuro) 32.612.2Nelson, 1976 RPMS
Giovagnoli200130adults (patients, neuro) 35.214.3Nelson, 1976 RPMS
Giovagnoli200123adults (patients, neuro) 35.613.4Nelson, 1976 RPMS
Giovagnoli200136adults (healthy) 36.110.7Nelson, 1976 RPMS
Golden [96]1998112adults (patients, neuro)48.237.413.3Heaton, 1981WAIS-RWAIS-RWAIS-RP
Han [97]2016180adolescents (healthy and patients, psy)49.513.71.5Heaton, 1981 (c)K-BIT (s)
Heinrichs [98]199056adults (patients, neuro)30.443.813.6Heaton, 1981WAIS-R P
Ilonen [99]200027adults (patients, psy)63.033.013.6Heaton et al., 1993WAIS-R S
Isingrini [100]199735adults (healthy)57.135.57.6Nelson, 1976 WAIS (s)CM
Isingrini199772adults (healthy)48.680.68.6Nelson, 1976 WAIS (s)CM
Keefe [101]199454adults (healthy and patients, psy)59.334.810.5Heaton, 1981 WAIS-R (s,v)WAIS-R (s)P
Kilincaslan [102]201039children (healthy and patients, psy)15.412.22.7Heaton, 1993 (c)WISC-RWISC-RWISC-R
Lee [103]200939adults (patients, psy)51.332.47.2Heaton, 1993 (c)WAIS-R (s) P
Lee200933adults (healthy)57.629.08.9Heaton, 1993 (c)WAIS-R (s) P
Lehto [104]200351children (healthy)41.29.20.3Heaton, 1981 RPMP
Lehto200340adults (healthy)62.530.19.6Heaton, 1981 RPMP
Lehto [105]200446children (healthy)43.512.50.3Heaton, 1981 RPMP
LeMonda [106]201244children (patients, psy)22.78.11.0Heaton et al., 1993 WISC-R (s)/SB4(s)
Lichtenstein [107]2018226adults and adolescents (healthy and patients, psy)35.413.62.6Heaton, et al. 1993WISC-III & WISC-IV P
Lineweaver [108]1999229adults (healthy)57.669.18.6Nelson, 1976WAIS-R (s)WAIS-R (s)WAIS-R (s)S
Liss [109]200121children (patients, psy)14.39.20.3Heaton et al., 1993n/an/an/aP
Liss200134children (patients, psy)29.49.10.1Heaton et al., 1993n/an/an/aP
Lucey [110]199738adults (healthy and patients, psy)47.438.011.5Heaton, 1981 NART P
Minshew [111]200290adults and adolescents (patients, psy) 21.49.7Heaton et al., 1993WAIS-R
Minshew2002107adults and adolescents (healthy) 21.29.8Heaton et al., 1993WAIS-R
Mullane [112]200730children (healthy and patients, psy)26.78.81.2Heaton et al., 1993WISC-III (s) P
Nestor [113]201581adults (healthy) 40.89.1Heaton, 1981WAIS-IIIWAIS-IIIWAIS-IIIP
Obonsawin [114]1999146adults and adolescents (healthy)47.340.314.0Nelson, 1976WAIS-RWAIS-RWAIS-RK
Obonsawin [115]2002123adults (healthy)38.240.314.0Nelson, 1976WAIS-R P
Owashi [116]200927adults (patients, psy)55.641.510.1Heaton, 1993 (c)WAIS-R (s) S
Perry [117] 199871adults (patients, psy)60.634.28.7Heaton, 1981 WAIS-R (s,v) P
Roca [118]201231adults (healthy and patients, neuro) 60.68.0Nelson, 1976 RCPM
Roca [72]201074adults (healthy and patients, neuro) 49.912.6Nelson, 1976 CFT (s)P
Rossell [119]200378adults (patients, psy)0.033.78.5Heaton, 1981 NART P
Salthouse [120]1996259adults (healthy)63.351.418.4Heaton et al., 1993 WAIS-R (s)/SAP
Schiebener [121]2015112children (healthy)52.713.63.4Nelson, 1976 (c) RPMP
Shura [122]2016205adults (patients, psy & neuro)10.834.99.1Heaton, 1981 (c) WAIS-III (s) P
South [123]200719children (patients, psy)26.314.92.7Grant, 1948n/an/an/aP
South200718children (healthy)38.914.12.9Grant, 1948n/an/an/aP
Steingass [124]1994101adults (patients, psy)21.950.58.1Nelson, 1976WAIS (s)WAIS (s)/MWT-B (v)WAIS (s)P
Sweeney [125]199144adults (patients, psy)40.928.58.6Heaton, 1981 AQT (v)
Syngelaki [126]200970adults and adolescents (healthy and patients, psy)0.016.31.5Heaton, 2005 (c)WASI (s) P
Taconnat [127]200781adults (healthy)51.966.08.2Heaton et al, 1993 CFTP
Whiteside [128]2016304adults (patients, neuro)54.945.113.4Heaton et al., 1993 WAIS-III (s,v) P
Yasuda [129]201433adults and adolescents (patients, psy)39.426.111.5Kashima et al., 1987 (c)WAIS-IIIWAIS-IIIWAIS-IIIP
Yasuda201433adults and adolescents (healthy)39.426.89.6Kashima et al., 1987 (c)WAIS-IIIWAIS-IIIWAIS-IIIP
Note: % fem = percent female participants in the sample, age (M) = mean age in the sample, age (SD) = standard deviation of participants’ age, WCST = Wisconsin Card Sorting Test, FSIQ = full scale IQ, VIQ = verbal IQ, PIQ = performance IQ, cor = correlation coefficient, psy = psychiatric, neuro = neurological, (c) = computerized, (s) = short form/subscales, (v) = vocabulary test, WISC = Wechsler Intelligence Scale for Children, WAIS = Wechsler Adult Intelligence Scale, WASI = Wechsler Abbreviated Scale of Intelligence, R(C)PM = Raven’s (Colored) Progressive Matrices, NART = National Adult Reading Test, PMA = Primary Mental Abilities, K-BIT = Kaufman Brief Intelligence Test, CM = Cattell’s Matrices, SB4 = Stanford–Binet Intelligence Scale, CFT = Cattell Culture Fair Intelligence Test, AQT = Ammons Quick Test, Shipley Abstraction Test, MWT-B = Multiple Choice Word Test-B, P = Pearson’s r, S = Spearman’s rho, K = Kendall’s tau, mix = parametric and non-parametric correlations.
Table 2. Results of the meta-analyses of correlations between WCST performance and intelligence.
IQ DomainStatisticCategoriesPerseverationsNPEFMSTE
Number of samples (k)20256611
Significant correlations (%)707650064
FSIQTotal N15332049664553710
Average effect size r0.44−0.39−0.29−0.05−0.42
[95% CI][0.36, 0.51][−0.45, −0.33][−0.46, −0.11][−0.14, 0.03][−0.51, −0.31]
Q63.31 *50.41 *26.56 *1.3422.02 *
I²68.4148.4273.64045.50
τBegg & Mazumar−0.08−0.260.07−0.070.15
pBegg & Mazumar0.6260.0760.8510.8510.529
Number of samples (k)19246411
Significant effects (%)747167064
VIQTotal N17552071546260871
Average effect size r0.33−0.31−0.30−0.02−0.37
[95% CI][0.26, 0.39][−0.36, −0.26][−0.44, −0.16][−0.15, 0.10][−0.45, −0.29]
Q37.08 *30.9914.33 *3.0317.01
I²46.0619.3351.15029.45
τBegg & Mazumar−0.20−0.01−0.2010.18
pBegg & Mazumar0.2340.9410.5730.435
Number of samples (k)2842171422
Significant effects (%)7552531473
PIQTotal N25063256178413862015
Average effect size r0.34−0.29−0.19−0.08−0.36
[95% CI][0.27, 0.39][−0.34, −0.24][−0.27, −0.11][−0.13, −0.02][−0.42, −0.29]
Q69.75 *88.87 *44.76 *14.7062.07 *
I²58.4251.6159.79062.95
τBegg & Mazumar0.050.170.14−0.11−0.11
pBegg & Mazumar0.6930.1210.4330.5840.498
Note: Significant correlations (%) = percentage of included correlation coefficients with a 95% confidence interval excluding 0. * significant heterogeneity at α = 0.05. WCST = Wisconsin Card Sorting Test, NPE = non-perseverative errors, FMS = failures to maintain set, TE = total errors, FSIQ = full scale IQ, VIQ = verbal IQ, PIQ = performance IQ.
Table 3. Results of the meta-regression analyses conducted to examine the role of potential moderators of WCST-intelligence relationships.
ModeratorCategoriesPerseverations
Continuous moderatorsβ95% CIdftpβ95% CIdftp
FSIQ
Mean age0.00[−0.09, 0.11]170.150.8800.00[−0.08, 0.07]22−0.210.837
SD age0.07[−0.05, 0.18]171.150.268−0.04[−0.11, 0.04]22−0.930.362
Percent female0.01[−0.09, 0.12]140.270.7950.01[−0.06, 0.09]190.350.733
VIQ
Mean age−0.02[−0.09, 0.06]16−0.490.6330.00[−0.06, 0.06]210.640.949
SD age0.06[−0.03, 0.15]161.350.195−0.03[−0.10, 0.04]21−0.730.471
Percent female0.01[−0.06, 0.08]150.340.7420.05[−0.04, 0.07]200.570.573
PIQ
Mean age0.04[−0.01, 0.10]251.600.122−0.07 *[−0.11, −0.02]39−3.050.004
SD age0.04[−0.02, 0.11]251.330.197−0.03[−0.08, 0.01]39−1.380.174
Percent female0.00[−0.09, 0.10]230.060.951−0.01[−0.10, 0.08]29−0.250.801
Categorical moderatorsχ2df pχ2df p
FSIQ
Age group1.142 0.5662.892 0.236
Clinical status2.601 0.1074.76 *1 0.029
WCST version0.011 0.9111.161 0.282
WCST administration2.711 0.1002.331 0.127
IQ test type0.331 0.5672.931 0.087
VIQ
Age group1.812 0.4050.482 0.787
Clinical status0.261 0.6090.001 0.972
WCST version0.301 0.5861.371 0.242
WCST administration2.781 0.0950.831 0.363
IQ test type0.251 0.6170.021 0.888
PIQ
Age group2.8932 0.23513.77 *2 0.001
Clinical status3.4311 0.0640.181 0.669
WCST version0.411 0.5223.781 0.052
Categorical moderatorsχ2df pχ2df p
PIQ WCST administration0.421 0.5180.061 0.810
IQ test type0.031 0.8582.551 0.110
Note: * significant moderator at α = 0.05. WCST = Wisconsin Card Sorting Test, FSIQ = full scale IQ, VIQ = verbal IQ, PIQ = performance IQ.

