
Analysis of Cortico-Muscular Coupling and Functional Brain Network under Different Standing Balance Paradigms

Abstract
1. Introduction
2. Materials and Methods
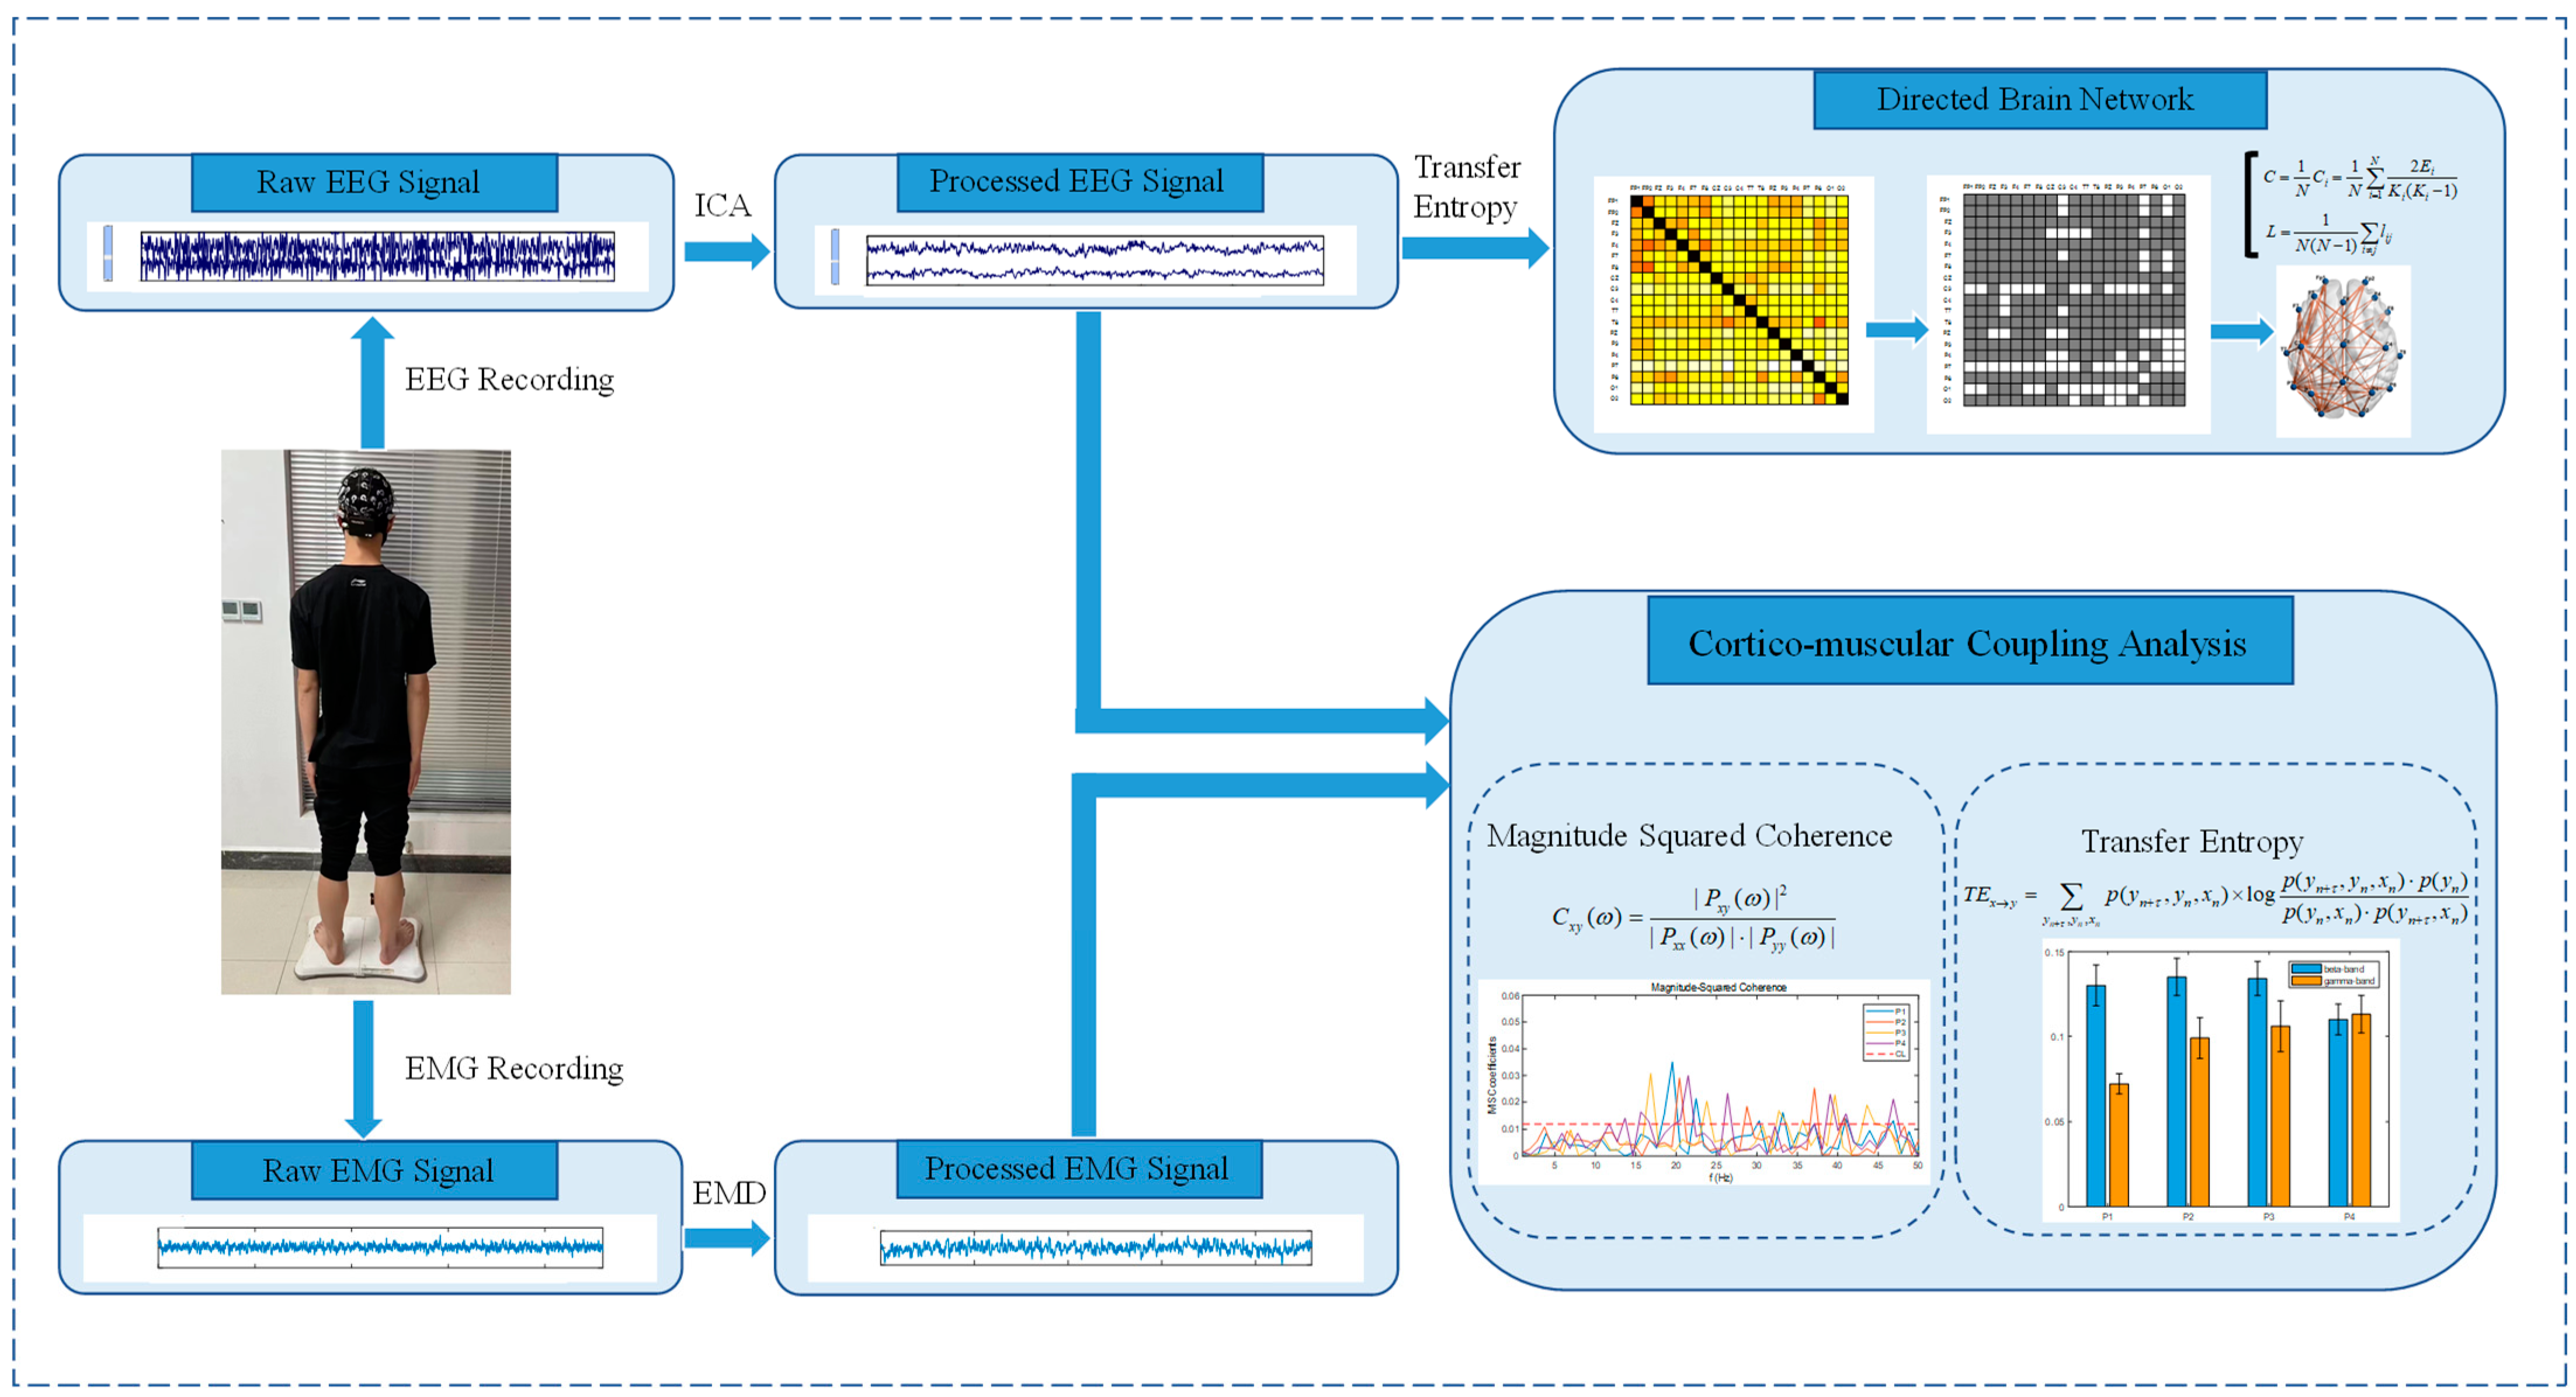
2.1. Framework
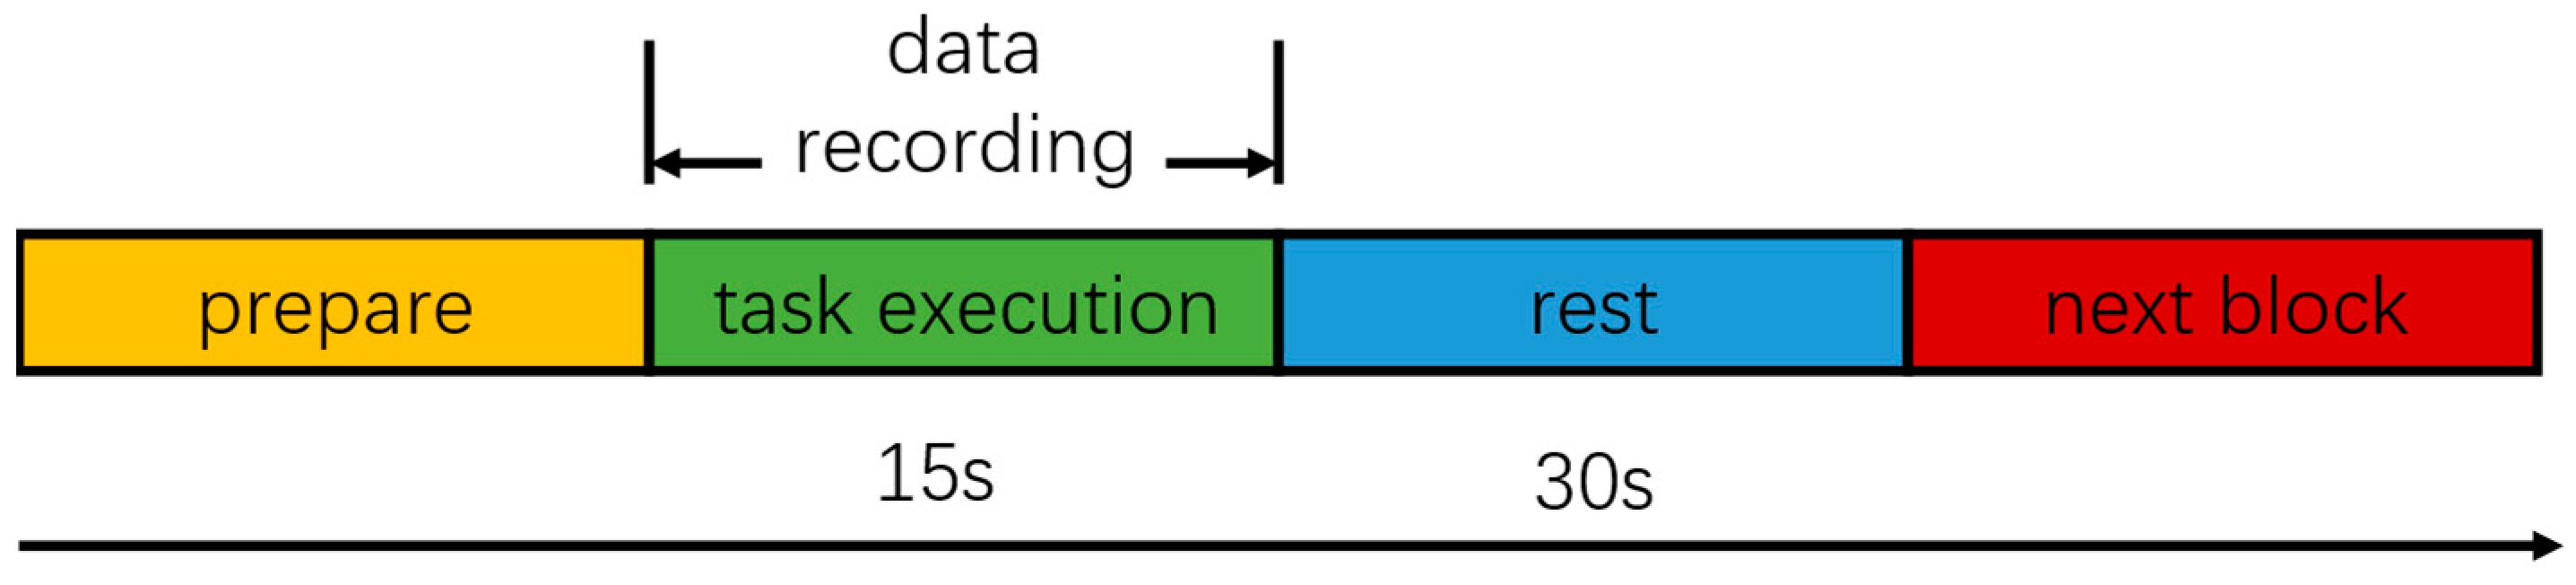
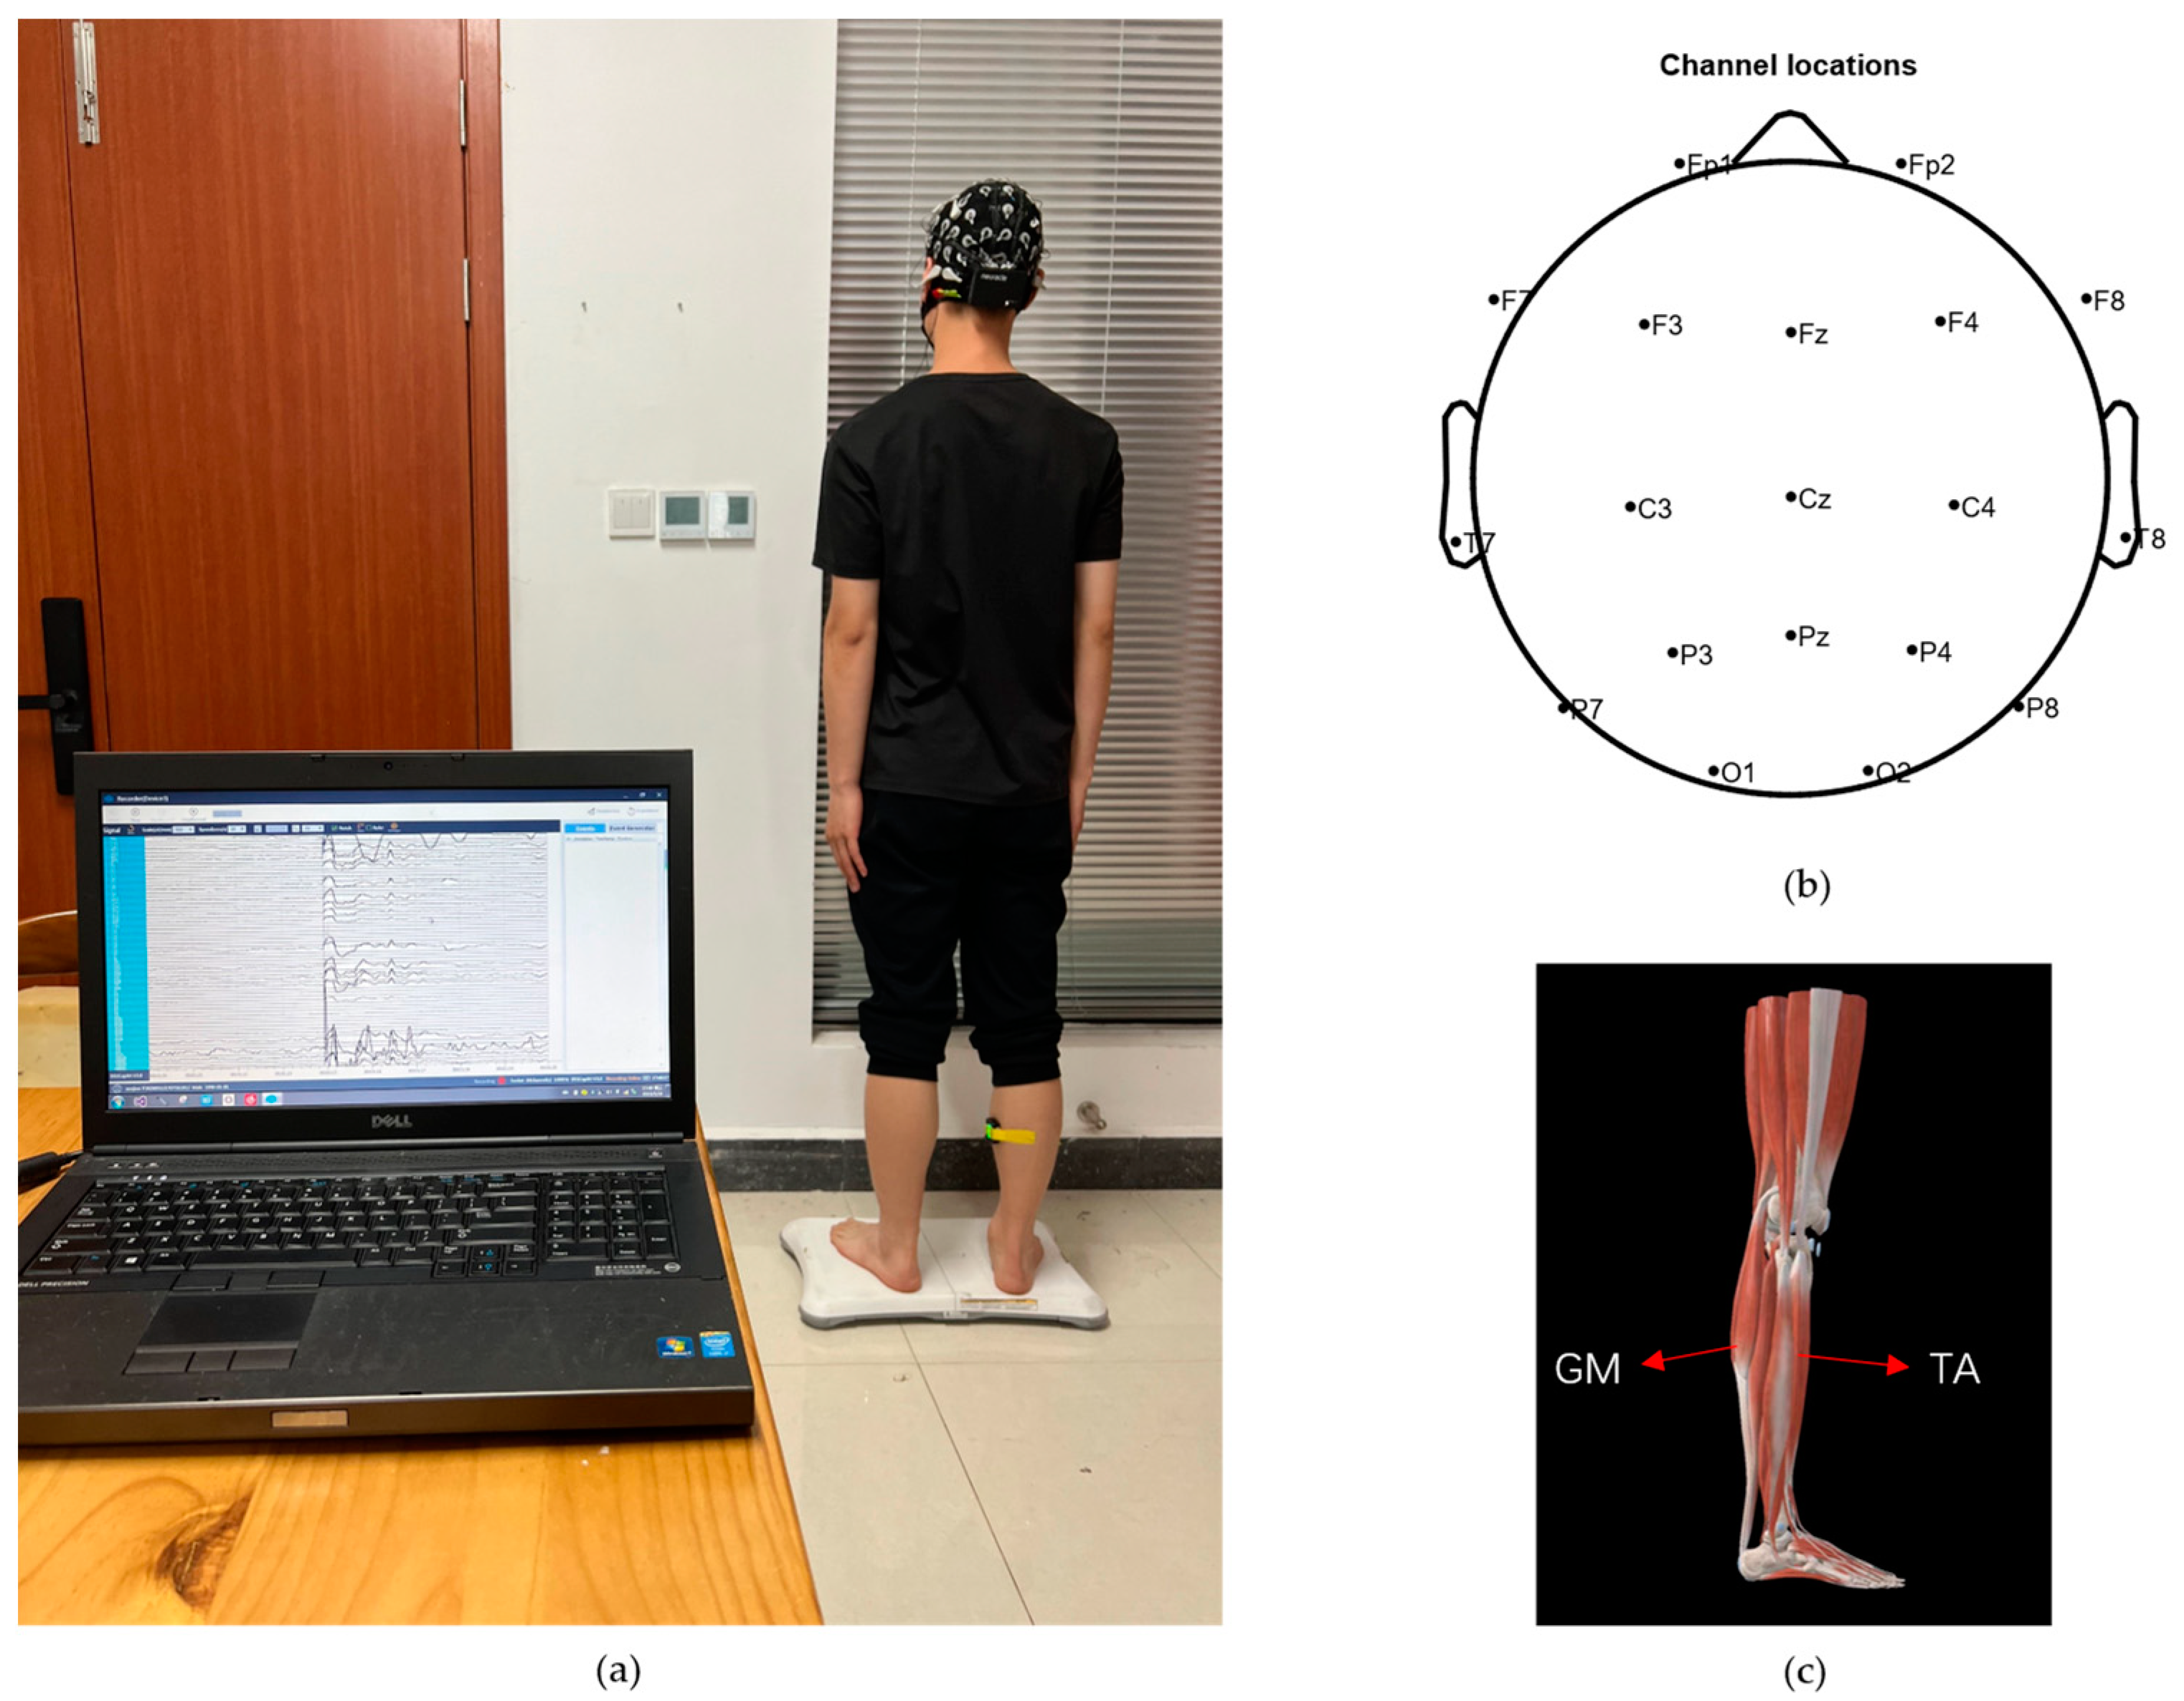
2.2. Experimental Subjects and Experimental Paradigms
2.3. EEG/EMG Signal Preprocessing
2.4. Magnitude-Squared Coherence
2.5. Coherence Threshold Evaluation
2.6. Transfer Entropy
2.7. Graph Theory
2.8. Statistical Analysis
3. Results
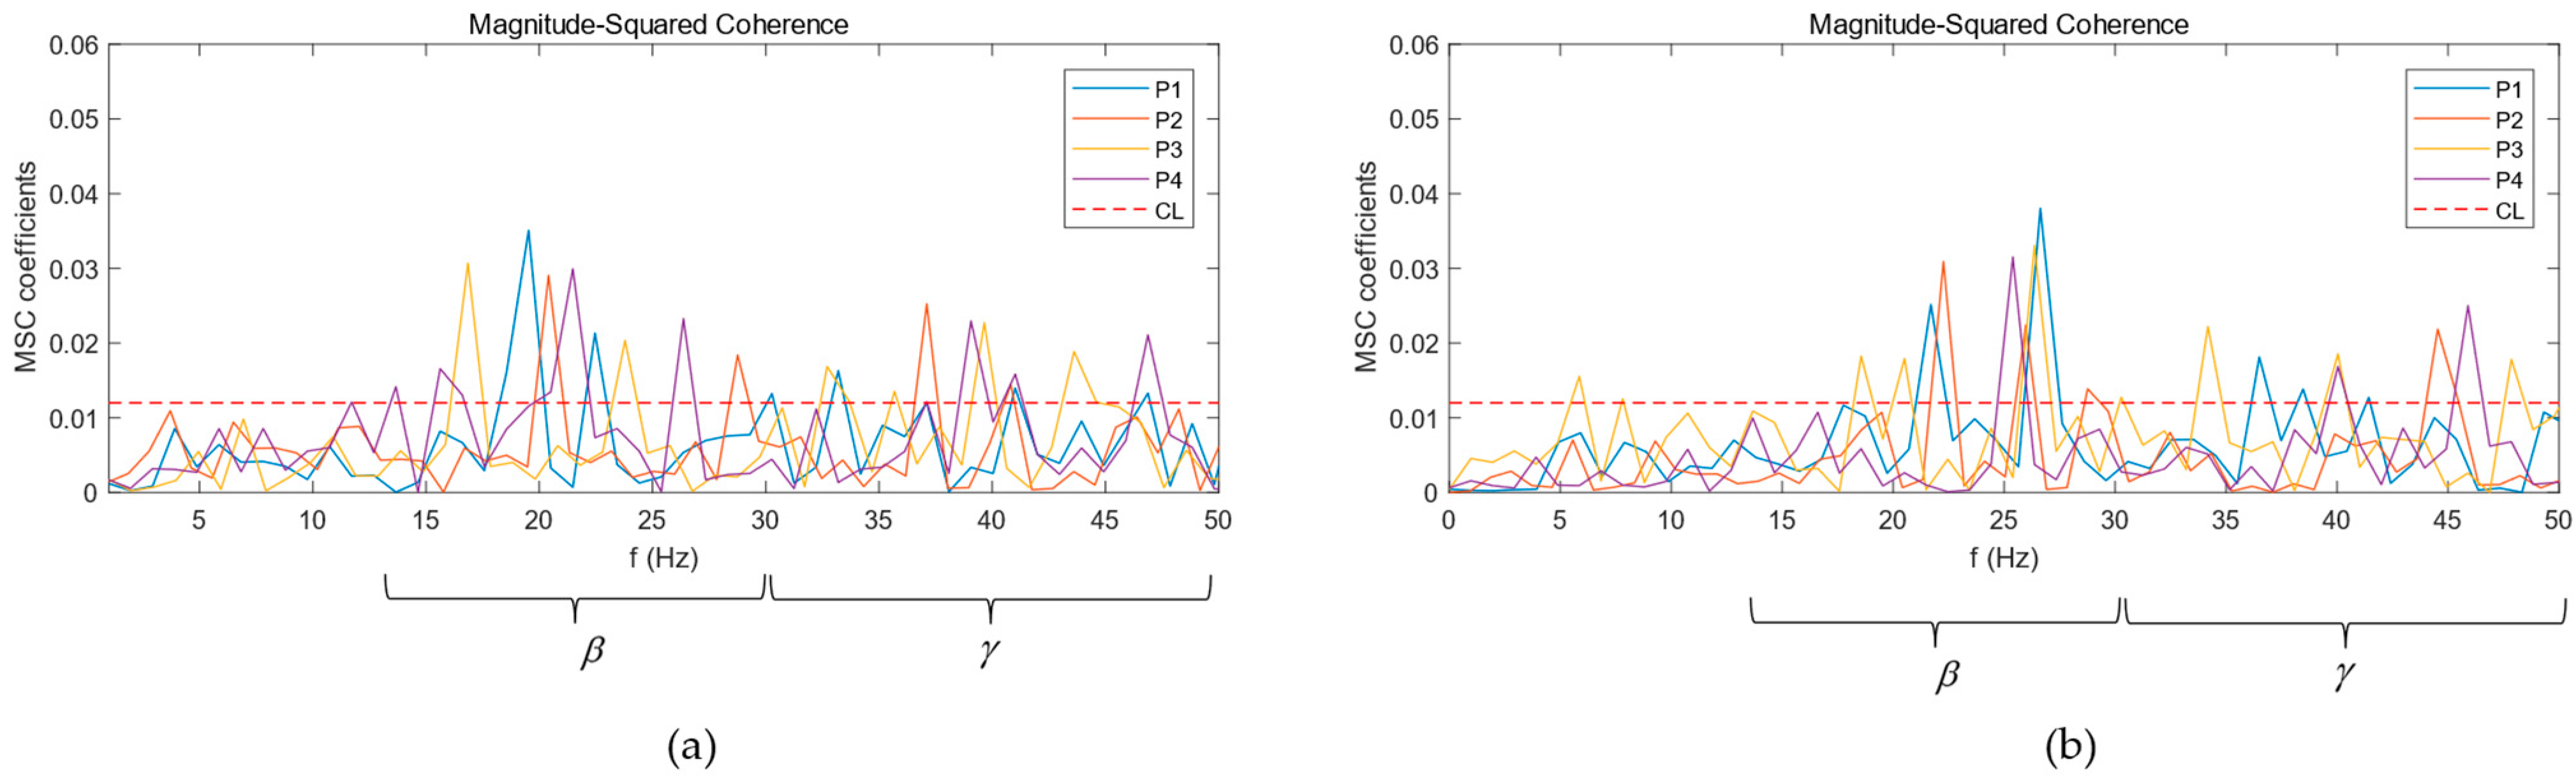
3.1. CMC Analysis
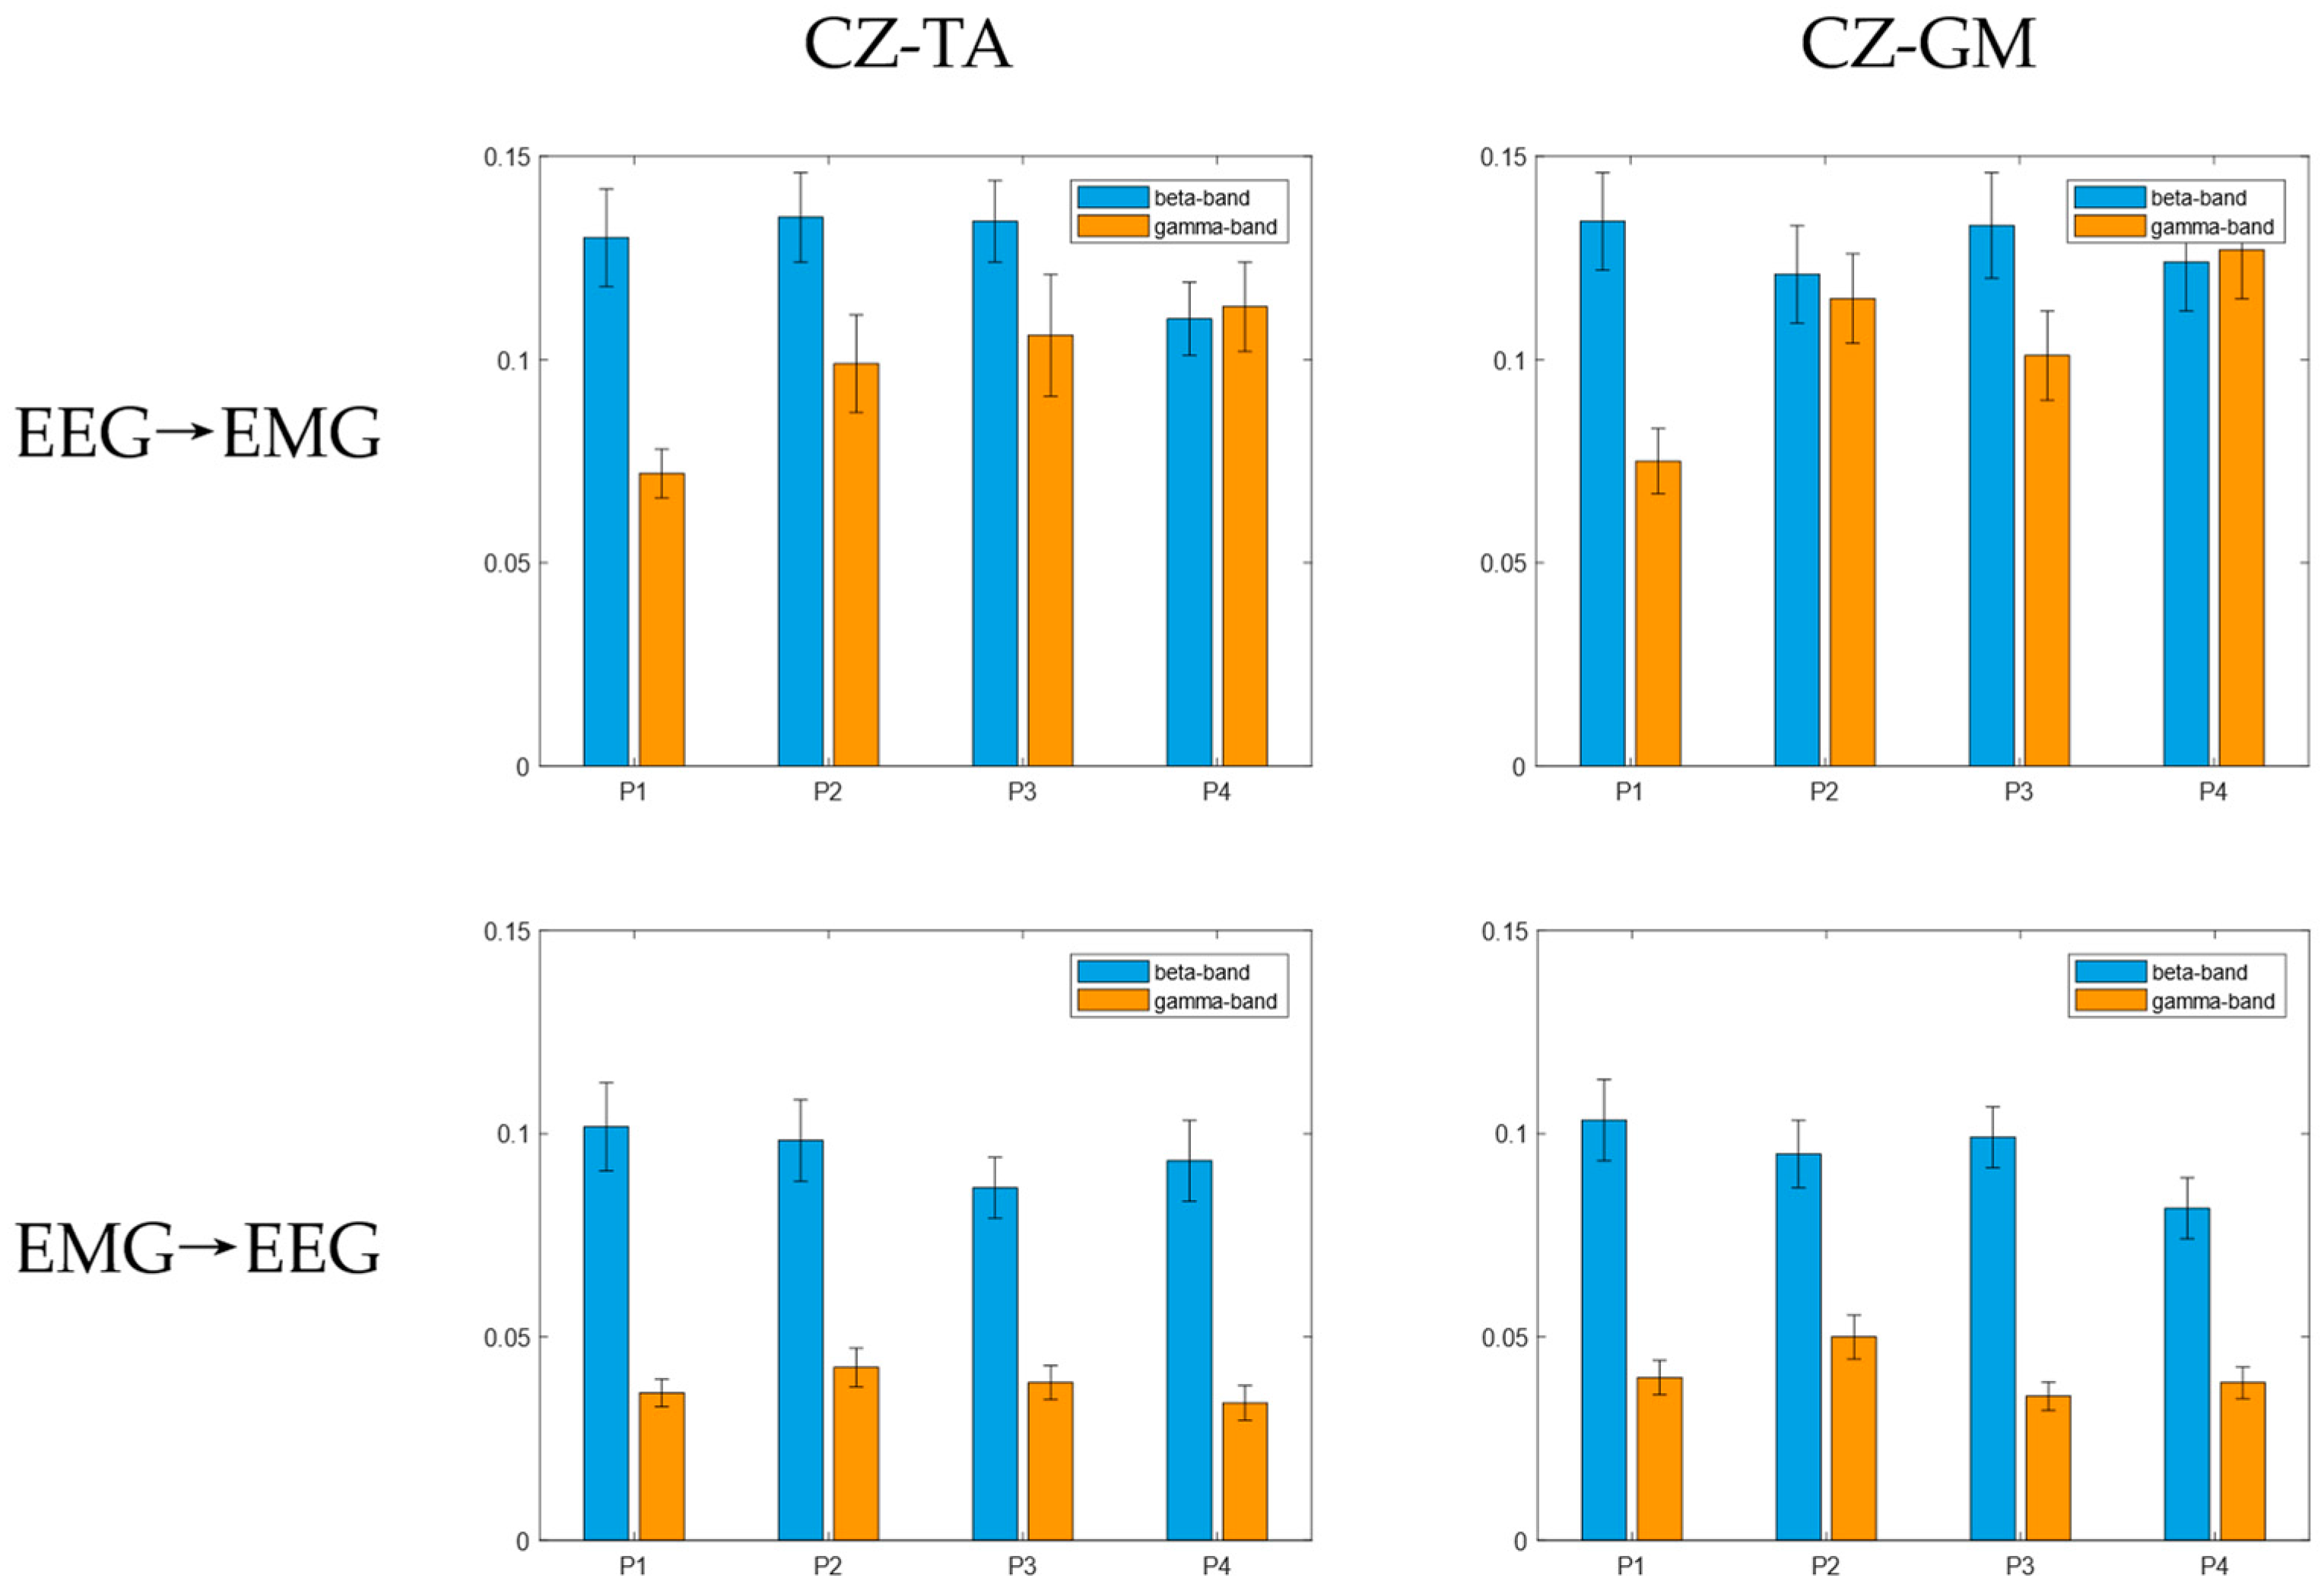
3.2. Bidirectional Transfer Entropy between the Cortex and Muscles
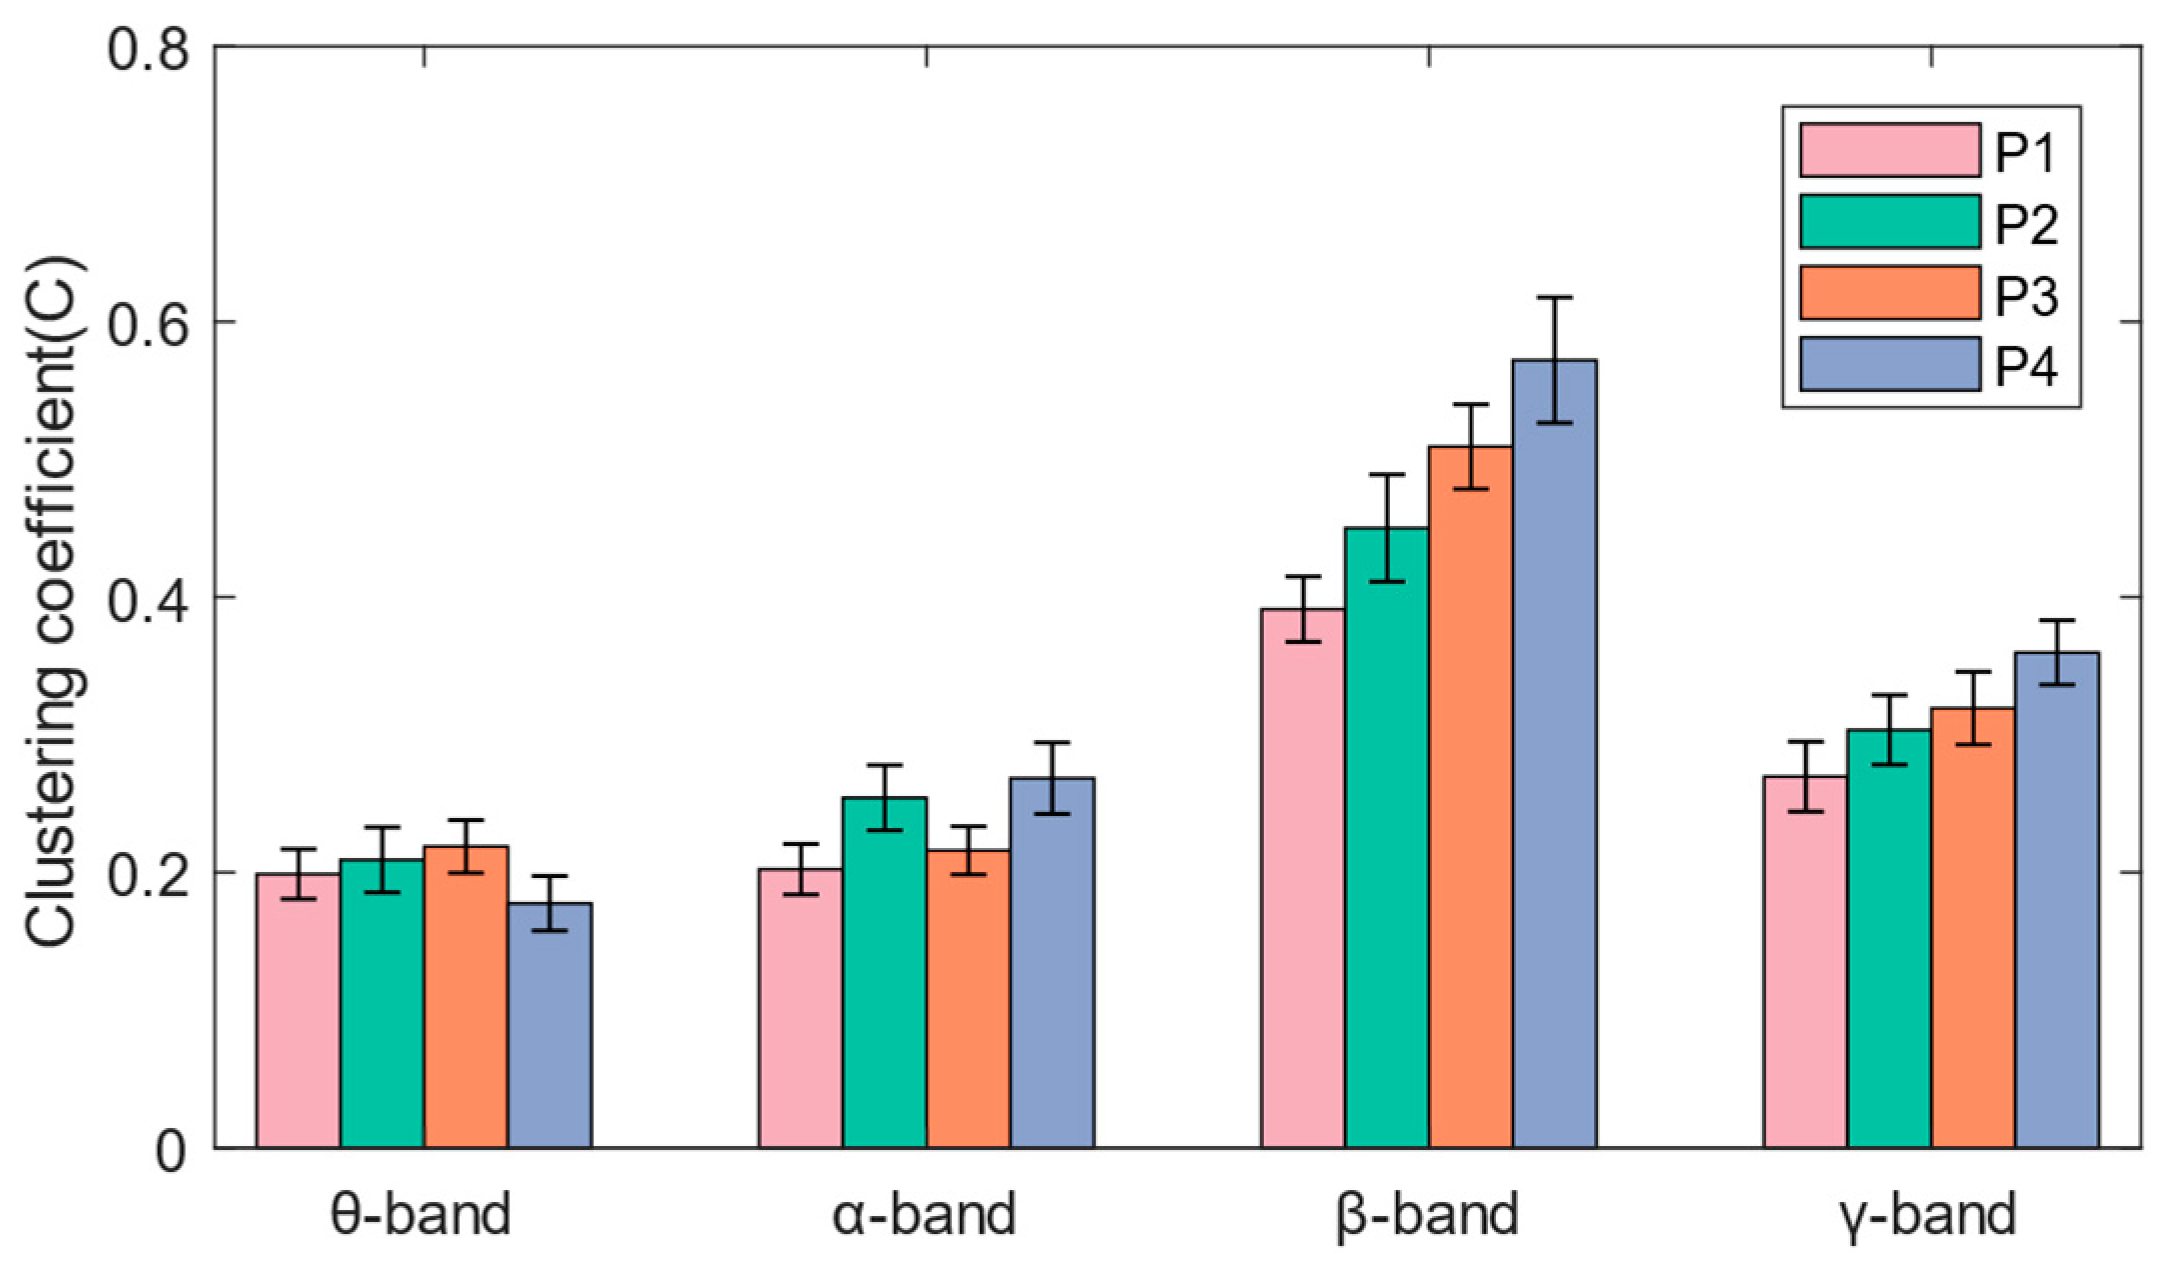
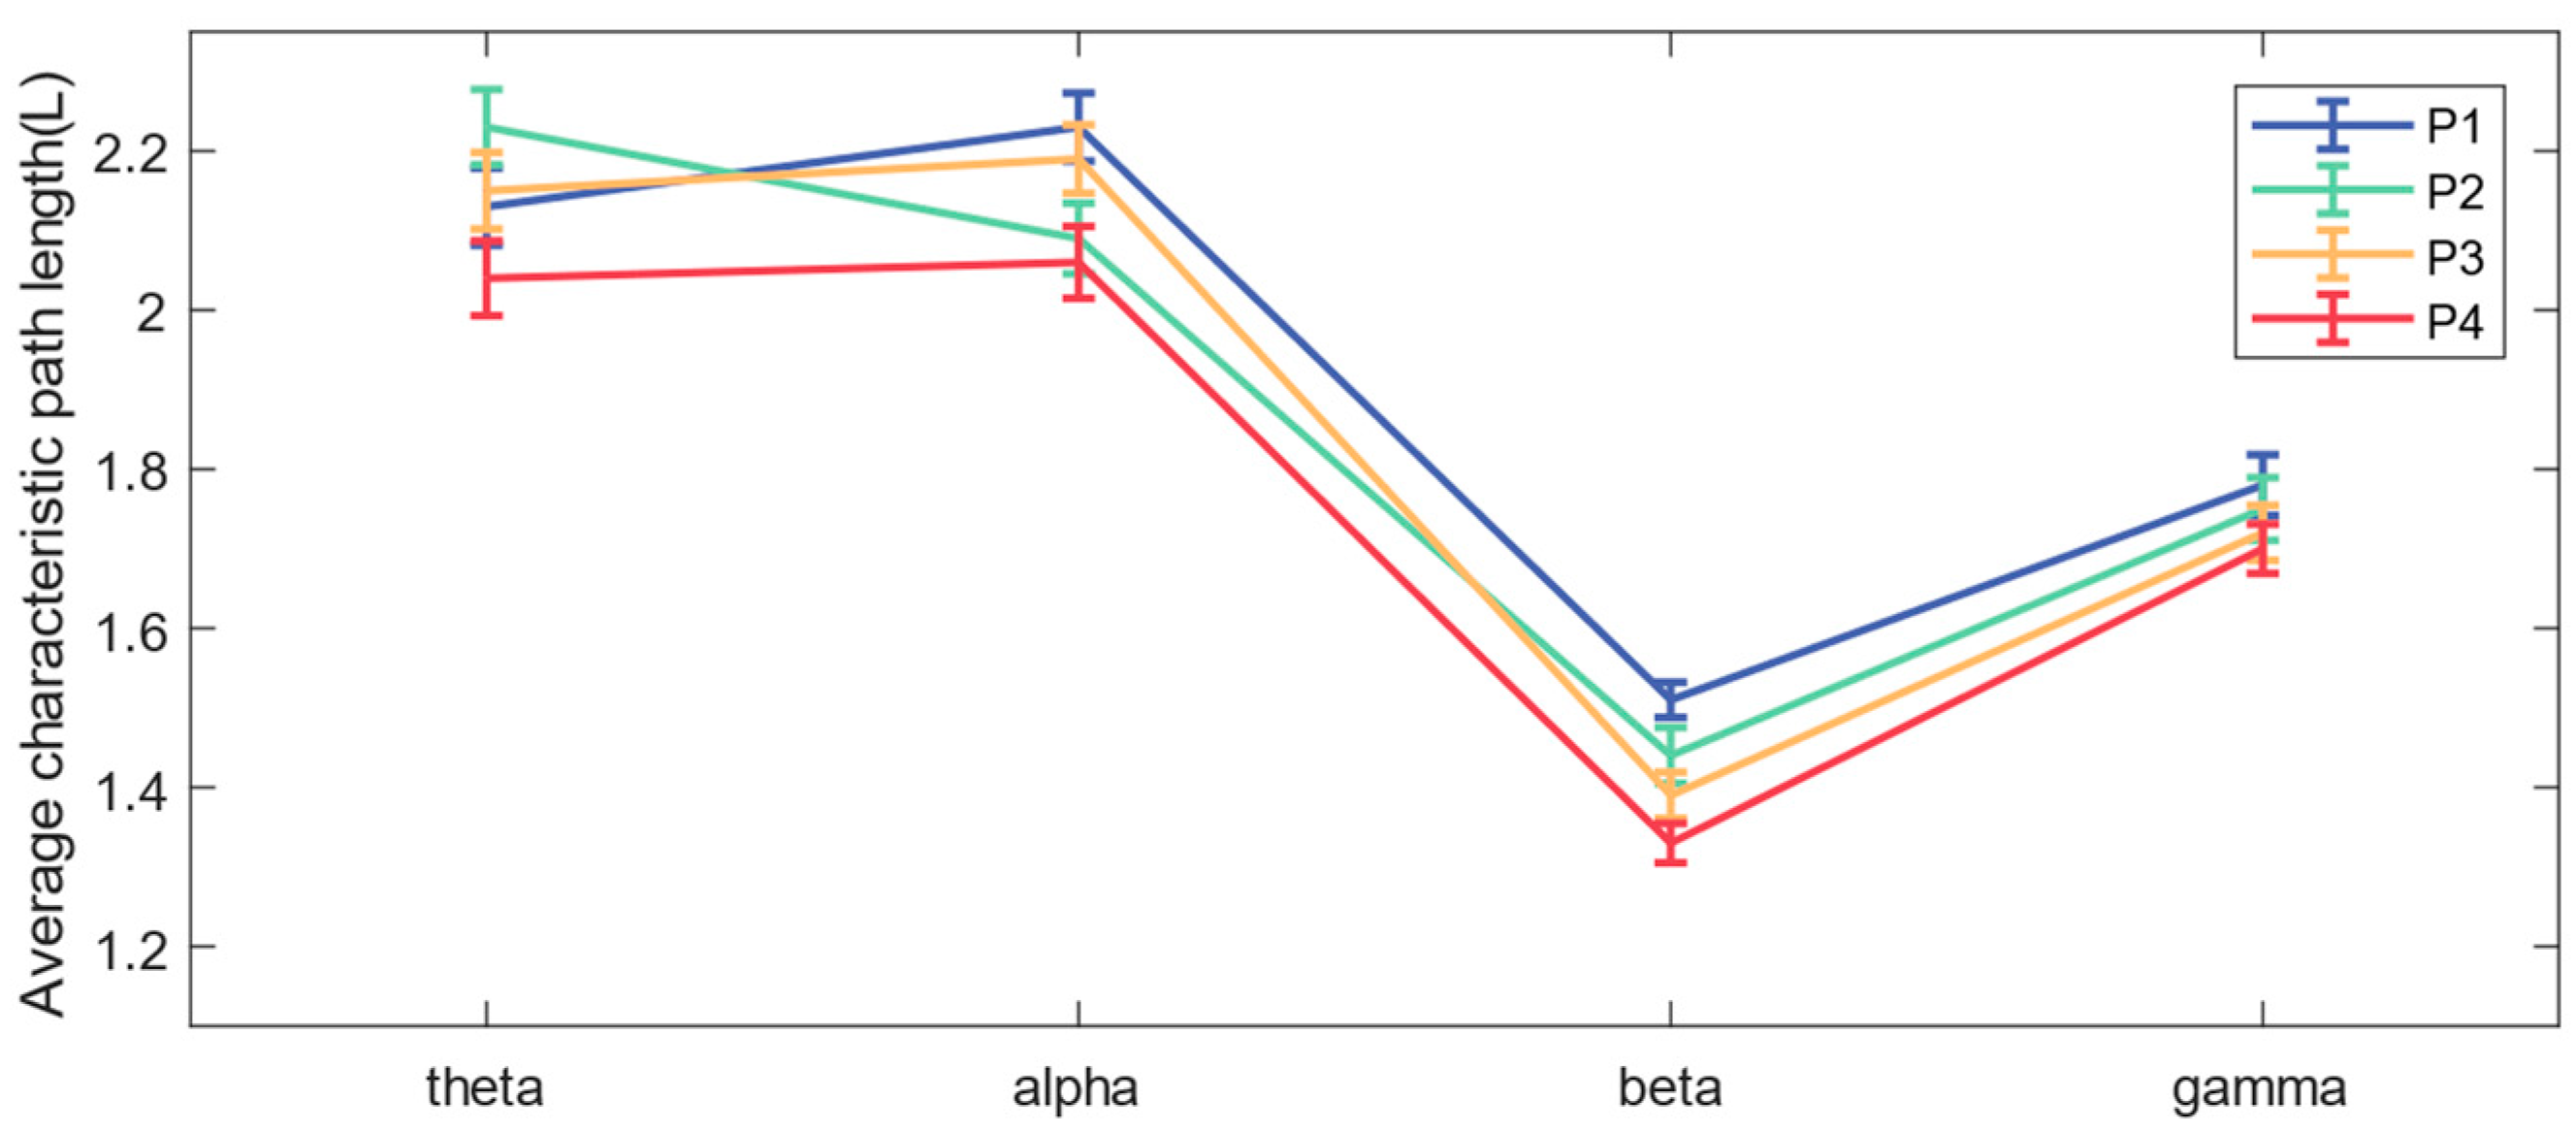
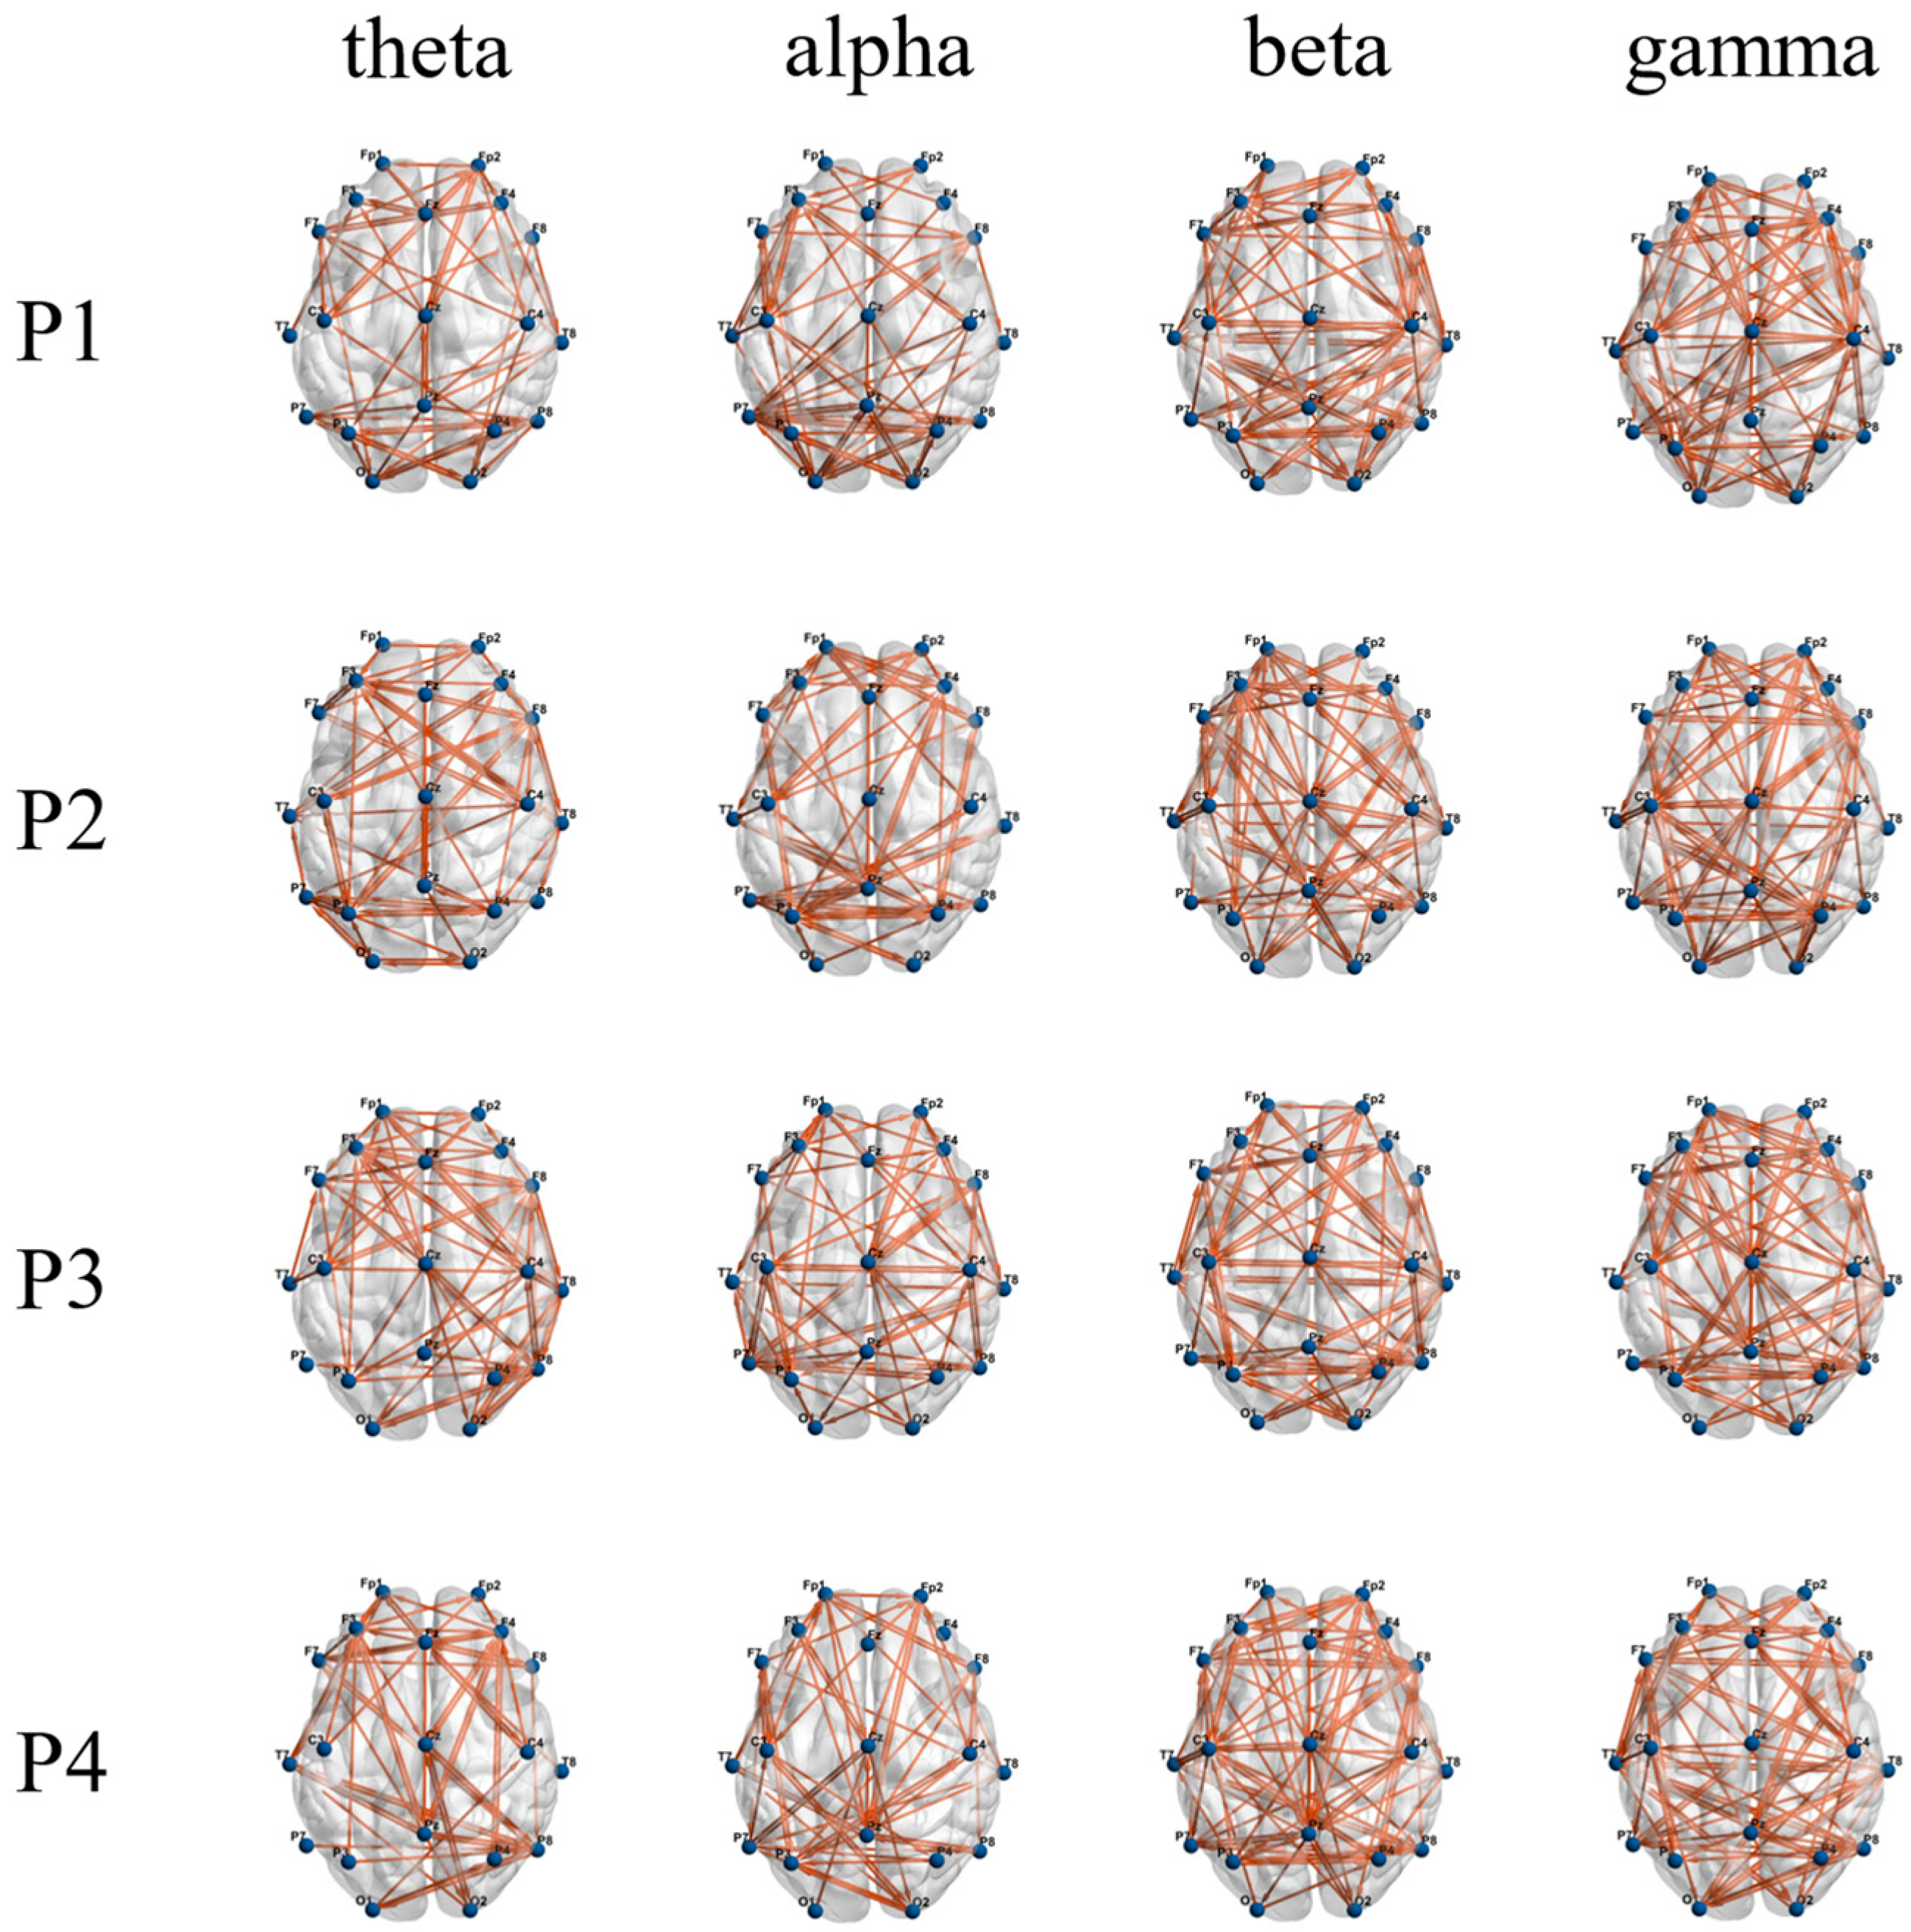
3.3. Functional Brain Network Characteristics
4. Discussion
5. Conclusions
Author Contributions
Funding
Institutional Review Board Statement
Informed Consent Statement
Data Availability Statement
Conflicts of Interest
References
- Pollock, A.; Baer, G.; Campbell, P.; Choo, P.L.; Forster, A.; Morris, J.; Pomeroy, V.M.; Langhorne, P. Physical rehabilitation approaches for the recovery of function and mobility following stroke. Cochrane Database Syst. Rev. 2014, 4, CD001920. [Google Scholar]
- Mozafaripour, E.; Sadati, S.K.M.; Najafi, L.; Zoghi, M. The Effect of Motor Imaginary Combined with Transcranial Direct Current Stimulation (tDCS) on Balance in Middle-Aged Women with High Fall Risk: A Double-Blind Randomized Controlled Trial. Neural Plast. 2023, 2023, 9680371. [Google Scholar] [CrossRef] [PubMed]
- Solis-Escalante, T.; De Kam, D.; Weerdesteyn, V. Classification of rhythmic cortical activity elicited by whole-body balance perturbations suggests the cortical representation of direction-specific changes in postural stability. IEEE Trans. Neural Syst. Rehabil. Eng. 2020, 28, 2566–2574. [Google Scholar] [CrossRef]
- Stebbins, G.T.; Goetz, C.G.; Burn, D.J.; Jankovic, J.; Khoo, T.K.; Tilley, B.C. How to identify tremor dominant and postural instability/gait difficulty groups with the movement disorder society unified Parkinson’s disease rating scale: Comparison with the unified Parkinson’s disease rating scale. Mov. Disord. 2013, 28, 668–670. [Google Scholar] [CrossRef] [PubMed]
- Sibley, K.M.; Beauchamp, M.K.; Van Ooteghem, K.; Straus, S.E.; Jaglal, S.B. Using the systems framework for postural control to analyze the components of balance evaluated in standardized balance measures: A scoping review. Arch. Phys. Med. Rehabil. 2015, 96, 122–132.e29. [Google Scholar] [CrossRef] [PubMed]
- Bao, S.-C.; Wong, W.-W.; Leung, T.W.H.; Tong, K.-Y. Cortico-muscular coherence modulated by high-definition transcranial direct current stimulation in people with chronic stroke. IEEE Trans. Neural Syst. Rehabil. Eng. 2018, 27, 304–313. [Google Scholar] [CrossRef]
- Bayram, M.B.; Siemionow, V.; Yue, G.H. Weakening of corticomuscular signal coupling during voluntary motor action in aging. J. Gerontol. Ser. A Biomed. Sci. Med. Sci. 2015, 70, 1037–1043. [Google Scholar] [CrossRef]
- Alkaff, S.D.; Ushiyama, J. The presence of corticomuscular coherence during unipedal stance. BioRxiv 2021. [Google Scholar] [CrossRef]
- Spedden, M.E.; Nielsen, J.B.; Geertsen, S.S. Oscillatory corticospinal activity during static contraction of ankle muscles is reduced in healthy old versus young adults. Neural Plast. 2018, 2018, 3432649. [Google Scholar] [CrossRef]
- Bao, S.-C.; Leung, K.W.; Tong, K.-Y. Cortico-muscular interaction to monitor the effects of neuromuscular electrical stimulation pedaling training in chronic stroke. Comput. Biol. Med. 2021, 137, 104801. [Google Scholar] [CrossRef]
- Witham, C.L.; Riddle, C.N.; Baker, M.R.; Baker, S.N. Contributions of descending and ascending pathways to corticomuscular coherence in humans. J. Physiol. 2011, 589, 3789–3800. [Google Scholar] [CrossRef]
- Barnett, L.; Barrett, A.B.; Seth, A.K. Granger causality and transfer entropy are equivalent for Gaussian variables. Phys. Rev. Lett. 2009, 103, 238701. [Google Scholar] [CrossRef]
- Zhang, X.; Li, H.; Dong, R.; Lu, Z.; Li, C. Electroencephalogram and surface electromyogram fusion-based precise detection of lower limb voluntary movement using convolution neural network-long short-term memory model. Front. Neurosci. 2022, 16, 954387. [Google Scholar] [CrossRef] [PubMed]
- Lee, A.; Litt, B.; Pathmanathan, J. Normalized transfer entropy used as an informational transfer measure of ictal pathophysiology in patients undergoing stereo-EEG for epilepsy surgery (P4. 5-023). Neurol. J. 2019, 92, P4.5-023. [Google Scholar] [CrossRef]
- Sporns, O. Contributions and challenges for network models in cognitive neuroscience. Nat. Neurosci. 2014, 17, 652–660. [Google Scholar] [CrossRef] [PubMed]
- Collura, T.F. Neocortical Dynamics and Human EEG Rhythms. J. Clin. Neurophysiol. 1996, 13, 177–178. [Google Scholar] [CrossRef]
- Jiang, Y.; Yao, D.; Zhou, J.; Tan, Y.; Huang, H.; Wang, M.; Chang, X.; Duan, M.; Luo, C. Characteristics of disrupted topological organization in white matter functional connectome in schizophrenia. Psychol. Med. 2022, 52, 1333–1343. [Google Scholar] [CrossRef]
- Luo, Z.; Lu, X.; Xi, X. EEG feature extraction based on a bilevel network: Minimum spanning tree and regional network. Electronics 2020, 9, 203. [Google Scholar] [CrossRef]
- Dal Maso, F.; Longcamp, M.; Cremoux, S.; Amarantini, D. Effect of training status on beta-range corticomuscular coherence in agonist vs. antagonist muscles during isometric knee contractions. Exp. Brain Res. 2017, 235, 3023–3031. [Google Scholar] [CrossRef]
- Li, F.; Peng, W.; Jiang, Y.; Song, L.; Liao, Y.; Yi, C.; Zhang, L.; Si, Y.; Zhang, T.; Wang, F. The dynamic brain networks of motor imagery: Time-varying causality analysis of scalp EEG. Int. J. Neural Systems. 2019, 29, 1850016. [Google Scholar] [CrossRef]
- Murnaghan, C.D.; Squair, J.W.; Chua, R.; Inglis, J.T.; Carpenter, M.G. Cortical contributions to control of posture during unrestricted and restricted stance. J. Neurophysiol. 2014, 111, 1920–1926. [Google Scholar] [CrossRef] [PubMed]
- Hytönen, M.; Pyykkö, I.; Aalto, H.; Starck, J. Postural control and age. Acta Oto-Laryngol. 1993, 113, 119–122. [Google Scholar] [CrossRef] [PubMed]
- Xi, X.; Ma, C.; Yuan, C.; Miran, S.M.; Hua, X.; Zhao, Y.-B.; Luo, Z. Enhanced EEG–EMG coherence analysis based on hand movements. Biomed. Signal Process. Control 2020, 56, 101727. [Google Scholar] [CrossRef]
- Urrestarazu, E.; Iriarte, J. Independent Components Analysis (ICA) in the study of electroencephalographic signals. Neurologia 2005, 20, 299–310. [Google Scholar]
- Teplan, M.; Krakovská, A.; Štolc, S. Direct effects of audio-visual stimulation on EEG. Comput. Methods Programs Biomed. 2011, 102, 17–24. [Google Scholar] [CrossRef] [PubMed]
- Ushijima, T.; Sahroni, A.; Igasaki, T.; Murayama, N. Time-lapse changes in EEG-EMG coherence during weak voluntary contraction of the tibialis anterior muscle. In Proceedings of the 2017 10th Biomedical Engineering International Conference (BMEiCON), Hokkaido, Japan, 31 August–2 September 2017; pp. 1–5. [Google Scholar]
- Schreiber, T. Measuring information transfer. Phys. Rev. Lett. 2000, 85, 461. [Google Scholar] [CrossRef]
- Neuper, C.; Pfurtscheller, G. Evidence for distinct beta resonance frequencies in human EEG related to specific sensorimotor cortical areas. Clin. Neurophysiol. 2001, 112, 2084–2097. [Google Scholar] [CrossRef]
- Omlor, W.; Patino, L.; Hepp-Reymond, M.-C.; Kristeva, R. Gamma-range corticomuscular coherence during dynamic force output. Neuroimage 2007, 34, 1191–1198. [Google Scholar] [CrossRef]
- Vecchio, F.; Del Percio, C.; Marzano, N.; Fiore, A.; Toran, G.; Aschieri, P.; Gallamini, M.; Cabras, J.; Rossini, P.M.; Babiloni, C. Functional cortico-muscular coupling during upright standing in athletes and nonathletes: A coherence electroencephalographic-electromyographic study. Behav. Neurosci. 2008, 122, 917. [Google Scholar] [CrossRef]
- Salonikidis, K.; Amiridis, I.; Oxyzoglou, N.; Giagazoglou, P.; Akrivopoulou, G. Wrist flexors are steadier than extensors. Int. J. Sports Med. 2011, 32, 754–760. [Google Scholar] [CrossRef]
- Zehr, E.P. Neural control of rhythmic human movement: The common core hypothesis. Exerc. Sport Sci. Rev. 2005, 33, 54–60. [Google Scholar] [PubMed]
- Liu, J.; Tan, G.; Sheng, Y.; Liu, H. Multiscale transfer spectral entropy for quantifying corticomuscular interaction. IEEE J. Biomed. Health Inform. 2020, 25, 2281–2292. [Google Scholar] [CrossRef] [PubMed]
- Cheng, S.; Chen, X.; Zhang, Y.; Wang, Y.; Li, X.; Li, X.; Xie, P. Multiscale information interaction at local frequency band in functional corticomuscular coupling. Cogn. Neurodyn. 2022, 17, 1575–1589. [Google Scholar] [CrossRef]
- Fiebelkorn, I.C.; Kastner, S. A rhythmic theory of attention. Trends Cogn. Sci. 2019, 23, 87–101. [Google Scholar] [CrossRef] [PubMed]
- Si, Y.; Jiang, L.; Tao, Q.; Chen, C.; Li, F.; Jiang, Y.; Zhang, T.; Cao, X.; Wan, F.; Yao, D. Predicting individual decision-making responses based on the functional connectivity of resting-state EEG. J. Neural Eng. 2019, 16, 066025. [Google Scholar] [CrossRef]
- Zhang, J.; Li, Y.; Chen, H.; Ding, J.; Yuan, Z. An investigation of the differences and similarities between generated small-world networks for right-and left-hand motor imageries. Sci. Rep. 2016, 6, 36562. [Google Scholar] [CrossRef]
- De Graaf, T.A.; Gross, J.; Paterson, G.; Rusch, T.; Sack, A.T.; Thut, G. Alpha-band rhythms in visual task performance: Phase-locking by rhythmic sensory stimulation. PLoS ONE 2013, 8, e60035. [Google Scholar] [CrossRef]


| Paradigms | Details |
|---|---|
| P1 | Normal perception |
| P2 | Vision is blocked (eyes closed) |
| P3 | Proprioception is blocked (sponge pad under feet) |
| P4 | Both vision and proprioception are blocked (eyes closed, sponge pad under feet) |
| CZ-TA | CZ-GM | |||
|---|---|---|---|---|
| Beta | Gamma | Beta | Gamma | |
| P1 | 30 | 3 | 37 | 5 |
| P2 | 21 | 7 | 29 | 10 |
| P3 | 24 | 9 | 24 | 12 |
| P4 | 20 | 14 | 26 | 16 |
Disclaimer/Publisher’s Note: The statements, opinions and data contained in all publications are solely those of the individual author(s) and contributor(s) and not of MDPI and/or the editor(s). MDPI and/or the editor(s) disclaim responsibility for any injury to people or property resulting from any ideas, methods, instructions or products referred to in the content. |
© 2024 by the authors. Licensee MDPI, Basel, Switzerland. This article is an open access article distributed under the terms and conditions of the Creative Commons Attribution (CC BY) license (https://creativecommons.org/licenses/by/4.0/).
Share and Cite
Ke, W.; Luo, Z. Analysis of Cortico-Muscular Coupling and Functional Brain Network under Different Standing Balance Paradigms. Brain Sci. 2024, 14, 81. https://doi.org/10.3390/brainsci14010081
Ke W, Luo Z. Analysis of Cortico-Muscular Coupling and Functional Brain Network under Different Standing Balance Paradigms. Brain Sciences. 2024; 14(1):81. https://doi.org/10.3390/brainsci14010081
Chicago/Turabian StyleKe, Weijie, and Zhizeng Luo. 2024. "Analysis of Cortico-Muscular Coupling and Functional Brain Network under Different Standing Balance Paradigms" Brain Sciences 14, no. 1: 81. https://doi.org/10.3390/brainsci14010081
APA StyleKe, W., & Luo, Z. (2024). Analysis of Cortico-Muscular Coupling and Functional Brain Network under Different Standing Balance Paradigms. Brain Sciences, 14(1), 81. https://doi.org/10.3390/brainsci14010081