

Neuropsychological Evaluation and Quantitative EEG in Patients with Frontotemporal Dementia, Alzheimer’s Disease, and Mild Cognitive Impairment
 , ,
, , 
Abstract
1. Introduction
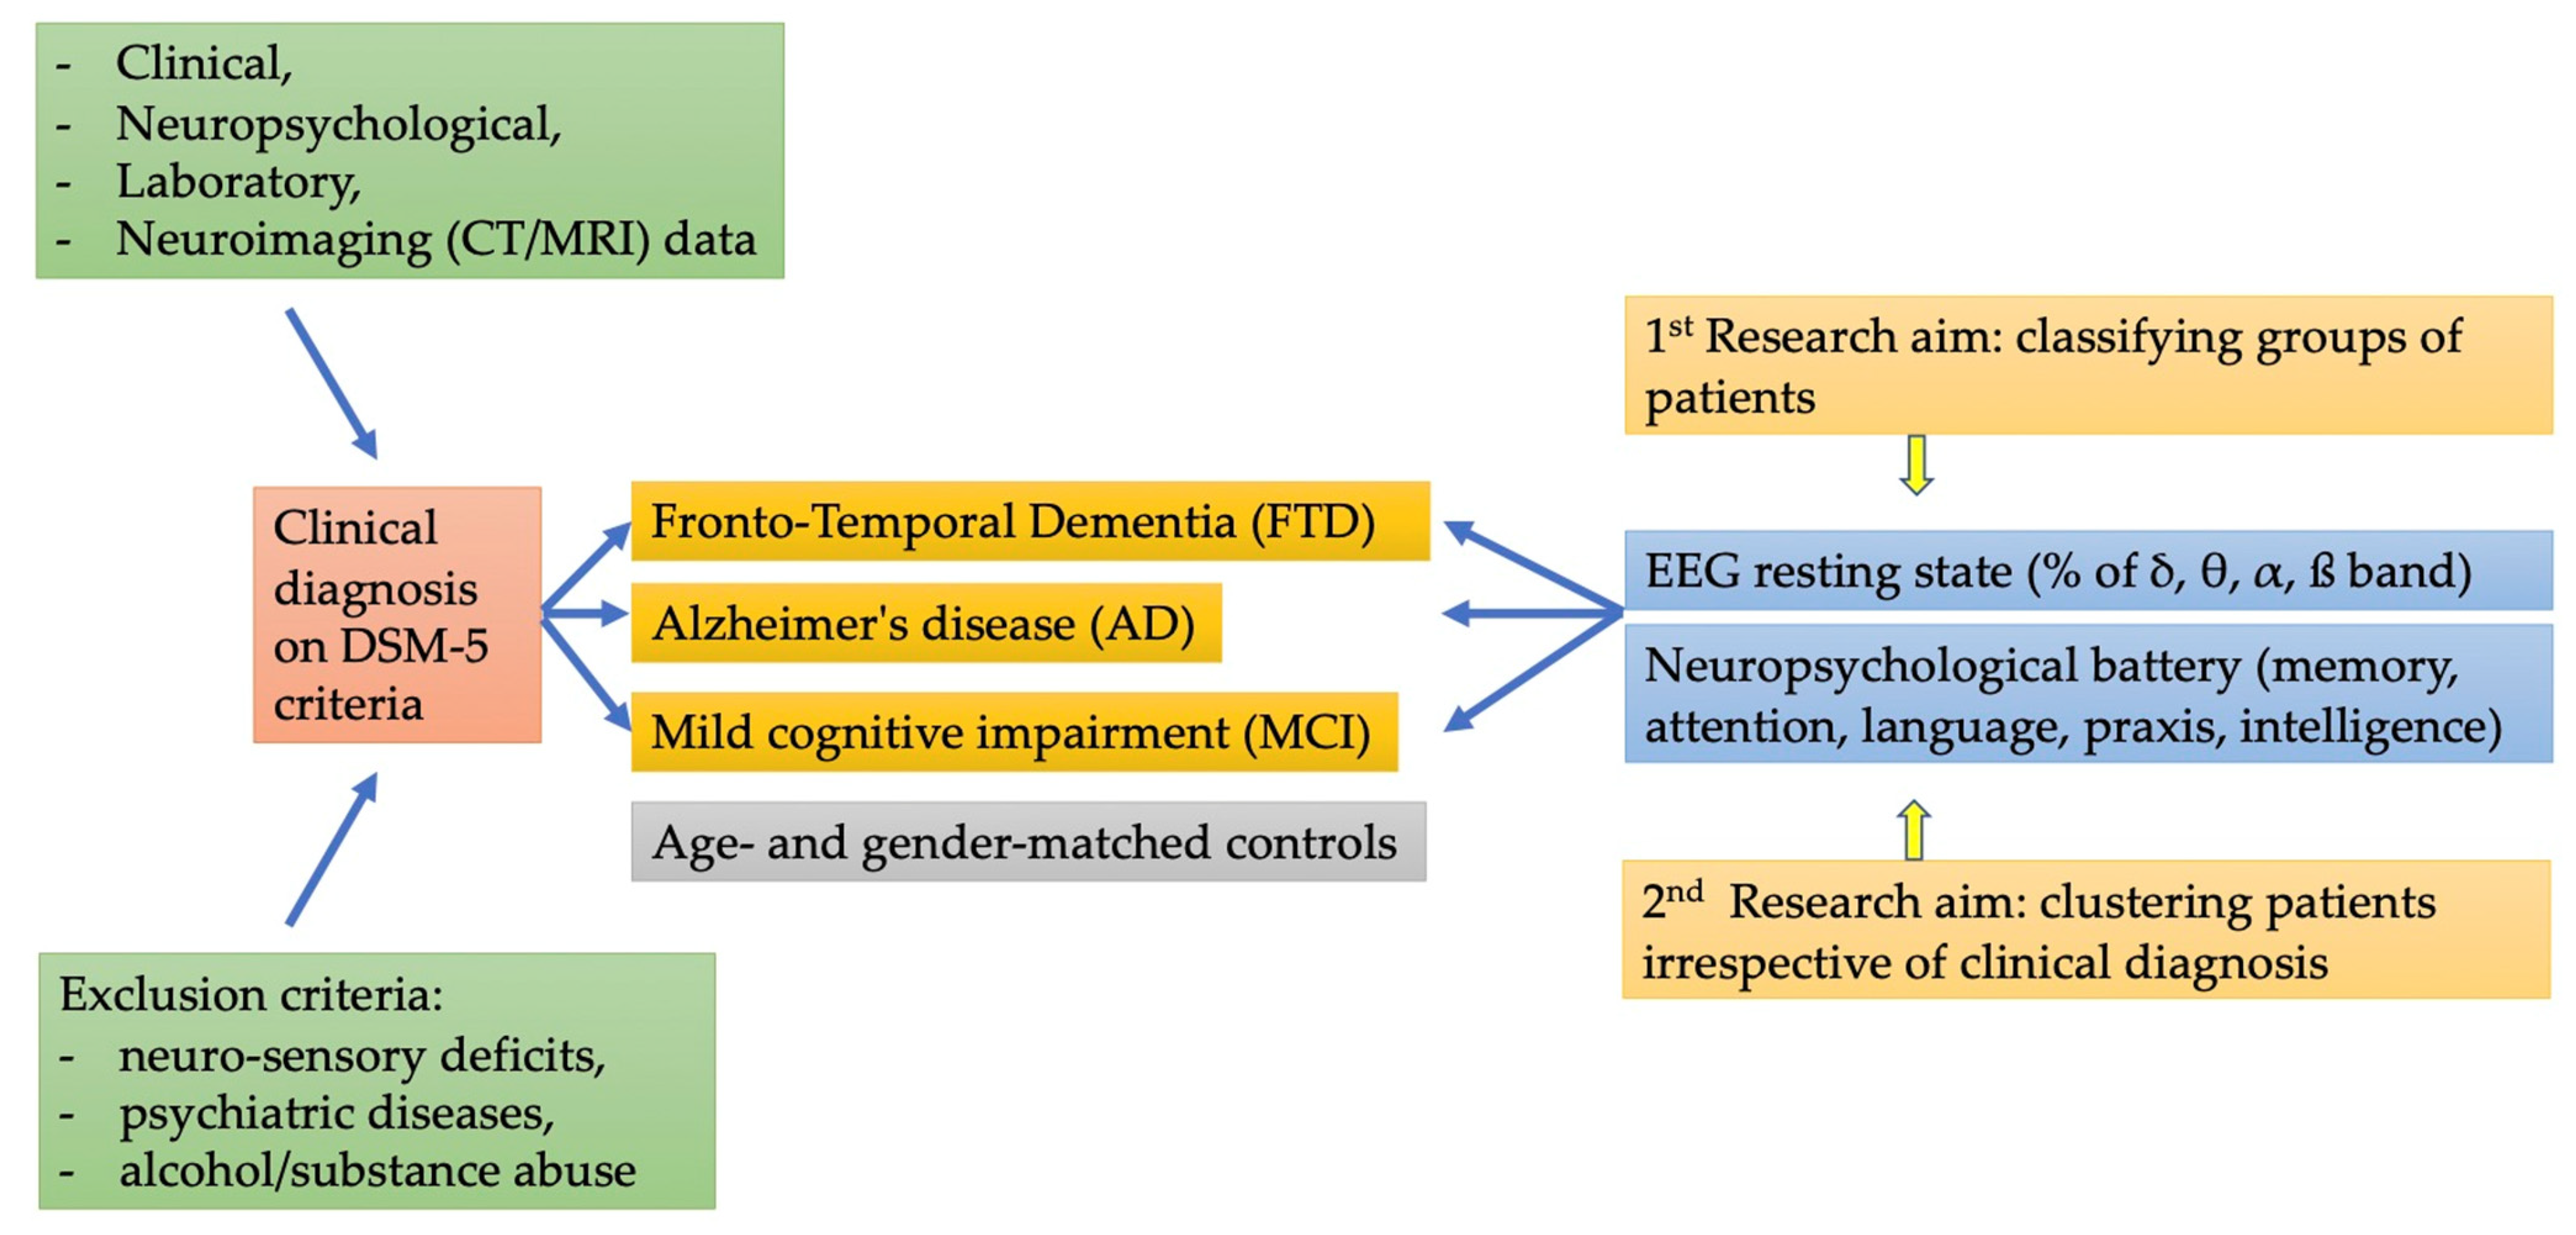
2. Materials and Methods
2.1. Participants
2.2. Neuropsychological Assessment
2.3. EEG Evaluation
2.3.1. EEG Scoring
2.3.2. Statistical Analyses
3. Results
3.1. Participants
3.2. EEG
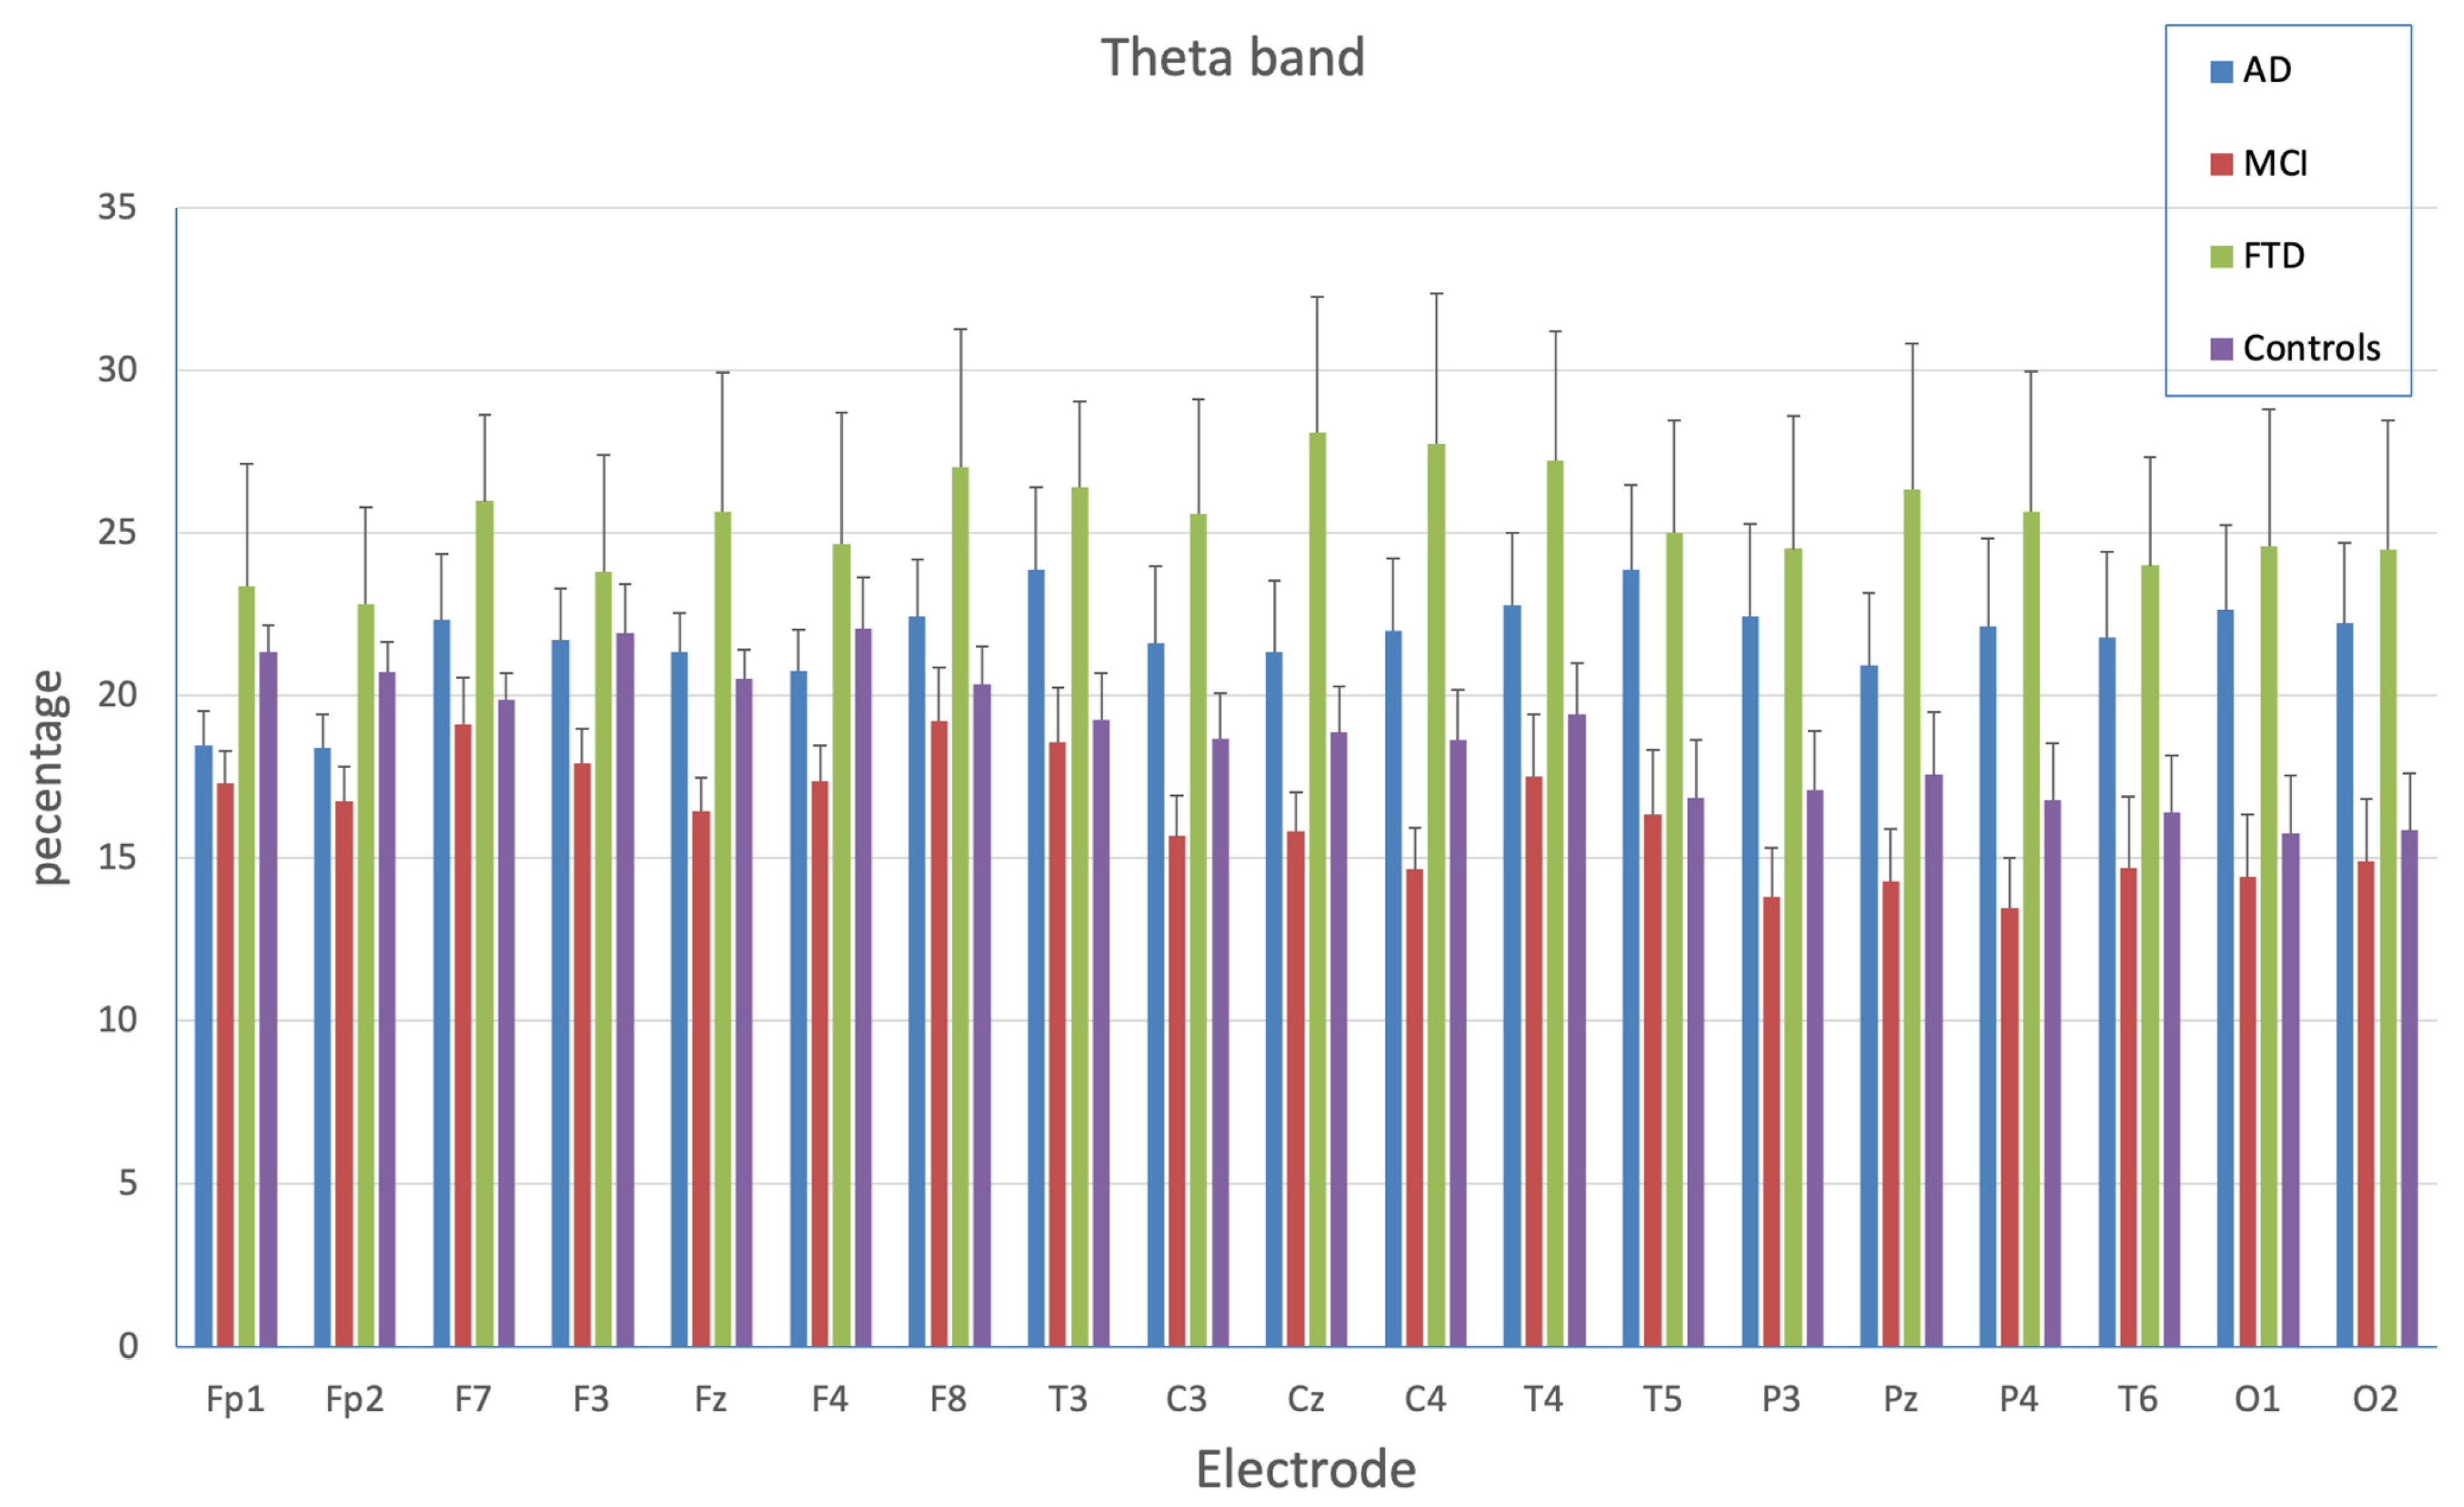
3.2.1. Theta Bands
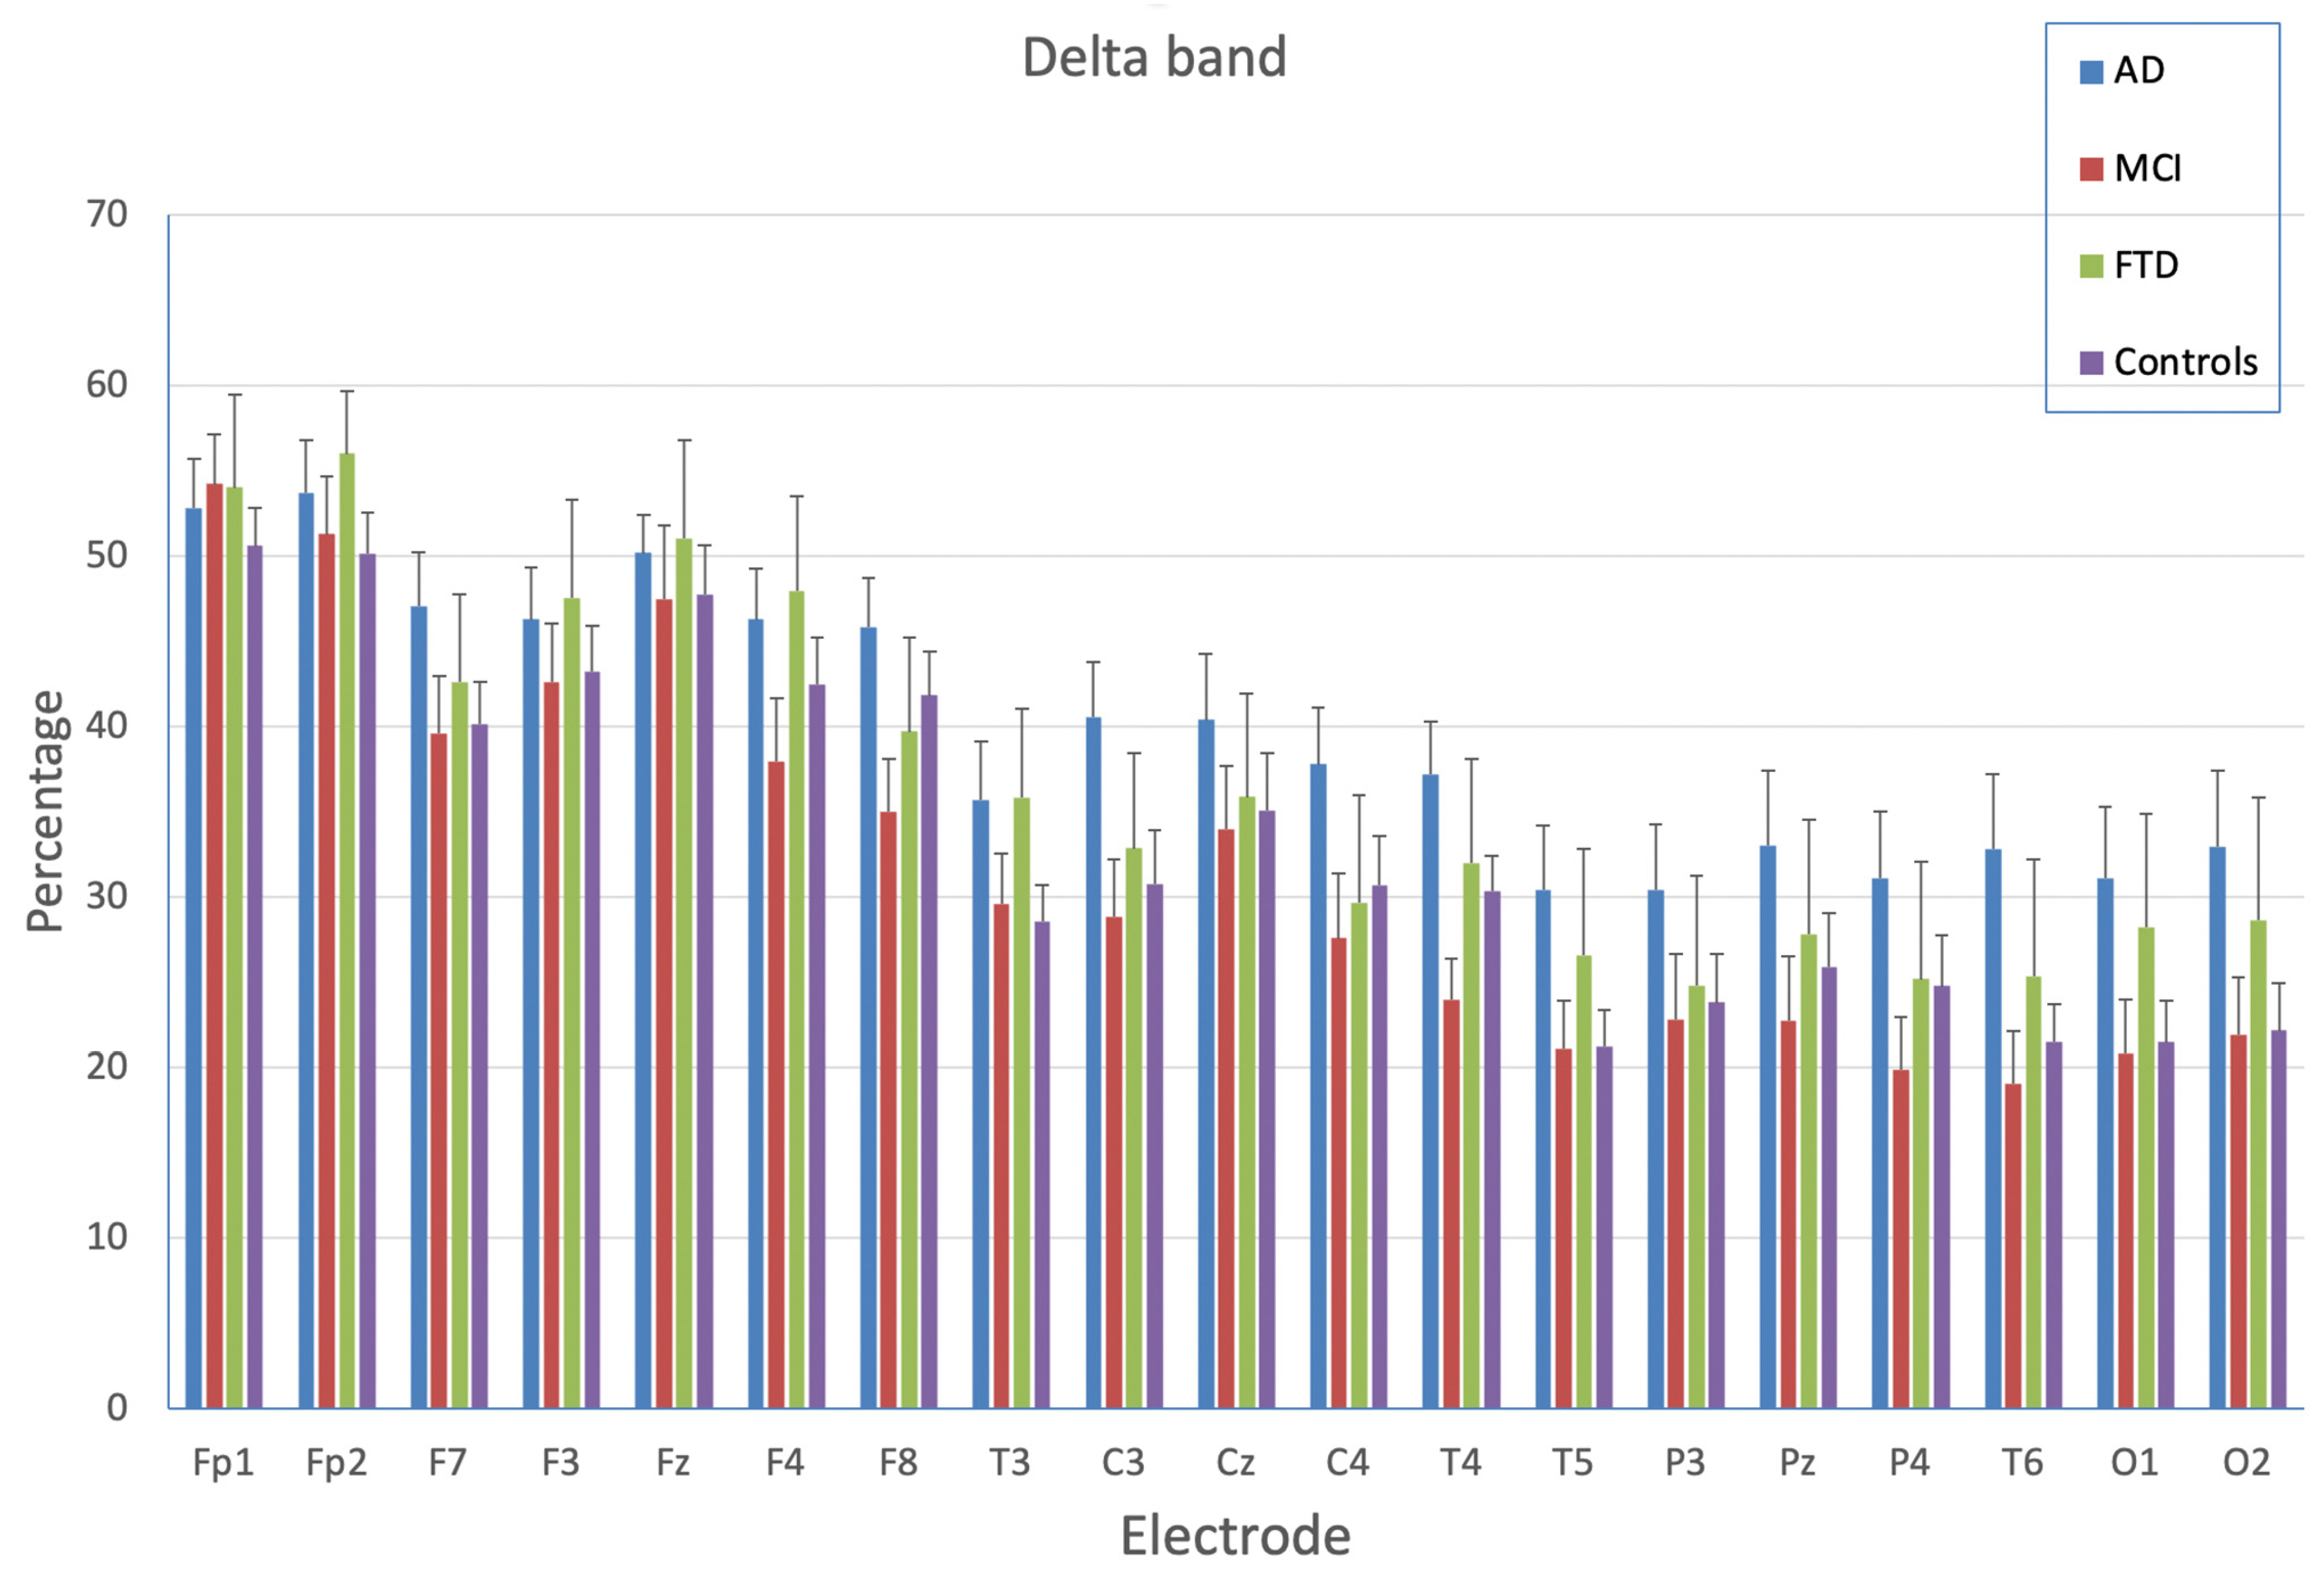
3.2.2. Delta Bands
3.2.3. Beta Bands
3.2.4. Alpha Bands
3.2.5. Cluster Analysis
3.2.6. Clusters Description
4. Discussion
5. Conclusions
Author Contributions
Funding
Institutional Review Board Statement
Informed Consent Statement
Data Availability Statement
Acknowledgments
Conflicts of Interest
References
- Ferri, C.P.; Prince, M.; Brayne, C.; Brodaty, H.; Fratiglioni, L.; Ganguli, M.; Hall, K.; Hasegawa, K.; Hendrie, H.; Huang, Y.; et al. Global prevalence of dementia: A Delphi consensus study. Lancet 2005, 366, 2112–2117. [Google Scholar] [CrossRef] [PubMed]
- Lobo, A.; Launer, L.J.; Fratiglioni, L.; Andersen, K.; Di Carlo, A.; Breteler, M.M.; Copeland, J.R.; Dartigues, J.F.; Jagger, C.; Martinez-Lage, J.; et al. Prevalence of dementia and major subtypes in Europe: A collaborative study of population-based cohorts. Neurologic Diseases in the Elderly Research Group. Neurology 2000, 54 (Suppl. 5), S4–S9. [Google Scholar] [PubMed]
- Ballard, C.; Gauthier, S.; Corbett, A.; Brayne, C.; Aarsland, D.; Jones, E. Alzheimer’s disease. Lancet 2011, 377, 1019–1031. [Google Scholar] [CrossRef]
- McKhann, G.M.; Knopman, D.S.; Chertkow, H.; Hyman, B.T.; Jack, C.R., Jr.; Kawas, C.H.; Klunk, W.E.; Koroshetz, W.J.; Manly, J.J.; Mayeux, R.; et al. The diagnosis of dementia due to Alzheimer’s disease: Recommendations from the National Institute on Aging-Alzheimer’s Association workgroups on diagnostic guidelines for Alzheimer’s disease. Alzheimer’s Dement. 2011, 7, 263–269. [Google Scholar] [CrossRef] [PubMed]
- American Psychiatric Association. Diagnostic and Statistical Manual of Mental Disorders (DSM-5®); American Psychiatric Pub: Washington, DC, USA, 2013. [Google Scholar]
- Schneider, J.; Murray, J.; Banerjee, S.; Mann, A. EUROCARE: A cross-national study of co-resident spouse carers for people with Alzheimer’s disease: I-factors associated with career burden. Int. J. Geriatr. Psychiatry 1999, 14, 651–661. [Google Scholar] [CrossRef]
- Prince, M.; Dementia Research Group. Care arrangements for people with dementia in developing countries. Int. J. Geriatr. Psychiatry 2004, 19, 170–177. [Google Scholar]
- Miltiadous, A.; Tzimourta, K.D.; Giannakeas, N.; Tsipouras, M.G.; Afrantou, T.; Ioannidis, P.; Tzallas, A.T. Alzheimer’s disease and frontotemporal dementia: A robust classification method of EEG signals and a comparison of validation methods. Diagnostics 2021, 11, 1437. [Google Scholar] [CrossRef]
- Robinson, L.; Tang, E.; Taylor, J.P. Dementia: Timely diagnosis and early intervention. Bmj 2015, 16, 350. [Google Scholar] [CrossRef]
- Tisher, A.; Salardini, A. A Comprehensive Update on Treatment of Dementia. In Seminars in Neurology; Thieme Medical Publishers: Stuttgart, Germany, 2019; Volume 39, pp. 167–178. [Google Scholar]
- Niedowicz, D.M.; Nelson, P.T.; Murphy, M.P. Alzheimer’s disease: Pathological mechanisms and recent insights. Curr. Neuropharmacol. 2011, 9, 674–684. [Google Scholar] [CrossRef]
- Kocahan, S.; Doan, Z. Mechanisms of Alzheimer’s disease pathogenesis and prevention: The brain, neural pathology, N-methyl-D- aspartate receptors, tau protein and other risk factors. Clin. Psychopharmacol. Neurosci. 2017, 15, 1–8. [Google Scholar] [CrossRef]
- Khan, Y.F.; Kaushik, B.; Chowdhary, C.L.; Srivastava, G. Ensemble model for diagnostic classification of Alzheimer’s disease based on brain anatomical magnetic resonance imaging. Diagnostics 2022, 12, 3193. [Google Scholar] [CrossRef]
- Doan, D.N.; Ku, B.; Choi, J.; Oh, M.; Kim, K.; Cha, W.; Kim, J.U. Predicting dementia with prefrontal electroencephalography and event-related potential. Front. Aging Neurosci. 2021, 13, 180. [Google Scholar] [CrossRef]
- Bin Jiao, B.; Li, R.; Zhou, H.; Qing, K.; Liu, H.; Pan, H.; Lei, Y.; Fu, W.; Wang, X.; Xiao, X.; et al. Neural biomarker diagnosis and prediction to mild cognitive impairment and Alzheimer’s disease using EEG technology. Alzheimer’s Res. Ther. 2023, 15, 32. [Google Scholar] [CrossRef]
- Rossini, P.M.; Buscema, M.; Capriotti, M.; Grossi, E.; Rodriguez, G.; Del Percio, C.; Babiloni, C. Is it possible to automatically distinguish resting EEG data of normal elderly vs. mild cognitive impairment subjects with high degree of accuracy? Clin. Neurophysiol. 2008, 119, 1534–1545. [Google Scholar] [CrossRef]
- Signorino, M.; Brizioli, E.; Amadio, L.; Belardinelli, N.; Pucci, E.; Angeleri, F. An EEG power index (eyes open vs. eyes closed) to differenziate Alzheimer’s from vascular dementia and healthy ageing. Arch. Gerontol. Geriatr. 1996, 22, 245–260. [Google Scholar] [CrossRef]
- Pucci, E.; Cacchiò, G.; Angeloni, R.; Belardinelli, N.; Nolfe, G.; Signorino, M.; Angeleri, F. EEG spectral analysis in Alzheimer’s disease and different degenerative dementias. Arch. Geront. Geriat. 1998, 26, 283–297. [Google Scholar] [CrossRef]
- Engedal, K.A.; Snaedal, J.C.; Hoegh, P.; Jelic, V.; Andersen, B.B.; Naik, M.; Wahlund, L.O.; Oeksengaard, A.R. Quantitative EEG applying the statistical pattern recognition method: A useful tool for dementia diagnostic workup. Dement. Geriatr. Cogn. Disord. 2015, 40, 1–12. [Google Scholar] [CrossRef]
- Meghdadi, A.H.; Stevanović Karić, M.; McConnell, M.; Rupp, G.; Richard, C.; Hamilton, J.; Hamilton, J.; Berka, C. Resting state EEG biomarkers of cognitive decline associated with Alzheimer’s disease and mild cognitive impairment. PLoS ONE 2021, 16, e0244180. [Google Scholar] [CrossRef]
- Trammell, J.P.; MacRae, P.G.; Davis, G.; Bergstedt, D.; Anderson, A.E. The relationship of cognitive performance and the theta-alpha power ratio is age-dependent: An EEG study of short term memory and reasoning during task and resting-state in healthy young and old adults. Front. Aging Neurosci. 2017, 9, 364. [Google Scholar] [CrossRef]
- Finnigan, S.; Robertson, I.H. Resting EEG theta power correlates with cognitive performance in healthy older adults. Psychophysiology 2011, 48, 1083–1087. [Google Scholar] [CrossRef]
- Jelic, V.; Shigeta, M.; Julin, P.; Almkvist, O.; Winblad, B.; Wahlund, L.O. Quantitative electroencephalography power and coherence in Alzheimer’s disease and mild cognitive impairment. Dement. Geriatr. Cogn. Disord. 1996, 7, 314–323. [Google Scholar] [CrossRef] [PubMed]
- Prichep, L.S.; John, E.R.; Ferris, S.H.; Reisberg, B.; Almas, M.; Alper, K.; Cancro, R. Quantitative EEG correlates of cognitive deterioration in the elderly. Neurobiol. Aging 1994, 15, 85–90. [Google Scholar] [CrossRef] [PubMed]
- Huang, C.; Wahlund, L.O.; Dierks, T.; Julin, P.; Winblad, B.; Jelic, V. Discrimination of Alzheimer’s disease and mild cognitive impairment by equivalent EEG sources: A cross-sectional and longitudinal study. Clin. Neurophysiol. 2000, 111, 1961–1967. [Google Scholar] [CrossRef] [PubMed]
- Jelic, V.; Johansson, S.E.; Almkvist, O.; Shigeta, M.; Julin, P.; Nordberg, A.; Winblad, B.; Wahlund, L.O. Quantitative electroencephalography in mild cognitive impairment: Longitudinal changes and possible prediction of Alzheimer’s disease. Neurobiol. Aging 2000, 21, 533–540. [Google Scholar] [CrossRef] [PubMed]
- Rossini, P.; Del Percio, C.; Pasqualetti, P.; Cassetta, E.; Binetti, G.; Forno, G.D.; Ferreri, F.; Frisoni, G.; Chiovenda, P.; Miniussi, C.; et al. Conversion from mild cognitive impairment to Alzheimer’s disease is predicted by sources and coherence of brain electroencephalography rhythms. Neuroscience 2006, 143, 793–803. [Google Scholar] [CrossRef]
- Claus, J.J.; Kwa, V.I.; Teunisse, S.; Walstra, G.J.; van Gool, W.A.; Koelman, J.H.T.; Bour, L.J.; de Visser, B.W.O. Slowing on quantitative spectral EEG is a marker for rate of subsequent cognitive and functional decline in early Alzheimer disease. Alzheimer Dis. Assoc. Disord. 1998, 12, 167–174. [Google Scholar] [CrossRef]
- Roth, M.T.Y.M.E.; Tym, E.; Mountjoy, C.Q.; Huppert, F.A.; Hendrie, H.; Verma, S.; Goddard, R. CAMDEX: A standardised instrument for the diagnosis of mental disorder in the elderly with special reference to the early detection of dementia. Br. J. Psychiatry 1986, 149, 698–709. [Google Scholar] [CrossRef]
- Astle, D.E.; Holmes, J.; Kievit, R.; Gathercole, S.E. Annual Research Review: The transdiagnostic revolution in neurodevelopmental disorders. J. Child Psychol. Psychiatry 2022, 63, 397–417. [Google Scholar] [CrossRef]
- Cuthbert, B.N.; Insel, T.R. Toward the future of psychiatric diagnosis: The seven pillars of RDoC. BMC Med. 2013, 11, 126. [Google Scholar] [CrossRef]
- Mendez, M.F.; Shapira, J.S.; McMurtray, A.; Licht, E.; Miller, B.L. Accuracy of the clinical evaluation for frontotemporal dementia. Arch. Neurol. 2007, 64, 830–835. [Google Scholar] [CrossRef]
- Leroy, M.; Bertoux, M.; Skrobala, E.; Mode, E.; Adnet-Bonte, C.; Le Ber, I.; Bombois, S.; Cassagnaud, P.; Chen, Y.; Deramecourt, V.; et al. Characteristics and progression of patients with frontotemporal dementia in a regional memory clinic network. Alzheimer’s Res. Therapy 2021, 13, 19. [Google Scholar] [CrossRef]
- Kertesz, A.; Davidson, W.; McCabe, P.; Munoz, D. Behavioral quantitation is more sensitive than cognitive testing in frontotemporal dementia. Alzheimer Dis. Assoc. Disord. 2003, 17, 223–229. [Google Scholar] [CrossRef]
- Ducharme, S.; Dols, A.; LaForce, R.; Devenney, E.; Kumfor, F.; Stock, J.V.D.; Dallaire-Théroux, C.; Seelaar, H.; Gossink, F.; Vijver-berg, E.; et al. Recommendations to distinguish behavioral variant frontotemporal dementia from psychiatric disorders. Brain 2020, 143, 1632–1650. [Google Scholar] [CrossRef]
- Ma, D.; Lu, D.; Popuri, K.; Wang, L.; Beg, M.F.; Alzheimer’s Disease Neuroimaging Initiative. Differential diagnosis of frontotemporal dementia, Alzheimer’s Disease, and normal aging using a multi-scale multi-type feature generative adversarial deep neural network on structural magnetic resonance images. Front. Neurosci. 2020, 14, 853. [Google Scholar] [CrossRef]
- Tombaugh, T.N.; McIntyre, N.J. The mini-mental state examination: A comprehensive review. J. Am. Geriatr. Soc. 1992, 40, 922–935. [Google Scholar] [CrossRef]
- Magni, E.; Binetti, G.; Bianchetti, A.; Rozzini, R.; Trabucchi, M. Mini-Mental State Examination: A normative study in Italian elderly population. Eur. J. Neurol. 1996, 3, 198–202. [Google Scholar] [CrossRef]
- Babcock, H.; Levy, L. Test and Manual of Directions; The Revised Examination for the Measurement of Efficiency of Mental Functioning; Stoelting: Wood Dale, IL, USA, 1940. [Google Scholar]
- Spinnler, H.; Tognoni, G. (Eds.) Standardizzazione e Taratura Italiana di Test Neuropsicologici. Ital. J. Neurol. Sci. 1987, 8 (Suppl. 6), 20–120. [Google Scholar]
- Giovagnoli, A.R.; Del Pesce, M.; Mascheroni, S.; Simoncelli, M.; Laiacona, M.; Capitani, E. Trail making test: Normative values from 287 normal adult controls. Ital. J. Neurol. Sci. 1996, 17, 305–309. [Google Scholar] [CrossRef]
- Caltagirone, C.; Gainotti, G.; Carlesimo, G.A.; Parnetti, L.; e il Gruppo per la standardizzazione della batteria per il deterioramento mentale. Batteria per la valutazione del deterioramento mentale (Parte I): Descrizione di uno strumento di diagnosi neuropsicologica. Arch. Psicol. Neurol. Psichiatr. 1995, 56, 461–470. [Google Scholar]
- Carlesimo, G.A.; Caltagirone, C.; Gainotti, G.; Nocentini, U.; e il Gruppo per la Standardizzazione della batteria per il deterioramento mentale. Batteria per la valutazione del deterioramento mentale (Parte II): Standardizzazione e affidabilità diagnostica nell’identificazione dei pazienti affetti da sindrome demenziale. Arch. Psicol. Neurol. Psichiatr. 1995, 56, 471–488. [Google Scholar]
- Carlesimo, G.A.; Caltagirone, C.; Gainotti, G.; Fadda, L.; Gallassi, R.; Lorusso, S.; Marfia, G.; Marra, C.; Nocentini, U.; Parnetti, L. The mental deterioration battery: Normative data, diagnostic reliability and qualitative analyses of cognitive impairment. Eur. Neurol. 1996, 36, 378–384. [Google Scholar] [CrossRef] [PubMed]
- Senhorini, M.C.; Amaro Júnior, E.; de Mello Ayres, A.; De Simone, A.; Busatto, G.F. Phonemic fluency in Portuguese-speaking subjects in Brazil: Ranking of letters. J. Clin. Exp. Neuropsychol. 2006, 28, 1191–1200. [Google Scholar] [CrossRef] [PubMed]
- Arrigoni, G.; De Renzi, E. Constructional apraxia and hemispheric locus of lesion. Cortex 1964, 1, 170–197. [Google Scholar] [CrossRef]
- Basso, A.; Capitani, E.; Laiacona, M. Raven’s Coloured Progressive Matrices: Normative values on 305 adult normal controls. Funct. Neurol. 1987, 2, 189–194. [Google Scholar]
- Faul, F.; Erdfelder, E.; Lang, A.G.; Buchner, A. G* Power 3: A flexible statistical power analysis program for the social, behavioral, and biomedical sciences. Behav. Res. Methods 2007, 39, 175–191. [Google Scholar] [CrossRef]
- Cohen, J. Statistical Power Analysis for the Behavioral Sciences; Rev. ed.; Academic Press: New York, NY, USA, 1977. [Google Scholar]
- Hair, J.R.; Anderson, R.E.; Tatham, R.L.; Black, W.C. Multivariate Data Analysis with Readings; Prentice Hall: Englewood Cliffs, NJ, USA, 1995. [Google Scholar]
- Bigné, J.E.; Andreu, L. Emotions in segmentation: An empirical study. Ann. Tour. Res. 2004, 31, 682–696. [Google Scholar] [CrossRef]
- Everitt, B.S. Cluster Analysis; Edward Arnold, University Press: Cambridge, UK, 1993. [Google Scholar]
- Bratchell, N. Cluster analysis. Chemom. Intell. Lab. Syst. 1989, 6, 105–125. [Google Scholar] [CrossRef]
- Petersen, R.C.; Doody, R.; Kurz, A.; Mohs, R.C.; Morris, J.C.; Rabins, P.V.; Ritchie, K.; Rossor, M.; Thal, L.; Winblad, B. Current concepts in mild cognitive impairment. Arch. Neurol. 2001, 58, 1985–1992. [Google Scholar] [CrossRef]
- Ritchie, K.; Touchon, J. Mild cognitive impairment: Conceptual basis and current nosological status. Lancet 2000, 355, 225–228. [Google Scholar] [CrossRef]
- Fingelkurts, A.A.; Fingelkurts, A.A. Quantitative electroencephalogram (qEEG) as a natural and non-invasive window into living brain and mind in the functional continuum of healthy and pathological conditions. Appl. Sci. 2022, 12, 9560. [Google Scholar] [CrossRef]
- Gerrits, B.; Vollebregt, M.A.; Olbrich, S.; van Dijk, H.; Palmer, D.; Gordon, E.; Pascual-Marqui, R.; Kessels, R.P.C.; Arns, M. Probing the “default network interference hypothesis” with EEG: An RDoC approach focused on attention. Clin. EEG Neurosci. 2019, 50, 404–412. [Google Scholar] [CrossRef]
- Jenkins, L.M.; Wang, L.; Rosen, H.; Weintraub, S. A transdiagnostic review of neuroimaging studies of apathy and disinhibition in dementia. Brain 2022, 145, 1886–1905. [Google Scholar] [CrossRef]


| AD Group N = 19 | FTD Group N = 7 | MCI Group N = 18 | Control Group N = 19 | Group Effect | Size Effect | |||||
|---|---|---|---|---|---|---|---|---|---|---|
| M | SD | M | SD | M | SD | M | SD | p | η2p | |
| Age | 68.9 | 7.5 | 68.3 | 8.0 | 65.7 | 8.2 | 70.4 | 5.9 | n.s. | 0.06 |
| Years of schooling | 8.5 | 3.5 | 9.1 | 4.4 | 8.7 | 4.1 | 8.0 | 3.5 | n.s. | 0.01 |
| Gender (M/F) | 7/12 | 5/2 | 12/6 | 11/8 | n.s. | |||||
| MMSE | 19.2 c | 3.1 | 22.5 b | 2.2 | 26.6 a | 2.0 | 26.3 a | 1.4 | <0.001 | 0.69 |
| Long-term memory | 0.6 b | 1.3 | 1.6 a | 1.4 | 2.1 a | 1.1 | 2.6 a | 1.1 | <0.001 | 0.33 |
| Short-term memory | 1.1 b | 1.4 | 1.0 b | 1.5 | 1.3 b | 1.1 | 2.7 a | 1.0 | <0.001 | 0.27 |
| Visual-spatial memory | 0.5 b | 0.7 | 1.1 a | 1.6 | 1.7 a | 1.1 | 2.0 a | 0.9 | <0.001 | 0.26 |
| Attention | 0.4 b | 0.9 | 1.0 b | 1.7 | 2.2 a | 1.6 | 2.5 a | 1.1 | <0.001 | 0.35 |
| Semantic verbal fluency | 0.5 b | 0.7 | 0.7 b | 0.7 | 1.9 a | 1.6 | 2.3 a | 1.0 | <0.001 | 0.32 |
| Phonemic verbal fluency | 0.6 b | 1.2 | 0.9 b | 1.6 | 2.4 a | 1.3 | 2.4 a | 0.7 | <0.001 | 0.36 |
| Constructional praxis | 0.1 c | 0.4 | 0.6 c | 0.8 | 1.9 b | 1.7 | 3.3 a | 1.2 | <0.001 | 0.56 |
| Fluid intelligence | 1.0 b | 0.6 | 1.5 a,b | 1.0 | 2.1 a | 1.2 | 2.7 a | 1.3 | <0.001 | 0.29 |
| Cluster | |||
|---|---|---|---|
| 1 | 2 | 3 | |
| Long-term memory | −0.871 | −0.049 | 0.674 |
| Short-term memory | −0.610 | −0.646 | 0.834 |
| Visual-spatial memory | −0.784 | 0.177 | 0.476 |
| Attention | −0.750 | −0.620 | 0.923 |
| Semantic verbal fluency | −0.644 | −0.368 | 0.695 |
| Phonemic verbal fluency | −0.802 | −0.345 | 0.798 |
| Constructional praxis | −0.790 | −0.511 | 0.888 |
| Fluid intelligence | −0.748 | −0.526 | 0.866 |
| EEG alpha bands | −0.677 | 0.563 | 0.168 |
| EEG beta bands | −0.425 | 0.215 | 0.187 |
| EEG delta bands | 0.580 | −0.572 | −0.090 |
| EEG theta bands | 0.789 | −0.301 | −0.407 |
| N | 20 | 16 | 27 |
| Cluster | M | SD | Df | F | p | η2p | |
|---|---|---|---|---|---|---|---|
| Long-term memory | 1 | −0.674 c | 0.769 | 2 | 23.883 | <0.001 * | 0.443 |
| 2 | −0.067 b | 0.893 | |||||
| 3 | 0.842 a | 0.639 | |||||
| Short-term memory | 1 | −0.548 b | 0.748 | 2 | 25.835 | <0.001 * | 0.463 |
| 2 | −0.395 b | 0.845 | |||||
| 3 | 0.918 a | 0.667 | |||||
| Visual-spatial memory | 1 | −0.575 b | 0.620 | 2 | 11.547 | <0.001 * | 0.278 |
| 2 | 0.082 a | 0.944 | |||||
| 3 | 0.623 a | 1.039 | |||||
| Attention | 1 | −0.763 c | 0.541 | 2 | 47.581 | <0.001 * | 0.613 |
| 2 | −0.160 b | 0.793 | |||||
| 3 | 1.011 a | 0.611 | |||||
| Semantic verbal fluency | 1 | −0.658 b | 0.576 | 2 | 22.258 | <0.001 * | 0.426 |
| 2 | −0.075 b | 0.741 | |||||
| 3 | 0.828 a | 0.967 | |||||
| Phonemic verbal fluency | 1 | −0.824 c | 0.629 | 2 | 32.428 | <0.001 * | 0.519 |
| 2 | 0.288 b | 0.958 | |||||
| 3 | 0.777 a | 0.579 | |||||
| Constructional praxis ¶ | 1 | −0.795 c | 0.284 | 2 | 81.560 | <0.001 * | 0.699 |
| 2 | −0.222 b | 0.760 | |||||
| 3 | 1.091 a | 0.637 | |||||
| Fluid intelligence ¶ | 1 | −0.702 c | 0.374 | 2 | 48.220 | <0.001 * | 0.679 |
| 2 | −0.403 b | 0.504 | |||||
| 3 | 1.105 a | 0.782 | |||||
| EEG alpha band | 1 | −0.402 | 0.789 | 2 | 4.014 | 0.023 | 0.118 |
| 2 | 0.366 | 1.004 | |||||
| 3 | 0.225 | 1.091 | |||||
| EEG beta band ¶ | 1 | −0.420 a | 0.671 | 2 | 6.956 | <0.001 * | 0.301 |
| 2 | 0.951 b | 1.328 | |||||
| 3 | −0.151 a | 0.593 | |||||
| EEG delta band | 1 | 0.350 | 0.951 | 2 | 5.276 | 0.008 | 0.150 |
| 2 | −0.636 | 0.633 | |||||
| 3 | 0.020 | 1.081 | |||||
| EEG theta band | 1 | 0.625 b | 0.996 | 2 | 12.092 | <0.001 * | 0.287 |
| 2 | −0.584 a | 0.494 | |||||
| 3 | −0.341 a | 0.872 |
Disclaimer/Publisher’s Note: The statements, opinions and data contained in all publications are solely those of the individual author(s) and contributor(s) and not of MDPI and/or the editor(s). MDPI and/or the editor(s) disclaim responsibility for any injury to people or property resulting from any ideas, methods, instructions or products referred to in the content. |
© 2023 by the authors. Licensee MDPI, Basel, Switzerland. This article is an open access article distributed under the terms and conditions of the Creative Commons Attribution (CC BY) license (https://creativecommons.org/licenses/by/4.0/).
Share and Cite
Tomasello, L.; Carlucci, L.; Laganà, A.; Galletta, S.; Marinelli, C.V.; Raffaele, M.; Zoccolotti, P. Neuropsychological Evaluation and Quantitative EEG in Patients with Frontotemporal Dementia, Alzheimer’s Disease, and Mild Cognitive Impairment. Brain Sci. 2023, 13, 930. https://doi.org/10.3390/brainsci13060930
Tomasello L, Carlucci L, Laganà A, Galletta S, Marinelli CV, Raffaele M, Zoccolotti P. Neuropsychological Evaluation and Quantitative EEG in Patients with Frontotemporal Dementia, Alzheimer’s Disease, and Mild Cognitive Impairment. Brain Sciences. 2023; 13(6):930. https://doi.org/10.3390/brainsci13060930
Chicago/Turabian StyleTomasello, Letteria, Leonardo Carlucci, Angelina Laganà, Santi Galletta, Chiara Valeria Marinelli, Massimo Raffaele, and Pierluigi Zoccolotti. 2023. "Neuropsychological Evaluation and Quantitative EEG in Patients with Frontotemporal Dementia, Alzheimer’s Disease, and Mild Cognitive Impairment" Brain Sciences 13, no. 6: 930. https://doi.org/10.3390/brainsci13060930
APA StyleTomasello, L., Carlucci, L., Laganà, A., Galletta, S., Marinelli, C. V., Raffaele, M., & Zoccolotti, P. (2023). Neuropsychological Evaluation and Quantitative EEG in Patients with Frontotemporal Dementia, Alzheimer’s Disease, and Mild Cognitive Impairment. Brain Sciences, 13(6), 930. https://doi.org/10.3390/brainsci13060930