
Pilot-RCT Finds No Evidence for Modulation of Neuronal Networks of Auditory Hallucinations by Transcranial Direct Current Stimulation
 , ,
, ,
Abstract
1. Introduction
2. Methods
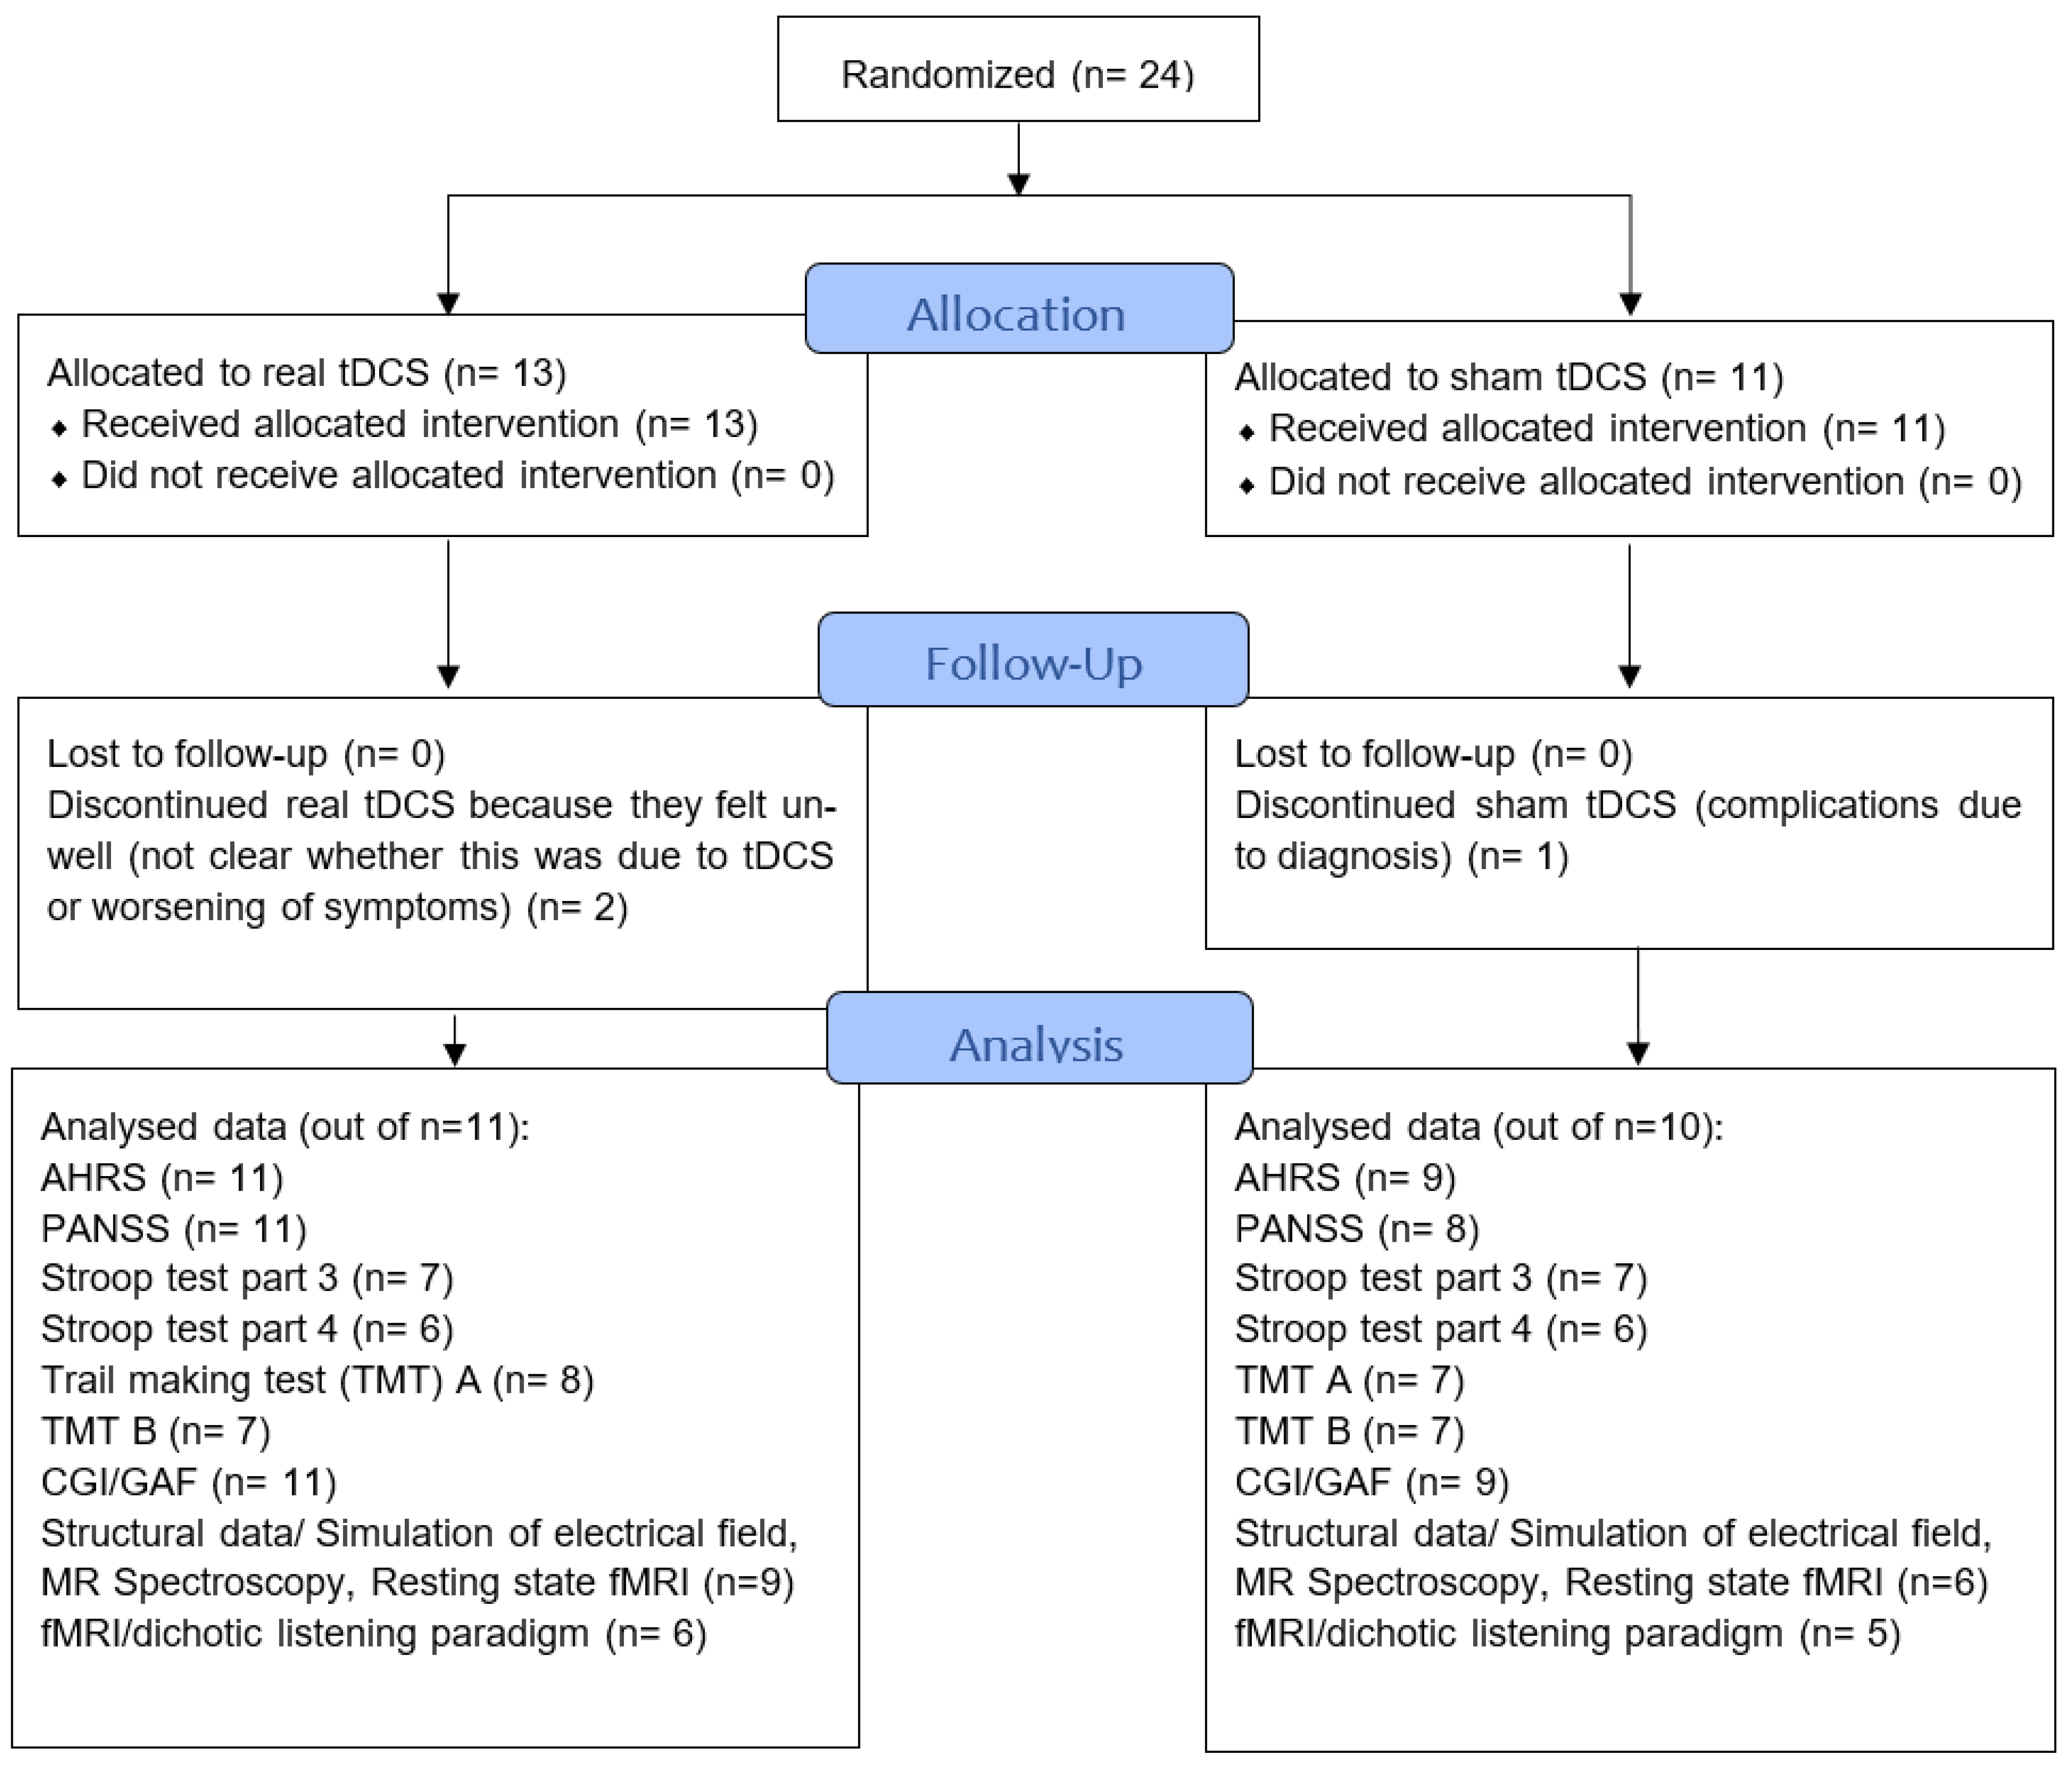
2.1. Participants
Blinding
2.2. tDCS Treatment
3. Procedure and Materials
3.1. Clinical Assessment
3.2. Neuroimaging
3.2.1. Structural Measures
3.2.2. MR Spectroscopy
3.2.3. Resting State fMRI
3.2.4. fMRI/Dichotic Listening Paradigm
3.2.5. Simulation of Electrical Field
3.2.6. Correlations
3.3. Neurocognitive/General Functioning
4. Results
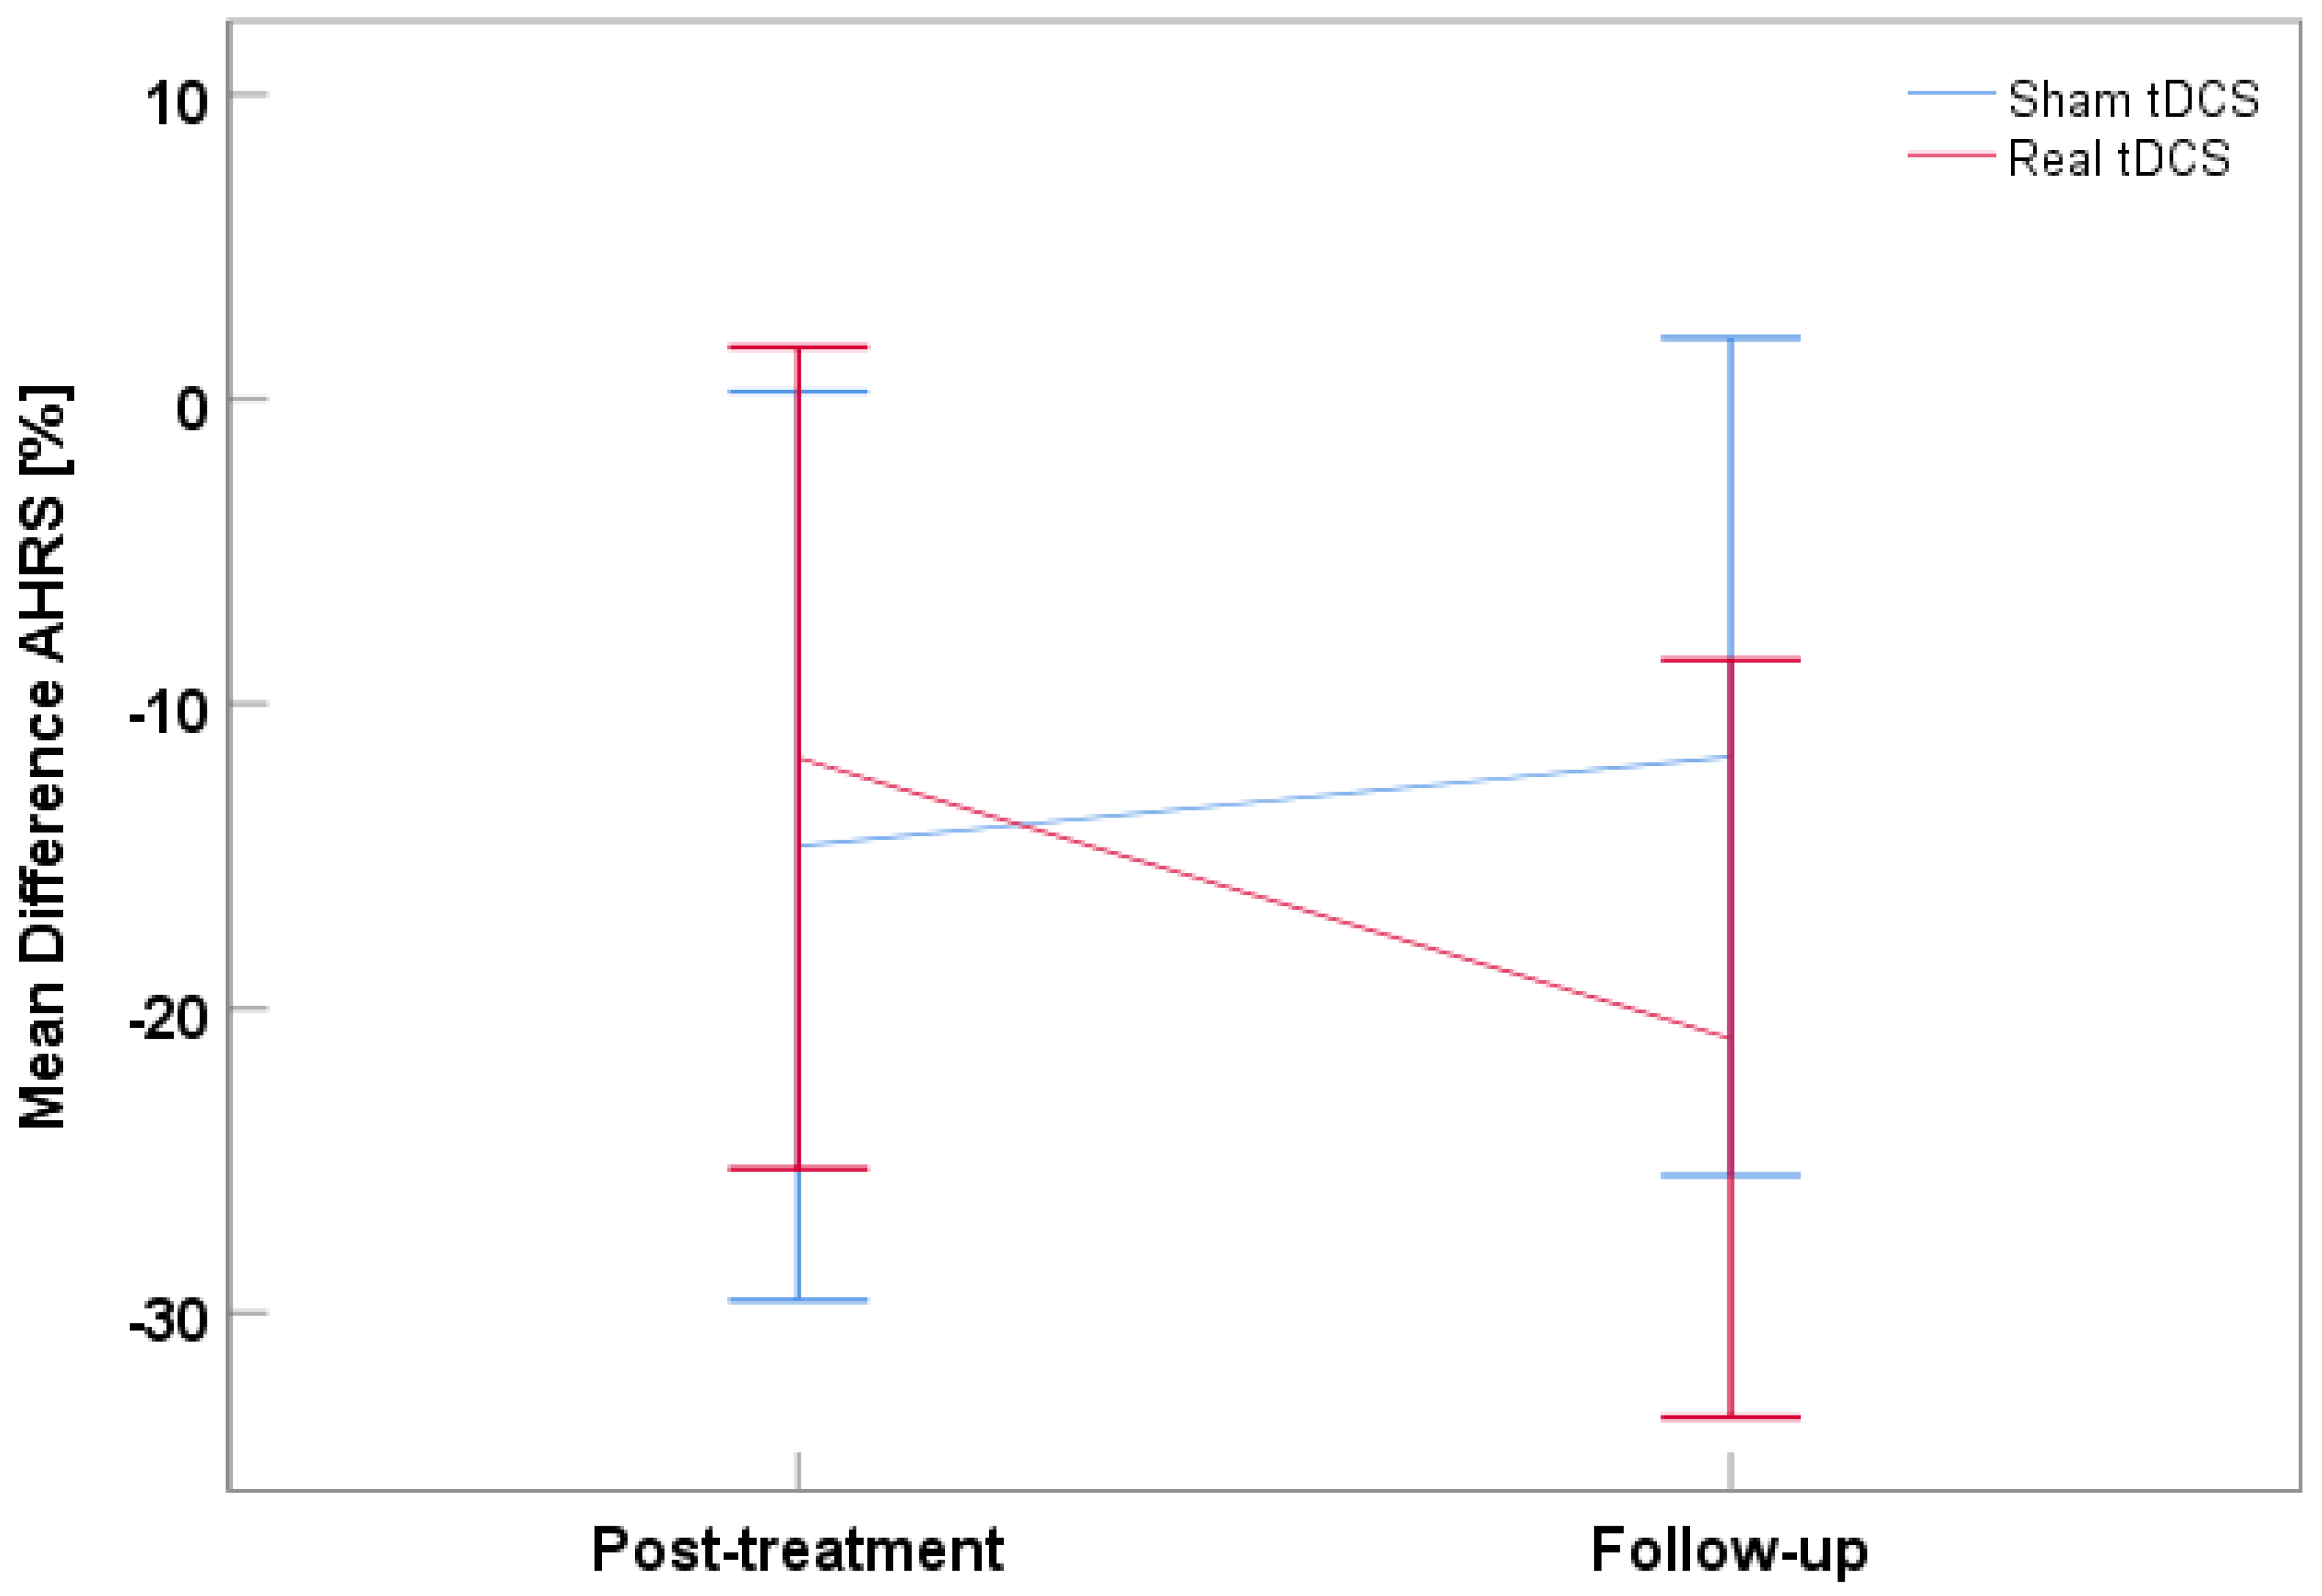
4.1. Clinical and Neurocognitive/General Functioning Assessment
4.2. Structural Analysis
4.3. MR Spectroscopy
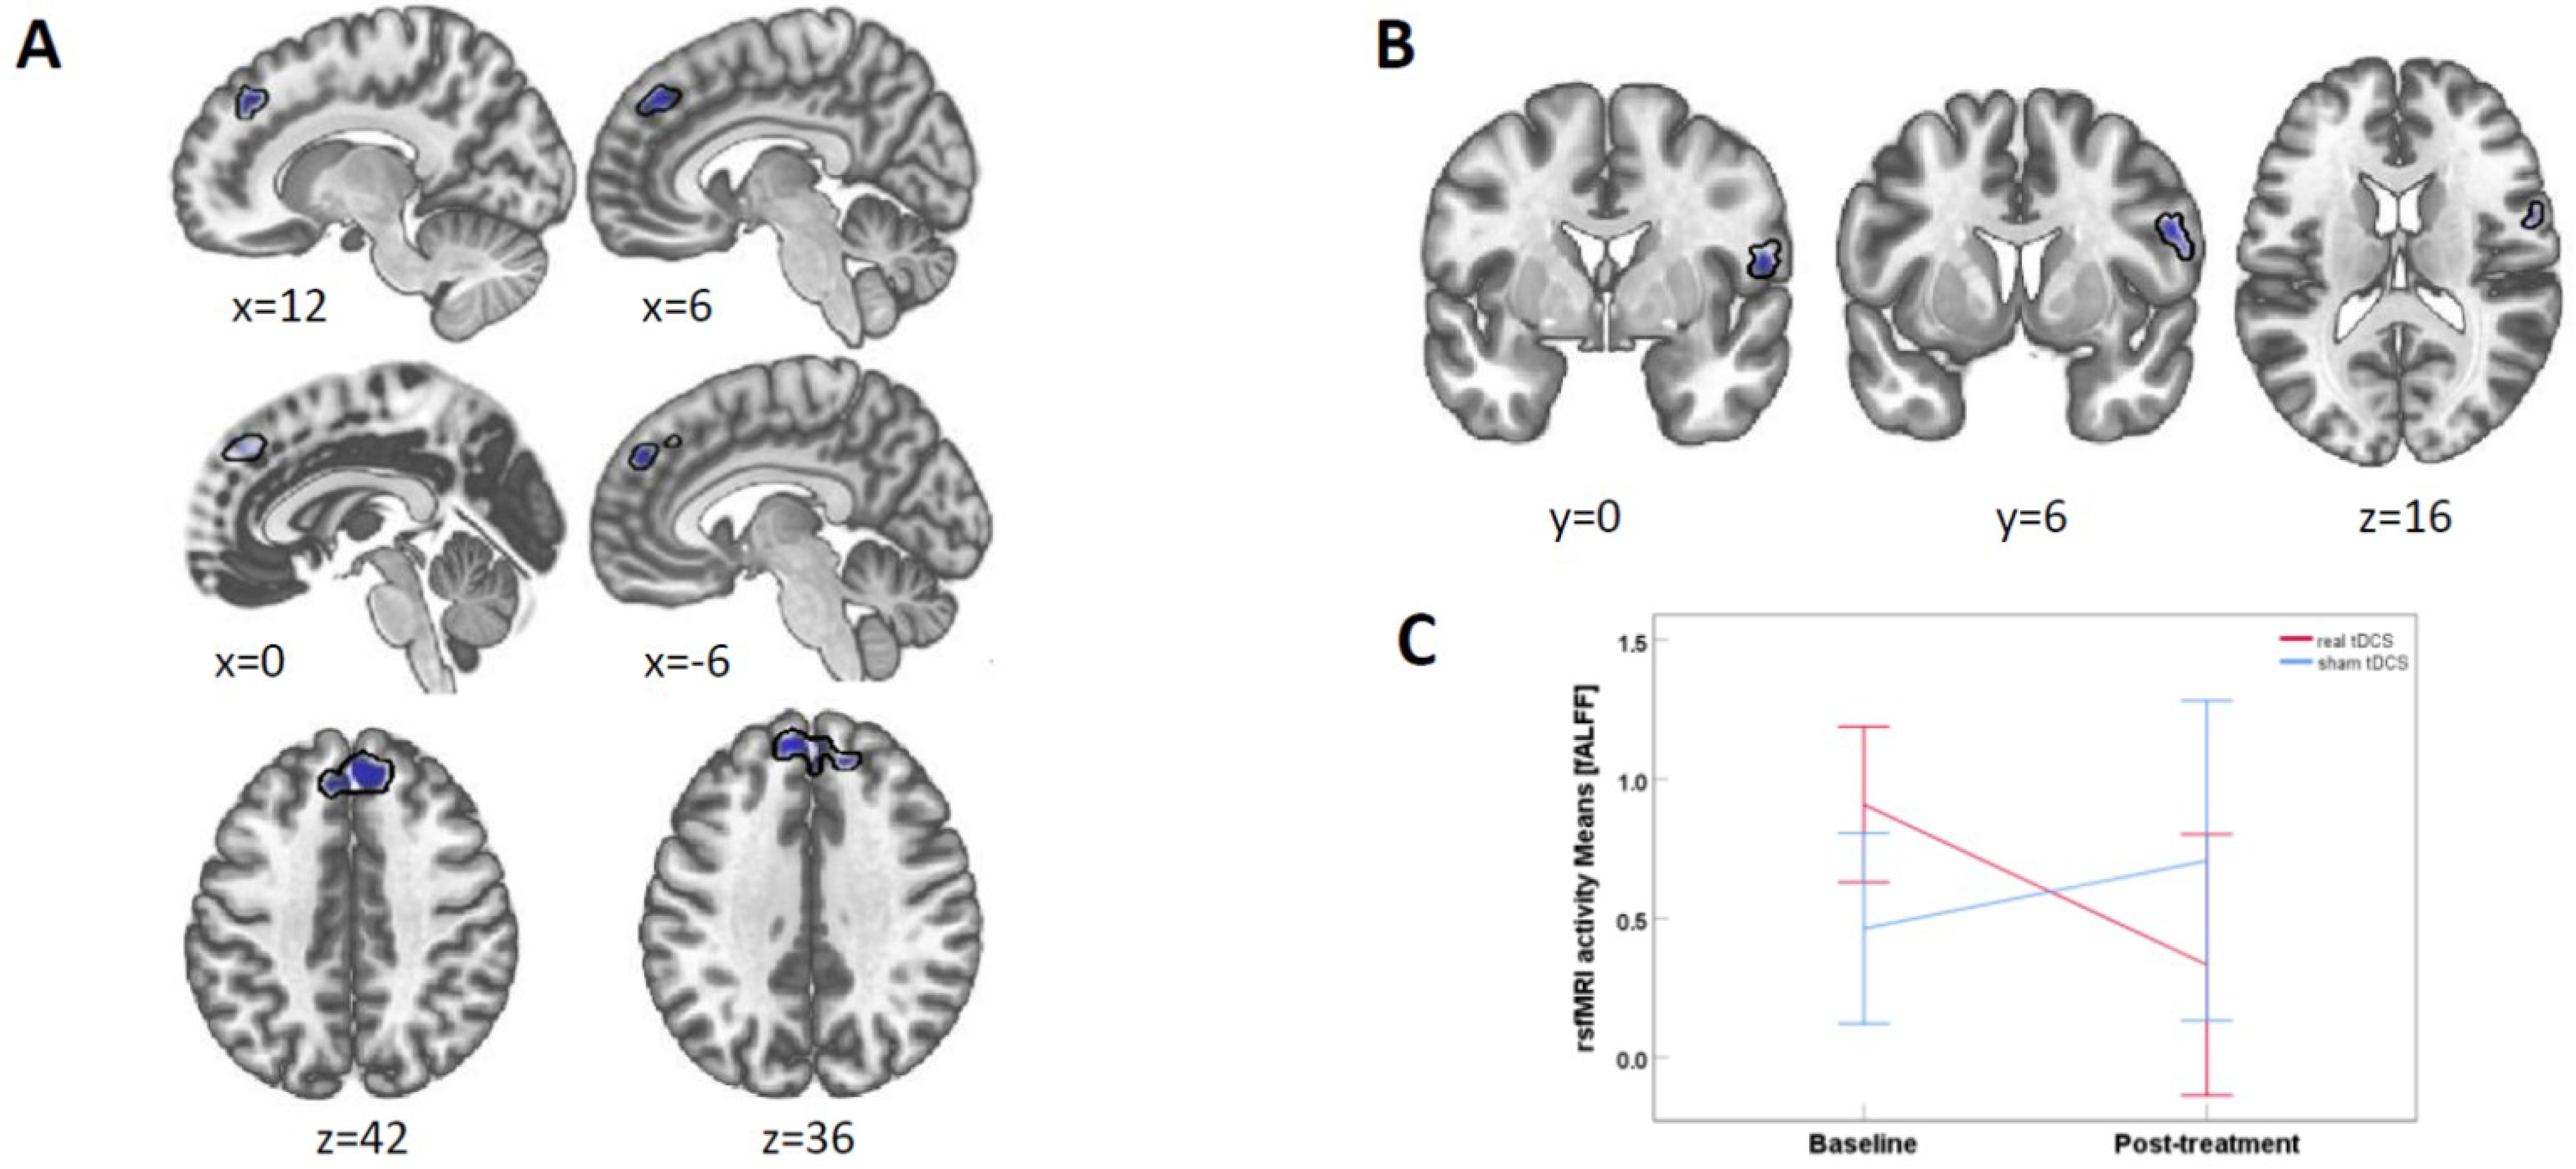
4.4. Resting State fMRI
4.5. fMRI/Dichotic Listening Paradigm
4.6. Simulation of Electrical Field
4.7. Correlations
5. Discussion
6. Limitations
7. Conclusions
Supplementary Materials
Author Contributions
Funding
Institutional Review Board Statement
Informed Consent Statement
Data Availability Statement
Acknowledgments
Conflicts of Interest
References
- Brunelin, J.; Mondino, M.; Gassab, L.; Haesebaert, F.; Gaha, L.; Suaud-Chagny, M.-F.; Saoud, M.; Mechri, A.; Poulet, E. Examining transcranial direct-current stimulation (tDCS) as a treatment for hallucinations in schizophrenia. Am. J. Psychiatry 2012, 169, 719–724. [Google Scholar] [CrossRef] [PubMed]
- Bose, A.; Shivakumar, V.; Agarwal, S.M.; Kalmady, S.V.; Shenoy, S.; Sreeraj, V.S.; Narayanaswamy, J.C.; Venkatasubramanian, G. Efficacy of fronto-temporal transcranial direct current stimulation for refractory auditory verbal hallucinations in schizophrenia: A randomized, double-blind, sham-controlled study. Schizophr. Res. 2017, 195, 475–480. [Google Scholar] [CrossRef]
- Mondino, M.; Haesebaert, F.; Poulet, E.; Suaud-Chagny, M.-F.; Brunelin, J. Fronto-temporal transcranial direct current stimulation (tDCS) reduces source-monitoring deficits and auditory hallucinations in patients with schizophrenia. Schizophr. Res. 2015, 161, 515–516. [Google Scholar] [CrossRef] [PubMed]
- Kantrowitz, J.T.; Sehatpour, P.; Avissar, M.; Horga, G.; Gwak, A.; Hoptman, M.J.; Beggel, O.; Girgis, R.R.; Vail, B.; Silipo, G. Significant improvement in treatment resistant auditory verbal hallucinations after 5 days of double-blind, randomized, sham controlled, fronto-temporal, transcranial direct current stimulation (tDCS): A replication/extension study. Brain Stimul. 2019, 12, 981–991. [Google Scholar] [CrossRef] [PubMed]
- Lindenmayer, J.; Kulsa, M.K.C.; Sultana, T.; Kaur, A.; Yang, R.; Ljuri, I.; Parker, B.; Khan, A. Transcranial direct-current stimulation in ultra-treatment-resistant schizophrenia. Brain Stimul. 2019, 12, 54–61. [Google Scholar] [CrossRef] [PubMed]
- Koops, S.; Blom, J.D.; Bouachmir, O.; Slot, M.I.; Neggers, B.; Sommer, I.E. Treating auditory hallucinations with transcranial direct current stimulation in a double-blind, randomized trial. Schizophr. Res. 2018, 201, 329–336. [Google Scholar] [CrossRef]
- Fröhlich, F.; Burrello, T.; Mellin, J.; Cordle, A.; Lustenberger, C.; Gilmore, J.; Jarskog, L. Exploratory study of once-daily transcranial direct current stimulation (tDCS) as a treatment for auditory hallucinations in schizophrenia. Eur. Psychiatry 2016, 33, 54–60. [Google Scholar] [CrossRef]
- Fitzgerald, P.B.; McQueen, S.; Daskalakis, Z.J.; Hoy, K.E. A negative pilot study of daily bimodal transcranial direct current stimulation in schizophrenia. Brain Stimul. 2014, 7, 813–816. [Google Scholar] [CrossRef]
- Palm, U.; Keeser, D.; Hasan, A.; Kupka, M.J.; Blautzik, J.; Sarubin, N.; Kaymakanova, F.; Unger, I.; Falkai, P.; Meindl, T.; et al. Prefrontal Transcranial Direct Current Stimulation for Treatment of Schizophrenia With Predominant Negative Symptoms: A Double-Blind, Sham-Controlled Proof-of-Concept Study. Schizophr. Bull. 2016, 42, 1253–1261. [Google Scholar] [CrossRef]
- Gomes, J.S.; Shiozawa, P.; Dias, Á.M.; Ducos, D.V.; Akiba, H.; Trevizol, A.P.; Bikson, M.; Aboseria, M.; Gadelha, A.; de Lacerda, A.L.T. Left dorsolateral prefrontal cortex anodal tDCS effects on negative symptoms in schizophrenia. Brain Stimul. Basic Transl. Clin. Res. Neuromodul. 2015, 8, 989–991. [Google Scholar] [CrossRef]
- Chang, C.-C.; Tzeng, N.-S.; Chao, C.-Y.; Yeh, C.-B.; Chang, H.-A. The effects of add-on fronto-temporal transcranial direct current stimulation (tDCS) on auditory verbal hallucinations, other psychopathological symptoms and insight in schizophrenia: A randomized, double-blind, sham-controlled trial. Int. J. Neuropsychopharmacol. 2018, 21, 979–987. [Google Scholar] [CrossRef] [PubMed]
- Smith, R.C.; Boules, S.; Mattiuz, S.; Youssef, M.; Tobe, R.H.; Sershen, H.; Lajtha, A.; Nolan, K.; Amiaz, R.; Davis, J.M. Effects of transcranial direct current stimulation (tDCS) on cognition, symptoms, and smoking in schizophrenia: A randomized controlled study. Schizophr. Res. 2015, 168, 260–266. [Google Scholar] [CrossRef]
- da Costa Lane Valiengo, L.; Goerigk, S.; Gordon, P.C.; Padberg, F.; Serpa, M.H.; Koebe, S.; dos Santos, L.A.; Lovera, R.A.M.; de Carvalho, J.B.; van de Bilt, M. Efficacy and Safety of Transcranial Direct Current Stimulation for Treating Negative Symptoms in Schizophrenia: A Randomized Clinical Trial. JAMA Psychiatry 2019, 77, 121–129. [Google Scholar] [CrossRef] [PubMed]
- Hasan, A.; Strube, W.; Palm, U.; Wobrock, T. Repetitive noninvasive brain stimulation to modulate cognitive functions in schizophrenia: A systematic review of primary and secondary outcomes. Schizophr. Bull. 2016, 42 (Suppl. S1), S95–S109. [Google Scholar] [CrossRef] [PubMed]
- Pondé, P.H.; De Sena, E.P.; Camprodon, J.A.; de Araujo, A.N.; Neto, M.F.; DiBiasi, M.; Baptista, A.F.; Moura, L.M.; Cosmo, C. Use of transcranial direct current stimulation for the treatment of auditory hallucinations of schizophrenia–a systematic review. Neuropsychiatr. Dis. Treat. 2017, 13, 347. [Google Scholar] [CrossRef]
- Kubera, K.M.; Barth, A.; Hirjak, D.; Thomann, P.A.; Wolf, R.C. Noninvasive brain stimulation for the treatment of auditory verbal hallucinations in schizophrenia: Methods, effects and challenges. Front. Syst. Neurosci. 2015, 9, 131. [Google Scholar] [CrossRef]
- Mondino, M.; Sauvanaud, F.; Brunelin, J. A review of the effects of transcranial direct current stimulation for the treatment of hallucinations in patients with schizophrenia. J. ECT 2018, 34, 164–171. [Google Scholar] [CrossRef]
- Nieuwdorp, W.; Koops, S.; Somers, M.; Sommer, I.E. Transcranial magnetic stimulation, transcranial direct current stimulation and electroconvulsive therapy for medication-resistant psychosis of schizophrenia. Curr. Opin. Psychiatry 2015, 28, 222–228. [Google Scholar]
- Nathou, C.; Etard, O.; Dollfus, S. Auditory verbal hallucinations in schizophrenia: Current perspectives in brain stimulation treatments. Neuropsychiatr. Dis. Treat. 2019, 15, 2105. [Google Scholar] [CrossRef]
- Hugdahl, K. “Hearing voices”: Auditory hallucinations as failure of top-down control of bottom-up perceptual processes. Scand. J. Psychol. 2009, 50, 553–560. [Google Scholar]
- Hugdahl, K. Auditory hallucinations: A review of the ERC “VOICE” project. World J. Psychiatry 2015, 5, 193. [Google Scholar] [CrossRef] [PubMed]
- Lefaucheur, J.-P.; Aleman, A.; Baeken, C.; Benninger, D.H.; Brunelin, J.; Di Lazzaro, V.; Filipović, S.R.; Grefkes, C.; Hasan, A.; Hummel, F.C.; et al. Evidence-based guidelines on the therapeutic use of repetitive transcranial magnetic stimulation (rTMS): An update (2014–2018). Clin. Neurophysiol. 2020, 131, 474–528. [Google Scholar] [CrossRef] [PubMed]
- Mondino, M.; Fonteneau, C.; Simon, L.; Dondé, C.; Haesebaert, F.; Poulet, E.; Brunelin, J. Advancing clinical response characterization to frontotemporal transcranial direct current stimulation with electric field distribution in patients with schizophrenia and auditory hallucinations: A pilot study. Eur. Arch. Psychiatry Clin. Neurosci. 2020, 271, 85–92. [Google Scholar] [CrossRef] [PubMed]
- Marquardt, L.; Kusztrits, I.; Craven, A.R.; Hugdahl, K.; Specht, K.; Hirnstein, M. A multimodal study of the effects of tDCS on dorsolateral prefrontal and temporo-parietal areas during dichotic listening. Eur. J. Neurosci. 2020, 53, 449–459. [Google Scholar] [CrossRef] [PubMed]
- Samani, M.M.; Agboada, D.; Jamil, A.; Kuo, M.-F.; Nitsche, M.A. Titrating the neuroplastic effects of cathodal transcranial direct current stimulation (tDCS) over the primary motor cortex. Cortex 2019, 119, 350–361. [Google Scholar] [CrossRef]
- Mondino, M.; Jardri, R.; Suaud-Chagny, M.-F.; Saoud, M.; Poulet, E.; Brunelin, J. Effects of fronto-temporal transcranial direct current stimulation on auditory verbal hallucinations and resting-state functional connectivity of the left temporo-parietal junction in patients with schizophrenia. Schizophr. Bull. 2015, 42, 318–326. [Google Scholar] [CrossRef]
- Hoy, K.E.; Bailey, N.W.; Arnold, S.L.; Fitzgerald, P.B. The effect of transcranial Direct Current Stimulation on gamma activity and working memory in schizophrenia. Psychiatry Res. 2015, 228, 191–196. [Google Scholar] [CrossRef]
- Hunter, M.A.; Coffman, B.; Trumbo, M.; Clark, V. Tracking the neuroplastic changes associated with transcranial direct current stimulation: A push for multimodal imaging. Front. Hum. Neurosci. 2013, 7, 495. [Google Scholar]
- World Health Organization. International Statistical Classification of Diseases and Related Health Problems, 10th ed.; World Health Organization: Geneva, Switzerland, 2004; Volume 1. [Google Scholar]
- Van de Willige, G.; Jenner, J.; Wiersma, D. Effectiveness of HIT for Patients with Persistent Auditory Hallucinations; University of Groningen: Groningen, The Netherlands, 1996. [Google Scholar]
- Hoffman, R.E.; Hawkins, K.A.; Gueorguieva, R.; Boutros, N.N.; Rachid, F.; Carroll, K.; Krystal, J.H. Transcranial Magnetic Stimulation of Left Temporoparietal Cortex and Medication-Resistant Auditory Hallucinations. Arch. Gen. Psychiatry 2003, 60, 49–56. [Google Scholar] [CrossRef]
- Kay, S.R.; Fiszbein, A.; Opler, L.A. The Positive and Negative Syndrome Scale (PANSS) for Schizophrenia. Schizophr. Bull. 1987, 13, 261–276. [Google Scholar] [CrossRef]
- Rossell, S.L.; Schutte, M.J.; Toh, W.L.; Thomas, N.; Strauss, C.; Linszen, M.M.; van Dellen, E.; Heringa, S.M.; Teunisse, R.; Slotema, C.W. The questionnaire for psychotic experiences: An examination of the validity and reliability. Schizophr. Bull. 2019, 45 (Suppl. S1), S78–S87. [Google Scholar] [CrossRef]
- Sommer, I.E.; Kleijer, H.; Hugdahl, K. Toward personalized treatment of hallucinations. Curr. Opin. Psychiatry 2018, 31, 237–245. [Google Scholar] [CrossRef] [PubMed]
- Destrieux, C.; Fischl, B.; Dale, A.; Halgren, E. Automatic parcellation of human cortical gyri and sulci using standard anatomical nomenclature. Neuroimage 2010, 53, 1–15. [Google Scholar] [CrossRef] [PubMed]
- Hjelmervik, H.; Craven, A.R.; Sinceviciute, I.; Johnsen, E.; Kompus, K.; Bless, J.J.; Kroken, R.A.; Løberg, E.-M.; Ersland, L.; Grüner, R.; et al. Intra-Regional Glu-GABA vs Inter-Regional Glu-Glu Imbalance: A 1H-MRS Study of the Neurochemistry of Auditory Verbal Hallucinations in Schizophrenia. Schizophr. Bull. 2019, 46, 633–642. [Google Scholar] [CrossRef] [PubMed]
- Gasparovic, C.; Song, T.; Devier, D.; Bockholt, H.J.; Caprihan, A.; Mullins, P.G.; Posse, S.; Jung, R.E.; Morrison, L.A. Use of tissue water as a concentration reference for proton spectroscopic imaging. Magn. Reson. Med. 2006, 55, 1219–1226. [Google Scholar] [CrossRef]
- Lv, H.; Wang, Z.; Tong, E.; Williams, L.M.; Zaharchuk, G.; Zeineh, M.; Goldstein-Piekarski, A.N.; Ball, T.M.; Liao, C.; Wintermark, M. Resting-State Functional MRI: Everything That Nonexperts Have Always Wanted to Know. Am. J. Neuroradiol. 2018, 39, 1390–1399. [Google Scholar] [CrossRef]
- Zou, Q.-H.; Zhu, C.-Z.; Yang, Y.; Zuo, X.-N.; Long, X.-Y.; Cao, Q.-J.; Wang, Y.-F.; Zang, Y.-F. An improved approach to detection of amplitude of low-frequency fluctuation (ALFF) for resting-state fMRI: Fractional ALFF. J. Neurosci. Methods 2008, 172, 137–141. [Google Scholar] [CrossRef]
- Yu-Feng, Z.; Yong, H.; Chao-Zhe, Z.; Qing-Jiu, C.; Man-Qiu, S.; Meng, L.; Li-Xia, T.; Tian-Zi, J.; Yu-Feng, W. Altered baseline brain activity in children with ADHD revealed by resting-state functional MRI. Brain Dev. 2007, 29, 83–91. [Google Scholar] [CrossRef]
- Kiviniemi, V.; Jauhiainen, J.; Tervonen, O.; Pääkkö, E.; Oikarinen, J.; Vainionpää, V.; Rantala, H.; Biswal, B. Slow vasomotor fluctuation in fMRI of anesthetized child brain. Magn. Reson. Med. Off. J. Int. Soc. Magn. Reson. Med. 2000, 44, 373–378. [Google Scholar] [CrossRef]
- Fransson, P. How default is the default mode of brain function?: Further evidence from intrinsic BOLD signal fluctuations. Neuropsychologia 2006, 44, 2836–2845. [Google Scholar] [CrossRef]
- Hugdahl, K.; Westerhausen, R.; Alho, K.; Medvedev, S.; Laine, M.; HÄMÄLÄINEN, H. Attention and cognitive control: Unfolding the dichotic listening story. Scand. J. Psychol. 2009, 50, 11–22. [Google Scholar] [CrossRef] [PubMed]
- Westerhausen, R.; Kompus, K.; Hugdahl, K. Mapping hemispheric symmetries, relative asymmetries, and absolute asymmetries underlying the auditory laterality effect. Neuroimage 2014, 84, 962–970. [Google Scholar] [CrossRef] [PubMed]
- van den Noort, M.; Specht, K.; Rimol, L.M.; Ersland, L.; Hugdahl, K. A new verbal reports fMRI dichotic listening paradigm for studies of hemispheric asymmetry. Neuroimage 2008, 40, 902–911. [Google Scholar] [CrossRef] [PubMed]
- Hugdahl, K.; Løberg, E.-M.; Jørgensen, H.A.; Lundervold, A.; Lund, A.; Green, M.F.; Rund, B. Left hemisphere lateralisation of auditory hallucinations in schizophrenia: A dichotic listening study. Cogn. Neuropsychiatry 2008, 13, 166–179. [Google Scholar] [CrossRef] [PubMed]
- Ocklenburg, S.; Westerhausen, R.; Hirnstein, M.; Hugdahl, K. Auditory hallucinations and reduced language lateralization in schizophrenia: A meta-analysis of dichotic listening studies. J. Int. Neuropsychol. Soc. 2013, 19, 410–418. [Google Scholar] [CrossRef] [PubMed]
- Collinson, S.L.; Mackay, C.E.; Jiaqing, O.; James, A.C.; Crow, T.J. Dichotic listening impairments in early onset schizophrenia are associated with reduced left temporal lobe volume. Schizophr. Res. 2009, 112, 24–31. [Google Scholar] [CrossRef]
- Saturnino, G.B.; Puonti, O.; Nielsen, J.D.; Antonenko, D.; Madsen, K.H.H.; Thielscher, A. SimNIBS 2.1: A Comprehensive Pipeline for Individualized Electric Field Modelling for Transcranial Brain Stimulation. bioRxiv 2018. [Google Scholar] [CrossRef]
- Thielscher, A.; Antunes, A.; Saturnino, G.B. Field modeling for transcranial magnetic stimulation: A useful tool to understand the physiological effects of TMS? In Proceedings of the 2015 37th annual international conference of the IEEE engineering in medicine and biology society (EMBC), Milan, Italy, 25–29 August 2015. [Google Scholar]
- Guy, W. ECDEU Assessment Manual for Psychopharmacology; US Department of Health, Education, and Welfare, Public Health Service: Washington, DC, USA, 1976.
- Hall, R.C. Global assessment of functioning. A modified scale. Psychosomatics 1995, 36, 267–275. [Google Scholar] [CrossRef]
- Reitan, R.M.; Wolfson, D. The Halstead-Reitan Neuropsychological Test Battery: Theory and Clinical Interpretation; Reitan Neuropsychology; Springer: Boston, MA, USA, 1985; Volume 4. [Google Scholar]
- Sundet, K.; Vaskinn, A. Estimating premorbid IQ (in Norwegian with English abstract). J. Nor. Psychol. Assoc. 2008, 45, 1108–1115. [Google Scholar]
- Nelson, H.E.; Willison, J. National Adult Reading Test (NART); Nfer-Nelson Windsor: Windsor, UK, 1991. [Google Scholar]
- Aickin, M.; Gensler, H. Adjusting for multiple testing when reporting research results: The Bonferroni vs Holm methods. Am. J. Public Health 1996, 86, 726–728. [Google Scholar] [CrossRef]
- Modinos, G.; Costafreda, S.G.; van Tol, M.J.; McGuire, P.K.; Aleman, A.; Allen, P. Neuroanatomy of auditory verbal hallucinations in schizophrenia: A quantitative meta-analysis of voxel-based morphometry studies. Cortex 2013, 49, 1046–1055. [Google Scholar] [CrossRef] [PubMed]
- Bohlken, M.M.; Hugdahl, K.; Sommer, I.E.C. Auditory verbal hallucinations: Neuroimaging and treatment. Psychol. Med. 2017, 47, 199–208. [Google Scholar] [CrossRef] [PubMed]
- Upthegrove, R.; Broome, M.R.; Caldwell, K.; Ives, J.; Oyebode, F.; Wood, S.J. Understanding auditory verbal hallucinations: A systematic review of current evidence. Acta Psychiatr. Scand. 2016, 133, 352–367. [Google Scholar] [CrossRef] [PubMed]
- Falkenberg, L.E.; Specht, K.; Westerhausen, R. Attention and cognitive control networks assessed in a dichotic listening fMRI study. Brain Cogn. 2011, 76, 276–285. [Google Scholar] [CrossRef]
- Hugdahl, K.; Craven, A.R.; Nygård, M.; Løberg, E.-M.; Berle, J.Ø.; Johnsen, E.; Kroken, R.; Specht, K.; Andreassen, O.A.; Ersland, L. Glutamate as a mediating transmitter for auditory hallucinations in schizophrenia: A 1 H MRS study. Schizophr. Res. 2015, 161, 252–260. [Google Scholar] [CrossRef]
- Dwyer, G.E.; Craven, A.; Hirnstein, M.; Kompus, K.; Assmus, J.; Ersland, L.; Hugdahl, K.; Grüner, R. No effects of anodal tDCS on local GABA and Glx levels in the left posterior superior temporal gyrus. Front. Neurol. 2019, 9, 1145. [Google Scholar] [CrossRef]
- Faul, F.; Erdfelder, E.; Buchner, A.; Lang, A.-G. Statistical power analyses using G* Power 3.1: Tests for correlation and regression analyses. Behav. Res. Methods 2009, 41, 1149–1160. [Google Scholar] [CrossRef]
- Cohen, J. Statistical Power Analysis for the Behavioral Sciences, 2nd ed.; Routledge: London, UK, 2013; Available online: http://site.ebrary.com/lib/bergen/docDetail.action?docID=10713862 (accessed on 14 September 2022).


| tDCS | Sham tDCS | Statistics | |
|---|---|---|---|
| n = 11 | n = 10 | ||
| Age in years (range, M(SD)) | 22–68, 38 (13) | 19–47, 33 (10) | t19 = 0.927, n.s. |
| Gender (male/female) | 8/3 | 6/4 | χ² = 0.382, n.s. |
| Handedness (right/left) | 10/1 | 8/2 | χ² = 0.509, n.s. |
| Education in years (range, M(SD)) | 8–18, 12 (3) | 9–15, 11 (2) | t19 = 0.496, n.s |
| Defined Daily Dosage (M(SD)) 1 | 1.86 (0.98) | 0.99 (1.3) | t19 = 1.727, n.s. |
| Duration of illness (in years M(SD)) | 10 (5) | 14 (10) | t18 = 0.953, n.s. |
| Treatment expectation | 6.8 | 6 | t19 = 0.766, n.s. |
| Nicotine users (total n) | 8 | 8 | χ² = 0.153, n.s. |
| Blinding patient (correct/incorrect) | 8/3 | 5/5 | χ² = 1.147, n.s. |
| Blinding researcher (correct/incorrect) | 5/6 | 7/3 | χ²=1.289, n.s. |
| PANSS score total sum M(SD) | 76 (25) | 69 (14) | t19 = 0.770, n.s. |
| AHRS score M(SD) | 30(5) | 24(4) | t19 = 2.83, p = 0.010 |
| NART (total errors, M(SD)) | 24 (14) | 20 (7) | t14 = 0.619, n.s. |
| Diagnosis 2 | |||
| Paranoid Schizophrenia | 8 | 5 | |
| Other schizophrenia types | 2 | ||
| Unspecific nonorganic psychosis | 2 | ||
| Schizoaffective disorder, depressive type | 1 | ||
| Paranoid personality disorder | 1 | ||
| Persistent delusional disorders | 1 | ||
| Recurrent Depressive disorder | 1 | ||
| Antipsychotic medication 2 | |||
| First-generation | 1 | ||
| Second-generation | 7 | 6 | |
| Both | 3 | ||
| None | 4 |
| Randomized Control Trial | |||||
|---|---|---|---|---|---|
| Pre-Study Assessment | Day 1 Baseline | Day 2 to 5 | Day 6 Post-Treatment | 3 Months Follow-Up | |
| tDCS treatment | 2× daily 20 min of 2 mA tDCS | 2× 20 min 2 mA tDCS | |||
| Clinical examination | tDCS check-list, screening questionnaire, medication | Hearing test | Adverse Effects Questionnaire | Adverse Effects Questionnaire | |
| Hallucination assessment | AHRS, QPE, PANSS | AHRS, QPE, PANSS, AHCS | AHRS, QPE, PANSS | ||
| Neuroimaging | Session 1: structural MRI, MR spectroscopy, Resting state fMRI, dichotic listening fMRI, ASL. | Session 2: structural MRI, MR spectroscopy, Resting state fMRI, dichotic listening fMRI, ASL. | Session 3: structural MRI, MR spectroscopy, Resting state fMRI, dichotic listening fMRI, ASL. | ||
| General functioning and neurocognitive abilities | Pre-study Questionnaire, Informed consent | AES, NART, CGI, GAF, Stroop, TMT, General Information Questionnaire, Expectations Questionnaire | AES, CGI, GAF, Stroop, TMT | AES, CGI, GAF, Stroop, TMT, Blinding Check Questionnaire | |
| Test (Score Range/Unit) | Baseline | Post-Treatment | Follow-Up | rmANCOVA Results | |||
|---|---|---|---|---|---|---|---|
| Real | Sham | Real | Sham | Real | Sham | ||
| PANSS negative sum (7–49) | 22 | 16 | 22 | 15 | 22 | 17 | all F(2,32)s ≤ 2.37, ps ≥ 0.110, ηp2s ≤ 0.129 |
| PANSS positive sum (7–49) | 18 | 19 | 18 | 15 | 18 | 18 | all F(2,32)s ≤ 1.42, ps ≥ 0.257, ηp2s ≤ 0.081 |
| PANSS P3 (1–7) | 5.0 | 4.8 | 4.6 | 4.3 | 4.7 | 4.5 | all F(2,32)s ≤ 0.48, ps ≥ 0.624, ηp2s ≤ 0.029 |
| PANSS general sum (30–210) | 36 | 33 | 35 | 34 | 35 | 33 | all F(2,32)s ≤ 0.80, ps ≥ 0.461, ηp2s ≤ 0.047 |
| AHRS total sum (2–41) | 30 | 24 | 27 | 21 | 24 | 22 | |
| AES total sum (18–72) | 48 | 46 | 52 | 41 | 52 | 48 | all F(2,34)s ≤ 1.82, ps ≥ 0.178, ηp2s ≤ 0.096 |
| CGI (0–7) | 4.91 | 4.56 | 5.00 | 4.44 | 4.91 | 4.44 | all F(2,34)s ≤ 0.26, ps ≥ 0.774, ηp2s ≤ 0.015 |
| GAF-S (0–100) | 43 | 46 | 43 | 45 | 43 | 44 | all F(2,34)s ≤ 0.35, ps ≥ 0.706, ηp2s ≤ 0.020 |
| GAF-F (0–100) | 45 | 48 | 45 | 48 | 44 | 49 | all F(2,34)s ≤ 0.65, ps ≥ 0.531, ηp2s ≤ 0.037 |
| Stroop 3 (in s) | 73 | 77 | 66 | 63 | 80 | 69 | all F(2,22)s ≤ 0.60, ps ≥ 0.556, ηp2s ≤ 0.052 |
| Stroop 3 mistakes (nr. Of errors) | 1.43 | 1.14 | 1.43 | 1.86 | 1.14 | 1.57 | all F(2,22)s ≤ 1.05, ps ≥ 0.368, ηp2s ≤ 0.087 |
| Stroop 4 (in s) | 81 | 81 | 67 | 74 | 81 | 75 | all F(2,18)s ≤ 0.99, ps ≥ 0.392, ηp2s ≤ 0.099 |
| Stroop 4 mistakes (nr. Of errors) | 2.33 | 2.43 | 2.00 | 2.29 | 4.00 | 1.86 | all F(2,20)s ≤ 1.44, ps ≥ 0.261, ηp2s ≤ 0.126 |
| TMT A (in s) | 36 | 34 | 37 | 31 | 34 | 29 | all F(2,24)s ≤ 1.46, ps ≥ 0.253, ηp2s ≤ 0.108 |
| TMT B (in s) | 133 | 93 | 110 | 82 | 154 | 86 | all F(2,22)s ≤ 0.15, ps ≥ 0.865, ηp2s ≤ 0.013 |
Publisher’s Note: MDPI stays neutral with regard to jurisdictional claims in published maps and institutional affiliations. |
© 2022 by the authors. Licensee MDPI, Basel, Switzerland. This article is an open access article distributed under the terms and conditions of the Creative Commons Attribution (CC BY) license (https://creativecommons.org/licenses/by/4.0/).
Share and Cite
Marquardt, L.; Craven, A.R.; Hugdahl, K.; Johnsen, E.; Kroken, R.A.; Kusztrits, I.; Specht, K.; Thomassen, A.S.; Weber, S.; Hirnstein, M. Pilot-RCT Finds No Evidence for Modulation of Neuronal Networks of Auditory Hallucinations by Transcranial Direct Current Stimulation. Brain Sci. 2022, 12, 1382. https://doi.org/10.3390/brainsci12101382
Marquardt L, Craven AR, Hugdahl K, Johnsen E, Kroken RA, Kusztrits I, Specht K, Thomassen AS, Weber S, Hirnstein M. Pilot-RCT Finds No Evidence for Modulation of Neuronal Networks of Auditory Hallucinations by Transcranial Direct Current Stimulation. Brain Sciences. 2022; 12(10):1382. https://doi.org/10.3390/brainsci12101382
Chicago/Turabian StyleMarquardt, Lynn, Alexander R. Craven, Kenneth Hugdahl, Erik Johnsen, Rune Andreas Kroken, Isabella Kusztrits, Karsten Specht, Anne Synnøve Thomassen, Sarah Weber, and Marco Hirnstein. 2022. "Pilot-RCT Finds No Evidence for Modulation of Neuronal Networks of Auditory Hallucinations by Transcranial Direct Current Stimulation" Brain Sciences 12, no. 10: 1382. https://doi.org/10.3390/brainsci12101382
APA StyleMarquardt, L., Craven, A. R., Hugdahl, K., Johnsen, E., Kroken, R. A., Kusztrits, I., Specht, K., Thomassen, A. S., Weber, S., & Hirnstein, M. (2022). Pilot-RCT Finds No Evidence for Modulation of Neuronal Networks of Auditory Hallucinations by Transcranial Direct Current Stimulation. Brain Sciences, 12(10), 1382. https://doi.org/10.3390/brainsci12101382