Inter-Session Reliability of Functional Near-Infrared Spectroscopy at the Prefrontal Cortex While Walking in Multiple Sclerosis

 ,
,  ,
,
Abstract
1. Introduction
2. Materials and Methods
2.1. Study Design and Participants
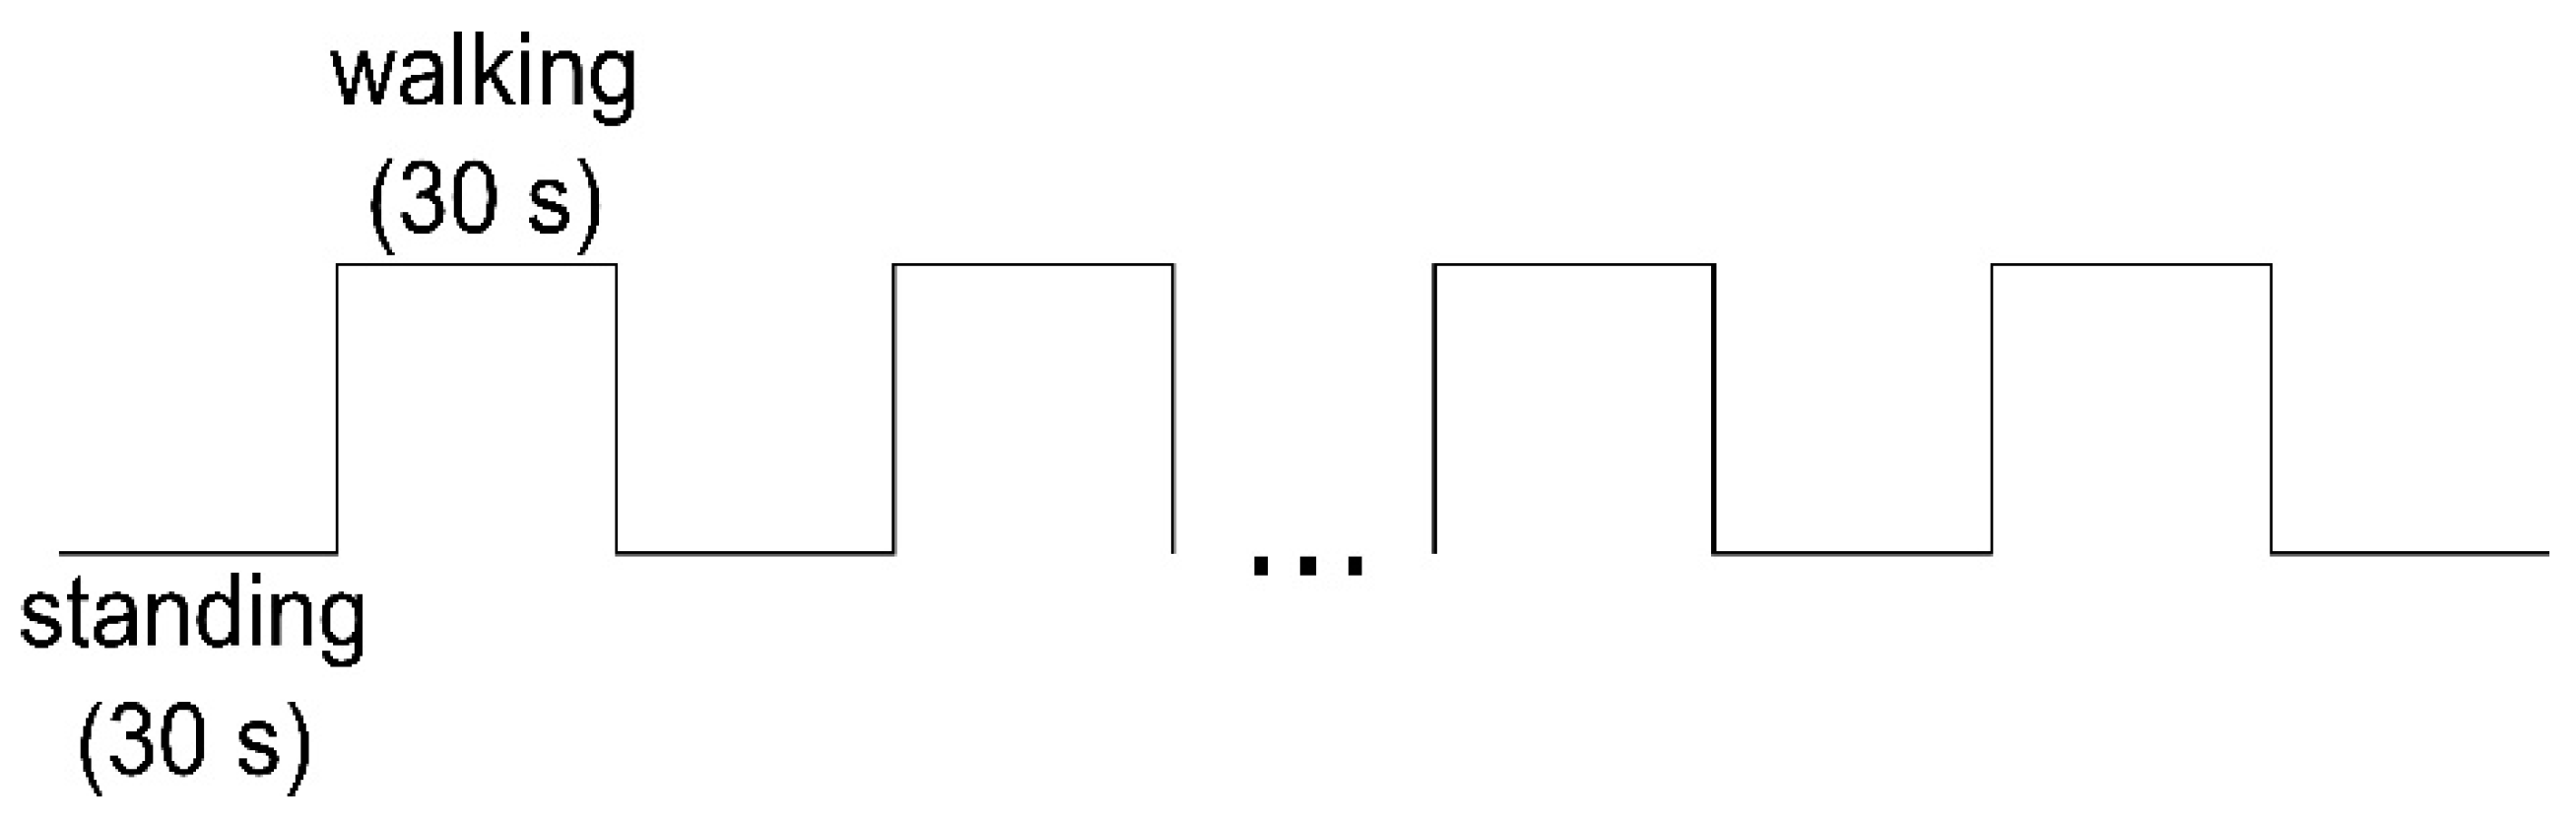
2.2. Study Procedure
2.3. Equipment and Outcome Measures
2.4. Data Processing
2.5. Statistical Analysis
3. Results
3.1. Descriptive Data cHbO/cHbR
3.2. Inter-Session Reliability cHbO/cHbR
3.3. Secondary Outcomes
4. Discussion
Supplementary Materials
Author Contributions
Funding
Acknowledgments
Conflicts of Interest
Abbreviations
| 6MWT | 6-min walk test |
| A | area under the curve |
| BA | Brodmann area |
| cHbO | concentration of oxyhemoglobin |
| cHBR | concentration of deoxyhemoglobin |
| CI | confidence interval |
| df | degree of freedom |
| DLPFC | dorsolateral prefrontal cortex |
| EDSS | Expanded Disability Status Scale |
| EEG | electroencephalography |
| FD | first diagnosis |
| FM | first manifestation |
| fNIRS | functional near-infrared spectroscopy |
| fOLD | fNIRS Optodes’ Location Decider |
| FPC | frontopolar cortex |
| HbO | oxyhemoglobin |
| HbR | deoxyhemoglobin |
| HC individuals | healthy control individuals |
| HR | heart rate |
| HRF | hemodynamic response function |
| HRV | heart rate variability |
| ICC | intraclass correlation coefficient |
| l | left |
| LF/HF | low frequency/high frequency |
| LoA | limits of agreement |
| m | medial |
| MS | multiple sclerosis |
| MSWS-12 | 12-Item Multiple Sclerosis Walking Scale |
| OvGU | Otto von Guericke University |
| PFC | prefrontal cortex |
| people with MS | people with MS |
| r | right |
| SC | slope coefficient |
| ISR | inter-session reliability |
References
- LaRocca, N.G. Impact of walking impairment in multiple sclerosis: Perspectives of patients and care partners. Patient 2011, 4, 189–201. [Google Scholar] [CrossRef] [PubMed]
- Benedetti, M.G.; Piperno, R.; Simoncini, L.; Bonato, P.; Tonini, A.; Giannini, S. Gait abnormalities in minimally impaired multiple sclerosis patients. Mult. Scler. J. 1999, 5, 363–368. [Google Scholar] [CrossRef] [PubMed]
- Clark, D.J. Automaticity of walking: Functional significance, mechanisms, measurement and rehabilitation strategies. Front. Hum. Neurosci. 2015, 9, 246. [Google Scholar] [CrossRef]
- Rochester, L.; Baker, K.; Hetherington, V.; Jones, D.; Willems, A.-M.; Kwakkel, G.; van Wegen, E.; Lim, I.; Nieuwboer, A. Evidence for motor learning in Parkinson’s disease: Acquisition, automaticity and retention of cued gait performance after training with external rhythmical cues. Brain Res. 2010, 1319, 103–111. [Google Scholar] [CrossRef] [PubMed]
- Yogev, G.; Hausdorff, J.M.; Giladi, N. The Role of Executive Function and Attention in Gait. Mov. Disord. 2008, 23, 329–472. [Google Scholar] [CrossRef]
- Gramann, K.; Ferris, D.P.; Gwin, J.; Makeig, S. Imaging natural cognition in action. Int. J. Psychophysiol. 2014, 91, 22–29. [Google Scholar] [CrossRef]
- Hamacher, D.; Herold, F.; Wiegel, P.; Hamacher, D.; Schega, L. Brain activity during walking: A systematic review. Neurosci. Biobehav. Rev. 2015, 57, 310–327. [Google Scholar] [CrossRef]
- Ferrari, M.; Quaresima, V. A brief review on the history of human functional near-infrared spectroscopy (fNIRS) development and fields of application. NeuroImage 2012, 63, 921–935. [Google Scholar] [CrossRef]
- Gramigna, V.; Pellegrino, G.; Cerasa, A.; Cutini, S.; Vasta, R.; Olivadese, G.; Martino, I.; Quattrone, A. Near-Infrared Spectroscopy in Gait Disorders: Is It Time to Begin? Neurorehabil. Neural Repair 2017, 31, 402–412. [Google Scholar] [CrossRef]
- Izzetoglu, M.; Bunce, S.; Izzetoglu, K.; Onaral, B.; Pourrezaei, A. Functional brain imaging using near-infrared technology. IEEE Eng. Med. Biol. Mag. 2007, 26, 38–46. [Google Scholar] [CrossRef]
- Strangman, G.; Culver, J.P.; Thompson, J.H.; Boas, D.A. A Quantitative Comparison of Simultaneous BOLD fMRI and NIRS Recordings during Functional Brain Activation. NeuroImage 2002, 17, 719–731. [Google Scholar] [CrossRef] [PubMed]
- Hernandez, M.E.; Holtzer, R.; Chaparro, G.; Jean, K.; Balto, J.M.; Sandroff, B.M.; Izzetoglu, M.; Motl, R.W. Brain activation changes during locomotion in middle-aged to older adults with multiple sclerosis. J. Neurol. Sci. 2016, 370, 277–283. [Google Scholar] [CrossRef] [PubMed]
- Chaparro, G.; Balto, J.M.; Sandroff, B.M.; Holtzer, R.; Izzetoglu, M.; Motl, R.W.; Hernandez, M.E. Frontal brain activation changes due to dual-tasking under partial body weight support conditions in older adults with multiple sclerosis. J. NeuroEng. Rehabil. 2017, 14, 65. [Google Scholar] [CrossRef]
- Powell, D.J.H.; Liossi, C.; Schlotz, W.; Moss-Morris, R. Tracking daily fatigue fluctuations in multiple sclerosis: Ecological momentary assessment provides unique insights. J. Behav. Med. 2017, 40, 772–783. [Google Scholar] [CrossRef]
- Stuart, S.; Belluscio, V.; Quinn, J.F.; Mancini, M. Pre-frontal Cortical Activity During Walking and Turning Is Reliable and Differentiates Across Young, Older Adults and People With Parkinson’s Disease. Front. Neurol. 2019, 10, 536. [Google Scholar] [CrossRef]
- Polman, C.H.; Reingold, S.C.; Banwell, B.; Clanet, M.; Cohen, J.A.; Filippi, M.; Fujihara, K.; Havrdova, E.; Hutchinson, M.; Kappos, L.; et al. Diagnostic criteria for multiple sclerosis: 2010 Revisions to the McDonald criteria. Ann. Neurol. 2011, 69, 292–302. [Google Scholar] [CrossRef] [PubMed]
- Kurtzke, J.F. Rating neurologic impairment in multiple sclerosis: An expanded disability status scale (EDSS). Neurology 1983, 33, 1444–1452. [Google Scholar] [CrossRef]
- Wetzel, J.L.; Fry, D.K.; Pfalzer, L.A. Six-minute walk test for persons with mild or moderate disability from multiple sclerosis: Performance and explanatory factors. Physiother. Can. 2011, 63, 166–180. [Google Scholar] [CrossRef]
- Hobart, J.C.; Riazi, A.; Lamping, D.L.; Fitzpatrick, R.; Thompson, A.J. Measuring the impact of MS on walking ability: The 12-Item MS Walking Scale (MSWS-12). Neurology 2003, 60, 31–36. [Google Scholar] [CrossRef]
- Borg, G. Borg’s Perceived Exertion and Pain Scales; Human Kinetics: Champaign, IL, USA, 1998; ISBN 0880116234. [Google Scholar]
- Zimeo Morais, G.A.; Balardin, J.B.; Sato, J.R. fNIRS Optodes’ Location Decider (fOLD): A toolbox for probe arrangement guided by brain regions-of-interest. Sci. Rep. 2018, 8, 3341. [Google Scholar] [CrossRef]
- Scholkmann, F.; Kleiser, S.; Metz, A.J.; Zimmermann, R.; Mata Pavia, J.; Wolf, U.; Wolf, M. A review on continuous wave functional near-infrared spectroscopy and imaging instrumentation and methodology. NeuroImage 2014, 85, 6–27. [Google Scholar] [CrossRef] [PubMed]
- Huppert, T.J.; Diamond, S.G.; Franceschini, M.A.; Boas, D.A. HomER: A review of time-series analysis methods for near-infrared spectroscopy of the brain. Appl. Opt. 2009, 48, D280–D298. [Google Scholar] [CrossRef]
- Jahani, S.; Setarehdan, S.K.; Boas, D.A.; Yücel, M.A. Motion artifact detection and correction in functional near-infrared spectroscopy: A new hybrid method based on spline interpolation method and Savitzky-Golay filtering. Neurophotonics 2018, 5, 15003. [Google Scholar] [CrossRef]
- Herold, F.; Wiegel, P.; Scholkmann, F.; Thiers, A.; Hamacher, D.; Schega, L. Functional near-infrared spectroscopy in movement science: A systematic review on cortical activity in postural and walking tasks. Neurophotonics 2017, 4, 041403. [Google Scholar] [CrossRef]
- Scholkmann, F.; Wolf, M. General equation for the differential pathlength factor of the frontal human head depending on wavelength and age. J. Biomed. Opt. 2013, 18, 105004. [Google Scholar] [CrossRef]
- Ye, J.C.; Tak, S.; Jang, K.E.; Jung, J.; Jang, J. NIRS-SPM: Statistical parametric mapping for near-infrared spectroscopy. NeuroImage 2009, 44, 428–447. [Google Scholar] [CrossRef] [PubMed]
- Mandrick, K.; Derosiere, G.; Dray, G.; Coulon, D.; Micallef, J.P.; Perrey, S. Utilizing slope method as an alternative data analysis for functional near-infrared spectroscopy-derived cerebral hemodynamic responses. Int. J. Ind. Ergon. 2013, 43, 335–341. [Google Scholar] [CrossRef]
- Gagnon, C.; Desjardins-Crépeau, L.; Tournier, I.; Desjardins, M.; Lesage, F.; Greenwood, C.E.; Bherer, L. Near-infrared imaging of the effects of glucose ingestion and regulation on prefrontal activation during dual-task execution in healthy fasting older adults. Behav. Brain Res. 2012, 232, 137–147. [Google Scholar] [CrossRef]
- Koo, T.K.; Li, M.Y. A Guideline of Selecting and Reporting Intraclass Correlation Coefficients for Reliability Research. J. Chiropr. Med. 2016, 15, 155–163. [Google Scholar] [CrossRef] [PubMed]
- Cicchetti, D.V. Guidelines, Criteria, and Rules of Thumb for Evaluating Normed and Standardized Assessment Instruments in Psychology. Psychol. Assess. 1994, 6, 284–290. [Google Scholar] [CrossRef]
- Bland, J.M.; Altman, D.G. Statistical methods for assessing agreement between two methods of clinical measurement. Lancet 1986, 327, 307–310. [Google Scholar] [CrossRef]
- Turnbull, A.; Wang, H.T.; Murphy, C.; Ho, N.S.P.; Wang, X.; Sormaz, M.; Karapanagiotidis, T.; Leech, R.M.; Bernhardt, B.; Margulies, D.S.; et al. Left dorsolateral prefrontal cortex supports context-dependent prioritisation of off-task thought. Nat. Commun. 2019, 10, 3816. [Google Scholar] [CrossRef] [PubMed]
- Plichta, M.M.; Herrmann, M.J.; Baehne, C.G.; Ehlis, A.C.; Richter, M.M.; Pauli, P.; Fallgatter, A.J. Event-related functional near-infrared spectroscopy (fNIRS) based on craniocerebral correlations: Reproducibility of activation? Hum. Brain Mapp. 2007, 28, 733–741. [Google Scholar] [CrossRef]
- Dravida, S.; Noah, J.A.; Zhang, X.; Hirsch, J. Comparison of oxyhemoglobin and deoxyhemoglobin signal reliability with and without global mean removal for digit manipulation motor tasks. Neurophotonics 2018, 5, 11006. [Google Scholar] [CrossRef]
- Plichta, M.M.; Herrmann, M.J.; Baehne, C.G.; Ehlis, A.C.; Richter, M.M.; Pauli, P.; Fallgatter, A.J. Event-related functional near-infrared spectroscopy (fNIRS): Are the measurements reliable? NeuroImage 2006, 31, 116–124. [Google Scholar] [CrossRef] [PubMed]
- Herold, F.; Wiegel, P.; Scholkmann, F.; Müller, N.G. Applications of Functional Near-Infrared Spectroscopy (fNIRS) Neuroimaging in Exercise-Cognition Science: A Systematic, Methodology-Focused Review. J. Clin. Med. 2018, 7, 466. [Google Scholar] [CrossRef]
- Kirilina, E.; Jelzow, A.; Heine, A.; Niessing, M.; Wabnitz, H.; Brühl, R.; Ittermann, B.; Jacobs, A.M.; Tachtsidis, I. The physiological origin of task-evoked systemic artefacts in functional near infrared spectroscopy. NeuroImage 2012, 61, 70–81. [Google Scholar] [CrossRef]
- Vitorio, R.; Stuart, S.; Rochester, L.; Alcock, L.; Pantall, A. fNIRS response during walking—Artefact or cortical activity? A systematic review. Neurosci. Biobehav. Rev. 2017, 83, 160–172. [Google Scholar] [CrossRef]
- Hamacher, D.; Hamacher, D.; Krowicki, M.; Schega, L. Between-day test–retest reliability of gait variability in older individuals improves with a familiarization trial. Aging Clin. Exp. Res. 2017, 29, 327–329. [Google Scholar] [CrossRef]
- McNair, D.; Lorr, M.; Droppleman, L. Manual for Profile of Mood States; Educational and Industrial Testing Services: San Diego, CA, USA, 1992. [Google Scholar]


| Age [Years] | f/m | Weight [kg] | Height [cm] | EDSS | FD [Years] | FM [years] | MSWS-12 [%] | 6MWT [m] | |
|---|---|---|---|---|---|---|---|---|---|
| MS (n = 16) | 41.0 ± 12.0 | 14/2 | 74.6 ± 18.1 | 170.1 ± 9.0 | 2.0 ± 0.9 | 5.9 ± 6.8 | 8.6 ± 8.7 | 45.0 ± 20.7 | 473.1 ± 109.7 |
| HC (n = 19) | 42.2 ± 9.8 | 15/4 | 73.0 ± 16.0 | 171.4 ± 8.8 | n.a. | n.a. | n.a. | n.a. | 533.5 ± 64.5 |
| MS (n = 16) | HC (n = 19) | ||||||||||
|---|---|---|---|---|---|---|---|---|---|---|---|
| Area | Mean | MD | SD | 25% Quartile | 75% Quartile | Mean | MD | SD | 25% Quartile | 75% Quartile | |
| Test HbO [µmol/L] | lDLPFC9 | 0.114 # | 0.090 | 0.214 | −0.001 | 0.135 | −0.083 | −0.081 | 0.217 | −0.204 | 0.056 |
| rDLPFC9 | 0.055 # | −0.003 | 0.177 | −0.057 | 0.154 | −0.106 # | −0.075 | 0.222 | −0.283 | 0.025 | |
| lDLPFC46 | 0.315 # | 0.304 | 0.207 | 0.212 | 0.351 | 0.104 | 0.074 | 0.257 | −0.086 | 0.332 | |
| rDLPFC46 | 0.210 | 0.201 | 0.132 | 0.111 | 0.290 | 0.067 | 0.046 | 0.192 | −0.080 | 0.175 | |
| mDLPFC9 | 0.067 | 0.034 | 0.155 | −0.050 | 0.180 | −0.113 # | −0.076 | 0.207 | −0.180 | −0.029 | |
| lFPC10 | 0.122 | 0.072 | 0.237 | −0.036 | 0.218 | 0.008 | −0.034 | 0.225 | −0.141 | 0.185 | |
| rFPC10 | 0.126 | 0.055 | 0.199 | 0.000 | 0.228 | 0.008 | −0.020 | 0.179 | −0.103 | 0.084 | |
| mFPC10 | −0.058 | −0.074 | 0.250 | −0.265 | 0.081 | −0.131 | −0.188 | 0.189 | −0.213 | 0.051 | |
| Test HbR [µmol/L] | lDLPFC9 | −0.020 | −0.033 | 0.058 | −0.066 | 0.007 | 0.015 | 0.009 | 0.051 | −0.010 | 0.047 |
| rDLPFC9 | −0.026 | −0.029 | 0.043 | −0.061 | −0.002 | 0.009 | 0.009 | 0.052 | −0.017 | 0.038 | |
| lDLPFC46 | −0.047 | −0.028 | 0.061 | −0.086 | −0.008 | 0.011 | 0.004 | 0.074 | −0.040 | 0.061 | |
| rDLPFC46 | −0.014 | 0.002 | 0.057 | −0.066 | 0.035 | 0.006 | 0.010 | 0.061 | −0.030 | 0.049 | |
| mDLPFC9 | −0.055 | −0.055 | 0.065 | −0.114 | −0.001 | 0.000 | −0.006 | 0.056 | −0.031 | 0.030 | |
| lFPC10 | −0.048 | −0.046 | 0.055 | −0.084 | 0.003 | −0.003 | 0.001 | 0.049 | −0.044 | 0.043 | |
| rFPC10 | −0.023 | −0.038 | 0.058 | −0.067 | 0.020 | 0.011 | 0.002 | 0.064 | −0.037 | 0.038 | |
| mFPC10 | −0.014 | −0.015 | 0.075 | −0.045 | 0.011 | −0.004 | 0.003 | 0.062 | −0.050 | 0.052 | |
| Retest HbO [µmol/L] | lDLPFC9 | 0.047 | 0.016 | 0.112 | −0.026 | 0.128 | −0.121 | −0.107 | 0.237 | −0.346 | 0.058 |
| rDLPFC9 | 0.099 | 0.035 | 0.221 | −0.056 | 0.296 | −0.114 | −0.142 | 0.271 | −0.216 | 0.060 | |
| lDLPFC46 | 0.215 | 0.227 | 0.169 | 0.122 | 0.331 | 0.055 | 0.045 | 0.202 | −0.066 | 0.244 | |
| rDLPFC46 | 0.208 | 0.170 | 0.281 | 0.040 | 0.452 | 0.089 | 0.081 | 0.305 | −0.036 | 0.236 | |
| mDLPFC9 | 0.086 | 0.100 | 0.157 | −0.046 | 0.215 | −0.114 | −0.119 | 0.258 | −0.224 | 0.073 | |
| lFPC10 | 0.166 | 0.118 | 0.195 | 0.004 | 0.324 | −0.005 | 0.000 | 0.238 | −0.198 | 0.073 | |
| rFPC10 | 0.130 | 0.138 | 0.149 | 0.029 | 0.229 | −0.031 | −0.009 | 0.187 | −0.107 | 0.071 | |
| mFPC10 | −0.050 | −0.053 | 0.206 | −0.173 | 0.090 | −0.121 | −0.098 | 0.179 | −0.270 | −0.016 | |
| Retest HbR [µmol/L] | lDLPFC9 | 0.005 # | −0.028 | 0.070 | −0.034 | 0.052 | 0.029 | 0.020 | 0.057 | −0.014 | 0.058 |
| rDLPFC9 | −0.028 | −0.031 | 0.040 | −0.067 | 0.008 | 0.010 | 0.008 | 0.076 | −0.043 | 0.078 | |
| lDLPFC46 | −0.036 | −0.050 | 0.070 | −0.086 | 0.018 | 0.019 | 0.015 | 0.056 | −0.005 | 0.044 | |
| rDLPFC46 | −0.081 # | −0.073 | 0.122 | −0.109 | 0.001 | 0.010 | 0.010 | 0.067 | −0.038 | 0.063 | |
| mDLPFC9 | −0.054 | −0.054 | 0.048 | −0.108 | −0.016 | 0.016 | 0.012 | 0.050 | −0.013 | 0.051 | |
| lFPC10 | −0.056 | −0.060 | 0.062 | −0.091 | −0.011 | 0.002 | 0.010 | 0.056 | −0.043 | 0.052 | |
| rFPC10 | −0.049 | −0.042 | 0.054 | −0.088 | −0.008 | 0.000 | −0.008 | 0.069 | −0.035 | 0.034 | |
| mFPC10 | −0.027 | −0.021 | 0.072 | −0.070 | 0.041 | 0.008 | 0.010 | 0.053 | −0.020 | 0.044 | |
| Inter-Session Reliability | Mean | Slope Coefficient | Area Under the Curve | |||||||||||||||||||
|---|---|---|---|---|---|---|---|---|---|---|---|---|---|---|---|---|---|---|---|---|---|---|
| 95% CI | F Test With True Value 0 | 95% CI | F Test With True Value 0 | 95% CI | F Test With True Value 0 | |||||||||||||||||
| ICC | Lower | Upper | Value | df1 | df2 | p | ICC | Lower | Upper | Value | df1 | df2 | p | ICC | Lower | Upper | Value | df1 | df2 | p | ||
| MS HbO (n = 16) | lDLPFC9 | 0.172# | −0.313 | 0.598 | 1.429 | 15 | 15 | 0.249 | 0.174° | −0.096 | 0.534 | 2.630 | 15 | 15 | 0.035 | 0.172# | −0.313 | 0.598 | 1.429 | 15 | 15 | 0.249 |
| rDLPFC9 | 0.026# | −0.490 | 0.510 | 1.050 | 15 | 15 | 0.463 | 0.136 | −0.269 | 0.548 | 1.376 | 15 | 15 | 0.272 | 0.025# | −0.491 | 0.510 | 1.049 | 15 | 15 | 0.463 | |
| lDLPFC46 | −0.110# | −0.527 | 0.377 | 0.789 | 15 | 15 | 0.674 | 0.035 | −0.370 | 0.477 | 1.082 | 15 | 15 | 0.440 | −0.110# | −0.528 | 0.377 | 0.789 | 15 | 15 | 0.674 | |
| rDLPFC46 | −0.210 | −0.688 | 0.331 | 0.674 | 15 | 15 | 0.773 | 0.101 | −0.443 | 0.568 | 1.211 | 15 | 15 | 0.358 | −0.208# | −0.687 | 0.333 | 0.677 | 15 | 15 | 0.771 | |
| mDLPFC9 | 0.389 | −0.134 | 0.736 | 2.208 | 15 | 15 | 0.068 | 0.234 | −0.312 | 0.651 | 1.576 | 15 | 15 | 0.194 | 0.388 | −0.134 | 0.736 | 2.206 | 15 | 15 | 0.068 | |
| lFPC10 | 0.257 | −0.272 | 0.661 | 1.667 | 15 | 15 | 0.167 | 0.541 | 0.066 | 0.813 | 3.227 | 15 | 15 | 0.015 | 0.256 | −0.273 | 0.660 | 1.665 | 15 | 15 | 0.167 | |
| rFPC10 | 0.313 | −0.231 | 0.697 | 1.856 | 15 | 15 | 0.121 | 0.207 | −0.326 | 0.631 | 1.500 | 15 | 15 | 0.221 | 0.418 | −0.097 | 0.751 | 2.366 | 15 | 15 | 0.053 | |
| mFPC10 | 0.157 | −0.392 | 0.604 | 1.351 | 15 | 15 | 0.284 | 0.579 | 0.125 | 0.830 | 3.610 | 15 | 15 | 0.009 | 0.159 | −0.390 | 0.605 | 1.354 | 15 | 15 | 0.282 | |
| MS HbR (n = 16) | lDLPFC9 | 0.360# | −0.113 | 0.711 | 2.190 | 15 | 15 | 0.070 | 0.097 | −0.102 | 0.406 | 1.647 | 15 | 15 | 0.172 | 0.361 | −0.112 | 0.712 | 2.193 | 15 | 15 | 0.070 |
| rDLPFC9 | 0.391 | −0.138 | 0.739 | 2.206 | 15 | 15 | 0.068 | 0.093 | −0.065 | 0.379 | 2.182 | 15 | 15 | 0.071 | 0.391 | −0.138 | 0.739 | 2.207 | 15 | 15 | 0.068 | |
| lDLPFC46 | 0.561 | 0.106 | 0.822 | 3.470 | 15 | 15 | 0.011 | 0.398 | −0.116 | 0.740 | 2.267 | 15 | 15 | 0.062 | 0.562 | 0.107 | 0.822 | 3.477 | 15 | 15 | 0.011 | |
| rDLPFC46 | 0.201# | −0.198 | 0.591 | 1.638 | 15 | 15 | 0.175 | 0.298 | −0.155 | 0.669 | 1.951 | 15 | 15 | 0.104 | 0.202 | −0.198 | 0.592 | 1.640 | 15 | 15 | 0.174 | |
| mDLPFC9 | 0.523 | 0.036 | 0.805 | 3.060 | 15 | 15 | 0.019 | 0.158 | −0.387 | 0.604 | 1.355 | 15 | 15 | 0.282 | 0.523 | 0.035 | 0.805 | 3.058 | 15 | 15 | 0.019 | |
| lFPC10 | 0.536 | 0.065 | 0.810 | 3.212 | 15 | 15 | 0.015 | 0.469 | −0.006 | 0.774 | 2.765 | 15 | 15 | 0.029 | 0.538 | 0.067 | 0.811 | 3.223 | 15 | 15 | 0.015 | |
| rFPC10 | 0.483 | 0.042 | 0.777 | 3.191 | 15 | 15 | 0.016 | 0.629 | 0.232 | 0.850 | 4.722 | 15 | 15 | 0.002 | 0.514 | 0.073 | 0.794 | 3.581 | 15 | 15 | 0.009 | |
| mFPC10 | 0.464 | −0.029 | 0.774 | 2.670 | 15 | 15 | 0.033 | 0.403 | −0.113 | 0.743 | 2.289 | 15 | 15 | 0.060 | 0.463 | −0.030 | 0.773 | 2.665 | 15 | 15 | 0.033 | |
| HC HbO (n = 19) | lDLPFC9 | 0.744 | 0.457 | 0.892 | 6.841 | 18 | 18 | 0.000 | 0.560 | 0.162 | 0.803 | 3.535 | 18 | 18 | 0.005 | 0.745 | 0.457 | 0.892 | 6.845 | 18 | 18 | 0.000 |
| rDLPFC9 | 0.529# | 0.099 | 0.790 | 3.132 | 18 | 18 | 0.010 | 0.481 | 0.070 | 0.758 | 3.301 | 18 | 18 | 0.008 | 0.529# | 0.099 | 0.790 | 3.133 | 18 | 18 | 0.010 | |
| lDLPFC46 | 0.478 | 0.048 | 0.760 | 2.813 | 18 | 18 | 0.017 | 0.208 | −0.273 | 0.600 | 1.508 | 18 | 18 | 0.196 | 0.478 | 0.049 | 0.760 | 2.816 | 18 | 18 | 0.017 | |
| rDLPFC46 | 0.563 | 0.151 | 0.807 | 3.461 | 18 | 18 | 0.006 | 0.306° | −0.124 | 0.652 | 1.944 | 18 | 18 | 0.084 | 0.563 | 0.151 | 0.807 | 3.466 | 18 | 18 | 0.006 | |
| mDLPFC9 | 0.392# | −0.083 | 0.715 | 2.221 | 18 | 18 | 0.050 | 0.062 | −0.385 | 0.489 | 1.133 | 18 | 18 | 0.397 | 0.392# | −0.083 | 0.715 | 2.220 | 18 | 18 | 0.050 | |
| lFPC10 | 0.612 | 0.223 | 0.831 | 4.001 | 18 | 18 | 0.003 | 0.343° | −0.140 | 0.687 | 1.990 | 18 | 18 | 0.077 | 0.612 | 0.223 | 0.831 | 4.003 | 18 | 18 | 0.003 | |
| rFPC10 | 0.507 | 0.087 | 0.775 | 3.040 | 18 | 18 | 0.012 | 0.492 | 0.054 | 0.769 | 2.861 | 18 | 18 | 0.016 | 0.368 | −0.107 | 0.701 | 2.110 | 18 | 18 | 0.061 | |
| mFPC10 | 0.615 | 0.228 | 0.833 | 4.044 | 18 | 18 | 0.002 | 0.512 | 0.074 | 0.781 | 2.989 | 18 | 18 | 0.013 | 0.616 | 0.228 | 0.833 | 4.046 | 18 | 18 | 0.002 | |
| HbR (n = 19) | lDLPFC9 | 0.548 | 0.153 | 0.796 | 3.488 | 18 | 18 | 0.006 | 0.395 | −0.044 | 0.710 | 2.330 | 18 | 18 | 0.040 | 0.548 | 0.153 | 0.796 | 3.490 | 18 | 18 | 0.006 |
| rDLPFC9 | 0.533 | 0.122 | 0.789 | 3.258 | 18 | 18 | 0.008 | 0.543 | 0.134 | 0.795 | 3.334 | 18 | 18 | 0.007 | 0.533 | 0.122 | 0.789 | 3.261 | 18 | 18 | 0.008 | |
| lDLPFC46 | 0.552 | 0.131 | 0.802 | 3.334 | 18 | 18 | 0.007 | 0.479 | 0.068 | 0.757 | 2.939 | 18 | 18 | 0.014 | 0.552 | 0.131 | 0.802 | 3.336 | 18 | 18 | 0.007 | |
| rDLPFC46 | 0.522 | 0.090 | 0.786 | 3.076 | 18 | 18 | 0.011 | 0.331 | −0.131 | 0.676 | 1.978 | 18 | 18 | 0.079 | 0.522 | 0.090 | 0.786 | 3.075 | 18 | 18 | 0.011 | |
| mDLPFC9 | 0.418 | −0.015 | 0.724 | 2.469 | 18 | 18 | 0.031 | 0.306 | −0.179 | 0.664 | 1.841 | 18 | 18 | 0.102 | 0.417 | −0.015 | 0.723 | 2.468 | 18 | 18 | 0.031 | |
| lFPC10 | 0.633 | 0.259 | 0.841 | 4.309 | 18 | 18 | 0.002 | 0.123 | −0.360 | 0.544 | 1.270 | 18 | 18 | 0.309 | 0.633 | 0.259 | 0.841 | 4.307 | 18 | 18 | 0.002 | |
| rFPC10 | 0.580 | 0.186 | 0.814 | 3.704 | 18 | 18 | 0.004 | 0.684 | 0.341 | 0.865 | 5.137 | 18 | 18 | 0.001 | 0.622# | 0.245 | 0.836 | 4.182 | 18 | 18 | 0.002 | |
| mFPC10 | 0.392 | −0.061 | 0.712 | 2.272 | 18 | 18 | 0.045 | 0.206 | −0.210 | 0.581 | 1.572 | 18 | 18 | 0.173 | 0.392 | −0.062 | 0.712 | 2.270 | 18 | 18 | 0.045 | |
| Bland and Altman (Test–Retest) | Mean | Area Under the Curve | ||||||||||||||||||
| Upper LoA | Lower LoA | Upper LoA | Lower LoA | |||||||||||||||||
| n | Mean | SD | SE | LoA | Upper CI | Lower CI | LoA | Upper CI | Lower CI | Mean | SD | SE | LoA | Upper CI | Lower CI | LoA | Upper CI | Lower CI | ||
| MS HbO [µmol/L] | rDLPFC9 | 16 | −0.044 | 0.280 | 0.070 | 0.505 | 0.760 | 0.250 | −0.592 | −0.337 | −0.847 | −0.869 | 5.592 | 1.398 | 10.090 | 15.184 | 4.996 | −11.829 | −6.735 | −16.923 |
| lDLPFC9 | 16 | 0.067 | 0.219 | 0.055 | 0.497 | 0.696 | 0.297 | −0.362 | −0.163 | −0.562 | 1.341 | 4.378 | 1.094 | 9.921 | 13.909 | 5.933 | −7.239 | −3.251 | −11.227 | |
| rDLPFC46 | 16 | 0.003 | 0.339 | 0.085 | 0.667 | 0.976 | 0.358 | −0.661 | −0.353 | −0.970 | 0.057 | 6.767 | 1.692 | 13.320 | 19.485 | 7.155 | −13.207 | −7.042 | −19.372 | |
| lDLPFC46 | 16 | 0.099 | 0.282 | 0.071 | 0.652 | 0.909 | 0.395 | −0.454 | −0.197 | −0.710 | 1.986 | 5.639 | 1.410 | 13.039 | 18.176 | 7.901 | −9.067 | −3.930 | −14.204 | |
| mDLPFC9 | 16 | −0.020 | 0.174 | 0.044 | 0.322 | 0.481 | 0.163 | −0.361 | −0.203 | −0.520 | −0.395 | 3.486 | 0.871 | 6.437 | 9.613 | 3.262 | −7.227 | −4.052 | −10.403 | |
| lFPC10 | 16 | −0.044 | 0.266 | 0.066 | 0.477 | 0.719 | 0.235 | −0.565 | −0.323 | −0.807 | −0.879 | 5.309 | 1.327 | 9.526 | 14.363 | 4.690 | −11.285 | −6.449 | −16.122 | |
| rFPC10 | 16 | −0.005 | 0.208 | 0.052 | 0.403 | 0.592 | 0.213 | −0.412 | −0.223 | −0.601 | −0.419 | 3.545 | 0.886 | 6.529 | 9.759 | 3.300 | −7.368 | −4.138 | −10.597 | |
| mFPC10 | 16 | −0.008 | 0.299 | 0.075 | 0.578 | 0.851 | 0.306 | −0.593 | −0.321 | −0.866 | −0.152 | 5.967 | 1.492 | 11.543 | 16.978 | 6.107 | −11.847 | −6.411 | −17.283 | |
| MS HbR [µmol/L] | rDLPFC9 | 16 | 0.002 | 0.046 | 0.012 | 0.092 | 0.134 | 0.050 | −0.088 | −0.046 | −0.130 | 0.043 | 0.920 | 0.230 | 1.845 | 2.683 | 1.008 | −1.759 | −0.921 | −2.597 |
| lDLPFC9 | 16 | −0.025 | 0.072 | 0.018 | 0.116 | 0.181 | 0.050 | −0.165 | −0.100 | −0.230 | −0.497 | 1.431 | 0.358 | 2.308 | 3.612 | 1.004 | −3.302 | −1.998 | −4.605 | |
| rDLPFC46 | 16 | 0.067 | 0.117 | 0.029 | 0.297 | 0.404 | 0.190 | −0.163 | −0.056 | −0.270 | 1.342 | 2.344 | 0.586 | 5.937 | 8.073 | 3.802 | −3.253 | −1.117 | −5.388 | |
| lDLPFC46 | 16 | −0.010 | 0.062 | 0.016 | 0.112 | 0.169 | 0.055 | −0.133 | −0.076 | −0.189 | −0.206 | 1.246 | 0.312 | 2.237 | 3.373 | 1.102 | −2.649 | −1.513 | −3.785 | |
| mDLPFC9 | 16 | −0.001 | 0.056 | 0.014 | 0.109 | 0.161 | 0.058 | −0.112 | −0.060 | −0.163 | −0.021 | 1.128 | 0.282 | 2.189 | 3.216 | 1.162 | −2.231 | −1.204 | −3.258 | |
| lFPC10 | 16 | 0.008 | 0.057 | 0.014 | 0.120 | 0.172 | 0.068 | −0.104 | −0.052 | −0.156 | 0.156 | 1.142 | 0.285 | 2.394 | 3.434 | 1.354 | −2.081 | −1.041 | −3.121 | |
| rFPC10 | 16 | 0.026 | 0.054 | 0.014 | 0.133 | 0.182 | 0.083 | −0.080 | −0.031 | −0.130 | 0.485 | 0.910 | 0.228 | 2.269 | 3.098 | 1.440 | −1.299 | −0.469 | −2.128 | |
| mFPC10 | 16 | 0.013 | 0.077 | 0.019 | 0.164 | 0.234 | 0.094 | −0.138 | −0.068 | −0.208 | 0.258 | 1.543 | 0.386 | 3.283 | 4.688 | 1.877 | −2.766 | −1.360 | −4.172 | |
| HC HbO [µmol/L] | rDLPFC9 | 19 | 0.008 | 0.244 | 0.056 | 0.486 | 0.689 | 0.282 | −0.469 | −0.265 | −0.673 | 0.168 | 4.869 | 1.117 | 9.712 | 13.782 | 5.641 | −9.375 | −5.304 | −13.445 |
| lDLPFC9 | 19 | 0.038 | 0.162 | 0.037 | 0.356 | 0.492 | 0.220 | −0.280 | −0.144 | −0.416 | 0.763 | 3.243 | 0.744 | 7.119 | 9.829 | 4.408 | −5.592 | −2.882 | −8.303 | |
| rDLPFC46 | 19 | −0.022 | 0.241 | 0.055 | 0.451 | 0.653 | 0.249 | −0.495 | −0.294 | −0.697 | −0.444 | 4.822 | 1.106 | 9.007 | 13.038 | 4.976 | −9.895 | −5.864 | −13.926 | |
| lDLPFC46 | 19 | 0.049 | 0.236 | 0.054 | 0.512 | 0.710 | 0.315 | −0.414 | −0.217 | −0.612 | 0.979 | 4.723 | 1.084 | 10.237 | 14.186 | 6.288 | −8.278 | −4.330 | −12.227 | |
| mDLPFC9 | 19 | 0.000 | 0.260 | 0.060 | 0.511 | 0.728 | 0.293 | −0.510 | −0.292 | −0.728 | 0.006 | 5.206 | 1.194 | 10.209 | 14.562 | 5.857 | −10.198 | −5.846 | −14.550 | |
| lFPC10 | 19 | 0.013 | 0.207 | 0.048 | 0.419 | 0.593 | 0.246 | −0.393 | −0.220 | −0.567 | 0.262 | 4.144 | 0.951 | 8.384 | 11.849 | 4.920 | −7.861 | −4.397 | −11.326 | |
| rFPC10 | 19 | 0.038 | 0.182 | 0.042 | 0.396 | 0.548 | 0.243 | −0.319 | −0.167 | −0.471 | 0.244 | 3.039 | 0.697 | 6.201 | 8.742 | 3.660 | −5.713 | −3.172 | −8.254 | |
| mFPC10 | 19 | −0.010 | 0.164 | 0.038 | 0.311 | 0.448 | 0.174 | −0.331 | −0.194 | −0.468 | −0.196 | 3.272 | 0.751 | 6.218 | 8.954 | 3.483 | −6.610 | −3.874 | −9.345 | |
| HC HbR [µmol/L] | rDLPFC9 | 19 | −0.011 | 0.052 | 0.012 | 0.092 | 0.136 | 0.048 | −0.114 | −0.070 | −0.157 | −0.214 | 1.049 | 0.241 | 1.842 | 2.719 | 0.965 | −2.270 | −1.393 | −3.147 |
| lDLPFC9 | 19 | −0.014 | 0.051 | 0.012 | 0.085 | 0.128 | 0.043 | −0.114 | −0.071 | −0.156 | −0.285 | 1.015 | 0.233 | 1.704 | 2.552 | 0.855 | −2.274 | −1.426 | −3.122 | |
| rDLPFC46 | 19 | −0.004 | 0.063 | 0.015 | 0.120 | 0.173 | 0.067 | −0.128 | −0.075 | −0.181 | −0.083 | 1.267 | 0.291 | 2.400 | 3.459 | 1.341 | −2.565 | −1.506 | −3.624 | |
| lDLPFC46 | 19 | 0.001 | 0.072 | 0.017 | 0.142 | 0.203 | 0.082 | −0.140 | −0.080 | −0.201 | 0.019 | 1.443 | 0.331 | 2.846 | 4.052 | 1.640 | −2.809 | −1.603 | −4.015 | |
| mDLPFC9 | 19 | −0.016 | 0.057 | 0.013 | 0.096 | 0.144 | 0.048 | −0.128 | −0.080 | −0.175 | −0.316 | 1.140 | 0.262 | 1.918 | 2.871 | 0.965 | −2.551 | −1.598 | −3.504 | |
| lFPC10 | 19 | −0.005 | 0.045 | 0.010 | 0.084 | 0.122 | 0.046 | −0.094 | −0.056 | −0.132 | −0.103 | 0.907 | 0.208 | 1.674 | 2.432 | 0.916 | −1.880 | −1.122 | −2.638 | |
| rFPC10 | 19 | 0.011 | 0.061 | 0.014 | 0.131 | 0.182 | 0.080 | −0.109 | −0.058 | −0.160 | 0.133 | 0.981 | 0.225 | 2.055 | 2.875 | 1.235 | −1.790 | −0.970 | −2.610 | |
| mFPC10 | 19 | −0.012 | 0.064 | 0.015 | 0.113 | 0.166 | 0.059 | −0.137 | −0.084 | −0.191 | −0.247 | 1.275 | 0.292 | 2.251 | 3.317 | 1.186 | −2.745 | −1.680 | −3.811 | |
| Bland and Altman (Test–Retest) | Slope Coefficient | |||||||||||||||||||
| Upper LoA | Lower LoA | |||||||||||||||||||
| n | Mean | SD | SE | LoA | upper CI | lower CI | LoA | upper CI | lower CI | |||||||||||
| MS HbO [µmol/L] | rDLPFC9 | 16 | 0.167 | 0.329 | 0.082 | 0.812 | 1.111 | 0.512 | −0.478 | −0.178 | −0.777 | |||||||||
| lDLPF9 | 16 | 0.385 | 0.225 | 0.056 | 0.826 | 1.031 | 0.621 | −0.055 | 0.149 | −0.260 | ||||||||||
| rDLPFC46 | 16 | −0.014 | 0.417 | 0.104 | 0.803 | 1.183 | 0.423 | −0.831 | −0.452 | −1.211 | ||||||||||
| lDLPFC46 | 16 | 0.179 | 0.394 | 0.099 | 0.952 | 1.311 | 0.593 | −0.594 | −0.235 | −0.953 | ||||||||||
| mDLPFC9 | 16 | 0.028 | 0.404 | 0.101 | 0.818 | 1.186 | 0.451 | −0.763 | −0.396 | −1.131 | ||||||||||
| lFPC10 | 16 | 0.022 | 0.247 | 0.062 | 0.506 | 0.731 | 0.281 | −0.461 | −0.236 | −0.686 | ||||||||||
| rFPC10 | 16 | −0.041 | 0.269 | 0.067 | 0.486 | 0.731 | 0.241 | −0.568 | −0.323 | −0.813 | ||||||||||
| mFPC10 | 16 | −0.033 | 0.296 | 0.074 | 0.547 | 0.817 | 0.278 | −0.613 | −0.343 | −0.883 | ||||||||||
| MS HbR [µmol/L] | rDLPFC9 | 16 | −0.108 | 0.049 | 0.012 | −0.012 | 0.033 | −0.057 | −0.205 | −0.160 | −0.249 | |||||||||
| lDLPFC9 | 16 | −0.105 | 0.073 | 0.018 | 0.038 | 0.104 | −0.029 | −0.248 | −0.182 | −0.315 | ||||||||||
| rDLPFC46 | 16 | 0.062 | 0.144 | 0.036 | 0.345 | 0.477 | 0.213 | −0.221 | −0.090 | −0.353 | ||||||||||
| lDLPFC46 | 16 | −0.015 | 0.103 | 0.026 | 0.186 | 0.280 | 0.093 | −0.217 | −0.123 | −0.311 | ||||||||||
| mDLPFC9 | 16 | 0.009 | 0.115 | 0.029 | 0.233 | 0.338 | 0.129 | −0.216 | −0.112 | −0.321 | ||||||||||
| lFPC10 | 16 | −0.018 | 0.072 | 0.018 | 0.123 | 0.189 | 0.058 | −0.159 | −0.093 | −0.224 | ||||||||||
| rFPC10 | 16 | 0.022 | 0.054 | 0.014 | 0.128 | 0.177 | 0.079 | −0.085 | −0.035 | −0.134 | ||||||||||
| mFPC10 | 16 | 0.013 | 0.098 | 0.025 | 0.205 | 0.294 | 0.116 | −0.179 | −0.090 | −0.269 | ||||||||||
| HC HbO [µmol/L] | rDLPFC9 | 19 | 0.065 | 0.120 | 0.027 | 0.300 | 0.400 | 0.200 | −0.169 | −0.069 | −0.270 | |||||||||
| lDLPF9 | 19 | −0.029 | 0.129 | 0.030 | 0.224 | 0.331 | 0.116 | −0.281 | −0.173 | −0.388 | ||||||||||
| rDLPFC46 | 19 | −0.107 | 0.305 | 0.070 | 0.490 | 0.745 | 0.236 | −0.704 | −0.449 | −0.959 | ||||||||||
| lDLPFC46 | 19 | 0.046 | 0.312 | 0.071 | 0.656 | 0.917 | 0.396 | −0.565 | −0.305 | −0.826 | ||||||||||
| mDLPFC9 | 19 | −0.071 | 0.284 | 0.065 | 0.486 | 0.724 | 0.248 | −0.629 | −0.391 | −0.867 | ||||||||||
| lFPC10 | 19 | 0.010 | 0.245 | 0.056 | 0.490 | 0.694 | 0.285 | −0.469 | −0.265 | −0.674 | ||||||||||
| rFPC10 | 19 | −0.018 | 0.154 | 0.035 | 0.284 | 0.413 | 0.155 | −0.320 | −0.191 | −0.449 | ||||||||||
| mFPC10 | 19 | −0.001 | 0.198 | 0.045 | 0.387 | 0.552 | 0.221 | −0.388 | −0.223 | −0.553 | ||||||||||
| HC HbR [µmol/L] | rDLPFC9 | 19 | 0.008 | 0.042 | 0.010 | 0.090 | 0.125 | 0.055 | −0.074 | −0.039 | −0.109 | |||||||||
| lDLPF9 | 19 | 0.012 | 0.043 | 0.010 | 0.097 | 0.133 | 0.060 | −0.073 | −0.037 | −0.110 | ||||||||||
| rDLPFC46 | 19 | −0.016 | 0.083 | 0.019 | 0.147 | 0.216 | 0.077 | −0.180 | −0.110 | −0.249 | ||||||||||
| lDLPFC46 | 19 | −0.023 | 0.069 | 0.016 | 0.114 | 0.172 | 0.055 | −0.159 | −0.101 | −0.217 | ||||||||||
| mDLPFC9 | 19 | 0.006 | 0.074 | 0.017 | 0.151 | 0.213 | 0.089 | −0.140 | −0.078 | −0.202 | ||||||||||
| lFPC10 | 19 | −0.009 | 0.070 | 0.016 | 0.128 | 0.186 | 0.070 | −0.145 | −0.087 | −0.203 | ||||||||||
| rFPC10 | 19 | −0.005 | 0.045 | 0.010 | 0.084 | 0.121 | 0.046 | −0.093 | −0.055 | −0.130 | ||||||||||
| mFPC10 | 19 | −0.021 | 0.054 | 0.012 | 0.085 | 0.131 | 0.040 | −0.128 | −0.082 | −0.173 | ||||||||||
© 2020 by the authors. Licensee MDPI, Basel, Switzerland. This article is an open access article distributed under the terms and conditions of the Creative Commons Attribution (CC BY) license (http://creativecommons.org/licenses/by/4.0/).
Share and Cite
Broscheid, K.-C.; Hamacher, D.; Lamprecht, J.; Sailer, M.; Schega, L. Inter-Session Reliability of Functional Near-Infrared Spectroscopy at the Prefrontal Cortex While Walking in Multiple Sclerosis. Brain Sci. 2020, 10, 643. https://doi.org/10.3390/brainsci10090643
Broscheid K-C, Hamacher D, Lamprecht J, Sailer M, Schega L. Inter-Session Reliability of Functional Near-Infrared Spectroscopy at the Prefrontal Cortex While Walking in Multiple Sclerosis. Brain Sciences. 2020; 10(9):643. https://doi.org/10.3390/brainsci10090643
Chicago/Turabian StyleBroscheid, Kim-Charline, Dennis Hamacher, Juliane Lamprecht, Michael Sailer, and Lutz Schega. 2020. "Inter-Session Reliability of Functional Near-Infrared Spectroscopy at the Prefrontal Cortex While Walking in Multiple Sclerosis" Brain Sciences 10, no. 9: 643. https://doi.org/10.3390/brainsci10090643
APA StyleBroscheid, K.-C., Hamacher, D., Lamprecht, J., Sailer, M., & Schega, L. (2020). Inter-Session Reliability of Functional Near-Infrared Spectroscopy at the Prefrontal Cortex While Walking in Multiple Sclerosis. Brain Sciences, 10(9), 643. https://doi.org/10.3390/brainsci10090643