Behavioral Deficits in Juvenile Onset Huntington’s Disease

 ,
, 
Abstract
1. Introduction
2. Materials and Methods
2.1. Participants
2.2. Genetic Analysis
2.3. Motor Rating
2.4. Behavioral Measures
2.5. Statistical Analyses
3. Results
3.1. Sample
3.2. Behavioral Performance Group Differences
3.3. Genetic Expansion Correlations
3.4. BRIEF-A Report Type Differences
4. Discussion
5. Conclusions
Supplementary Materials
Author Contributions
Funding
Acknowledgments
Conflicts of Interest
References
- Barker, R.A.; Squitieri, F. The clinical phenotype of juvenile Huntington’s Disease. In Juvenile Huntington’s Disease and Other Trinucleotide Repeat Disorders; Quarrell, O.W.J., Brewer, H.M., Squitieri, F., Barker, R.A., Nance, M.A., Landwehrmeyer, G.B., Eds.; Oxford University Press: New York, NY, USA, 2009; pp. 39–50. [Google Scholar]
- Fusilli, C.; Migliore, S.; Mazza, T.; Consoli, F.; De Luca, A.; Barbagallo, G.; Ciammola, A.; Gatto, E.M.; Cesarini, M.; Etcheverry, J.L.; et al. Biological and clinical manifestations of juvenile Huntington’s disease: A retrospective analysis. Lancet Neurol. 2018, 17, 986–993. [Google Scholar] [CrossRef]
- Gonzalez-Alegre, P.; Afifi, A.K. Clinical characteristics of childhood-onset (juvenile) Huntington disease: Report of 12 patients and review of the literature. J. Child. Neurol. 2006, 21, 223–229. [Google Scholar] [CrossRef] [PubMed]
- Moser, A.D.; Epping, E.; Espe-Pfeifer, P.; Martin, E.; Zhorne, L.; Mathews, K.; Nance, M.; Hudgell, D.; Quarrell, O.; Nopoulos, P. A survey-based study identifies common but unrecognized symptoms in a large series of juvenile Huntington’s disease. Neurodegener. Dis. Manag. 2017, 7, 307–315. [Google Scholar] [CrossRef] [PubMed]
- Ribai, P.; Nguyen, K.; Hahn-Barma, V.; Gourfinkel-An, I.; Vidailhet, M.; Legout, A.; Dode, C.; Brice, A.; Durr, A. Psychiatric and cognitive difficulties as indicators of juvenile Huntington disease onset in 29 patients. Arch. Neurol. 2007, 64, 813–819. [Google Scholar] [CrossRef] [PubMed]
- Smith, J.A.; Brewer, H.M.; Eatough, V.; Stanley, C.A.; Glendinning, N.W.; Quarrell, O.W. The personal experience of juvenile Huntington’s disease: An interpretative phenomenological analysis of parents’ accounts of the primary features of a rare genetic condition. Clin. Genet. 2006, 69, 486–496. [Google Scholar] [CrossRef] [PubMed]
- Cronin, T.; Rosser, A.; Massey, T. Clinical Presentation and Features of Juvenile-Onset Huntington’s Disease: A Systematic Review. J. Huntingt. Dis. 2019, 8, 171–179. [Google Scholar] [CrossRef] [PubMed]
- Nance, M.A. The treatment of juvenile Huntington’s disease. In Juvenile Huntington’s Disease and Other Trinucleotide Repeat Disorders; Quarrell, O.W.J., Brewer, H.M., Squitieri, F., Barker, R.A., Nance, M.A., Landwehrmeyer, G.B., Eds.; Oxford University Press: New York, NY, USA, 2009; pp. 151–166. [Google Scholar]
- Poniatowska, R.; Habib, N.; Krawczyk, R.; Rakowicz, M.; Niedzielska, K.; Hoffman, D.; Jakubowska, T.; Bogusławska, R. Correlation between magnetic resonance and genetic, clinical, neurophysiological and neuropsychological studies of patients with juvenile form of Huntington’s disease. Case Rep. Clin. Pract. Rev. 2001, 2, 140–146. [Google Scholar]
- Quigley, J. Juvenile Huntington’s Disease: Diagnostic and Treatment Considerations for the Psychiatrist. Curr. Psychiatry Rep. 2017, 19, 9. [Google Scholar] [CrossRef] [PubMed]
- Rasmussen, A.; Macias, R.; Yescas, P.; Ochoa, A.; Davila, G.; Alonso, E. Huntington disease in children: Genotype-phenotype correlation. Neuropediatrics 2000, 31, 190–194. [Google Scholar] [CrossRef] [PubMed]
- Van der Plas, E.; Langbehn, D.R.; Conrad, A.L.; Koscik, T.R.; Tereshchenko, A.; Epping, E.A.; Magnotta, V.A.; Nopoulos, P.C. Abnormal brain development in child and adolescent carriers of mutant huntingtin. Neurology 2019, 93, e1021–e1030. [Google Scholar] [CrossRef] [PubMed]
- Vijayakumar, N.; Mills, K.L.; Alexander-Bloch, A.; Tamnes, C.K.; Whittle, S. Structural brain development: A review of methodological approaches and best practices. Dev. Cogn. Neurosci. 2018, 33, 129–148. [Google Scholar] [CrossRef] [PubMed]
- Gioia, G.A.; Isquith, P.; Guy, S.; Kenworthy, L. Behavior Rating Inventory of Executive Function: Professional Manual; Psychological Assessment Resources, Inc.: Odessa, FL, USA, 2000. [Google Scholar]
- Lindgren, S.; Koeppl, G. Assessing Child Behavior Problems in a Medical Setting: Development of the Pediatric Behavior Scale. In Advances in Behavioral Assessment of Children and Families; Prinz, E., Ed.; JAI: Greenwich, CT, USA, 1987; pp. 57–90. [Google Scholar]
- Quarrell, O.W.; Nance, M.A.; Nopoulos, P.; Paulsen, J.S.; Smith, J.A.; Squitieri, F. Managing juvenile Huntington’s disease. Neurodegener. Dis. Manag. 2013, 3, 267–276. [Google Scholar] [CrossRef] [PubMed]
- Klonsky, E.D.; Oltmanns, T.F. Informant-reports of personality disorder: Relation to self-reports and future research directions. Clin. Psychol. Sci. Pract. 2002, 9, 300–311. [Google Scholar] [CrossRef]
- Quarrell, O.; O’Donovan, K.L.; Bandmann, O.; Strong, M. The Prevalence of Juvenile Huntington’s Disease: A Review of the Literature and Meta-Analysis. PLoS Curr. 2012, 4, e4f8606b8742ef8603. [Google Scholar] [CrossRef] [PubMed]
- McCusker, E.; Loy, C.T. The many facets of unawareness in huntington disease. Tremor Other Hyperkinet. Mov. 2014, 4, 257. [Google Scholar] [CrossRef]


| GNE (N = 203) | JOHD (N = 49) | |
|---|---|---|
| Age | ||
| Mean (SD) | 13.5 (3.87) | 15.2 (5.55) |
| Median (Min, Max) | 13.7 (6.00, 22.5) | 15.8 (5.08, 25.1) |
| Sex | ||
| Females | 120 (59.1%) | 29 (59.2%) |
| Males | 83 (40.9%) | 20 (40.8%) |
| CAG | ||
| Median (Min, Max) | 19.0 (15.0, 34.0) | 76.0 (54.0, 102) |
| TMS | ||
| Mean (SD) | 1.28 (2.67) | 58.0 (21.3) |
| Median (Min, Max) | 0 (0, 17.0) | 55.0 (19.0, 103) |
| Variable | Diff Means | t-Value (df) | FDR | Marg Mean GNE | 95% CI GNE | Marg Mean JOHD | 95% CI JOHD |
|---|---|---|---|---|---|---|---|
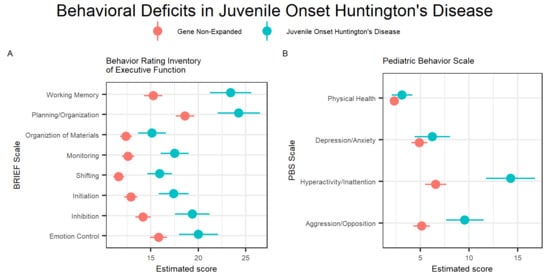
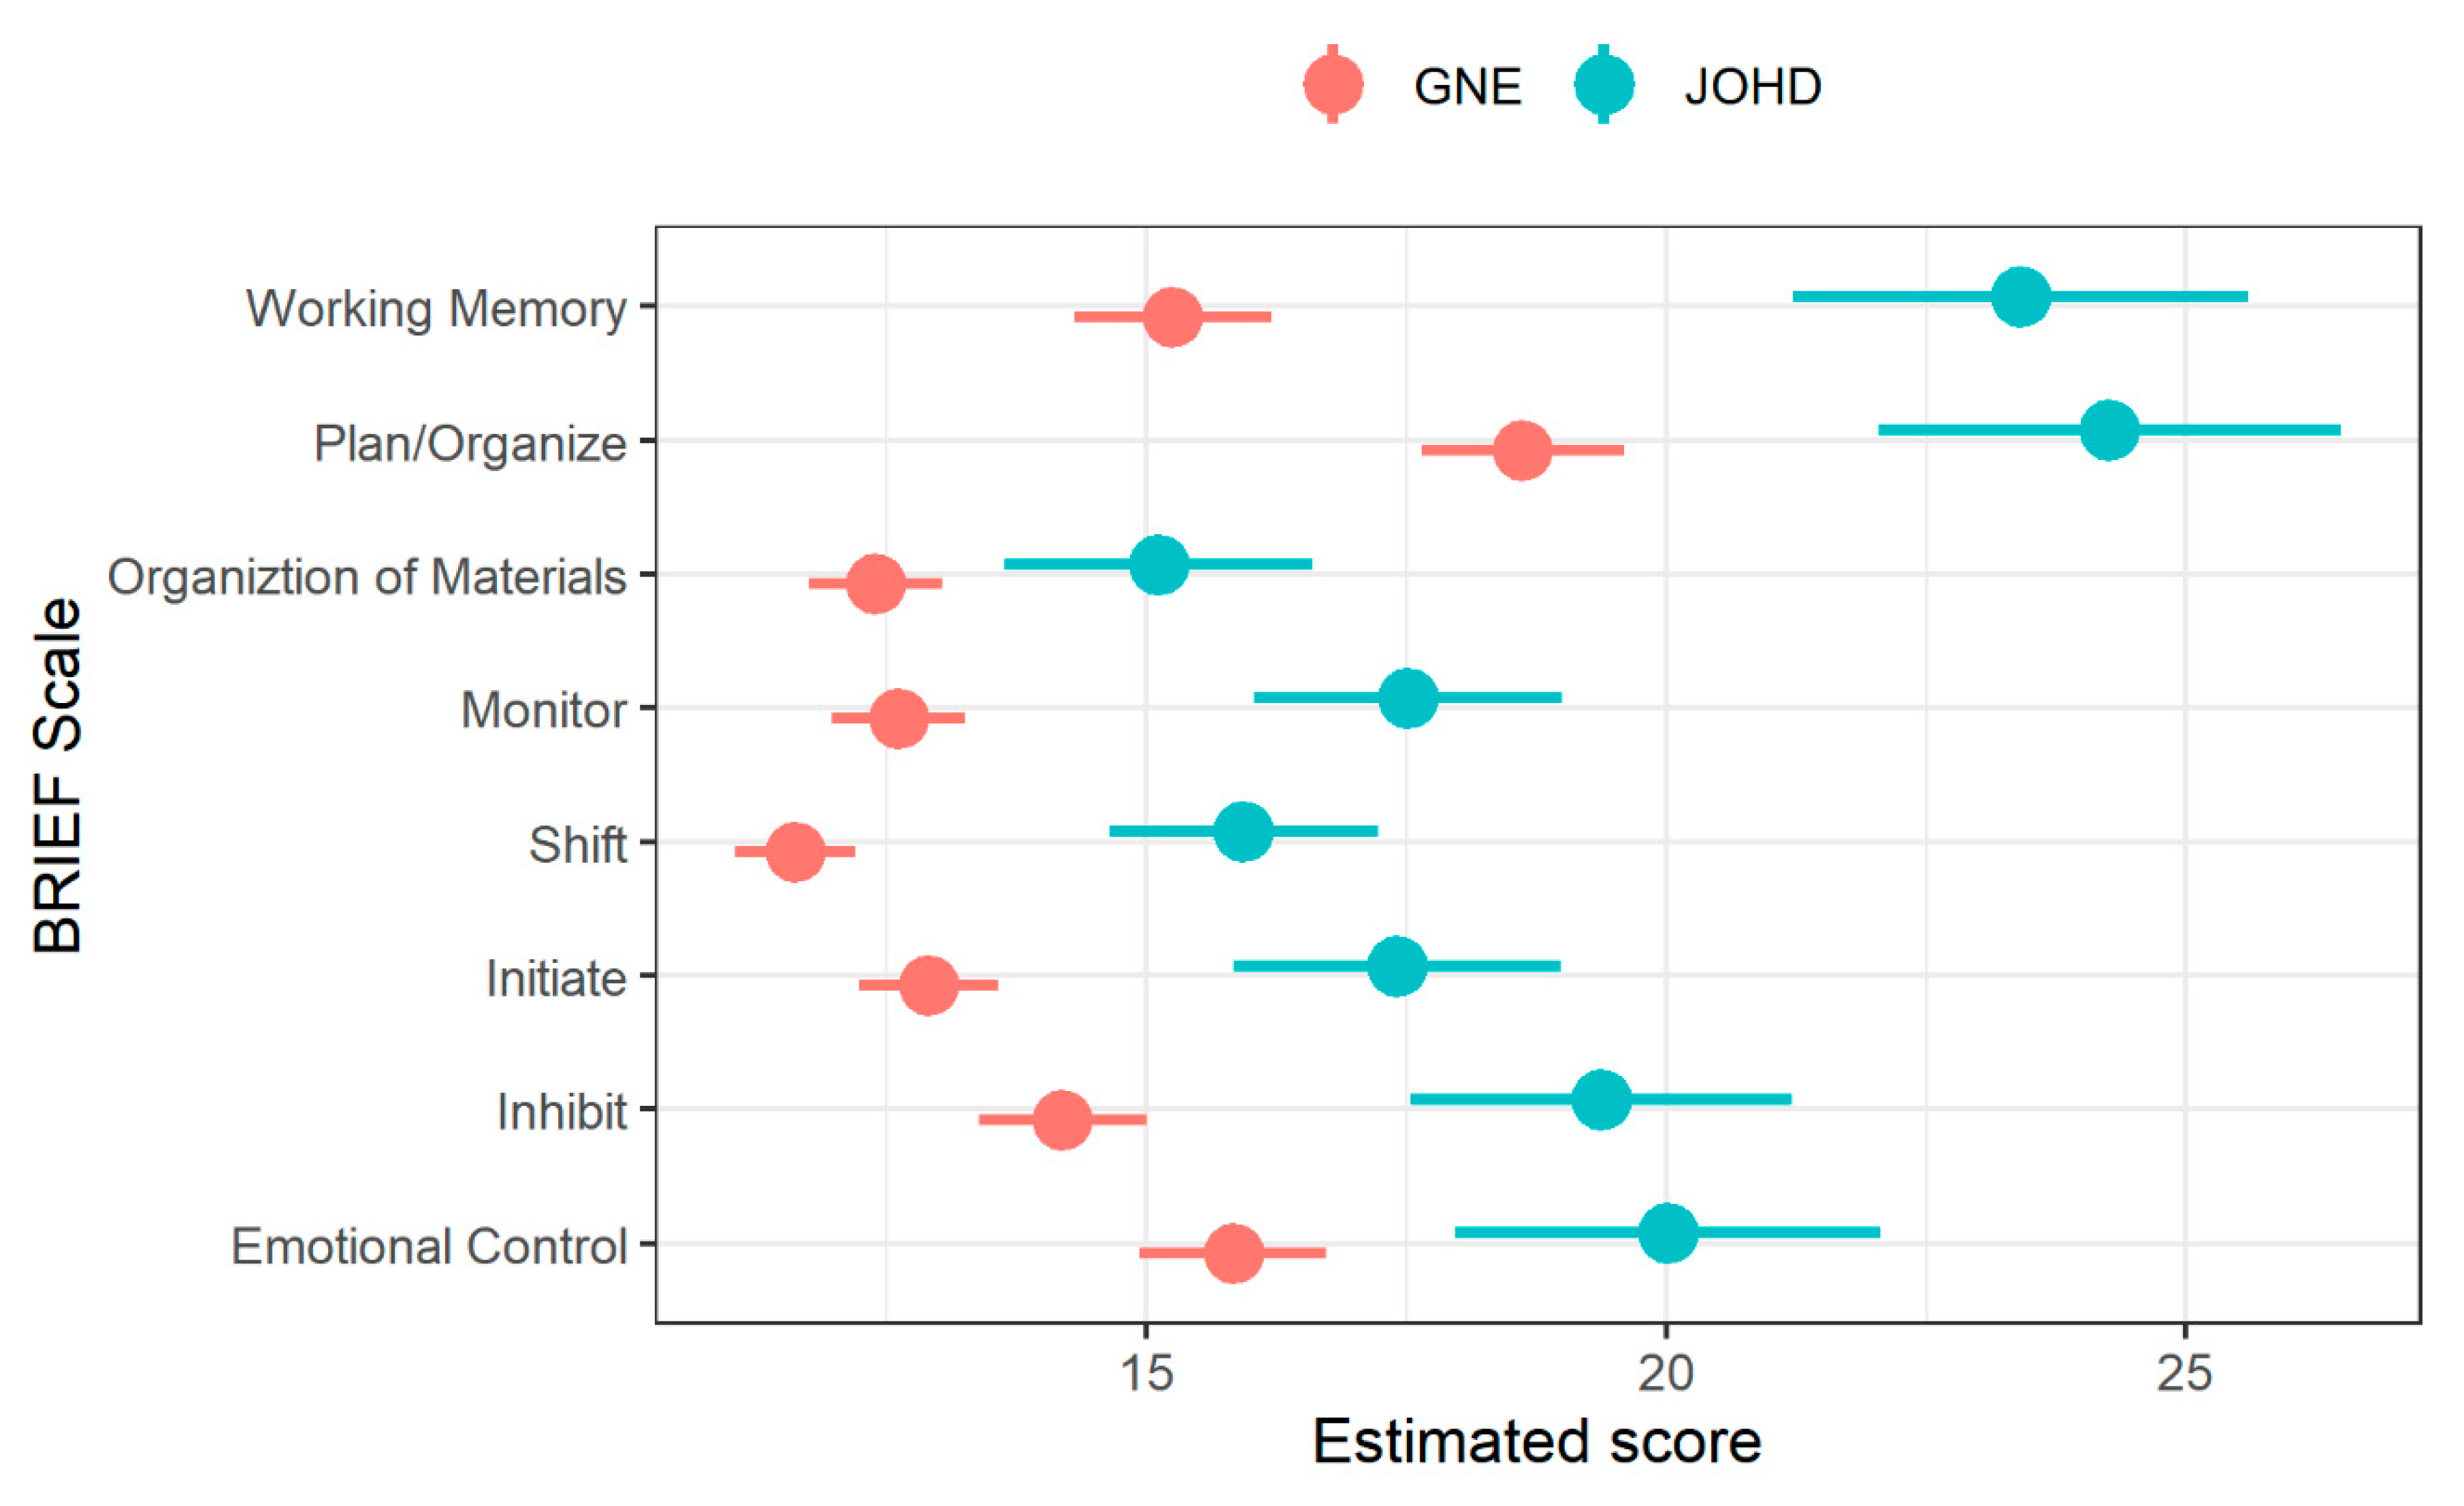
| Emotional Control | −4.19 | t(120) = −3.68 | 0.000466 * | 15.83 | 14.93: 16.73 | 20.02 | 17.96: 22.08 |
| Inhibit | −5.18 | t(120) = −5.1 | 2.62 × 10⁻⁶ * | 14.19 | 13.39: 15.00 | 19.37 | 17.53: 21.21 |
| Initiate | −4.5 | t(117) = −5.16 | 2.43 × 10⁻⁶ * | 12.91 | 12.23: 13.58 | 17.41 | 15.82: 19.00 |
| Shift | −4.31 | t(110) = −5.99 | 1.19 × 10⁻⁷ * | 11.62 | 11.04: 12.19 | 15.93 | 14.63: 17.23 |
| Self-Monitor | −4.89 | t(112) = −5.96 | 1.19 × 10⁻⁷ * | 12.62 | 11.98: 13.26 | 17.51 | 16.02: 19.00 |
| Organization of Materials | −2.72 | t(115) = −3.32 | 0.00147 * | 12.40 | 11.75: 13.04 | 15.12 | 13.63: 16.60 |
| Plan/Organize | −5.65 | t(115) = −4.58 | 2.02 × 10⁻⁵ * | 18.62 | 17.64: 19.60 | 24.27 | 22.04: 26.50 |
| Working Memory | −8.16 | t(120) = −6.73 | 7.42 × 10⁻⁹ * | 15.25 | 14.30: 16.21 | 23.41 | 21.21: 25.61 |
| Aggression/Opposition | −4.42 | t(119) = −4.11 | 0.000109 * | 5.15 | 4.30: 6.01 | 9.57 | 7.63: 11.51 |
| Hyperactivity/Inattention | −7.7 | t(117) = −5.51 | 6.5 × 10⁻⁷ * | 6.58 | 5.47: 7.69 | 14.28 | 11.75: 16.80 |
| Depression/Anxiety | −1.34 | t(95.8) = −1.31 | 0.192 | 4.91 | 4.09: 5.73 | 6.25 | 4.41: 8.08 |
| Physical Health | −0.798 | t(102) = −1.35 | 0.192 | 2.34 | 1.87: 2.81 | 3.14 | 2.07: 4.21 |
| Variable | Coefficient | 95% CI | t-Value (df) | p-Value |
|---|---|---|---|---|
| Emotional Control | −0.08 | −0.35: 0.19 | t(47) = −0.615 | 0.548 |
| Inhibit | −0.23 | −0.45: −0.01 | t(47) = −2.08 | 0.0479 * |
| Shift | −0.04 | −0.18: 0.11 | t(47) = −0.493 | 0.627 |
| Working Memory | −0.24 | −0.53: 0.04 | t(47) = −1.71 | 0.102 |
| Plan/Organize | −0.26 | −0.50: −0.03 | t(47) = −2.24 | 0.0343 * |
| Initiate | −0.18 | −0.32: −0.05 | t(46) = −2.68 | 0.0126 * |
| Self-Monitor | −0.16 | −0.33: 0.01 | t(46) = −1.87 | 0.0723 |
| Organization of Materials | −0.15 | −0.36: 0.06 | t(46) = −1.43 | 0.166 |
| Aggression/Opposition | −0.30 | −0.57: −0.03 | t(47) = −2.21 | 0.0379 * |
| Hyperactivity/Inattention | −0.23 | −0.51: 0.05 | t(47) = −1.68 | 0.114 |
| Variable | Diff Means | t-Value (df) | FDR | Marg Mean GNE | 95% CI GNE | Marg Mean JOHD | 95% CI JOHD |
|---|---|---|---|---|---|---|---|
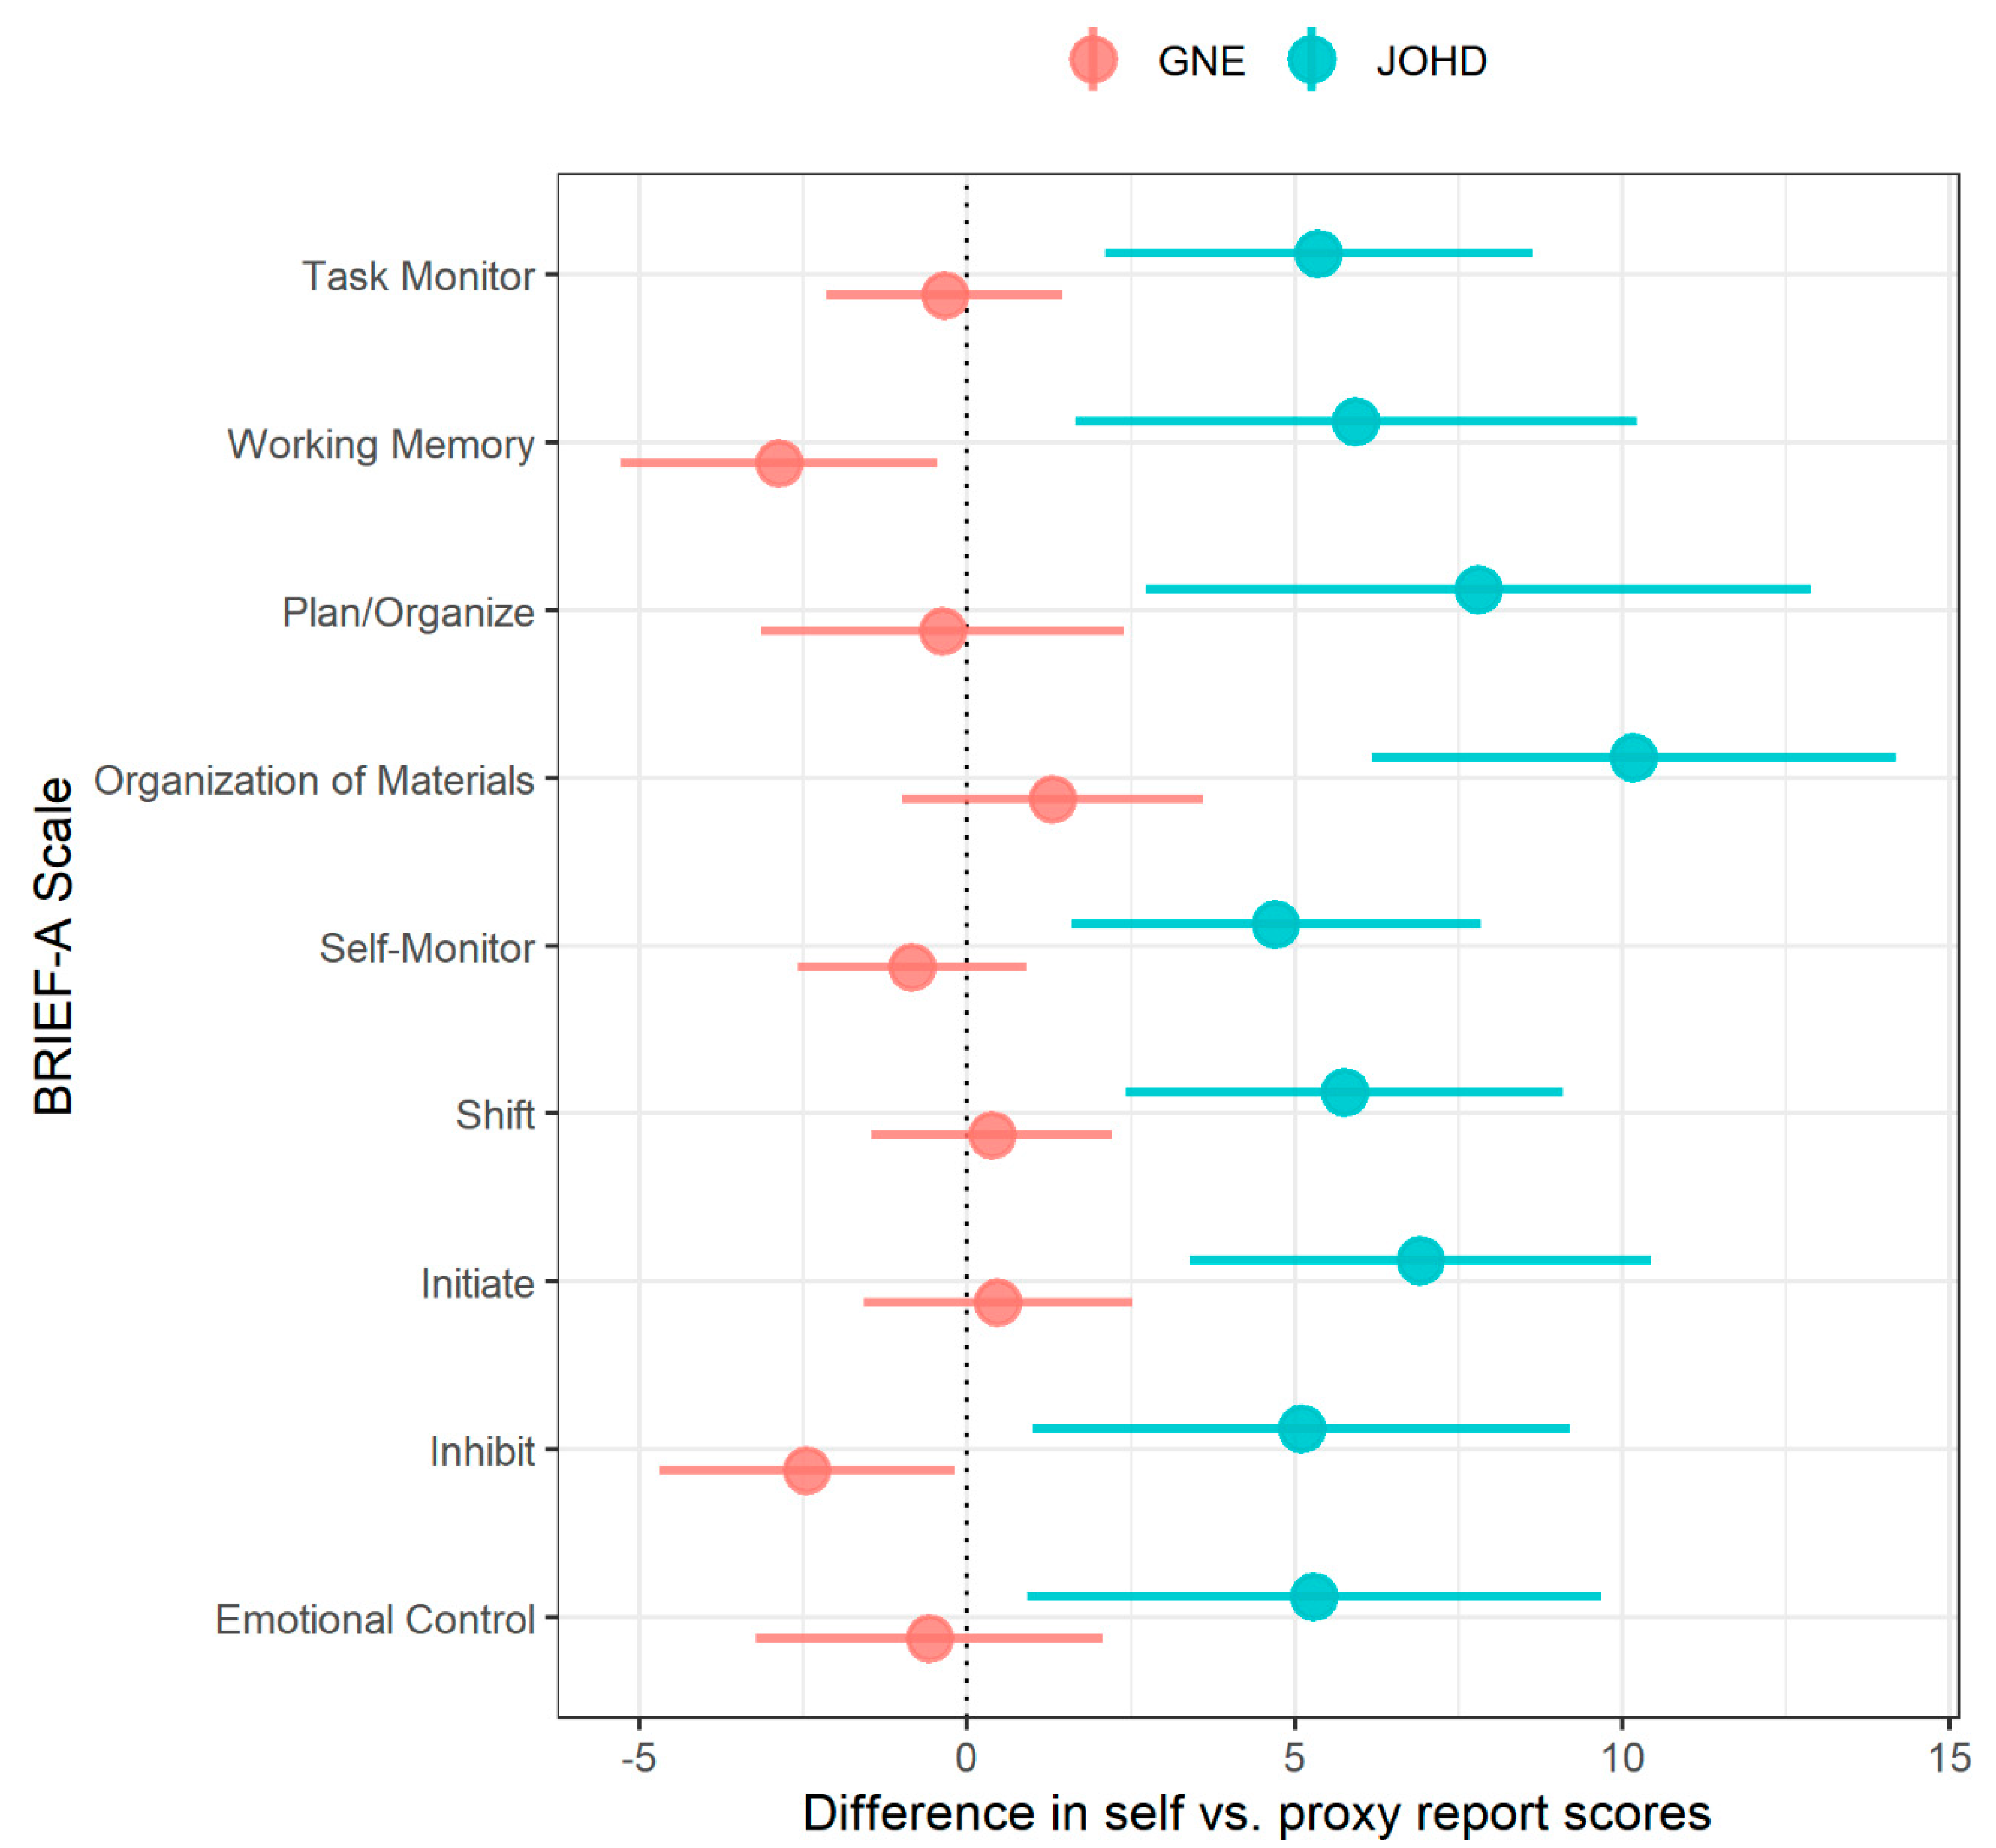
| Emotional Control | −5.88 | t(18.6) = −2.13 | 0.0466 * | −0.58 | 3.25: 2.09 | 5.30 | 0.73: 9.87 |
| Inhibit | −7.55 | t(25.1) = −3.06 | 0.0117 * | −2.45 | −4.72: −0.18 | 5.10 | 0.96: 9.24 |
| Initiate | −6.45 | t(20.4) = −2.96 | 0.0117 * | 0.47 | −1.60: 2.54 | 6.92 | 3.29: 10.54 |
| Shift | −5.39 | t(25.2) = −2.68 | 0.0145 * | 0.37 | −1.48: 2.22 | 5.76 | 2.38: 9.13 |
| Self-Monitor | −5.56 | t(24.6) = −2.93 | 0.0117 * | −0.85 | −2.60: 0.90 | 4.71 | 1.55: 7.88 |
| Organization of Materials | −8.88 | t(20.7) = −3.6 | 0.0113 * | 1.29 | −1.02: 3.61 | 10.18 | 6.07: 14.29 |
| Plan/ Organize | −8.18 | t(25.5) = −2.71 | 0.0145 * | −0.38 | −3.17: 2.41 | 7.80 | 2.67: 12.93 |
| Working Memory | −8.81 | t(24.4) = −3.37 | 0.0113 * | −2.87 | −5.30: −0.45 | 5.94 | 1.59: 10.28 |
| Task Monitor | −5.71 | t(24.9) = −2.89 | 0.0117 * | −0.35 | −2.16: 1.47 | 5.37 | 2.06: 8.67 |
© 2020 by the authors. Licensee MDPI, Basel, Switzerland. This article is an open access article distributed under the terms and conditions of the Creative Commons Attribution (CC BY) license (http://creativecommons.org/licenses/by/4.0/).
Share and Cite
Langbehn, K.E.; Cochran, A.M.; van der Plas, E.; Conrad, A.L.; Epping, E.; Martin, E.; Espe-Pfeifer, P.; Nopoulos, P. Behavioral Deficits in Juvenile Onset Huntington’s Disease. Brain Sci. 2020, 10, 543. https://doi.org/10.3390/brainsci10080543
Langbehn KE, Cochran AM, van der Plas E, Conrad AL, Epping E, Martin E, Espe-Pfeifer P, Nopoulos P. Behavioral Deficits in Juvenile Onset Huntington’s Disease. Brain Sciences. 2020; 10(8):543. https://doi.org/10.3390/brainsci10080543
Chicago/Turabian StyleLangbehn, Kathleen E., Ashley M. Cochran, Ellen van der Plas, Amy L. Conrad, Eric Epping, Erin Martin, Patricia Espe-Pfeifer, and Peg Nopoulos. 2020. "Behavioral Deficits in Juvenile Onset Huntington’s Disease" Brain Sciences 10, no. 8: 543. https://doi.org/10.3390/brainsci10080543
APA StyleLangbehn, K. E., Cochran, A. M., van der Plas, E., Conrad, A. L., Epping, E., Martin, E., Espe-Pfeifer, P., & Nopoulos, P. (2020). Behavioral Deficits in Juvenile Onset Huntington’s Disease. Brain Sciences, 10(8), 543. https://doi.org/10.3390/brainsci10080543