A Tightly Coupled GIS and Spatiotemporal Modeling for Methane Emission Simulation in the Underground Coal Mine System


Abstract
:
1. Introduction
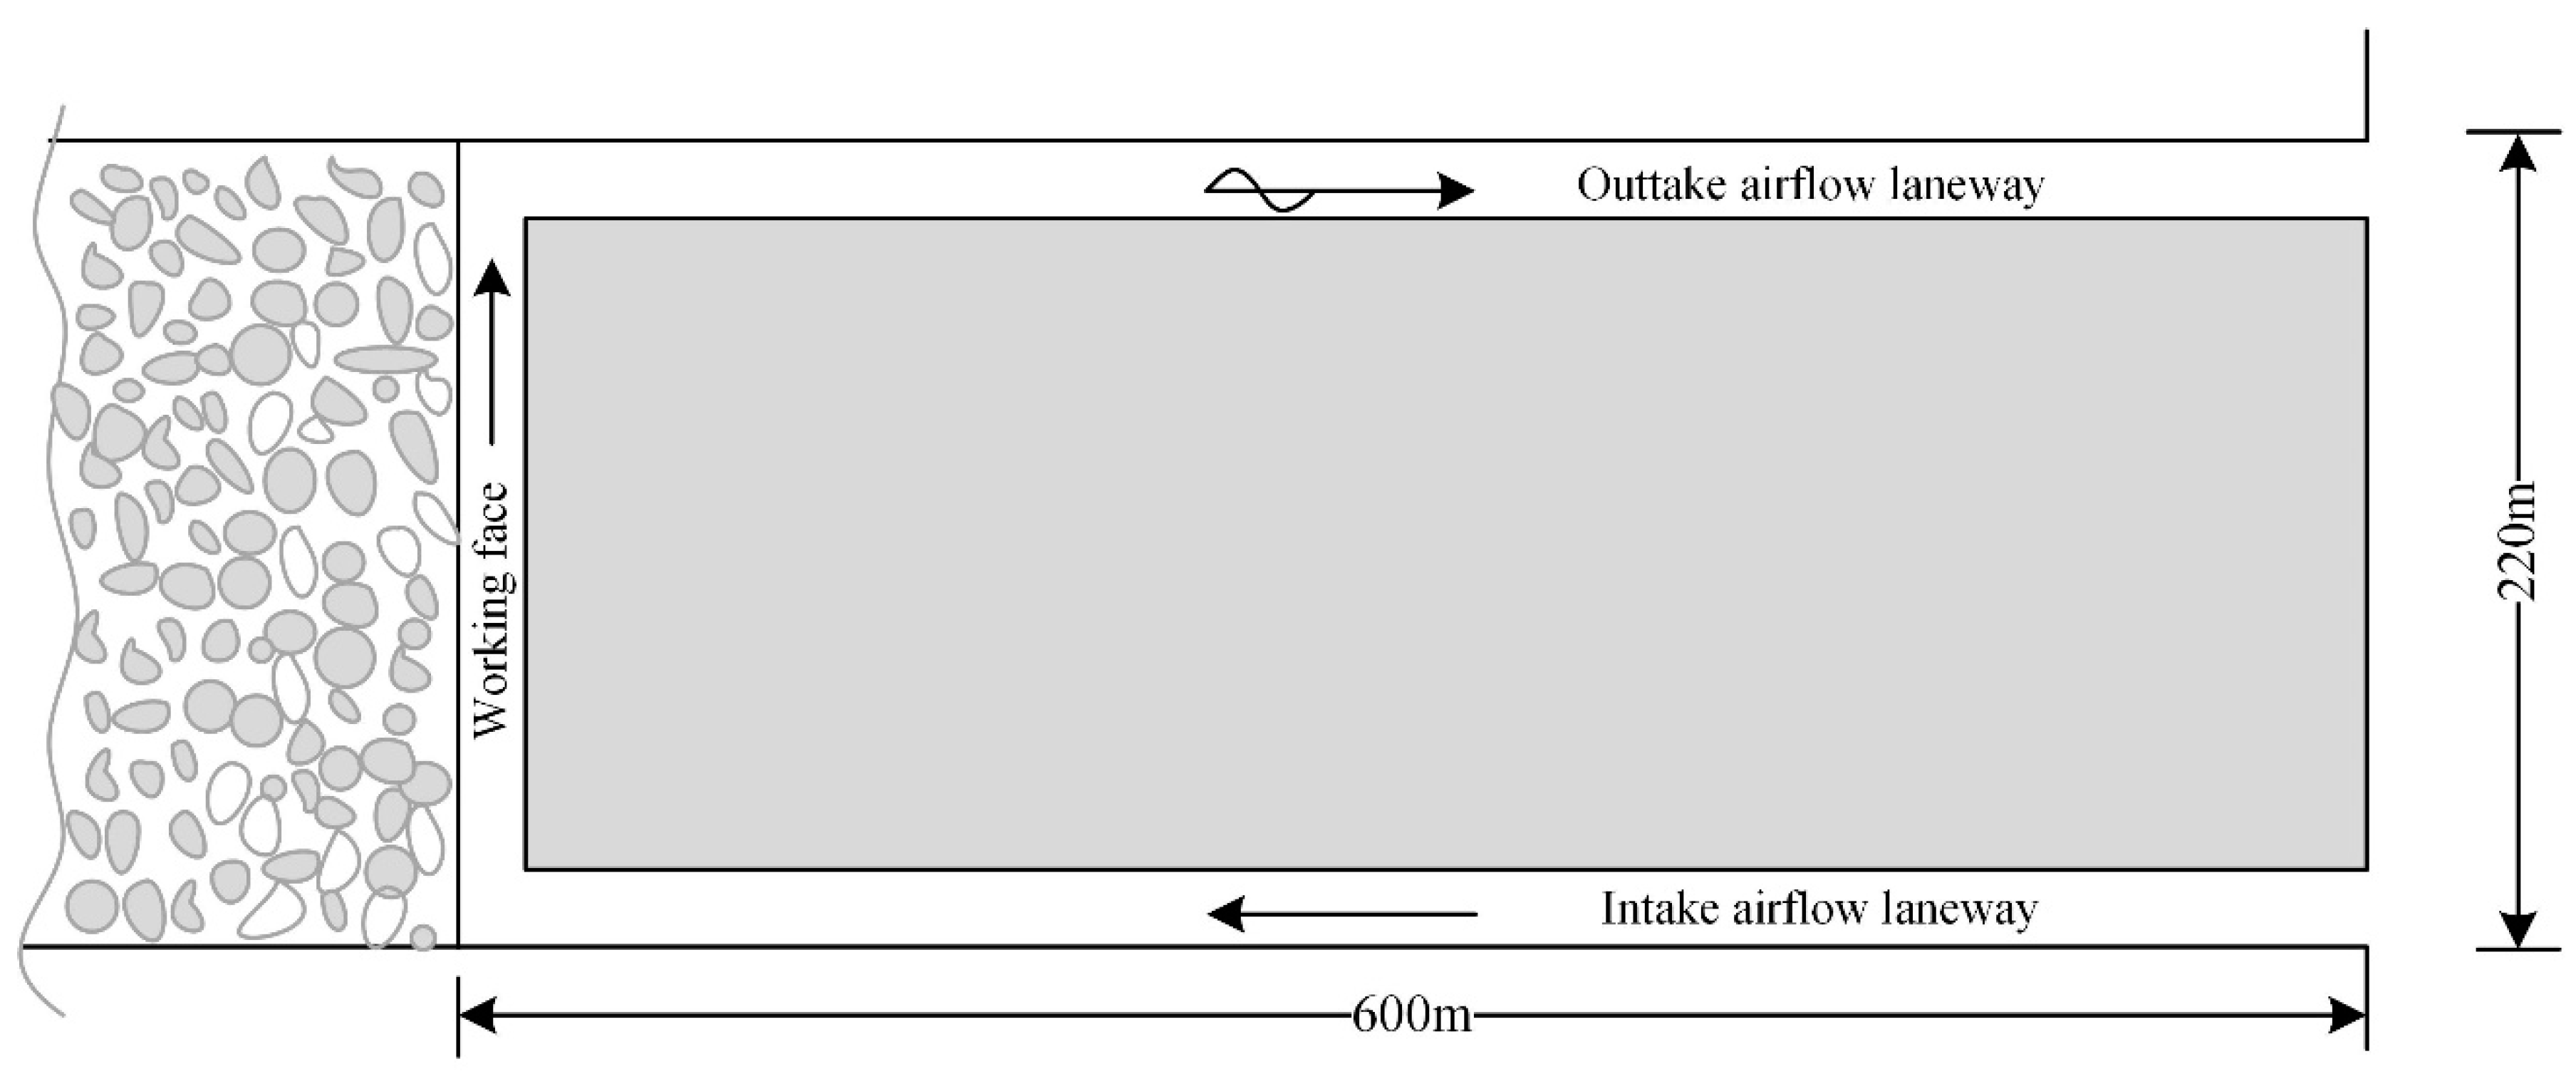
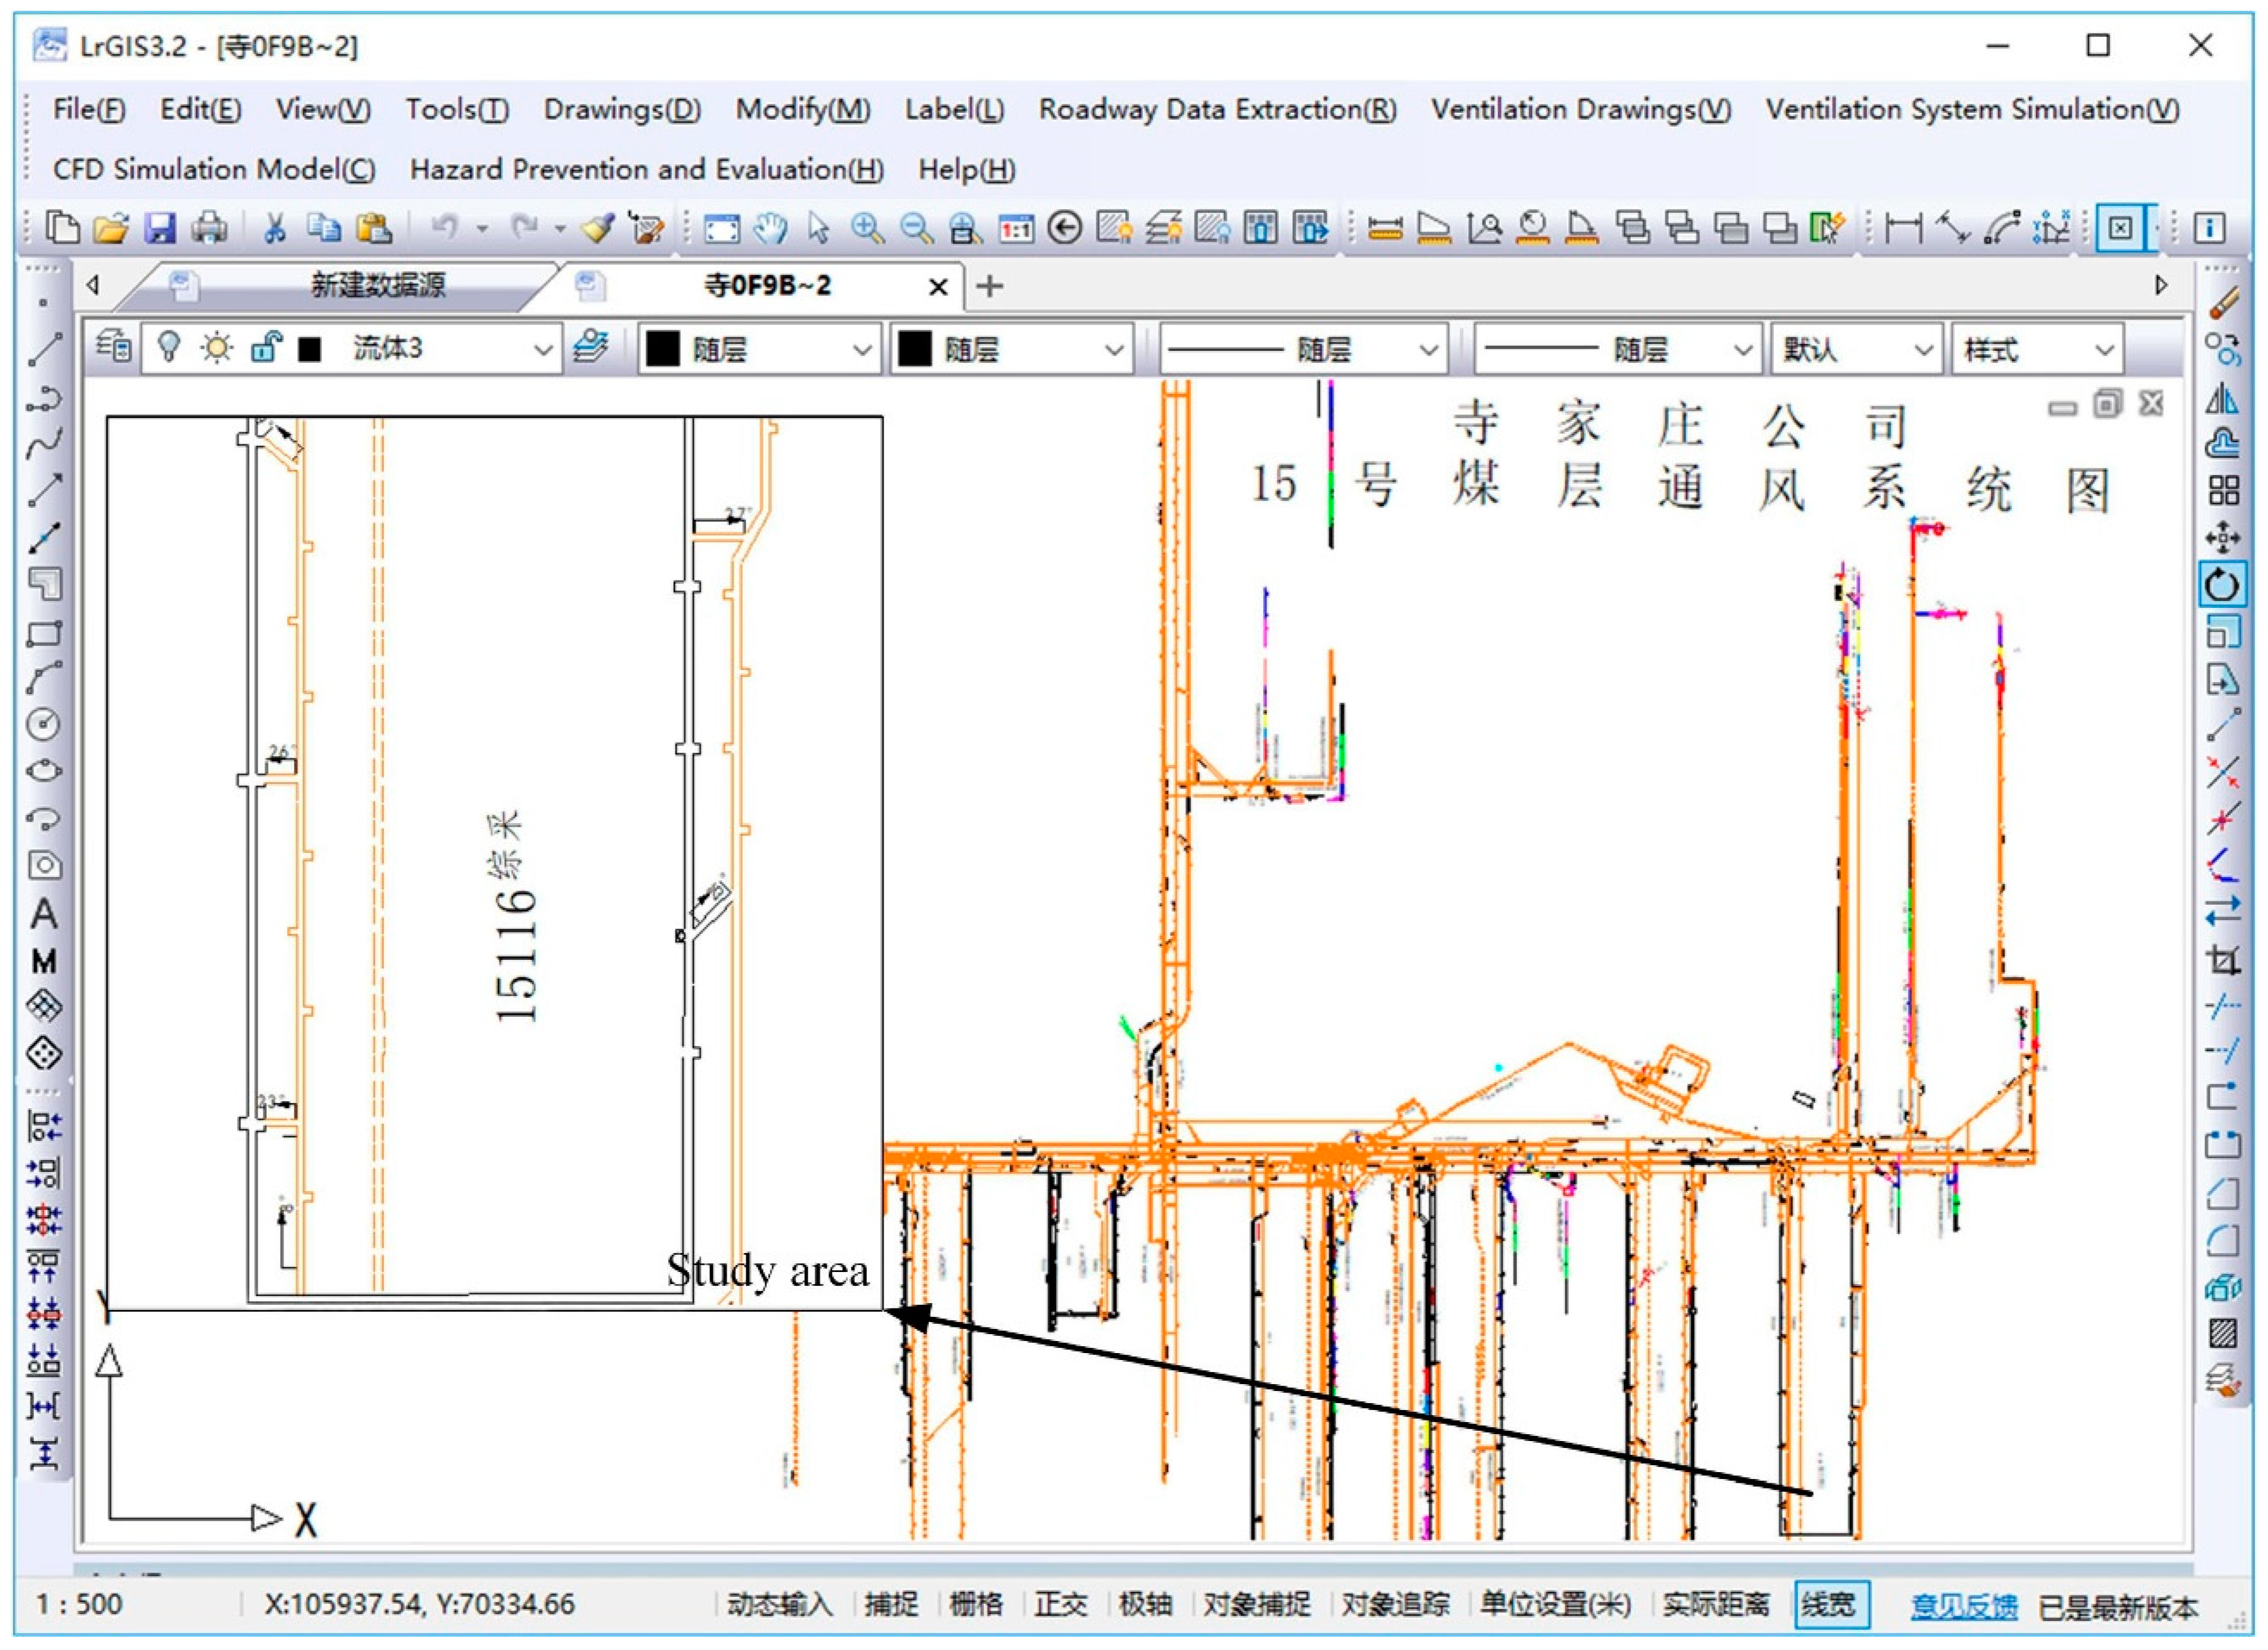
2. Case Study
3. Model-GIS Coupling Strategy
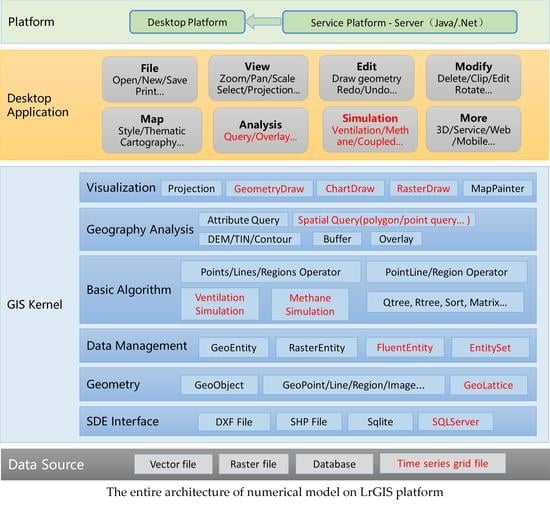
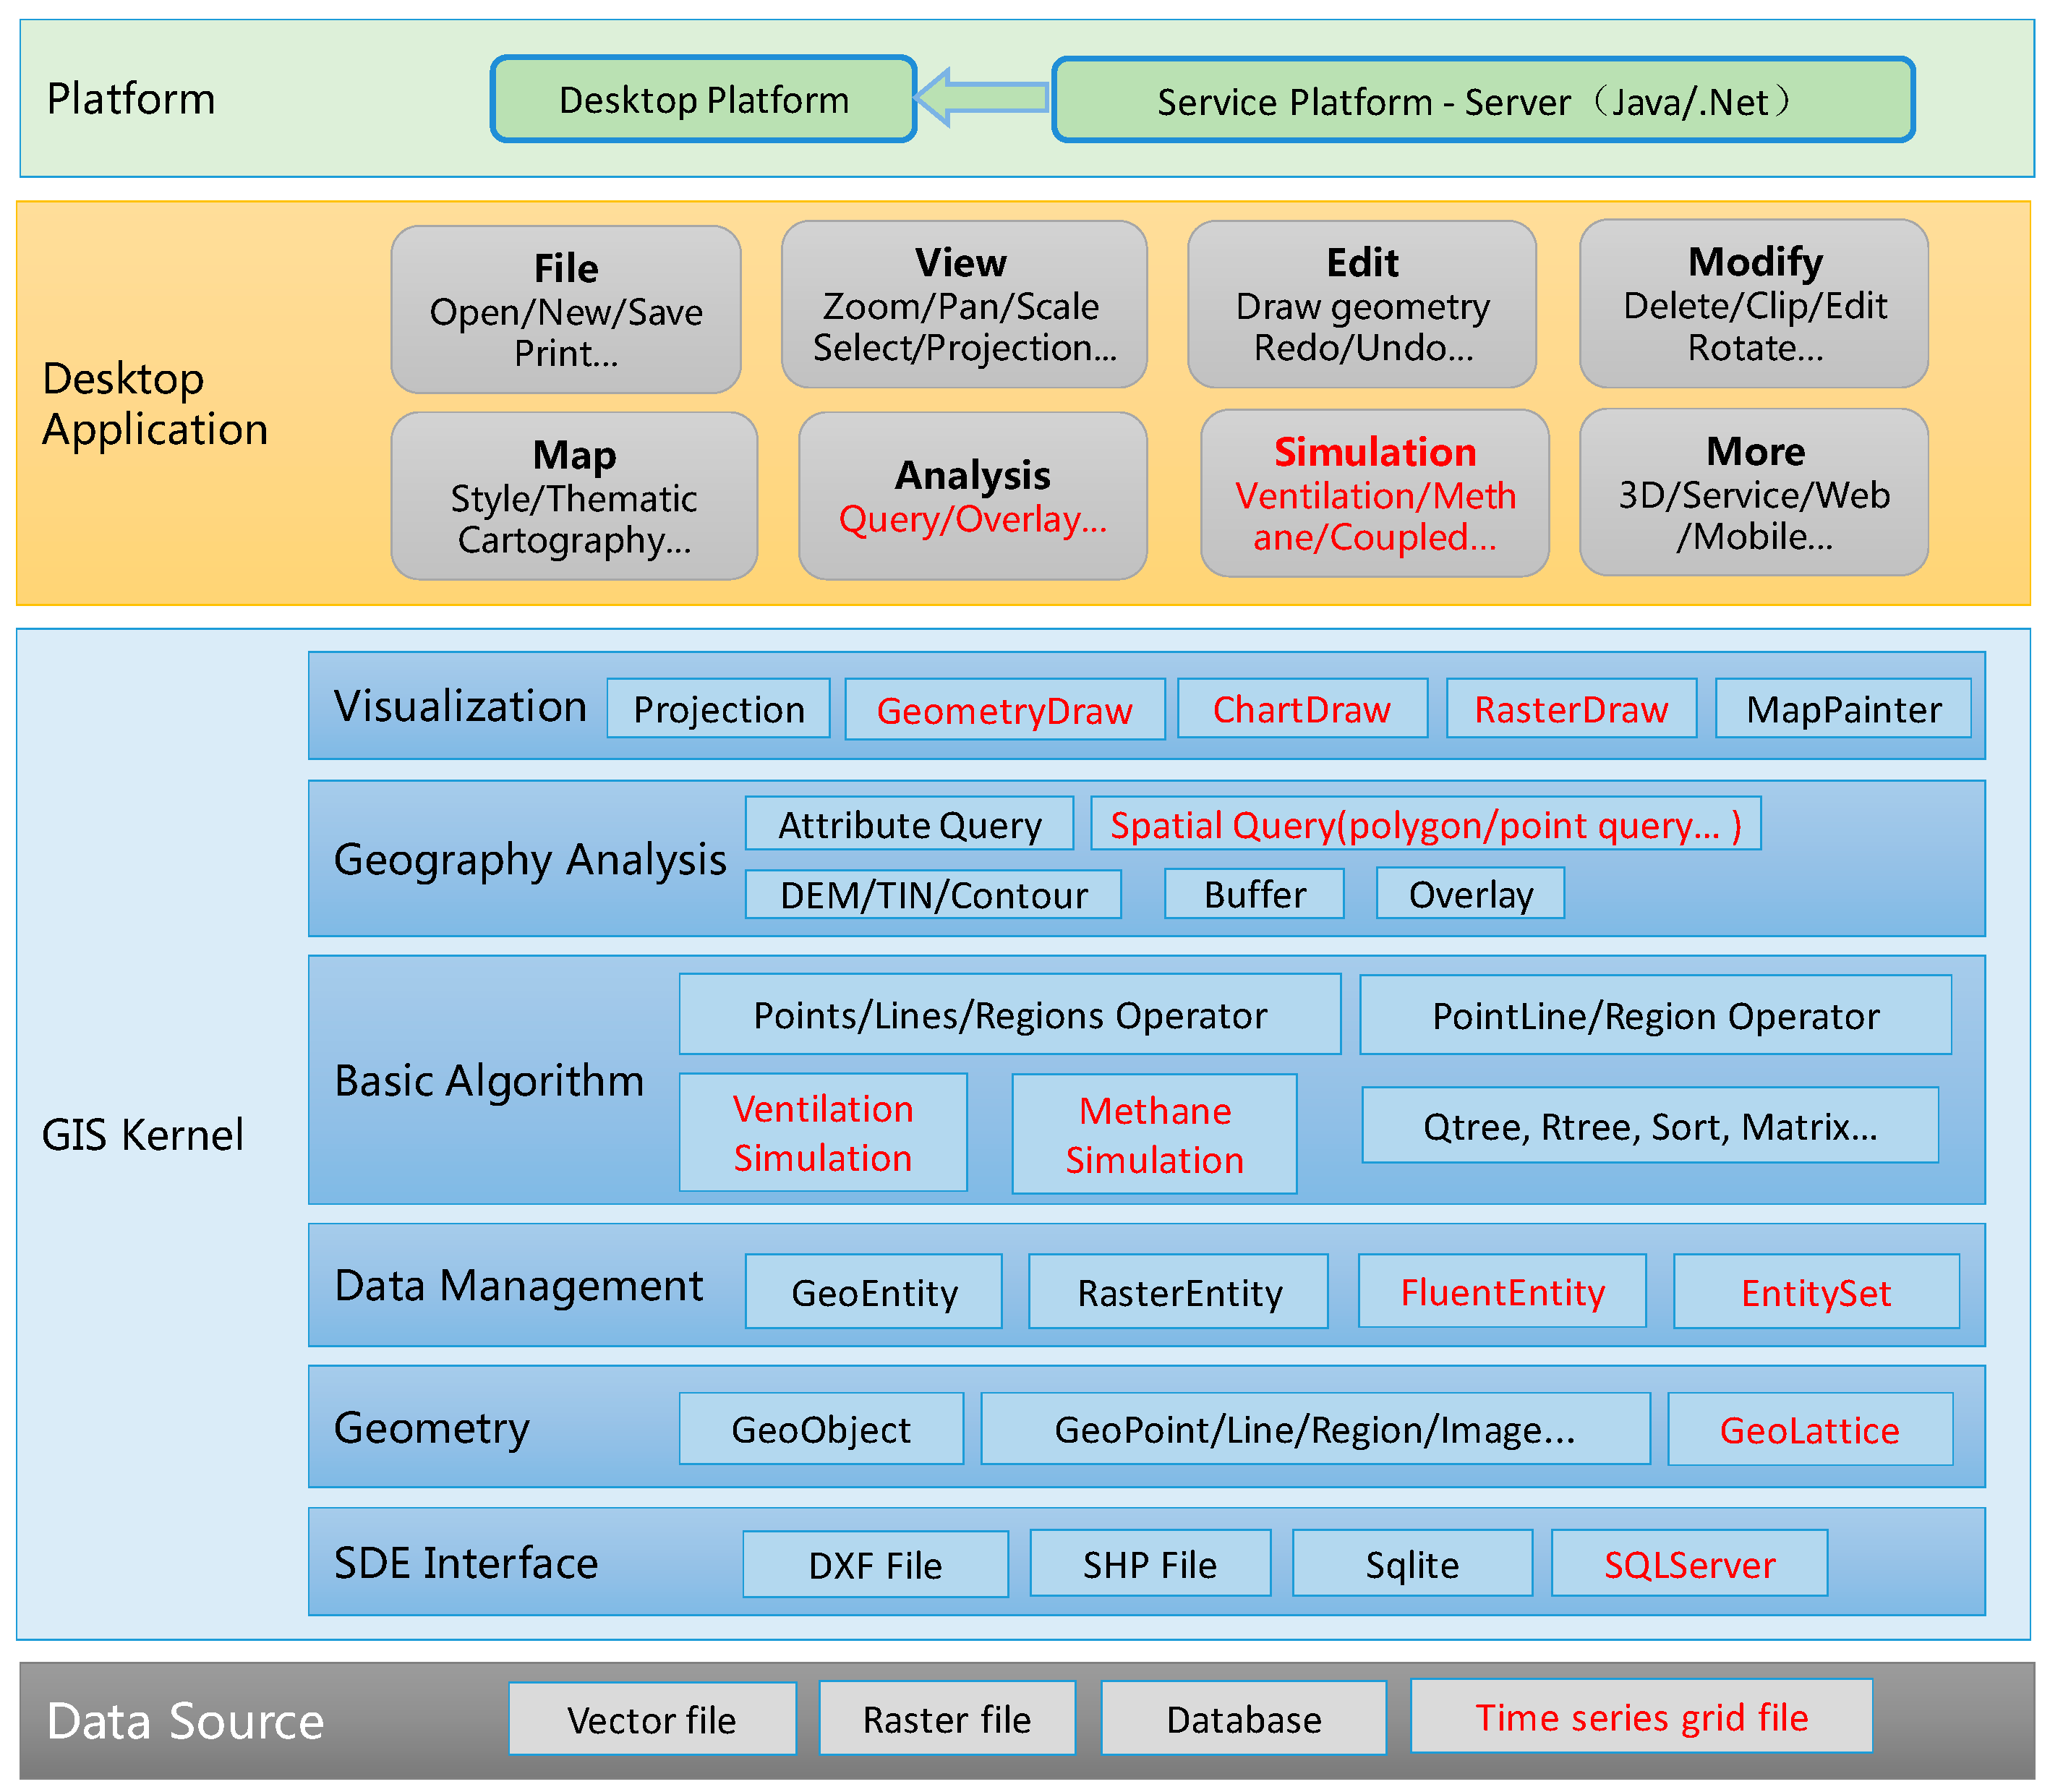
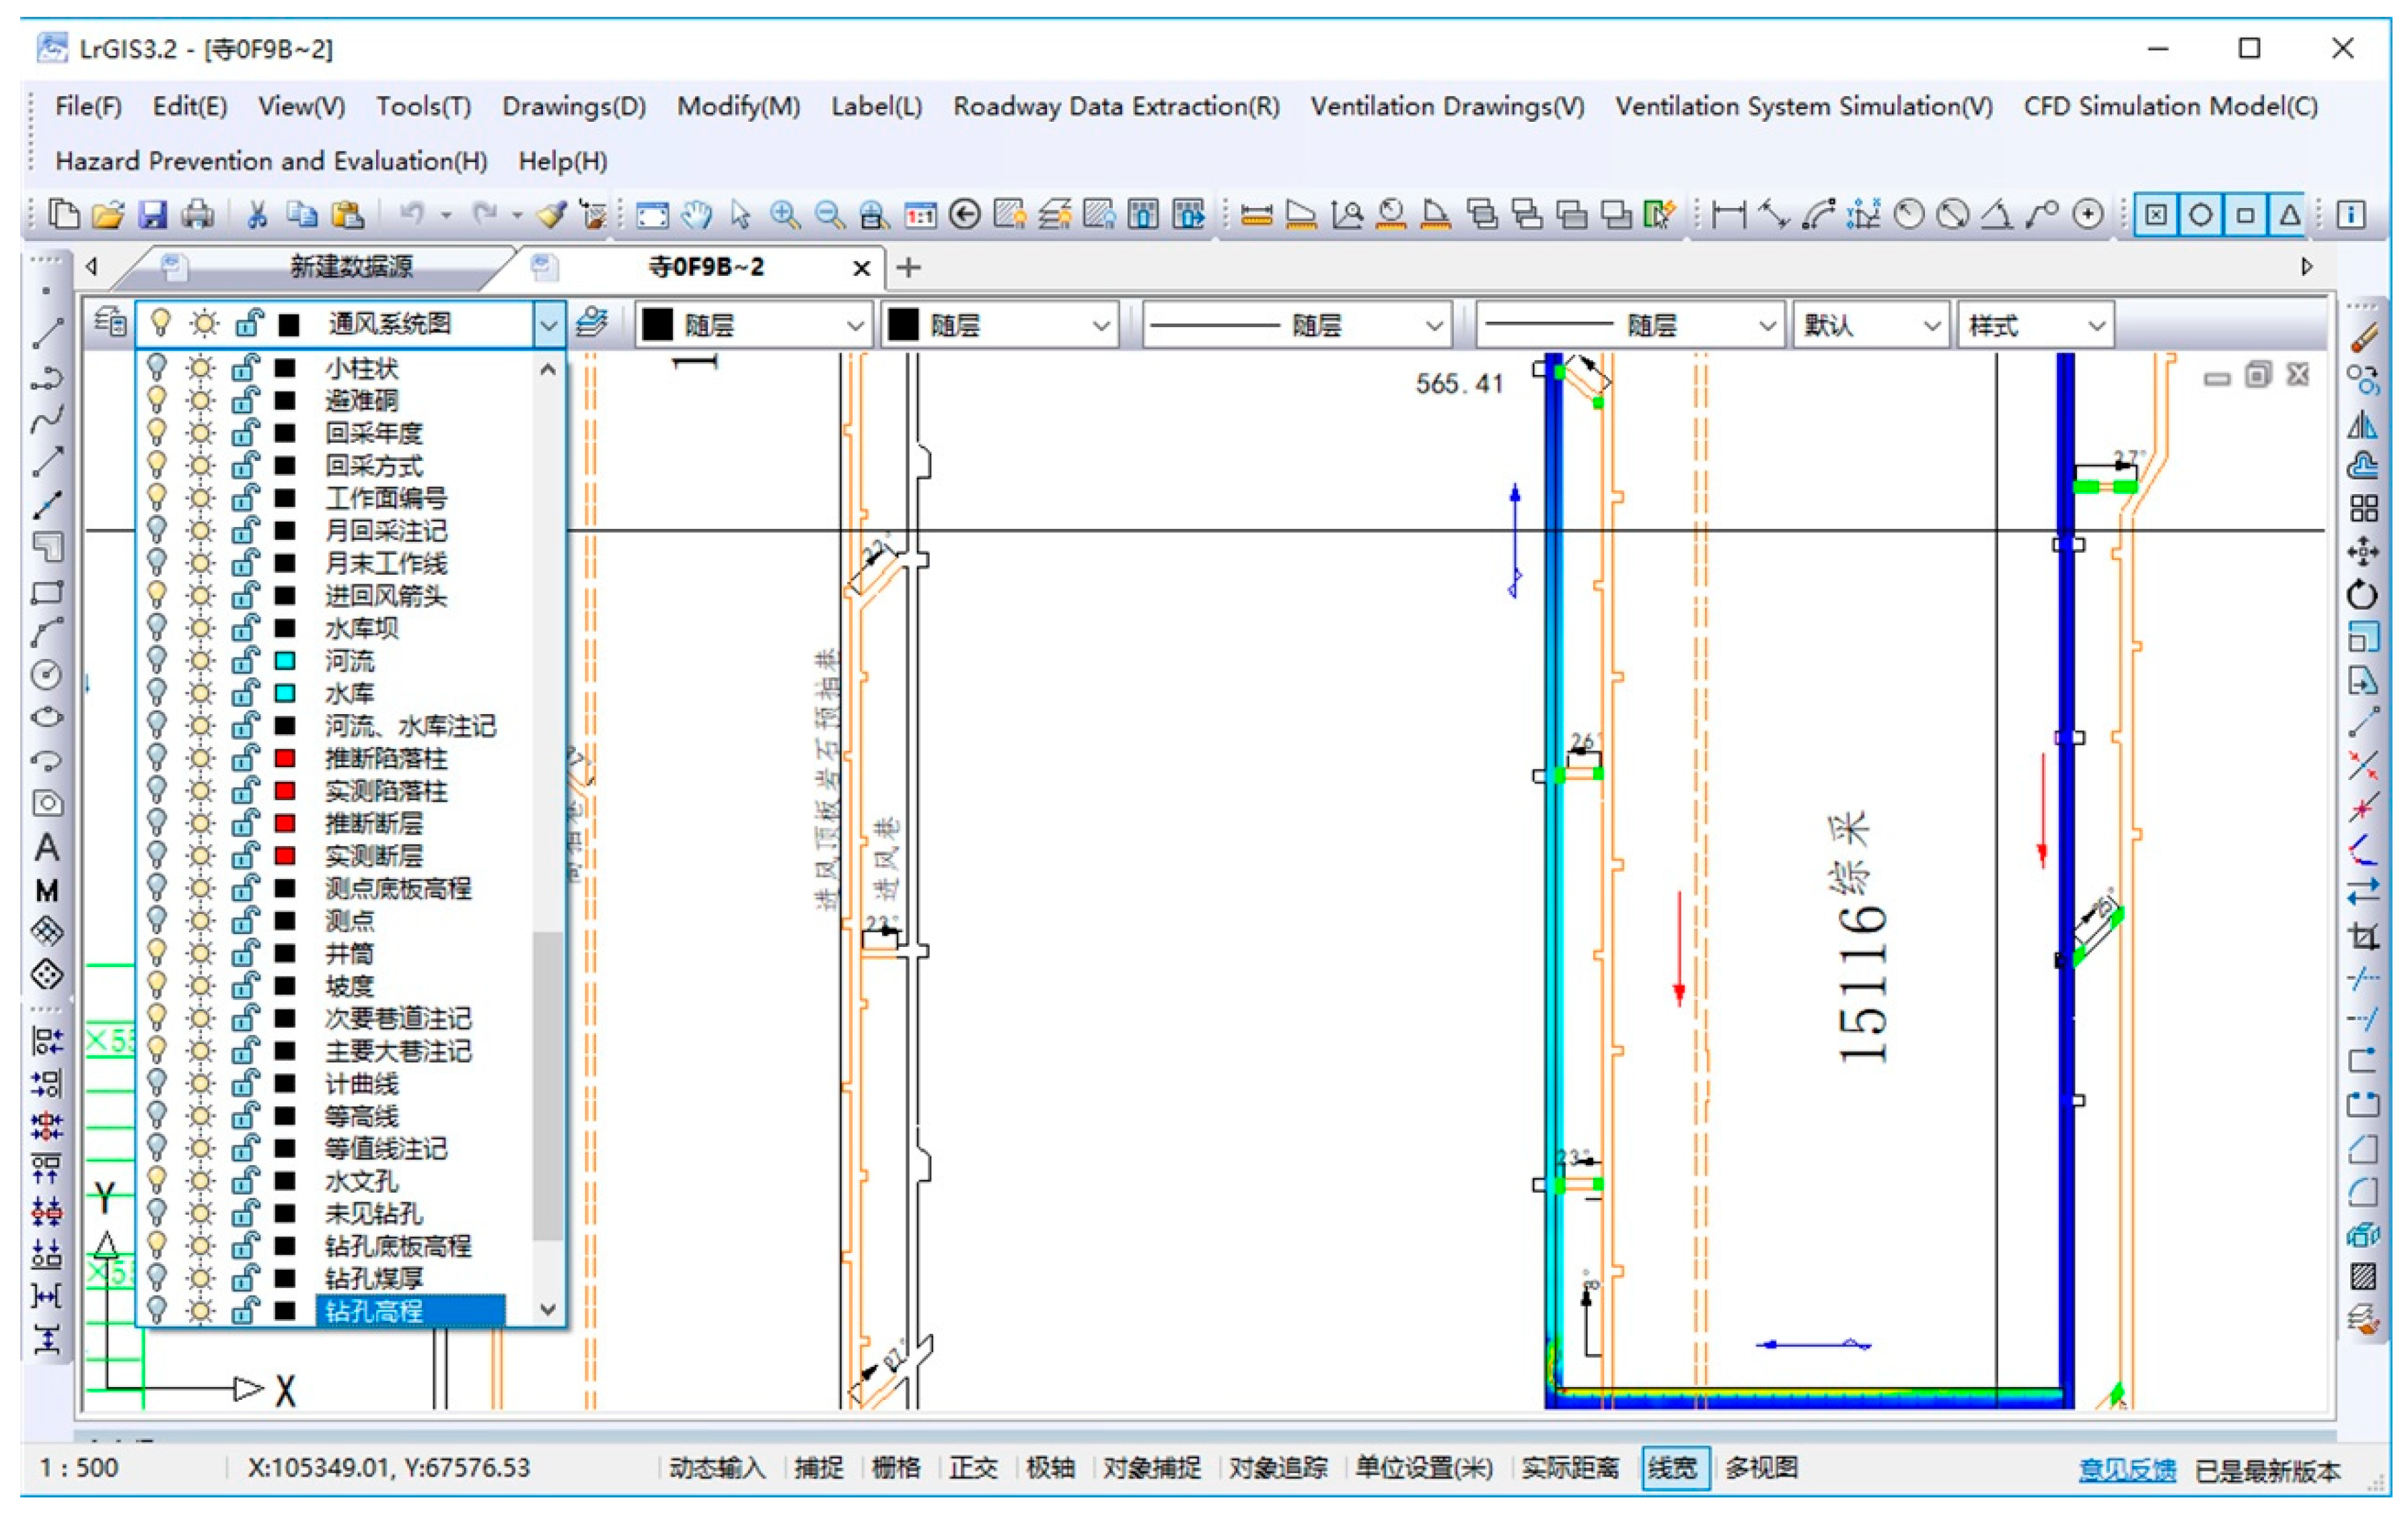
3.1. LrGIS Platform
3.2. Mathematical Models
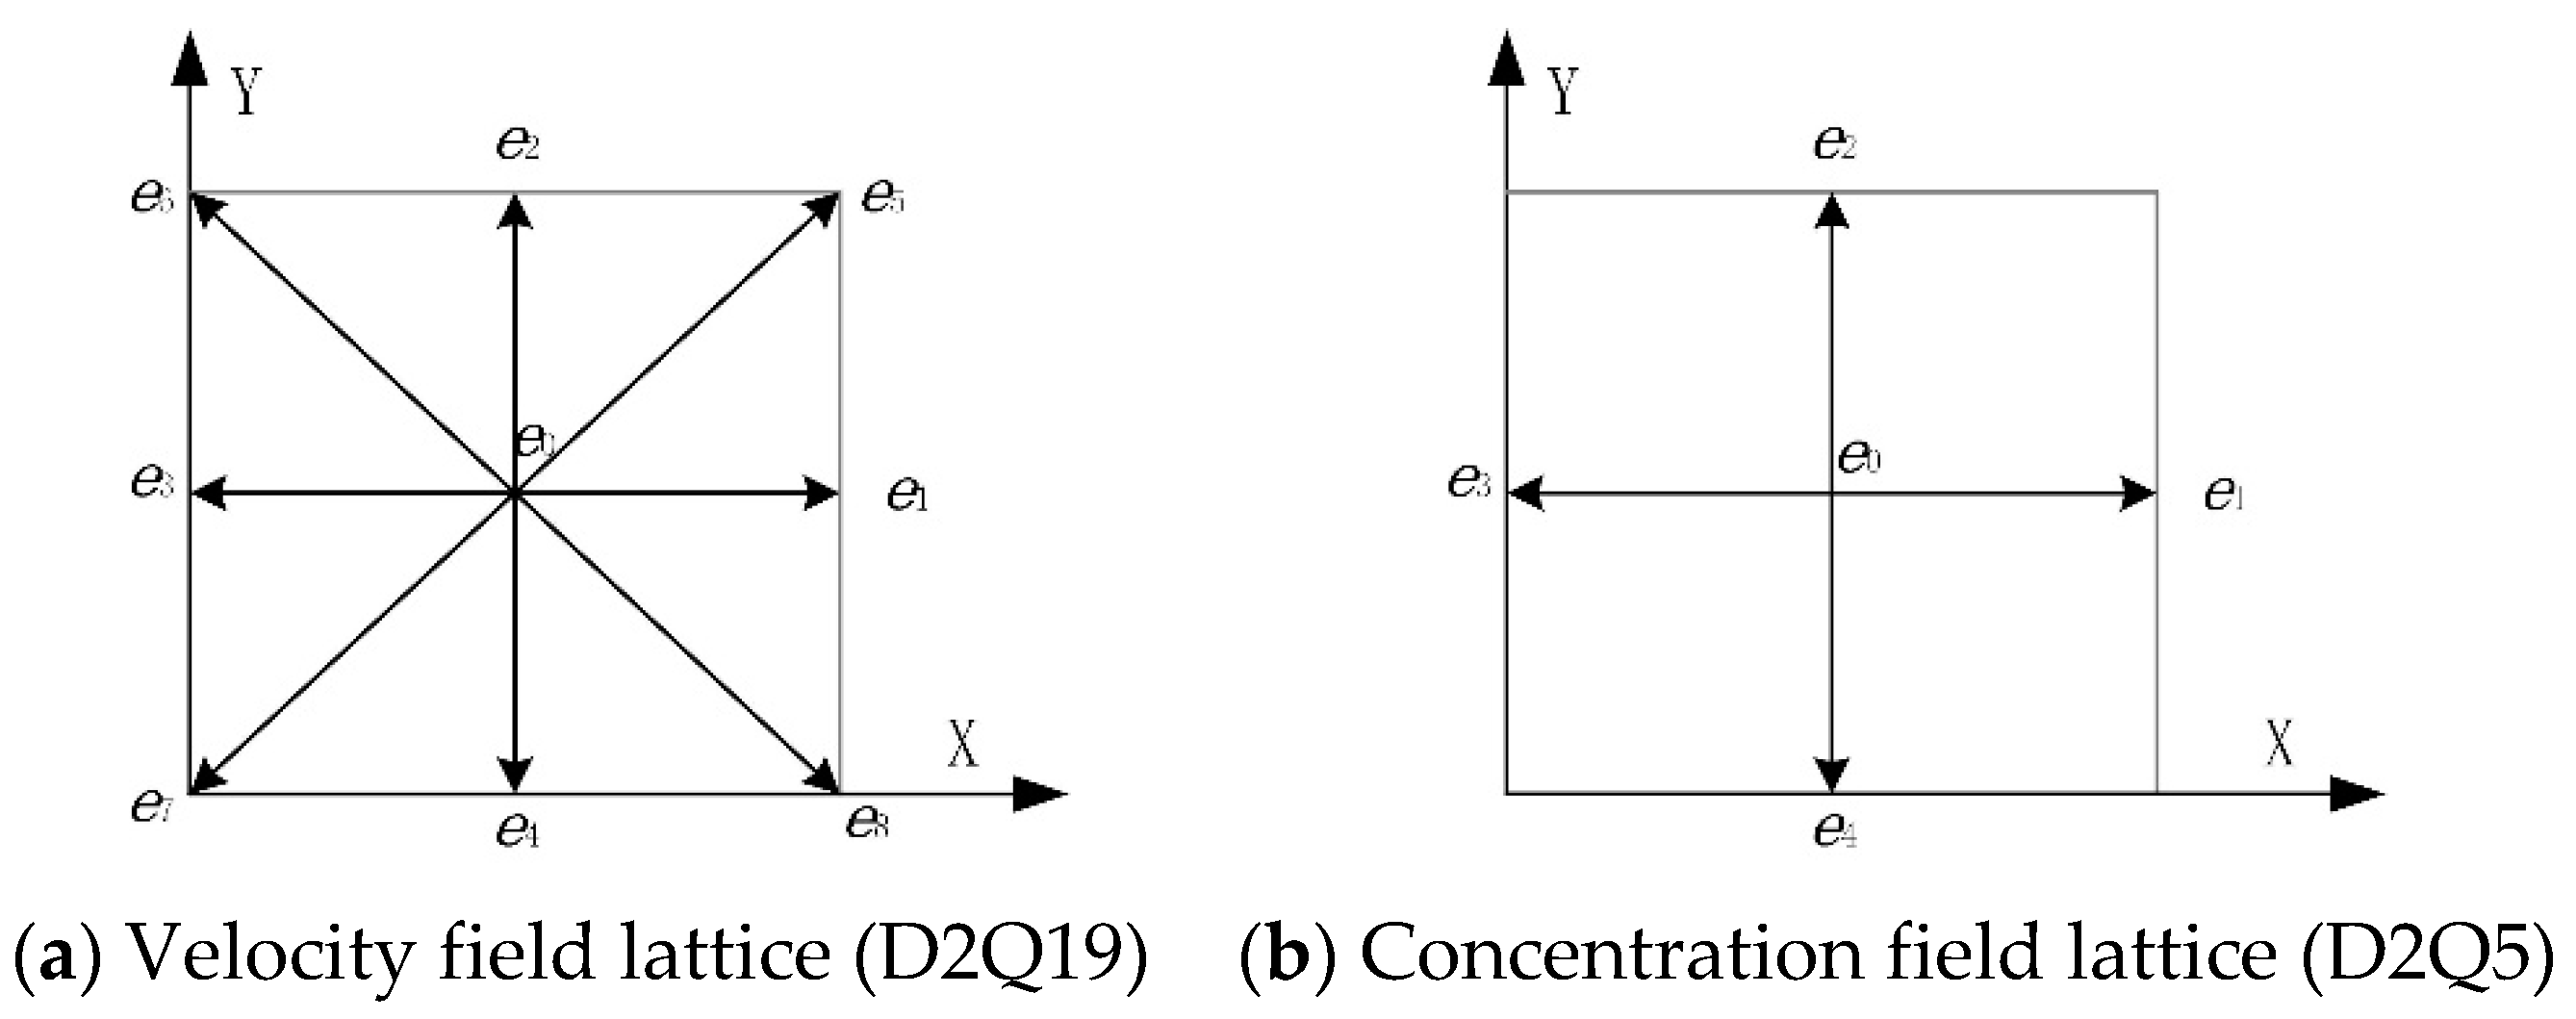
3.2.1. Lattice Boltzmann Method for Velocity Field
3.2.2. Concentration Field through a Coupled Model
3.2.3. The Turbulence Model
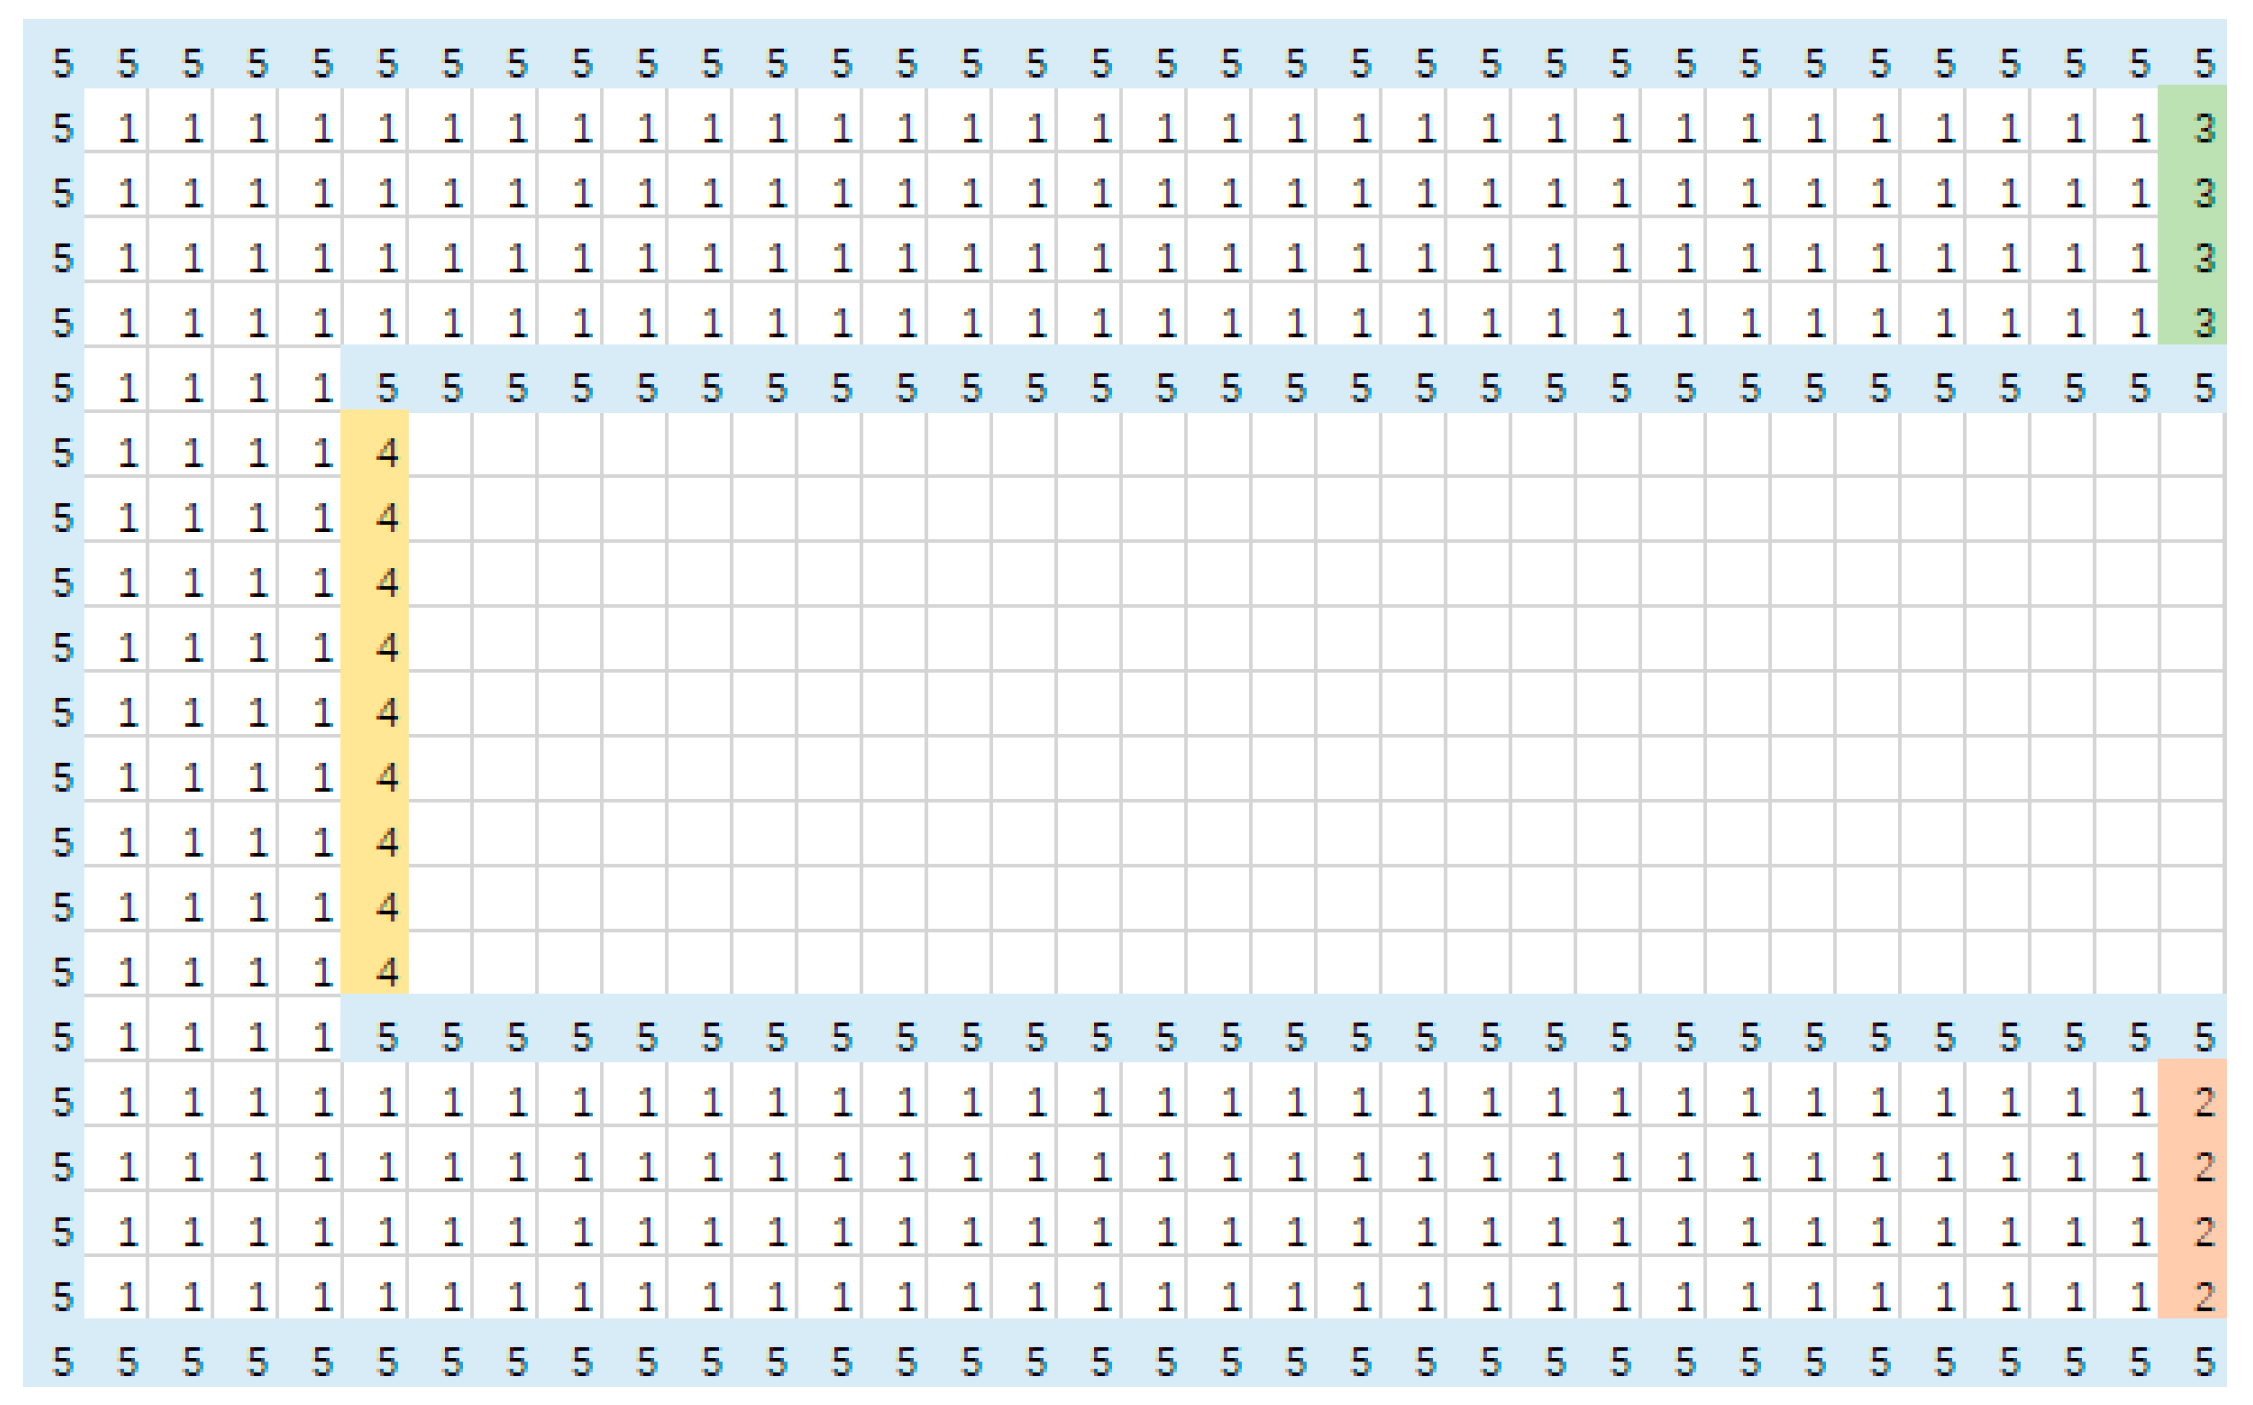
3.3. Implementation of the LBM Integrated with LrGIS Platform
- (i)
- fluid region: all species can move in this area, namely, the mesoscopic streaming and collision step of particles happened;
- (ii)
- inflow: the velocity inflow boundary condition is adopted, which means that the airflow is through this boundary with specified velocity;
- (iii)
- outflow: the outlet of the laneway is set to be under the constant pressure boundary condition;
- (iv)
- methane mass flow: the methane gas is released evenly from working face area with a total flow rate of 0.2 m3/s;
- (v)
- bounced back boundary: the no-slip boundary is prescribed at all laneway walls.
4. Simulation and Integration Results
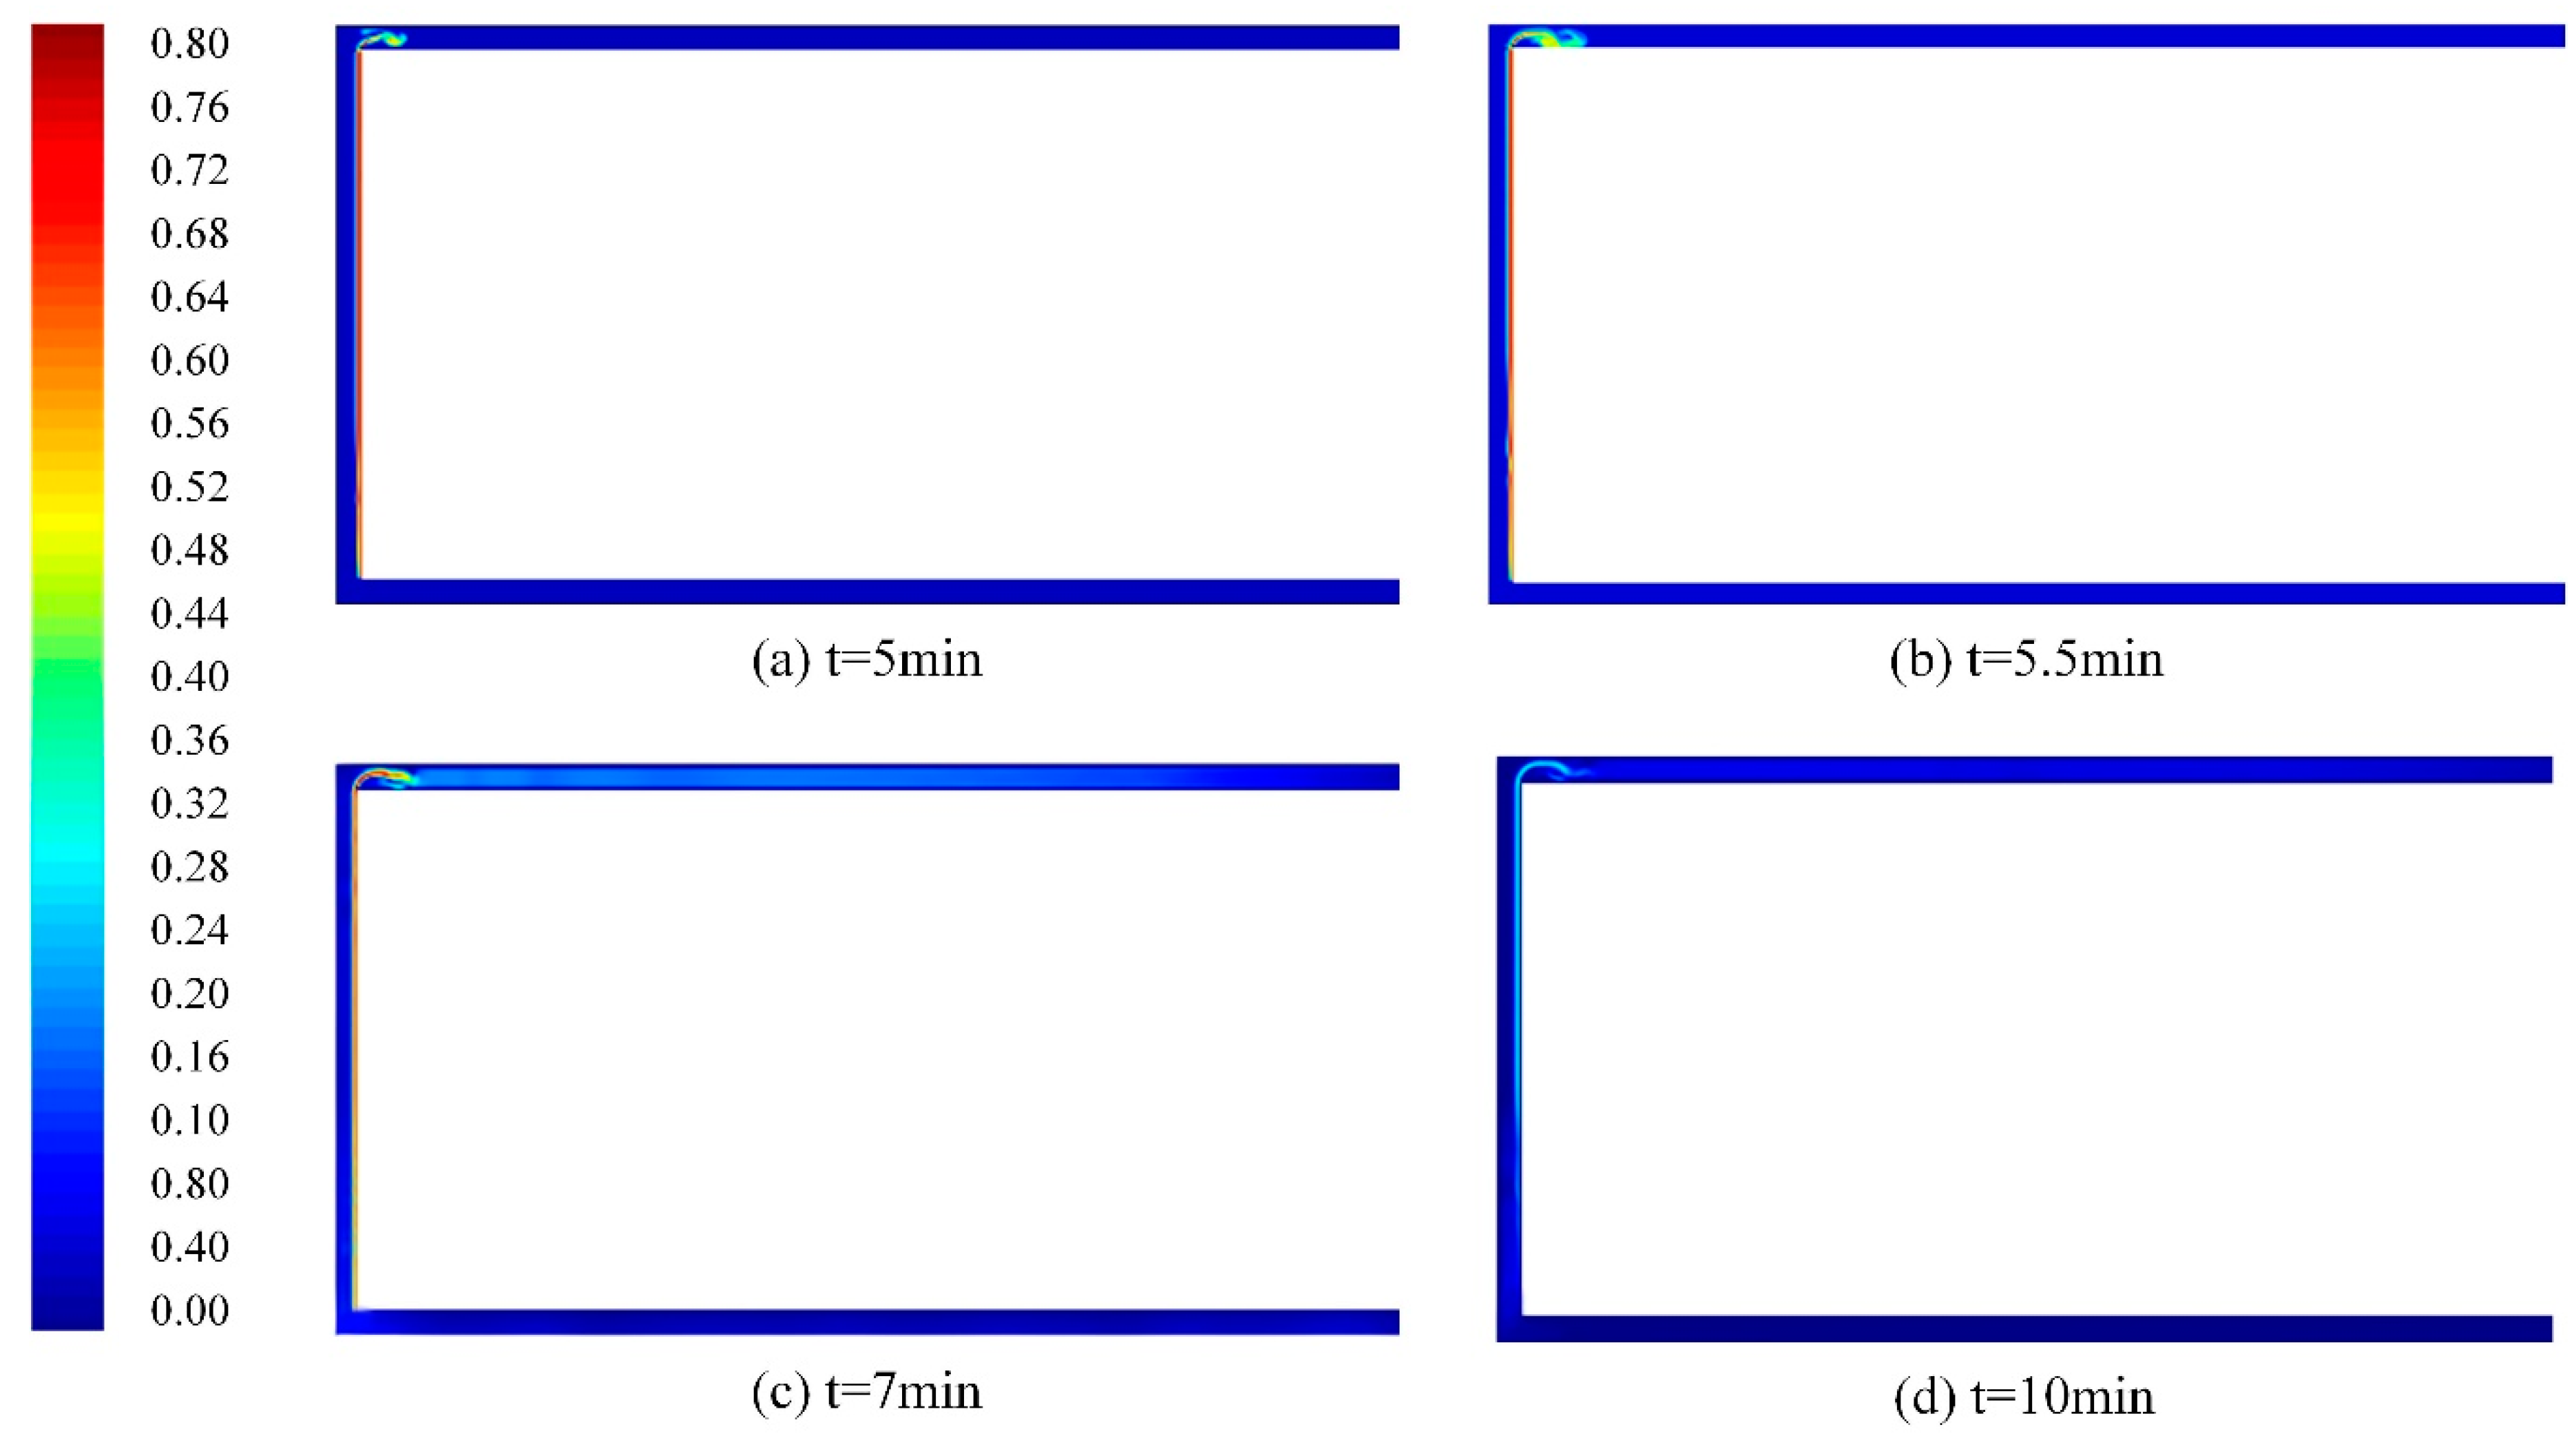
4.1. Spatiotemporal Characteristics of Airflow and Methane Distribution
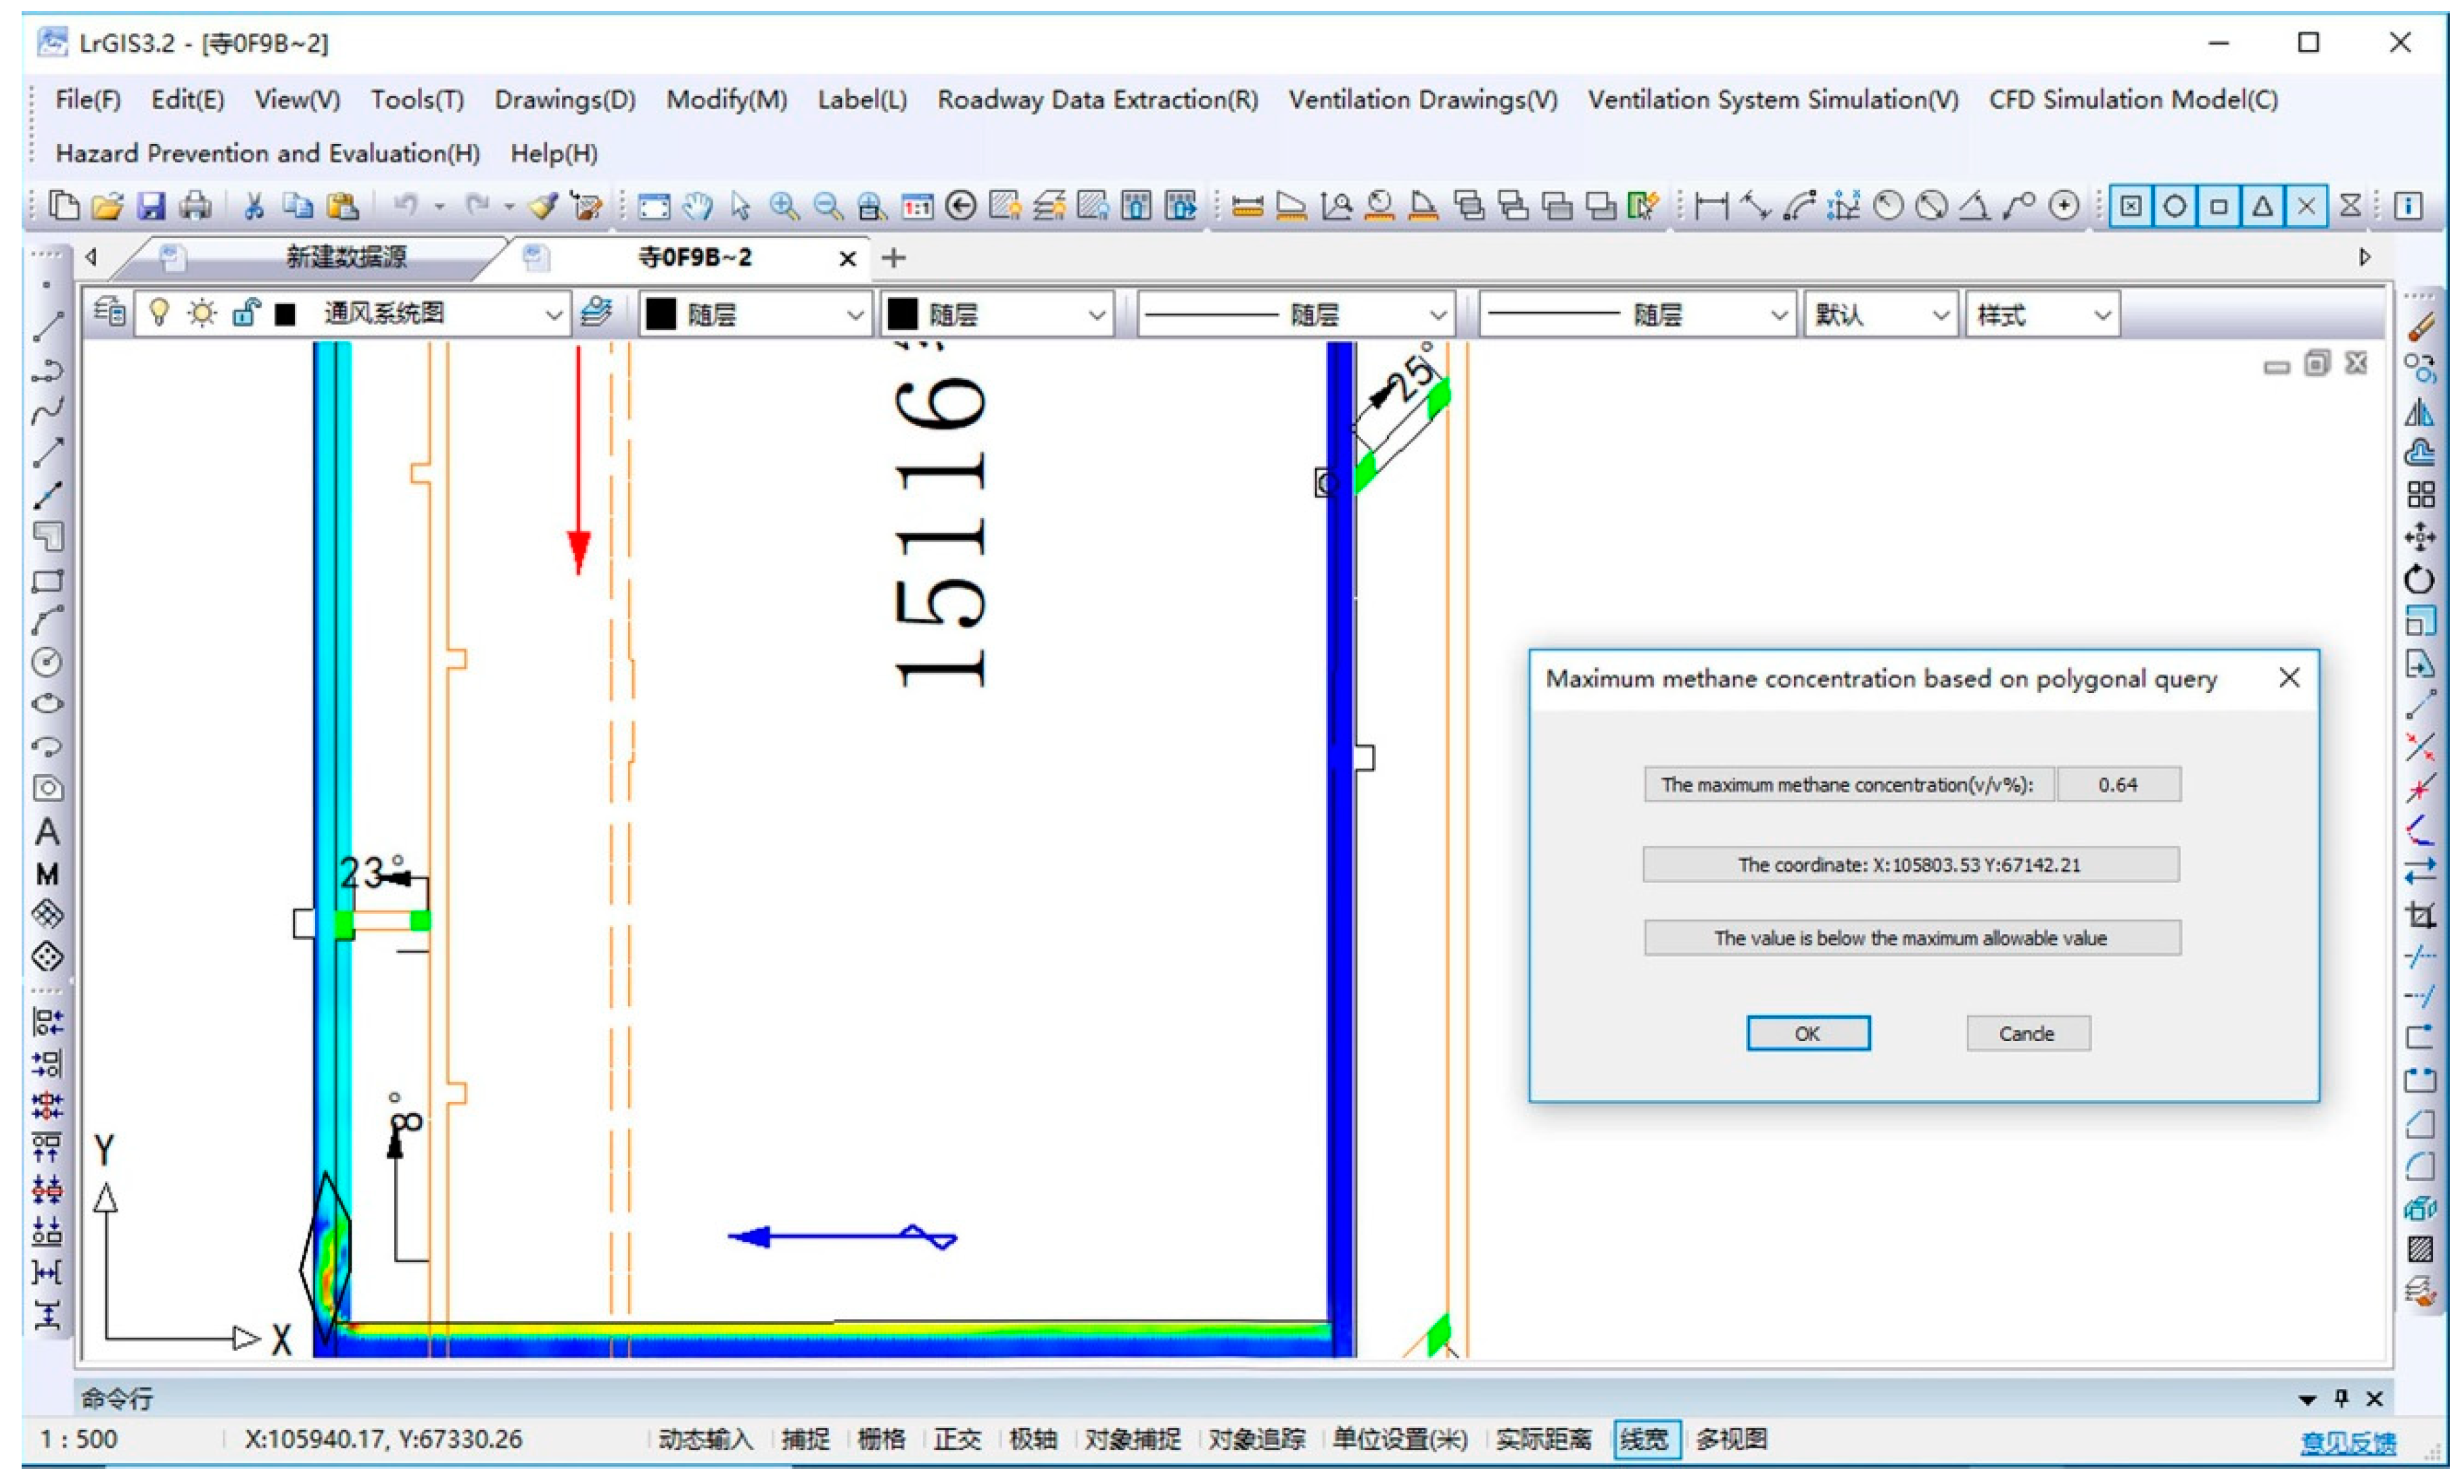
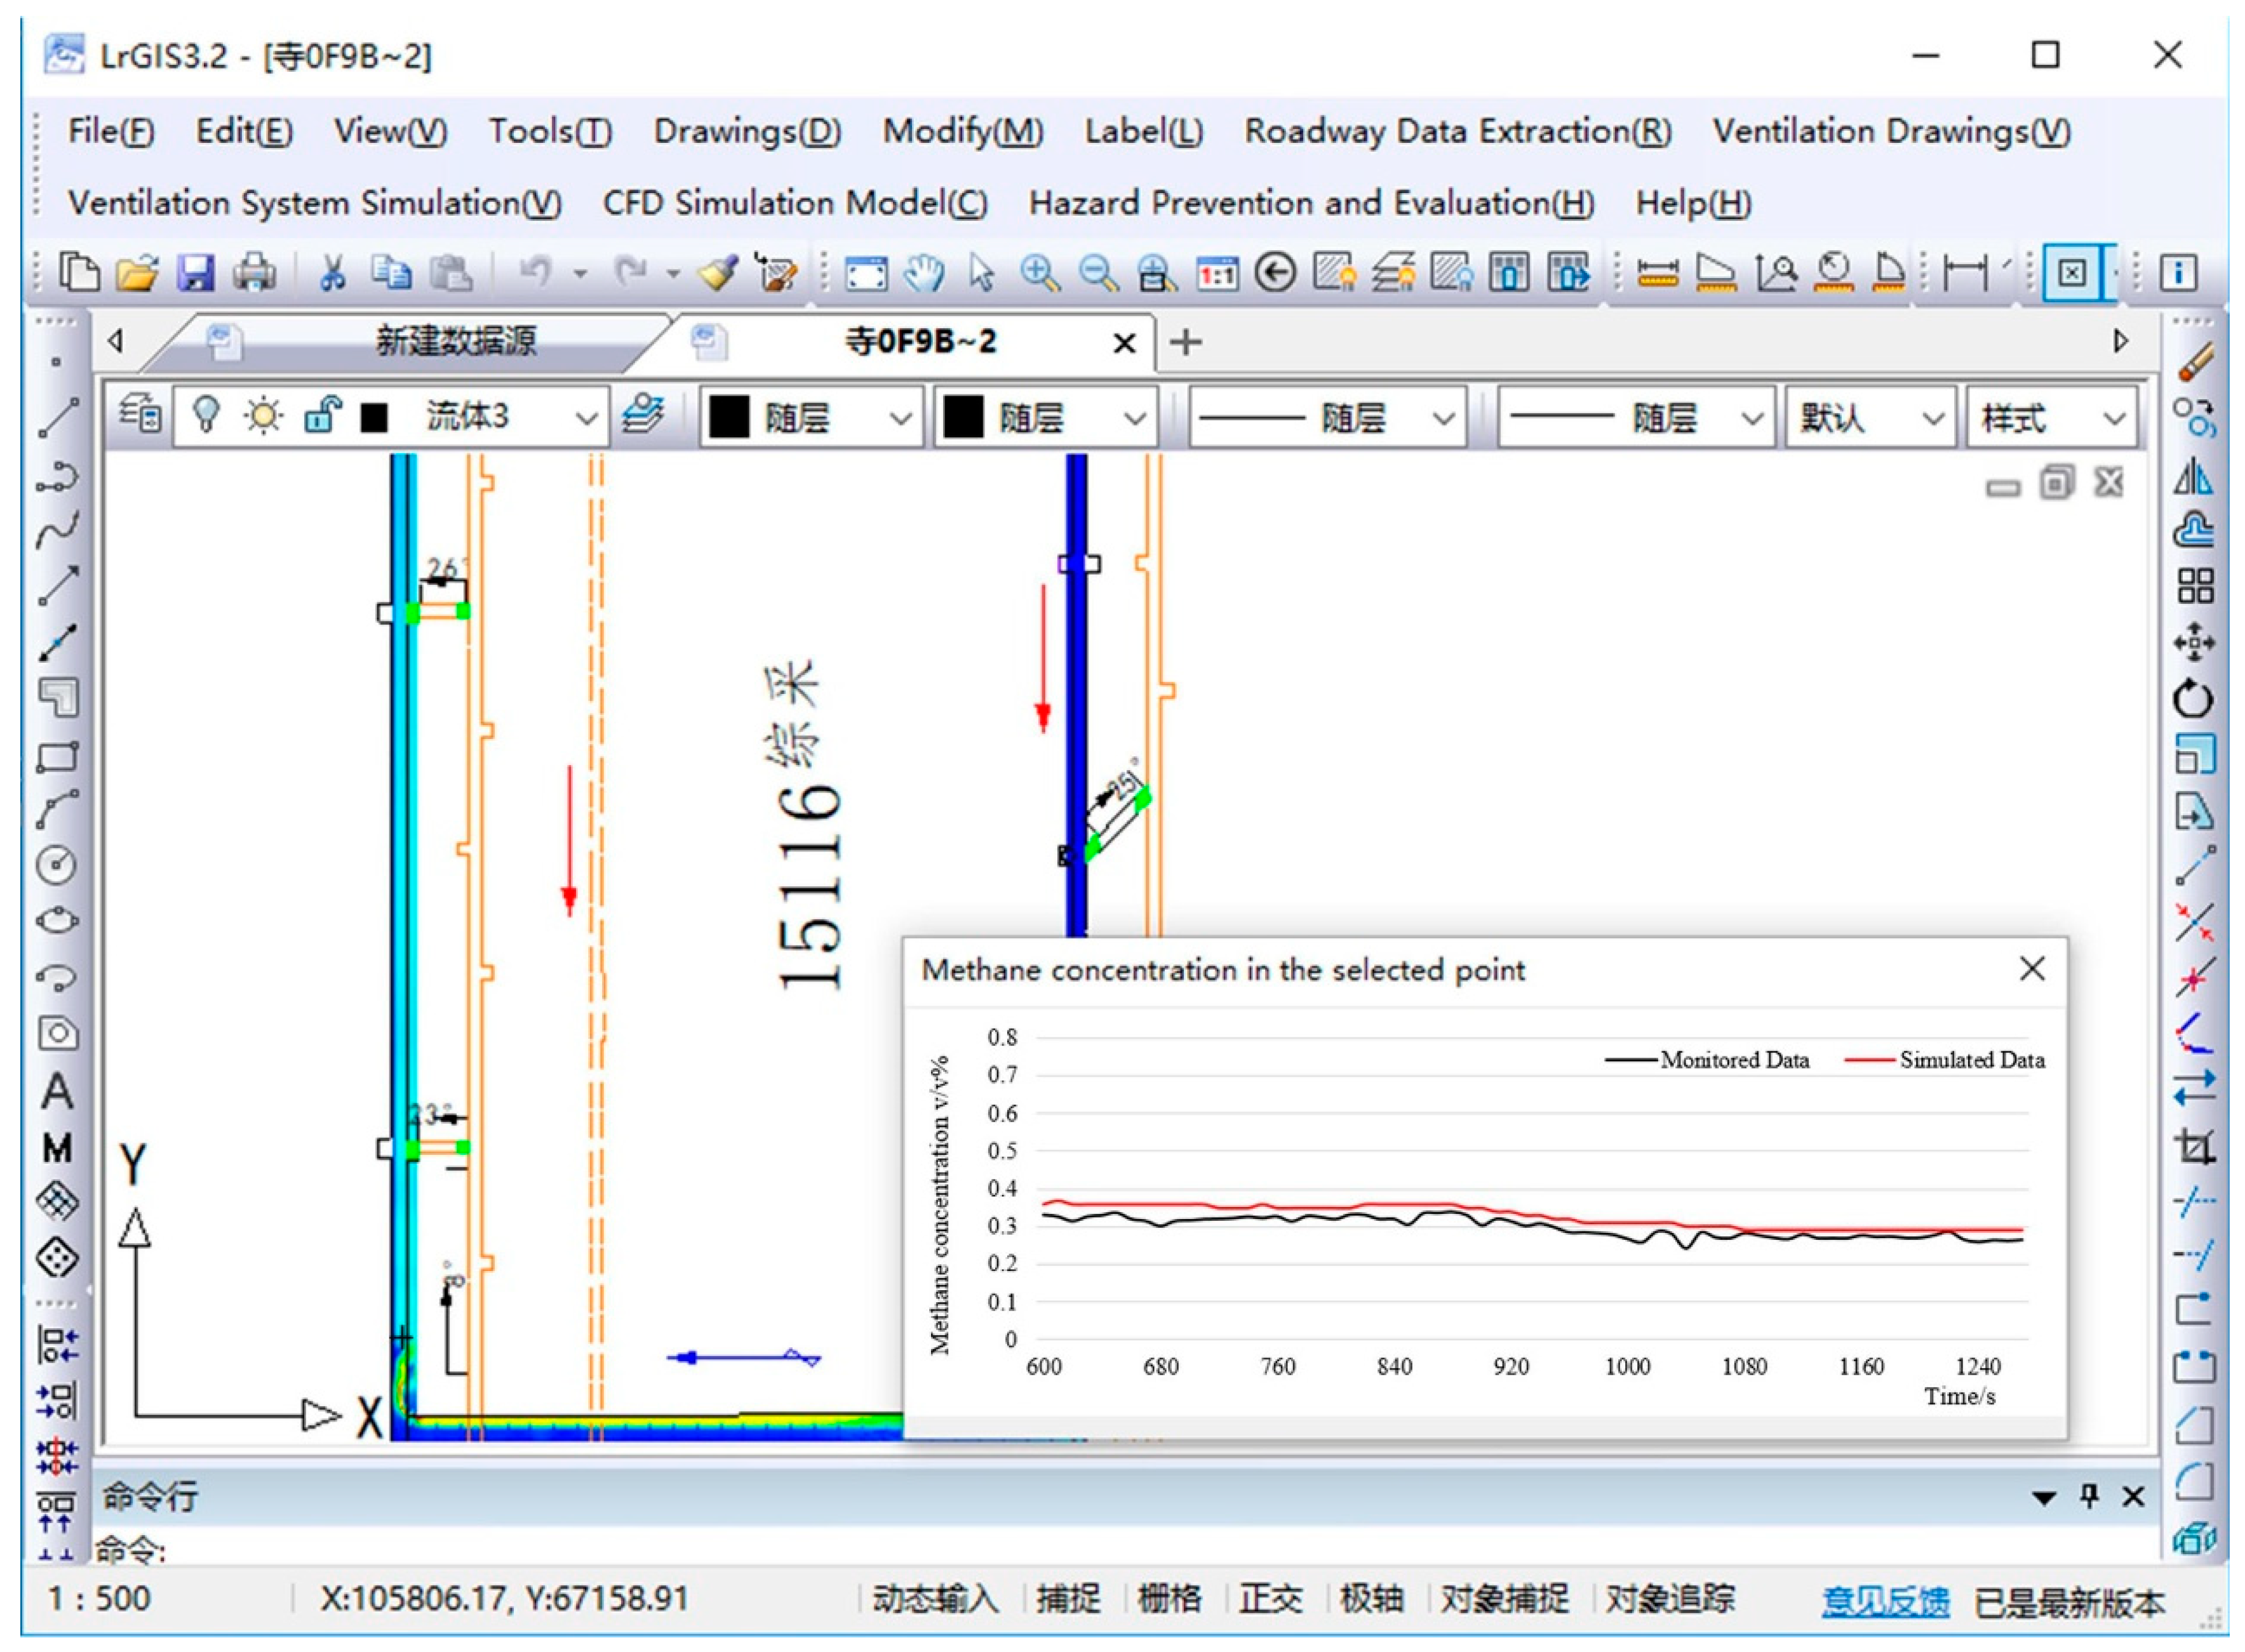
4.2. The Spatiotemporal Analysis of Methane Concentration Based on LrGIS
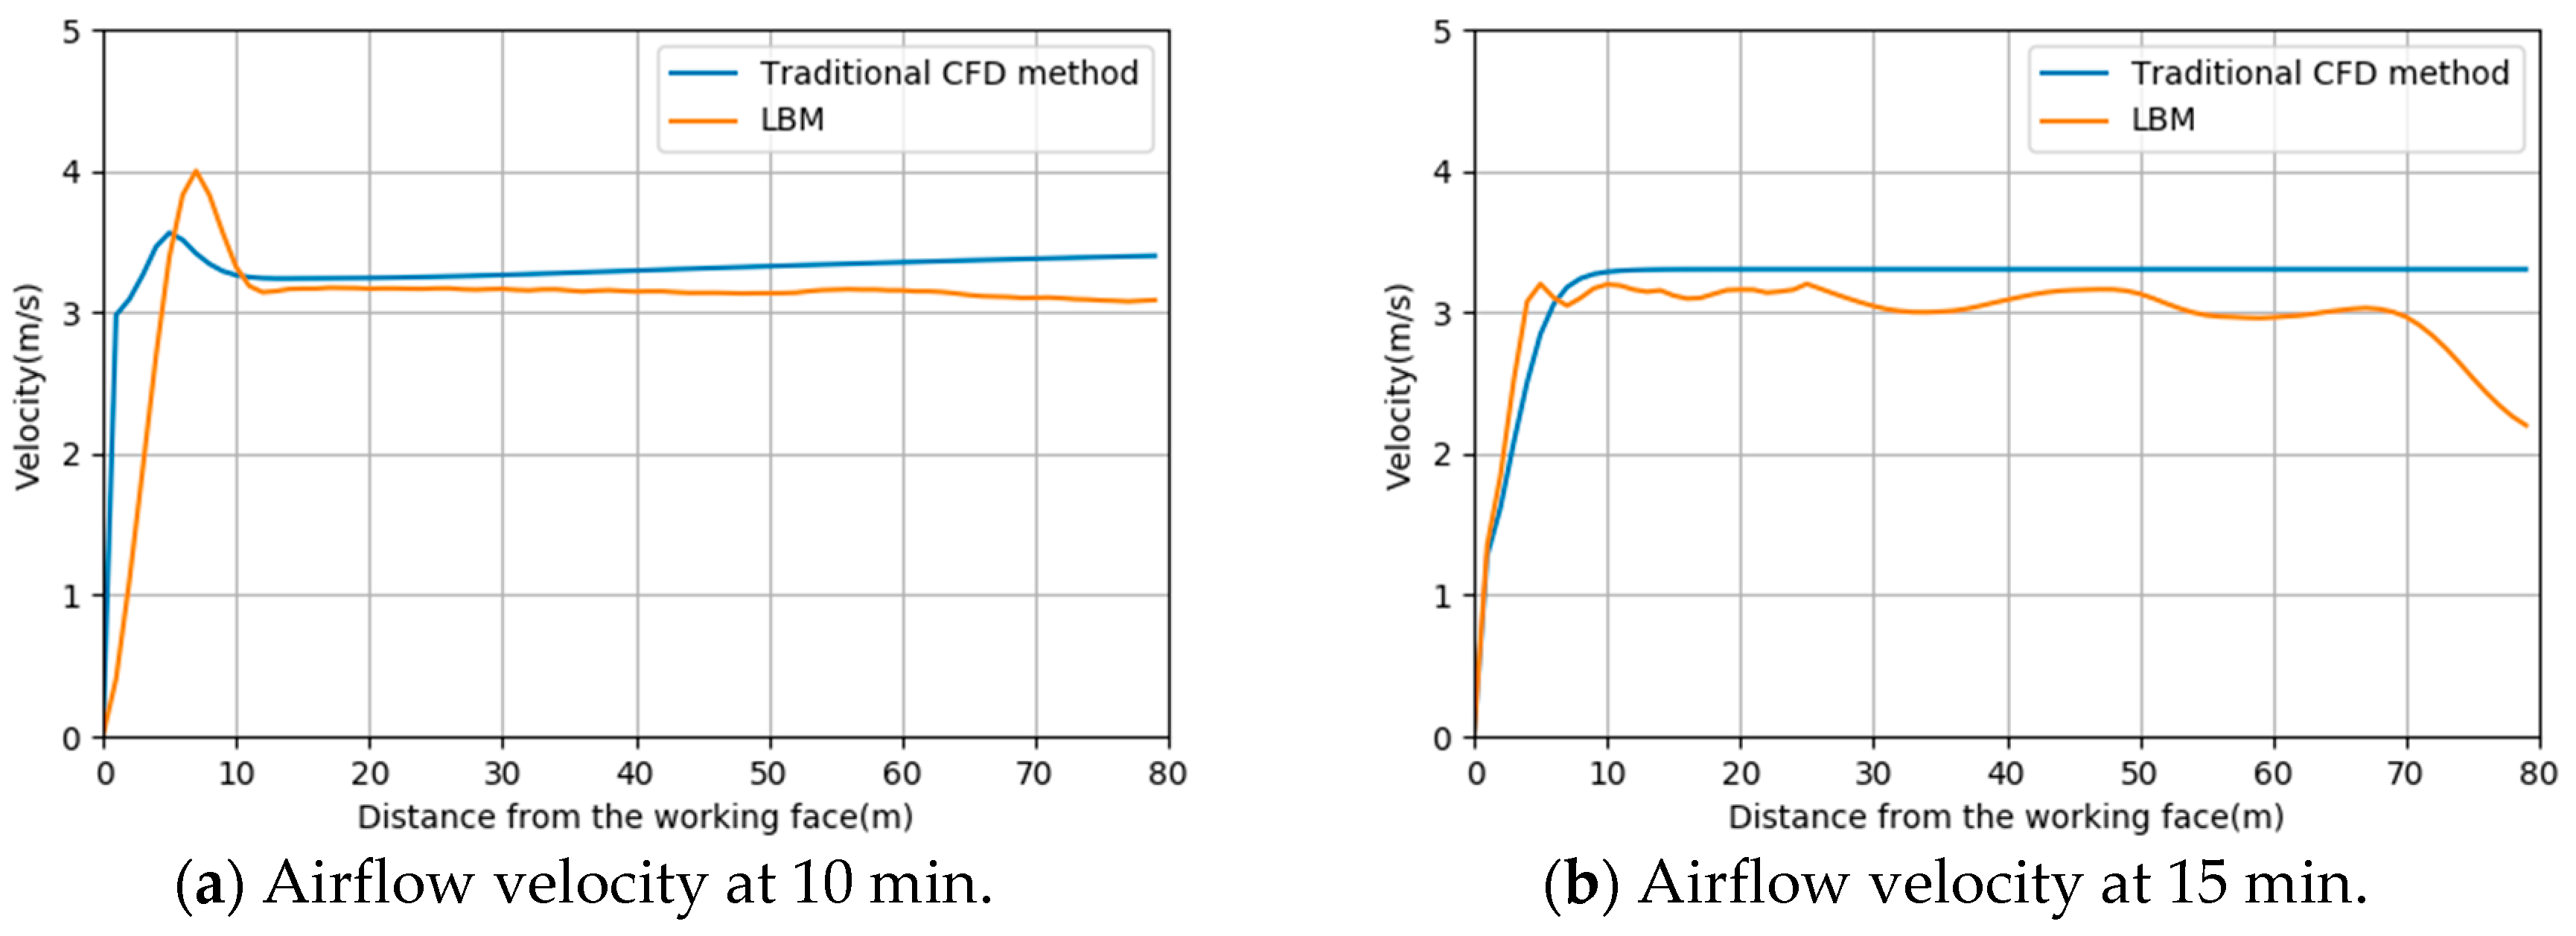
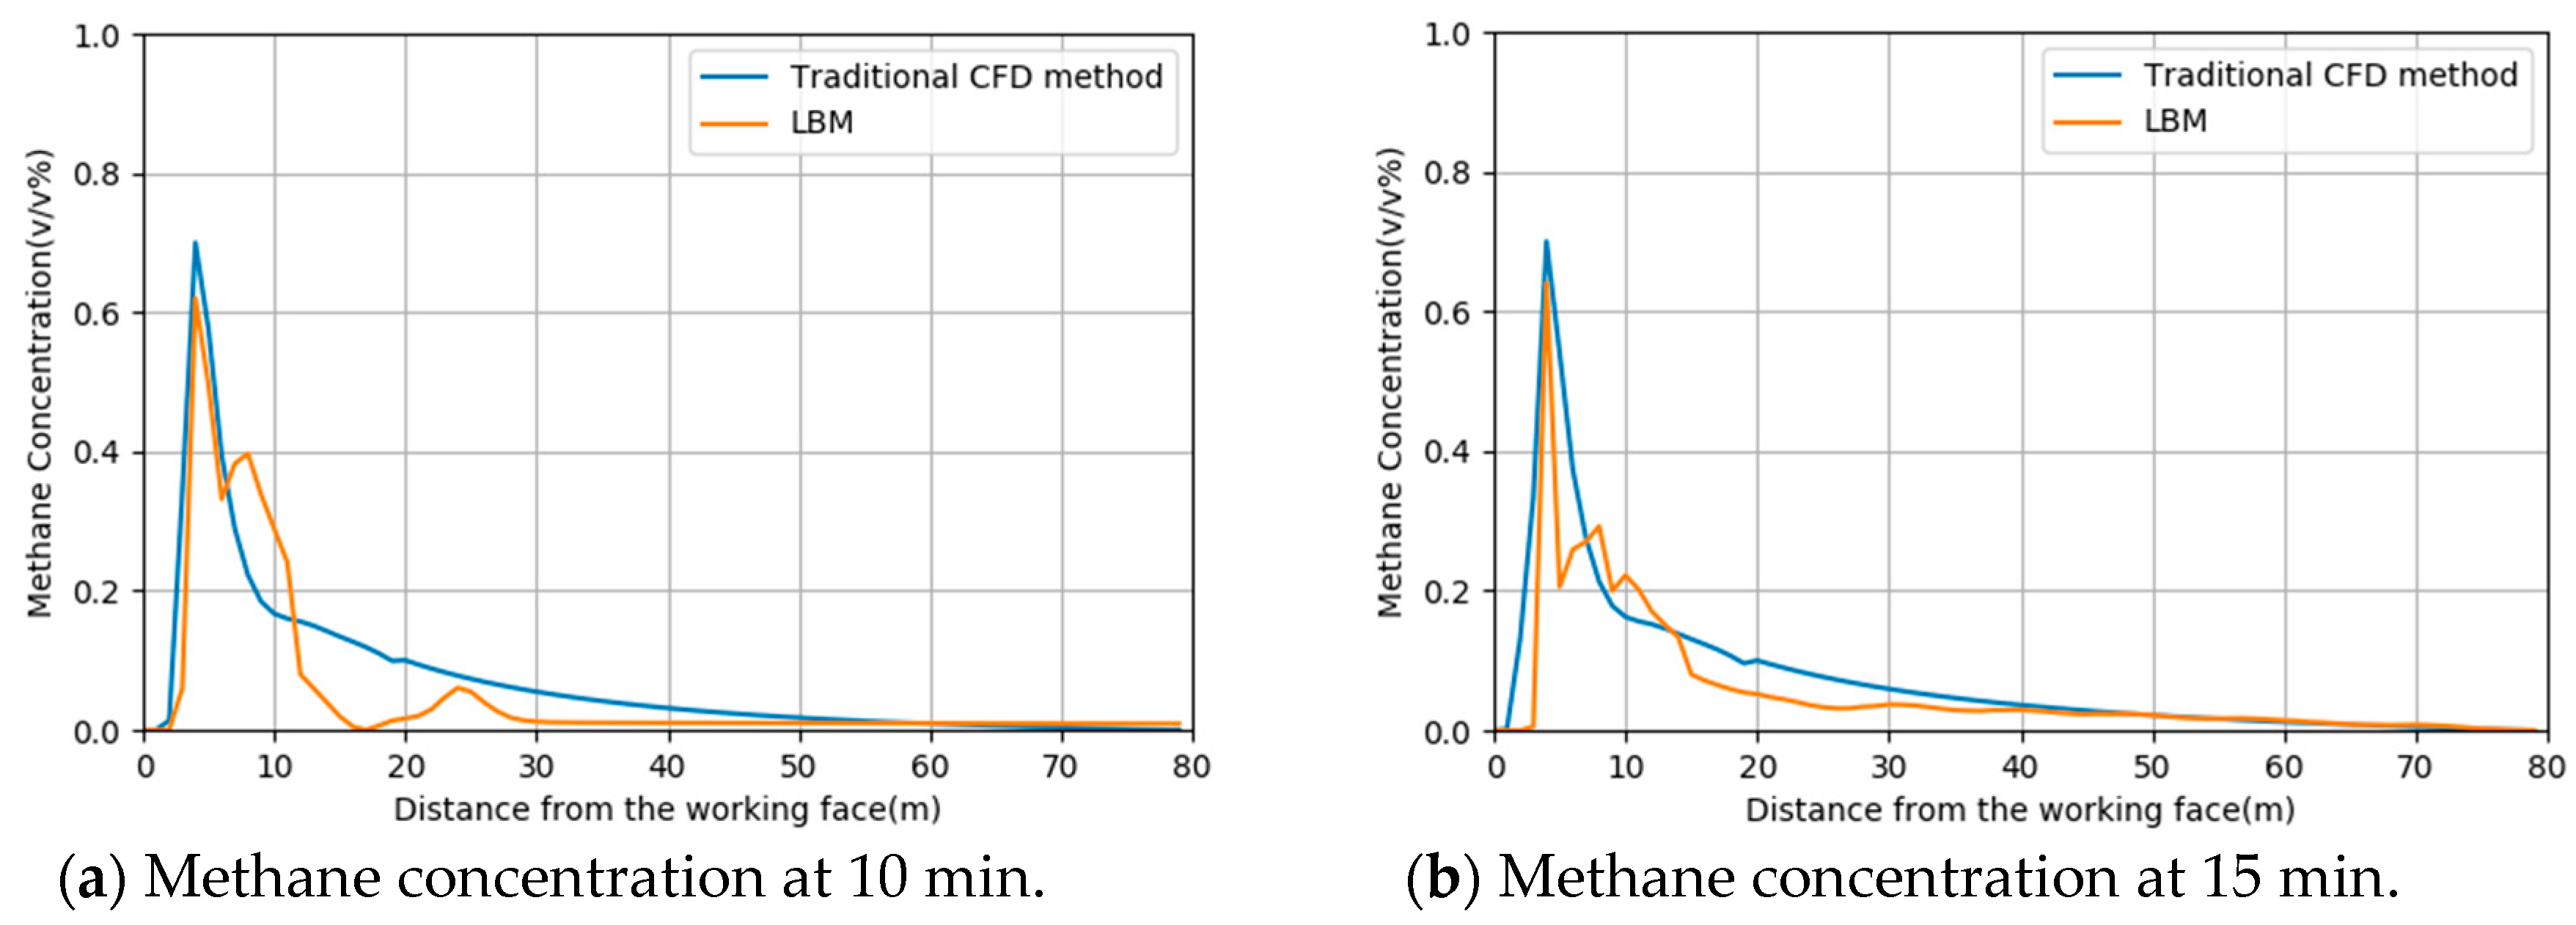
4.3. The Comprehensive Comparison of Traditional CFD Method and LBM
5. Conclusions
Author Contributions
Funding
Acknowledgments
Conflicts of Interest
References
- Nakayama, S.; Kim, Y.K.; Jo, Y.D. Simulation of methane gas distribution by computational fluid dynamics. In Mining and Science Technology; Xie, H.P., Golosinski, T.S., Eds.; Balkema Publisher: Brookfield, VT, USA, 1999; pp. 259–262. [Google Scholar]
- Kurnia, J.C.; Sasmito, A.P.; Wong, W.Y.; Mujumdar, A.S. Prediction and innovative control strategies for oxygen and hazardous gases from diesel emission in underground mines. Sci. Total Environ. 2014, 481, 317–334. [Google Scholar] [CrossRef]
- Kurnia, J.C.; Xu, P.; Sasmito, A.P. A novel concept of enhanced gas recovery strategy from ventilation air methane in underground coal mines—A computational investigation. J. Nat. Gas Sci. Eng. 2016, 35, 661–672. [Google Scholar] [CrossRef]
- Liu, H.; Wu, X.; Mao, S.; Li, M.; Yue, J. A Time Varying Ventilation and Dust Control Strategy Based on the Temporospatial Characteristics of Dust Dispersion. Minerals 2017, 7, 59. [Google Scholar] [CrossRef]
- Xu, G.; Luxbacher, K.D.; Ragab, S.; Xu, J.; Ding, X. Computational fluid dynamics applied to mining engineering: A review. Int. J. Min. Reclam. Environ. 2017, 31, 251–275. [Google Scholar] [CrossRef]
- Sun, Z.; Mao, S.; Wu, C. Assistant Decision System of Gas Explosion Emergency Rescue Based on Monitoring Data and CFD. Saf. Coal Mines 2016, 47, 83–86. [Google Scholar] [CrossRef]
- Zhu, C.; Lin, B.; Ye, Q.; Zhai, C. Effect of roadway turnings on gas explosion propagation characteristics in coal mines. Min. Sci. Technol. 2011, 21, 365–369. [Google Scholar] [CrossRef]
- Tian, Z.; Liang, Z.; Niu, Y.; Li, C.; Tu, X.; Fan, D. Simulation of the methane emission in rice fields in China during the past 40 years by DNDC model and GIS technical. In Proceedings of the 2014 Third International Conference on Agro-Geoinformatics, Beijing, China, 11–14 August 2014. [Google Scholar]
- Goodchild, M.F.; Haining, R.; Wise, S. Integrating GIS and spatial data analysis: Problem and possibilities. Int. J. Geogr. Inf. Syst. 1992, 6, 407–423. [Google Scholar] [CrossRef]
- Duffy, C.; Leonard, L.; Bhatt, G.; Yu, X.; Giles, L. Watershed Reanalysis: Towards a National Strategy for Model-Data Integration. In Proceedings of the 2011 IEEE Seventh International Conference on e-Science Workshops (eScienceW 2011), Stockholm, Sweden, 5–8 December 2011; pp. 61–65. [Google Scholar]
- Juanle, W.; Kan, W.; Kuan, W. Integrated GIS solution to mining subsidence assistant decision in mining area. In Proceedings of the IGARSS 2004, 2004 IEEE International Geoscience and Remote Sensing Symposium, Anchorage, AK, USA, 20–24 September 2004; pp. 2868–2871. [Google Scholar]
- Kolli, S.S.; Damodaran, P.S.; Evans, G.W. Geographic Information System Based Decision Support Systems for Facility Location, Routing and Scheduling. Comput. Ind. Eng. 1993, 25, 369–372. [Google Scholar] [CrossRef]
- Banerjee, T.K. A GIS Solution for an Integrated Underground Coal Mine Management: A Conceptual Platform. J. Manag. Policies Pract. 2014, 2, 129–143. [Google Scholar]
- Şalap, S.; Karslıoğlu, M.O.; Demirel, N.; Karslioglu, M.O. Development of a GIS-based monitoring and management system for underground coal mining safety. Int. J. Coal Geol. 2009, 80, 105–112. [Google Scholar] [CrossRef]
- Suh, J.; Kim, S.-M.; Yi, H.; Choi, Y. An Overview of GIS-Based Modeling and Assessment of Mining-Induced Hazards: Soil, Water, and Forest. Int. J. Environ. Res. Public Health 2017, 14, 1463. [Google Scholar] [CrossRef]
- Yenilmez, F.; Kuter, N.; Emil, M.K.; Aksoy, A. Evaluation of pollution levels at an abandoned coal mine site in Turkey with the aid of GIS. Int. J. Coal Geol. 2011, 86, 12–19. [Google Scholar] [CrossRef]
- Ni, X.-M.; Chen, P.; Guo, L. Development of a decision-making system for coalbed methane development based on GIS. In Proceedings of the 2010 2nd Conference on Environmental Science and Information Application Technology, ESIAT 2010, Wuhan, China, 17–18 July 2010; pp. 348–351. [Google Scholar]
- Yao, Y.; Liu, D.; Tang, D.; Huang, W.; Tang, S. Evaluation of the Coalbed Methane Potential by a GIS-Based Fuzzy AHP Model. In Proceedings of the 2009 Sixth International Conference on Fuzzy Systems and Knowledge Discovery, Tianjin, China, 14-16 August 2009; pp. 281–285. [Google Scholar]
- Fang, K. GIS network analysis in rescue of coal mine. In Proceedings of the 21st International Society for Photogrammetry and Remote Sensing (ISPRS) Congress, Beijing, China, 3–11 July 2008. [Google Scholar]
- Van Dijk, P.M.; Wang, H.Y.; Van Genderen, J.L. Earth observation knowledge transfer: The example of ITC’s coal fire project. In Proceedings of the 20th International Society for Photogrammetry and Remote Sensing (ISPRS) Congress, Istanbul, Turkey, 12–23 July 2004. [Google Scholar]
- Kresic, N.; Mikszewski, A. Hydrogeological Conceptual Site Models: Data Analysis and Visualization. 2012. Available online: https://books.google.com/books?id=6H383WiTiSQC&pgis=1 (accessed on 10 May 2019).
- Ahm, Z.; Ashraf, A. Integration of Groundwater Flow Modeling and GIS. In Water Resources Management and Modeling; Nayak, P., Ed.; InTech: Rijeka, Croatia, 2012; pp. 239–262. [Google Scholar]
- Li, M.; Liu, H.; Yang, C. A Real-Time GIS Platform for High Sour Gas Leakage Simulation, Evaluation and Visualization. ISPRS Ann. Photogramm. Remote Sens. Spat. Inf. Sci. 2015, 2, 225–231. [Google Scholar] [CrossRef]
- Liu, Z.-P.; Liu, J.; He, Y.-w. Seamless coupling of 3D GIS techniques with FEM and its application to tunneling engineering. Rock Soil Mech. 2017, 38, 865–874. [Google Scholar] [CrossRef]
- Zheng, M.; Jin, M. Modeling and Simulation of Toxic Gas Dispersion in Urban Street Supported by GIS. Geomat. Inf. Sci. Wuhan Univ. 2013, 38, 935–939. [Google Scholar]
- Ma, J.T.; Chen, S.Z.; Zhu, X.T.; He, Z.C. Finite element numerical simulation method of groundwater flow and its application under 3D GIS. J. Geo-inf. Sci. 2016, 18, 749–757. [Google Scholar] [CrossRef]
- Alcaraz, M.; Vázquez-Suñé, E.; Velasco, V.; Criollo, R. A loosely coupled GIS and hydrogeological modeling framework. Environ. Earth Sci. 2017, 76, 1–13. [Google Scholar] [CrossRef]
- Bhatt, G.; Kumar, M.; Duffy, C.J. A tightly coupled GIS and distributed hydrologic modeling framework. Environ. Model. Softw. 2014, 62, 70–84. [Google Scholar] [CrossRef]
- Gebbert, S.; Pebesma, E. A temporal GIS for field based environmental modeling. Environ. Model. Softw. 2014, 53, 1–12. [Google Scholar] [CrossRef]
- Bai, L.; Yan, L.; Ma, Z. Interpolation and Prediction of Spatiotemporal Data Based on XML Integrated with Grey Dynamic Model. ISPRS Int. J. Geo-Inf. 2017, 6, 113. [Google Scholar] [CrossRef]
- Papadimitriou, F. Modelling spatial landscape complexity using the Levenshtein algorithm. Ecol. Informat. 2009, 4, 48–55. [Google Scholar] [CrossRef]
- Papadimitriou, F. The Algorithmic Complexity of Landscapes. Landsc. Res. 2012, 37, 591–611. [Google Scholar] [CrossRef]
- He, X.; Doolen, G.D.; Clark, T. Comparison of the Lattice Boltzmann Method and the Artificial Compressibility Method for Navier–Stokes Equations. J. Comput. Phys. 2002, 179, 439–451. [Google Scholar] [CrossRef]
- Khan, M.A.I.; Delbosc, N.; Noakes, C.J.; Summers, J. Real-time flow simulation of indoor environments using lattice Boltzmann method. Build. Simul. 2015, 8, 405–414. [Google Scholar] [CrossRef] [Green Version]
- Perumal, D.A.; Dass, A.K. Simulation of incompressible flows in two-sided lid-driven square cavities. Part I—FDM. CFD Lett. 2010, 2, 13–24. [Google Scholar]
- Chen, S.; Doolen, G.D. Lattice Boltzmann method for fluid flows. Annu. Rev. Fluid Mech. 1998, 30, 282–300. [Google Scholar] [CrossRef]
- Elhadidi, B.; Khalifa, H.E. Comparison of coarse grid lattice Boltzmann and Navier Stokes for real time flow simulations in rooms. Build. Simul. 2013, 6, 183–194. [Google Scholar] [CrossRef]
- Heinzer, T.J.; Williams, M.D.; Dogrul, E.C.; Kadir, T.N.; Brush, C.F.; Chung, F.I. Implementation of a feature-constraint mesh generation algorithm within a GIS. Comput. Geosci. 2012, 49, 46–52. [Google Scholar] [CrossRef]
- Lu, Q. 3D Simulation of Concentrative Emission Gas Spreading in Ventilation Networks Based on LBM. J. Syst. Simul. 2011, 23, 2384–2390. [Google Scholar] [CrossRef]
- Li, M.; Zhang, X.-p.; Mao, S.-j. Study on deep mining safety control decision making system. The 6th International Conference on Mining Science & Technology. Procedia Earth Planet. Sci. 2009, 1, 377–383. [Google Scholar] [CrossRef]
- Lunarzewski, L.; Les, W. Gas emission prediction and recovery in underground coal mines. Int. J. Coal Geol. 1998, 35, 117–145. [Google Scholar] [CrossRef]
- Bhatnagar, P.L.; Gross, E.P.; Krook, M. A Model for Collision Processes in Gases. I. Small Amplitude Processes in Charged and Neutral One-Component Systems. Phys. Rev. 1954, 94, 511–525. [Google Scholar] [CrossRef]
- Guo, Z.; Shi, B.; Zheng, C. A coupled lattice BGK model for the Boussinesq equations. Int. J. Numer. Methods Fluids 2002, 39, 325–342. [Google Scholar] [CrossRef]
- Smagorinsky, J. General Circulation Experiments with the Primitive Equations. Mon. Weather Rev. 1963, 91, 99–164. [Google Scholar] [CrossRef]
- Hou, S.; Sterling, J.; Chen, S.; Doolen, G.D. A Lattice Boltzmann Subgrid Model for High Reynolds Number Flows. In Pattern Formation and Lattice gas Automata; Lawniczak, A.T., Kapral, R., Eds.; American Mathematical Society: Providence, RI, USA, 1996; pp. 151–166. [Google Scholar]
- Zhang, S.J.; Lin, C.X. Application of Lattice Boltzmann Method in Indoor Airflow Simulation. HVAC&R Res. 2010, 16, 825–841. [Google Scholar]
- Brimicombe, A. GIS Environmental Modelling and Engineering; Taylor & Francis: London, UK, 2003; p. 320. [Google Scholar]
- Hellweger, F.L.; Maidment, D.R. Definition and Connection of Hydrologic Elements using Geographic Data. J. Hydrol. Eng. 1999, 4, 10–18. [Google Scholar] [CrossRef]
- Olivera, F.; Valenzuela, M.; Srinivasan, R.; Choi, J.; Cho, H.; Koka, S.; Agrawal, A. ArcGIS-SWAT: A geodata model and GIS interface for SWAT. J. Am. Water Resour. Assoc. 2006, 42, 295–309. [Google Scholar] [CrossRef]
- Huang, B.; Jiang, B. AVTOP: A full integration of TOPMODEL into GIS. Environ. Model. Softw. 2002, 17, 261–268. [Google Scholar] [CrossRef]


| Characteristics | Coupling Type | ||
|---|---|---|---|
| Loose | Tight | Embedded | |
| Shared data and method base | √ | √ | |
| Intra-simulation model modification | √ | ||
| Intra-simulation query and control | √ | ||
| Advantages & disadvantages | Different GIS and Modeling packages have independent interfaces. Information sharing is based on exchange of files, which can be error prone and inefficient. Different tools and libraries facilitate independent development. | The coupled platform merges different modules in a single powerful system, which avoids inconsistency and data loss originating from redundancy and heterogeneity of method base. Data exchange is automatic between GIS platform and model. | Programming and data management is significantly complex, and the code base is not easy to be changed due to embedded large source code structure. Steerable simulation according to the changes of parameters or processes. |
| Examples | [48] | [49] | [50] |
| Algorithm. The LBM Based Turbulent Velocity-Concentration Coupling Model Integrated with LrGIS Platform |
|---|
| Step 1: Geometric model construction with specific geospatial coordinates. |
| Step 2: Lattice attributes configuration for two different lattice (D2Q9 and D2Q5) |
| Step 3: Main loop starts |
| Parameters initialization: , maxIter |
| For (it = 0; it < maxIter; ++it) |
| If (it = 0) |
| Set static boundary conditions (fluid region, wall). |
| Else if (it != 0) |
| Set dynamic boundary conditions(inflow, outflow and methane emission rate). |
| Do collision step |
| Do streaming step |
| Do coupling step |
| Step 4: Save the result data as time series grid files |
| Step 5: FluentEntity call time series grid files and display field data on LrGIS GUI integrated with various coal mine map objects |
| Parameters | Setting |
|---|---|
| Air density (kg/m3) | 1.225 |
| Methane gas density (kg/m3) | 0.716 |
| Turbulent viscosity(m2/s) | 1.7894 × 10⁻⁵ |
| Turbulent kinetic energy | 1.3 |
| Convergence criteria | 10e−6 |
| Calculation steps | 10000 |
| Lattice size (m) | 0.1 |
| Time step size (s) | 1 |
| Renolds number | 500 |
| Initial pressure | 1/3 |
| Air velocity of inlet (m/s) | 3.17 |
| Methane volume flow at the working face (m3/s) | 0.2 |
© 2019 by the authors. Licensee MDPI, Basel, Switzerland. This article is an open access article distributed under the terms and conditions of the Creative Commons Attribution (CC BY) license (http://creativecommons.org/licenses/by/4.0/).
Share and Cite
Liu, H.; Mao, S.; Li, M.; Wang, S. A Tightly Coupled GIS and Spatiotemporal Modeling for Methane Emission Simulation in the Underground Coal Mine System. Appl. Sci. 2019, 9, 1931. https://doi.org/10.3390/app9091931
Liu H, Mao S, Li M, Wang S. A Tightly Coupled GIS and Spatiotemporal Modeling for Methane Emission Simulation in the Underground Coal Mine System. Applied Sciences. 2019; 9(9):1931. https://doi.org/10.3390/app9091931
Chicago/Turabian StyleLiu, Hui, Shanjun Mao, Mei Li, and Shuangyong Wang. 2019. "A Tightly Coupled GIS and Spatiotemporal Modeling for Methane Emission Simulation in the Underground Coal Mine System" Applied Sciences 9, no. 9: 1931. https://doi.org/10.3390/app9091931