Article

Spatial Analysis of Navigation in Virtual Geographic Environments

1
Department of Geography, Faculty of Science, Masaryk University, Kotlářská 267/2, 61137 Brno, Czech Republic
2
Centre for Experimental Psychology and Cognitive Sciences, Department of Psychology, Faculty of Arts, Masaryk University, Arna Nováka 1/1, 60200 Brno, Czech Republic
3
Division of Information and Library Studies, Faculty of Arts, Masaryk University, Arna Nováka 1/1, 60200 Brno, Czech Republic
*
Authors to whom correspondence should be addressed.
Appl. Sci. 2019, 9(9), 1873; https://doi.org/10.3390/app9091873
Submission received: 6 April 2019 / Revised: 24 April 2019 / Accepted: 30 April 2019 / Published: 7 May 2019
(This article belongs to the Special Issue Augmented Reality: Current Trends, Challenges and Prospects)

Abstract

:

Featured Application

Methods of analyzing user behavior in virtual environments, such as spatial movement and interaction patterns in individuals or within groups, user interface usage.

Abstract

Human performance and navigation activity in virtual environments can be measured and assessed with the aim to draw specific conclusions about human cognition. This paper presents an original virtual geographic environment (VGE) designed and used for this purpose. The presented research is rooted in an interdisciplinary approach combining knowledge and principles from the fields of psychology, cartography, and information technologies. The VGE was embedded with user logging functionality to provide a basis from which conclusions about human cognitive processes in a VGE could be drawn. The scope of this solution is introduced, described, and discussed under a behavioral measurement framework. An exploratory research design was adopted to demonstrate the environment’s utility in proof-of-concept user testing. Twenty participants were observed in interactive, semi-interactive and non-interactive tasks, their performance and individual differences were analyzed. The behavioral measurements were supplemented by Object-Spatial Imagery and a Verbal Questionnaire to determine the participants’ cognitive styles. In this sample, significant differences in exploration strategies between men and women were detected. Differences between experienced and non-experienced users were also found in their ability to identify spatial relations in virtual scenes. Finally, areas for future research areas and development were pinpointed.

Graphical Abstract

1. Introduction

Virtual reality (VR) elements are increasingly used in daily life. After a recent period of disillusionment with virtual reality [1], technological progress (displays, graphics) is now proving VR’s strengths and has established it as a useful and practical tool in many areas of human endeavor. VR can be used to construct virtual geographic environments (VGEs), i.e., specific computer-based environments designed for studying geographic and cognitive phenomena and solving problems in geo-related tasks [2,3,4]. There is a considerable trend in exploring interactive VGEs and discovering details about their features and using their benefits to create, customize and optimize geographic products. Some researchers [3,4,5,6] consider VGEs as a new generation of geographic analytical tools that provide an open digital window into the real world as a means of understanding human cognition and behavior in geographical issues. VGEs can be relevant tools in fields such as urban planning [7,8], crisis management [5,9,10], air traffic control [11], or generally speaking, fields that require support for quick and adequate human decision-making processes based on spatial reasoning.
The term virtual geographic environment (VGE) is rather broad in its definition and usually represents 3D geo-visualization with an enormous range of functionalities. VGEs represent, for example, multi-user, multi-faceted, dynamic geographical products designed for conducting geo-analysis, supporting collaboration, and making predictions, etc. [3]. As such, VGE is a specific type of virtual environment with complex options suitable for specific tasks and extended with different features (e.g., control options, view modes, texture pattern controls). Recent efforts to bring the effect of presence (i.e., the feeling of being surrounded by and/or a part of a (visual) stimulus) to immersive VGEs [12] reveal more valid data about users’ real behaviors. These environments are presented in first-person view in a manner that resembles first-person computer games. In respect of the above-mentioned arguments, the user aspects of VGEs should be subject to specific research and testing and their possibilities and limitations further explored. In this paper, we discuss the context of the use of VGEs and present an original VGE with embedded functionalities for data collection. The environment was tested in relation to user behavioral activity and cognitive ability. We also discuss the possibilities, limitations, and potential implications of VGEs in research and practice.

1.1. User Testing and Evaluation of VGEs

In many areas, current VGEs are still lacking various properties (e.g., fidelity of computer graphics, sensory quality and immersion, ease-of-use of UIs, etc.). Even though VR is continually evolving, research on VGEs was once (and to some extent still is) constrained by huge technological limits [13]. Previous studies (pre-2010’s) on this issue are both rare and questionable in their topicality. Recent strides in VR have provided a great opportunity to make use of realistic and usable simulations for accurate feedback and an unprecedented level of immersion (e.g., 3D visualization). However, the delivery of a persuasive stimuli exposition must also come with detailed recording and subsequent behavioral input analysis (i.e., user interaction with VGE), which plays an important role in the human perception, understanding, and subsequent processing (via interaction) of tasks [14]. From an experimental point of view, VGEs can be considered two-way products. One thing is that VGEs can serve as a controlled experimental stimuli exposition tool, even for potentially complex properties or visual patterns (especially dynamic animations, interactive objects, realism-inducing simulations, etc.); the other advantage is that the users interaction with such controlled virtual environment can be precisely measured/recorded and specific (inter)action patterns can be identified there. This opens up many potential lines of research in view of the fact that VR may help increase the ecological validity of research and experimental control.
With a specifically designed VGE in mind, different types of VR settings (e.g., types of visualization) can be measured and compared. This was previously explored in several studies examining the use of 3D technology in geo-visualizations, for example, References [15,16,17,18,19]. In geography especially, the effects of different visualization types have been compared, for example, between interactive versus static 3D visualizations [16,20], photorealistic versus non-photorealistic 3D visualizations [21,22] and eventually visualizations with different ratios of realistic/abstract elements [23,24,25]. How suitable a visualization is to a user depends heavily on the purpose of the task. Beyond that, the individual differences between users (or groups of users) can also be studied. The approach of measuring individual differences has a long tradition, stemming largely from psychology and behavioral sciences [26]. We reason that a well-structured VGE with proper functionality and supplemented by psychological testing can effectively and quickly provide a large amount of complex user behavioral data, and as such may be used to develop strategies in user interface (UI) optimization and individual customization. The process of adding more than one method of user testing and monitoring to achieve complex insight into user activity is covered by the concept of methodological/research triangulation.

1.2. Spatial Analysis of User Navigation and Interaction

In recent years, progress in the field of geo-visualization has brought about studies on user strategies that make use of cartographic visualizations. For example, Manson et al. [27] explored the usability of web mapping navigation in different interfaces. Using the combined metrics from a computer mouse and eye-tracking, they found significant differences between different types of interface and spoke in favor of the standard GIS approach of rectangle zoom, followed closely by wheel zoom. Wilkening and Fabrikant [28] employed a similar approach to evaluate the effect of time constraints on the usability of a 3D geo-visualization (Google Earth displayed on a computer screen and controlled with a computer mouse). Participants dealt with practical tasks such as assessing the elevation of given points. The proportionality of applied movement interaction types was monitored—this constituted panning (the most common in both experimental conditions), zooming, tilting, and rotating. Interaction with geo-visualizations can also be analyzed in more detail; You et al. [29] compared different pan and zoom function settings. Individual types of virtual movement can also be compared in control devices other than conventional computer mice, i.e., a touch screen was used by Glawischnig and Mahdavi [30] and a Wii remote controller was used by Juřík et al. [14].
The result of interaction with a VGE is usually movement within this environment, which is defined as navigational (or viewpoint) interactivity [31]. Movement of a viewpoint can be represented by a so-called travel path [32]. Analysis of user travel paths is a research method used primarily in studies of human-computer interaction (HCI) [33,34] and 3D UIs [35]. Treves et al. [36] used and analyzed travel paths to distinguish between two types of geo-visualizations (non-guided and guided) in the Google Earth software. Herman and Stachoň [20] and Herman et al. [16] visualized user travel paths as trajectories when differentiating individual types of movement (zoom, pan, rotation) in a 3D geo-visualization. Additional visual or GIS-related analysis can be applied to user trajectories. Zanbaka et al. [34] and Cirio et al. [35] used visualizations of the paths of multiple users. Chittaro and Ieronutti [33] and Zanbaka et al. [34] used heatmaps to depict presence density. As Bowman et al. [32] suggested, traveled distance and the amount of rotation or turns can be measured. When time (efficiency) and traveled distance is measured, the speed of a user’s travel can be calculated [16,20,37].
The use of VGEs lets us examine the influence of specific visualization UI settings on human interaction with the virtual world, especially considering user fluency/speed (efficiency) and correctness (effectiveness) in various perceptual and decision-making tasks. To better understand the whole process of interaction, user strategies must be analyzed while following defined goals. To precisely describe a user’s strategy, we need to capture a wide range of behavioral information, such as user movement trajectory (distances or average speed) or control types used for navigation (e.g., pan, zoom or rotation of the viewpoint). Based on the principle of triangulation, which is conditioned by the controlled setting of a virtual environment, data collected in such VGEs are complex and can help reveal specific patterns in human behavior.

1.3. Cognitive Styles and Route Preferences in VR Navigation

According to previous psychological research, an individual’s spatial skills such as navigation and orientation in space are determined by a specific cognitive style [38]. Cognitive style was originally defined as a psychological dimension representing the consistency of an individual’s information processing [39]. Currently, we understand the concept as a way of acquiring, organizing, and processing information [40], or as a manifestation of the means of personality traits [41]. Blazhenkova and Kozhevnikov [42] discussed cognitive styles from the perspective of visual processing ability and suggested that people can distinguish between object visualizers and spatial visualizers (that these are the two diverging cognitive approaches in processing visual data). The existence of spatially-oriented people or those who are more object-oriented or verbally-oriented was previously explored in several studies [43,44,45] and highlighted the existence of inter-individual differences between people in these cognitive styles. We can see a cognitive style as a specific mental setting that may influence the perception and cognitive elaboration of specific perceived content. Through this process, active human behavior (e.g., navigation, locomotion in an environment, judgement, etc.) can also be affected. The construct of visual cognitive styles can be measured, for example, by the Object-Spatial Imagery and Verbal Questionnaire (OSIVQ) developed by Blazhenkova and Kozhevnikov [42]. In this study, we explored the relationship between participants’ self-reported visual cognitive styles and their performance in the VGE concerning their movement trajectories (among others). The data obtained concerning the participants’ cognitive styles and behavior in the VGE was analyzed.
The understanding of spatial relations, spatial context and orientation in space was covered under the process of wayfinding [46]. Previous research explored how real spatial relations translated into internalized spatial knowledge, i.e., cognitive maps [47,48]. Other research described the typology of space according to which this knowledge was created [49,50]. Exploration of physical space is an ongoing process that integrates and links recently acquired spatial knowledge with knowledge that is already known [51]. Superficially, this is the process of route selection [52] and has been explored in many contexts, for example, behavior during emergencies [53], vehicle navigation [54], animal behavior [55], child behavior [56], and others. The VGEs presented in this paper were purposefully designed to accommodate for the aforementioned theories. This applies to overall spatial layouts, sectioned areas, paths, crossroads, and even the props of the environment—all of which draw from the concepts covered by wayfinding and the visual cognitive styles theory. Even though the VGE visuals are made out of freely available resources and can be shared across different installations using the same software, the need to create a controlled environment that would follow along the theories to an adequate level of complexity had to be reached. In this study, we collected and visualized participants’ movements to obtain information about individual and generalized route selection in the context of the presented VGE.

2. Methods and Technologies

The study examined user behavior in a virtual environment and the psychological concepts explaining participant behavior. Since users were engaged with the environment in great detail, the technological solutions for the experiment were considered a key aspect of this study. The original user and data logging functionalities were implemented into the VGE setting and the entire experiment was conducted based on this.

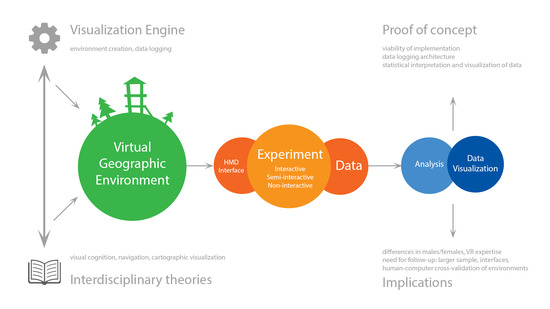
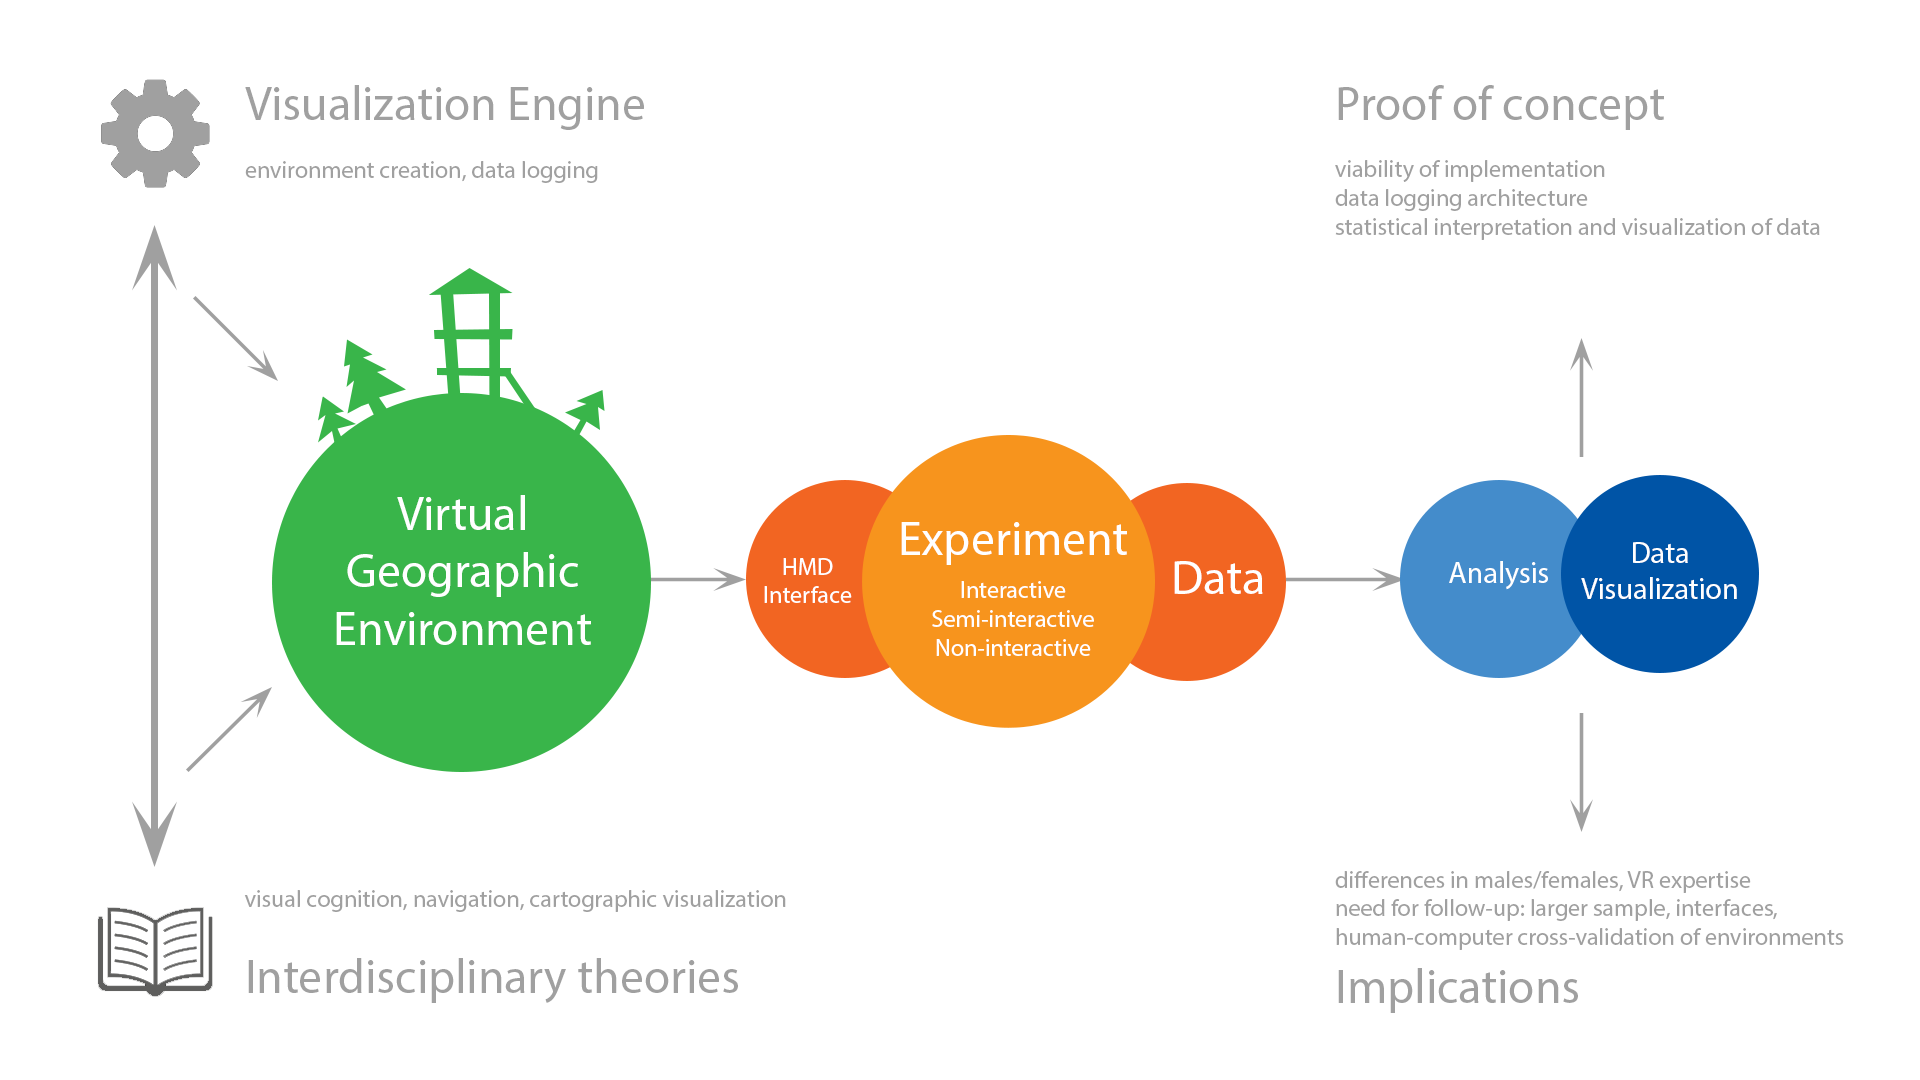
2.1. Visualization Engine

To make sure the experimental design was effectively constructed, an optimized virtual environment creation workflow was devised, and compatible hardware was found. Combined with sufficient software implementation of real-time data-logging algorithms and a user interface tailored for ease of use, a valid process for obtaining data was established.
Hardware—The experiment was designed for potential use with both Pseudo-3D [57] visualization interfaces (monoscopic devices, e.g., PC monitors) and Real-3D [57] interfaces (stereoscopic devices, e.g., 3D monitors with shutter glasses or head-mounted displays). In our case, participants were outfitted with a head-mounted display, as the research primarily focused on user behavior in a virtual environment with a full VR experience (i.e., not employing multiple visualization devices, because this would have introduced extra experimental variables). All participants used the same kind of device with the same parameters, calibration settings, etc. The participants were given an Oculus Rift DKII head-mounted display (Full HD resolution, 75 frames per second, 110 deg. field of view). The head-mounted display was also outfitted with an aftermarket SMI iView-NG eye-tracker (with 60 Hz binocular sampling frequency), though eye-tracking data were not analyzed in this paper. The experimental scenes were rendered on an Intel i7 5820 K system (6 × 3.3 GHz), outfitted with an nVidia GeForce GTX 980Ti graphics card—a system powerful enough to prevent any potential framerate drops.
Software—Unity version 5.4.3 was used as the visualization engine and central point of our application development. Unity provides free-to-use resources and customizable plugins that facilitate relatively quick application development. Thanks to the open and well-documented application program interface (API) of Unity, we were able to utilize or tweak some of the functionalities of the engine, but also to implement some others of our own. The API is written in the C# programming language, through which we were able to complement to the utility of the VGE to fit our purposes (e.g., user behavior logging, or teleporting users from one experimental scene to another). Unity offers support for the latest devices, including head-mounted displays. All the virtual environments participants were exposed to were created in Unity. To compose the environments, a combination of freely available 3D objects (Unity Store) was used, along with our own objects created in external applications (e.g., Photoshop textures, Blender 3D models) for each scene with respect to their intended saturation as visual stimuli.
A universal user interaction logging component was implemented and recorded the following input:
  • virtual movement (trajectory of movement in virtual space)
  • mouse movement (looking around and/or changing direction of movement)
  • head movement (looking around using a head-mounted display)
  • keyboard interaction (eliciting movement in virtual space)
  • participant–object collisions in the virtual world (interaction with features in virtual space)
  • (optionally) eye-tracking data (participants’ eye fixations on objects)
Virtual movement, mouse movement and head movement were recorded with a frequency of 2 Hz (one record per 500 ms). Keyboard interaction and participant-object collisions were recorded as these events occurred. All participants’ interaction data were saved as CSV outputs (Data S1) to allow additional analysis and visualization using statistical software or external visualization applications.
VGE—The software fully facilitated creation of the environment. No external tools (except for those data logging ones created by us) were used, as none were needed. The 3D objects which established the VGE were either free-to-use items obtained from the Unity Asset Store (an official depository of Unity packages) or created by us. The VGE creation process was streamlined: first, following the visual cognition theory, a subject matter (an outdoor, mountain-like environment) was chosen, along with conceptualizing a suggested spatial layout draft (the size of the environment, main routes, and key landmarks). Then, a rough 3D terrain of the experimental space was created. After that, the environment was iterated upon—either by more detailed passes (e.g., large vegetation to small vegetation) or by thematic passes (e.g., when man-made structures were added). Sunlight was introduced into the environment. Finally, any imperfections of the environment were searched for and fixed (visual or performance issues). It was ensured that the visuals of the VGE would run well on the hardware provided and that they would be distributed evenly.

2.2. OSIVQ

Based on previous findings [44], proponents of the object/spatial dichotomy [45] developed the OSIQ, which is a self-assessment questionnaire (Object-Spatial Imagery Questionnaire) consisting of two general scales. The object scale reveals preferences for clear, colorful representations of detailed objects. The spatial scale shows tendencies for representations involving object relationships and spatial transformations. The questionnaire was subject to validity and reliability testing. Results have shown that the questionnaire is reliable in both scales (object scale Cronbach’s α = 0.83, spatial scale Cronbach’s α = 0.79). Unlike previous questionnaires in this area, OSIQ is not impaired by low prediction validity—the object scale correlates with performance tests of object imagery; similarly, the spatial scale correlates significantly with performance tests focusing on spatial imagery [45]. As an extension to 2006’s OSIQ, Blazhenkova and Kozhevnikov [42] developed the OSIVQ—adding a third, verbal scale to the object/spatial scales, which remained unchanged. This extended version was used in this study.

3. User Study

This paper presents an exploratory study to demonstrate the functionality of a virtual environment and suggests topics suitable for future research. A correlation analysis focusing on the relationship between self-reported individual cognitive styles and participants’ behavioral performance in a virtual environment was conducted as a demonstration of psychological application of the tool. Data collected in the VR experimental scenario (distances walked, pauses, time) were correlated and compared to the information acquired from participants’ self-reports (the OSIVQ, participants’ sex, and participants’ experience with map/PC/VR use). Since this study dealt with an original implementation of a specific VR testing tool, the basic features of an experimental VR environment and variables regarding future experimental designs (e.g., sex or differences in expertise) were also analyzed to demonstrate the tool’s potential for assessing individual differences.
The analysis was done in R using RStudio. All graphs were created in RStudio. Spatial visualizations were created in the Processing visualization language.

3.1. Procedure

The experimental tasks were presented after participants were briefed, introduced to and trained in the devices and familiarized with the experiment. In the initial briefing, participants were questioned about any visual disorders that could potentially interfere with testing. They were also asked about their experience in using computers, 3D applications and maps. Regarding ethical standards, participants were informed about the nature of the experiment (spatial cognition) and their right to withdraw from the experiment if they experienced any motion sickness or for any other reason.
The participants were seated in a non-swivel chair facing an LCD screen with a keyboard and a mouse; on top of the LCD screen, a pre-calibrated HMD motion tracking camera was placed. The participants were then instructed on the principles the controller interface worked: mouse movement allowed them to move their whole virtual body on the horizontal axis, effectively changing the direction they were going; in contrast to this, head movement while outfitted with the HMD translated to head-only movement in VR (that is, looking around in both axes, all while not altering movement direction). To move through the VGE, keyboard arrow keys were provided. To get accustomed to the interface prior to the experiment, the users were first introduced to a training environment. (Figure 1b, map B).
To summarize, all participants underwent the same procedure (in the following order):
  • Inquiry into their demographical data and possible health limitations regarding vision and motion sickness.
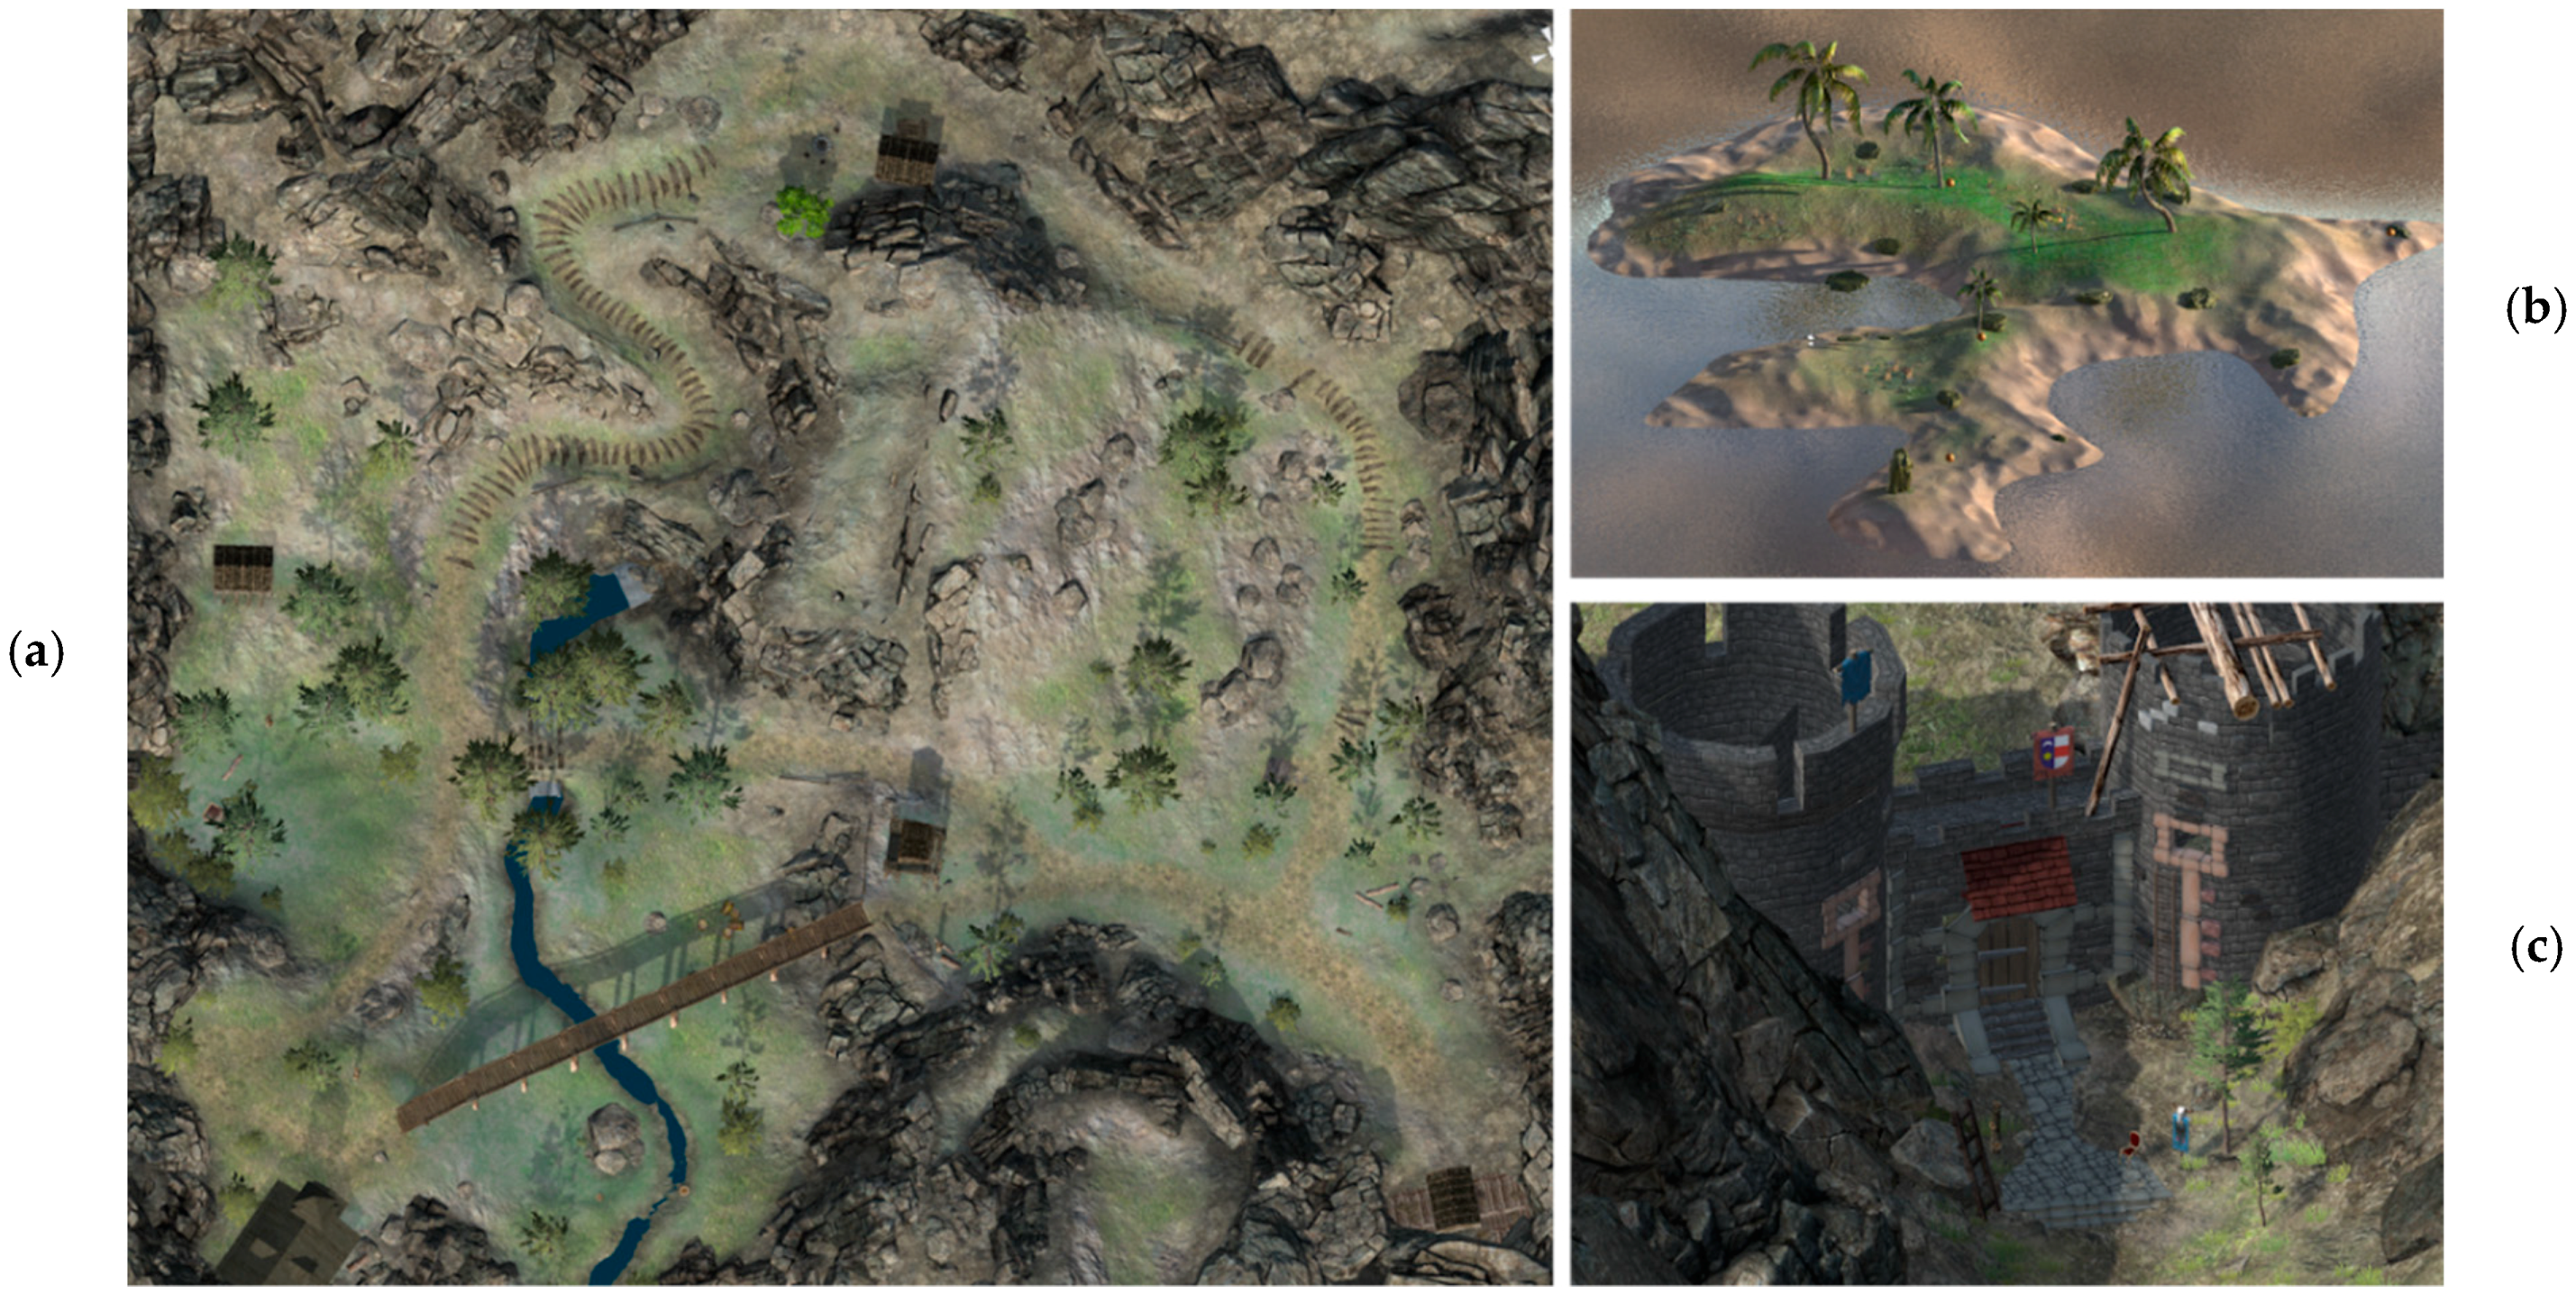
  • Exploration of a small-scale interactive training environment with a task (Figure 1b, map B).
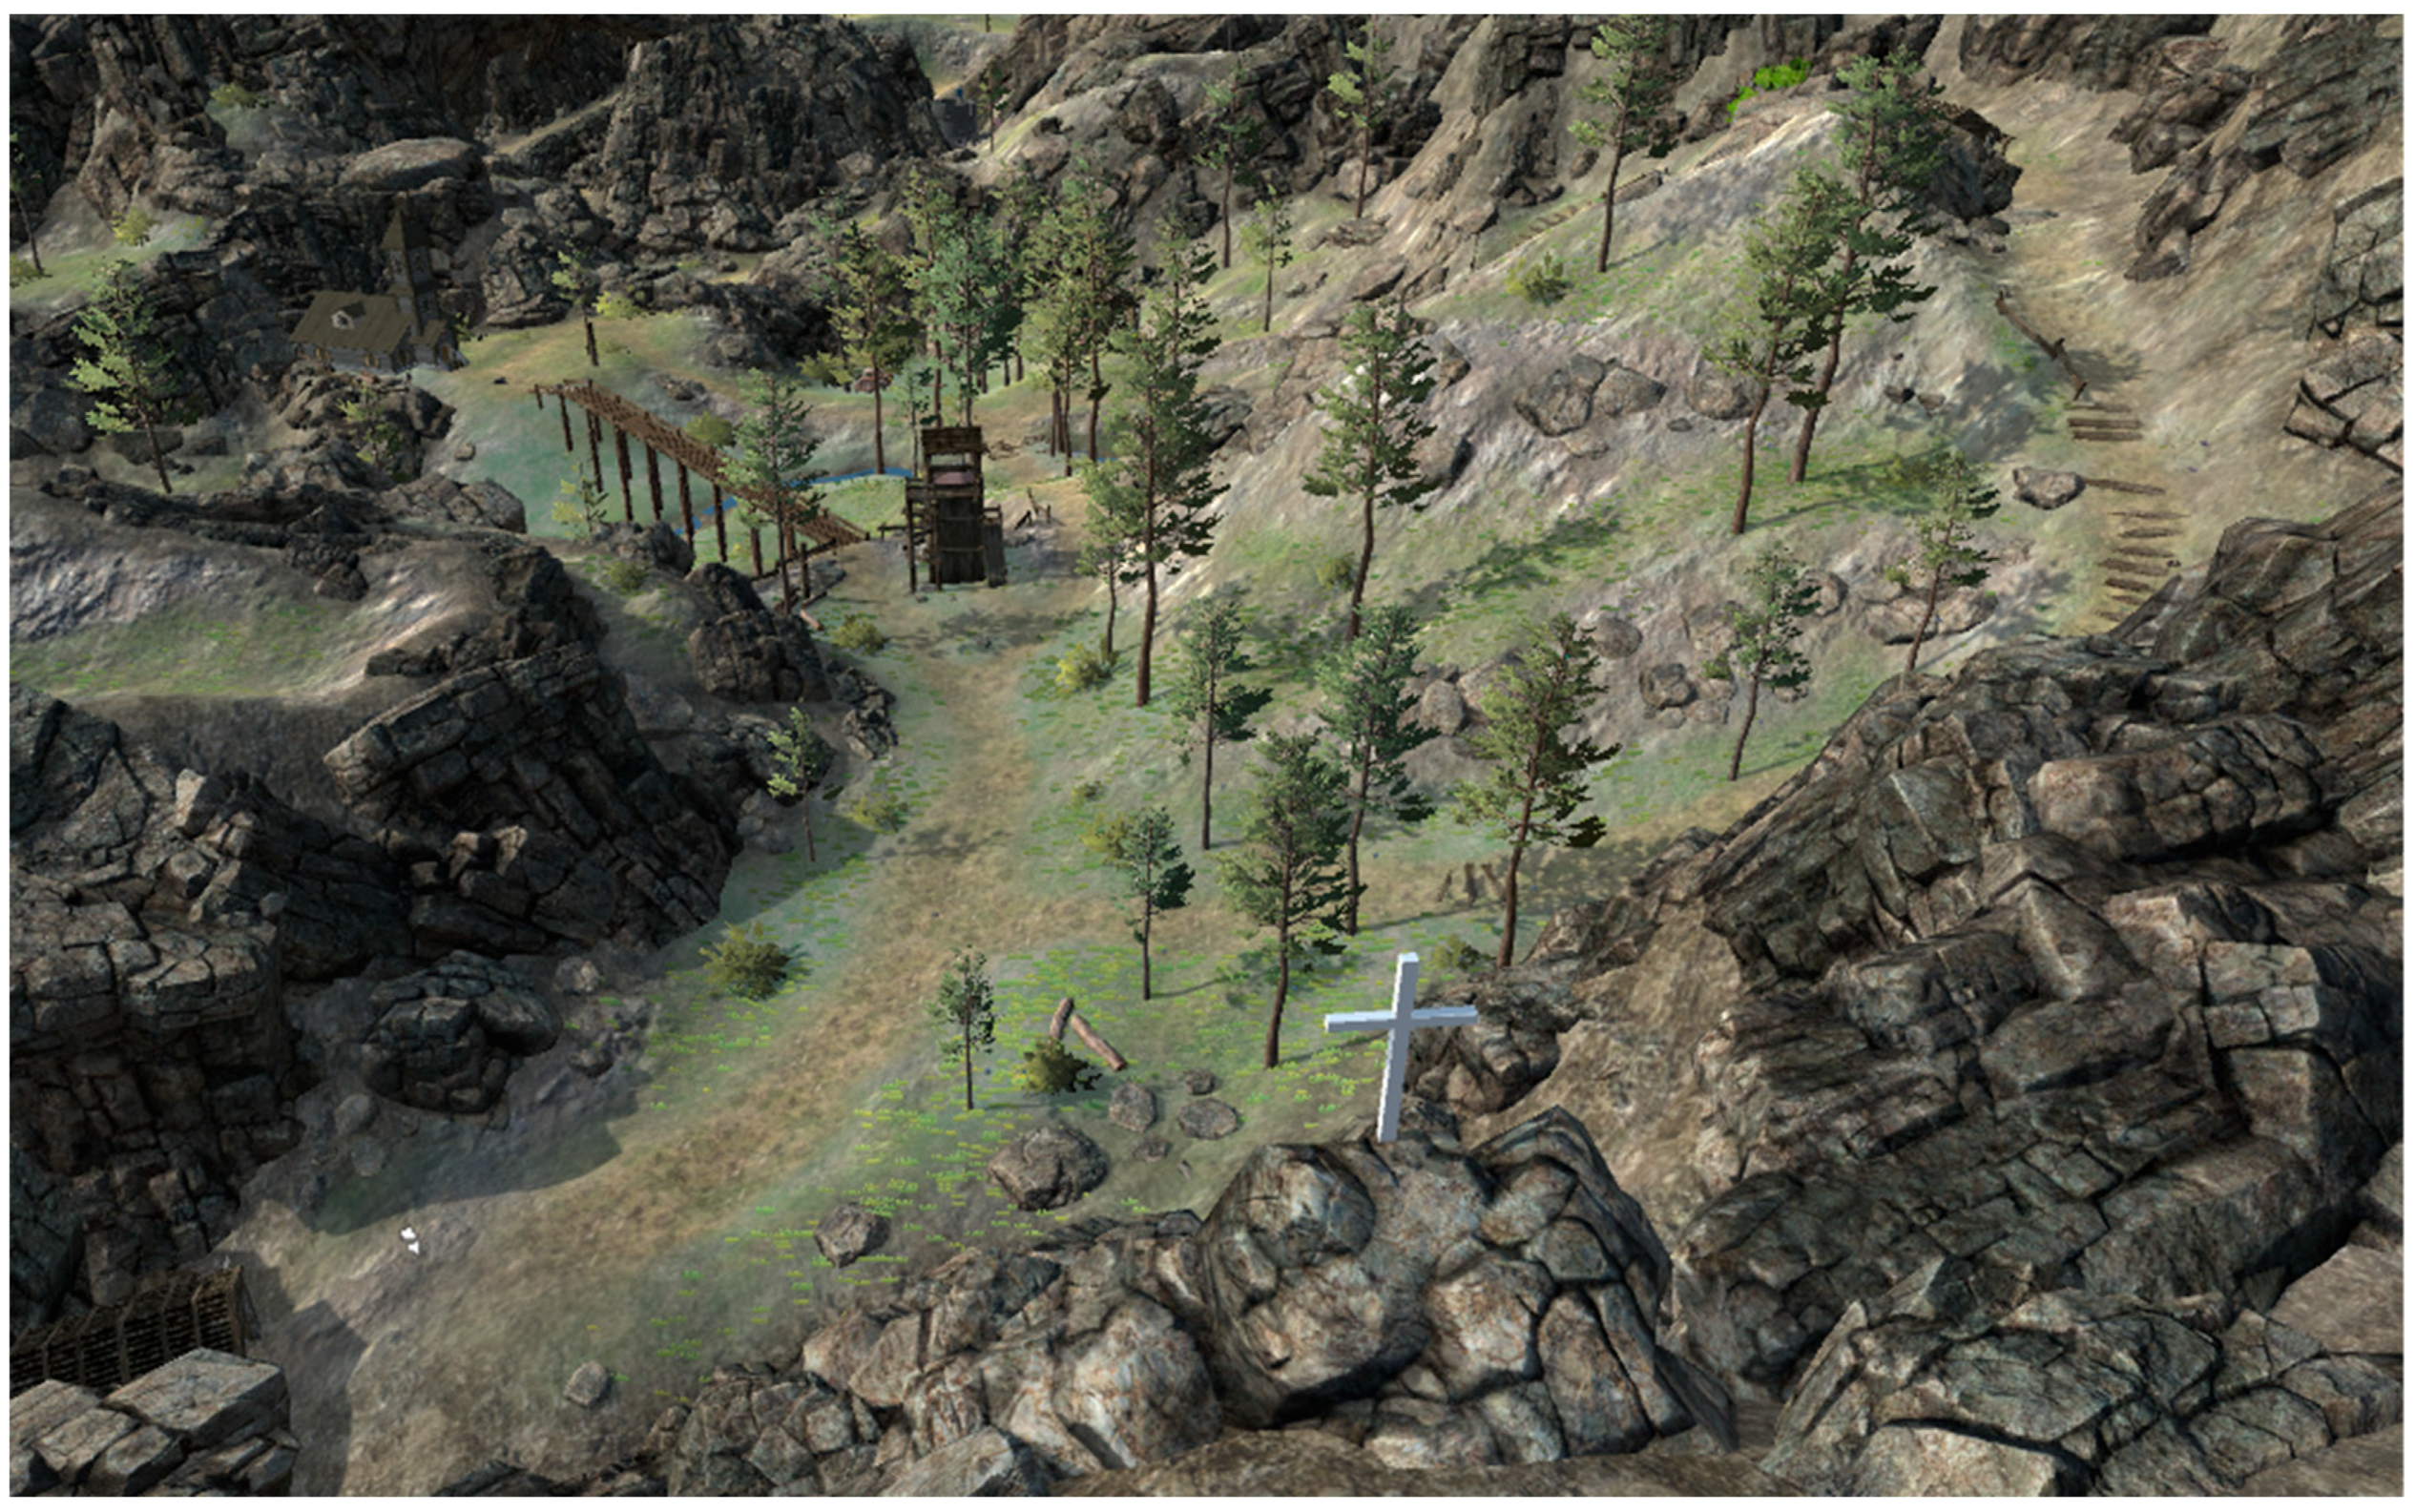
  • Free exploration of an interactive experimental virtual environment (Figure 1a, map A) and memorization of its features.
  • Observation of another semi-interactive scene (Figure 1c, map C) and answering questions about the spatial layout of the specific components in the scene.
  • Choice of the correct appearance of various objects in the semi-interactive scene (Figure 1c, map C) in a multiple-choice questionnaire.
  • Completion of the OSIVQ questionnaire.

3.2. Participants

We engaged 25 participants in the experiment. The sample of 25 psychology students was recruited from the Department of Psychology, Faculty of Arts, Masaryk University, where we expected a rather low general experience with head-mounted display (HMD) technologies. We initially excluded two individuals with visual impairments. Three other participants were excluded because of incomplete experimental runs caused by VR-induced motion sickness. The final number of analyzed participants was 20 (10F/10M; aged 20–26, m = 21.33, sd = 1.602).

3.3. Stimuli and Tasks

For the purpose of this study, a realistic visualization of a rural mountain range was created (Figure 2). This environment deliberately included key visual components according to spatial landmark theories such as trails, districts, environmental borders/edges, key landmark objects [50,51], etc. This included detailed and unique items scattered across the environment. The user interface consisted of head-mounted display, keyboard and mouse. A small, purposefully bland tropical island (Figure 1b, map B) was created for a trial task to familiarize participants with the control devices and VR technology. The overall visual complexity of the trial island was much lower than the one of the experimental environment, as the emphasis in there was on the user interface. To learn the principles of the interface, participants were asked to walk around the island in a first-person perspective and collect five objects (virtual coconuts) scattered across the terrain. Since some of the objects were harder to find than the others, it took the participants about 2–5 min to find them. Individual differences in the trial task can be attributed to participants’ visual attention and their initial mastery of the interface. In spite of a brief exposure, this task ensured the participants with no prior VR/3D experience grasped the necessary skills to navigate in a VGE.
After completing the trial task, participants were brought to the experimental mountain range environment (Figure 1a, map A; Figure 2). This environment was much bigger, spanning half a square kilometer. Here, participants were instructed to freely explore the features of the environment. An undisclosed time limit (10 min) applied to exploration (if they exceeded this limit, participants were then asked to finish exploring); this limit was not disclosed to participants in order not to induce any feelings of constraint and to keep the process of exploration natural to reflect the participants’ specific visual cognitive styles. As they explored, data was collected on participants’ movement patterns, stops/ times spent pausing, and use of the interface.

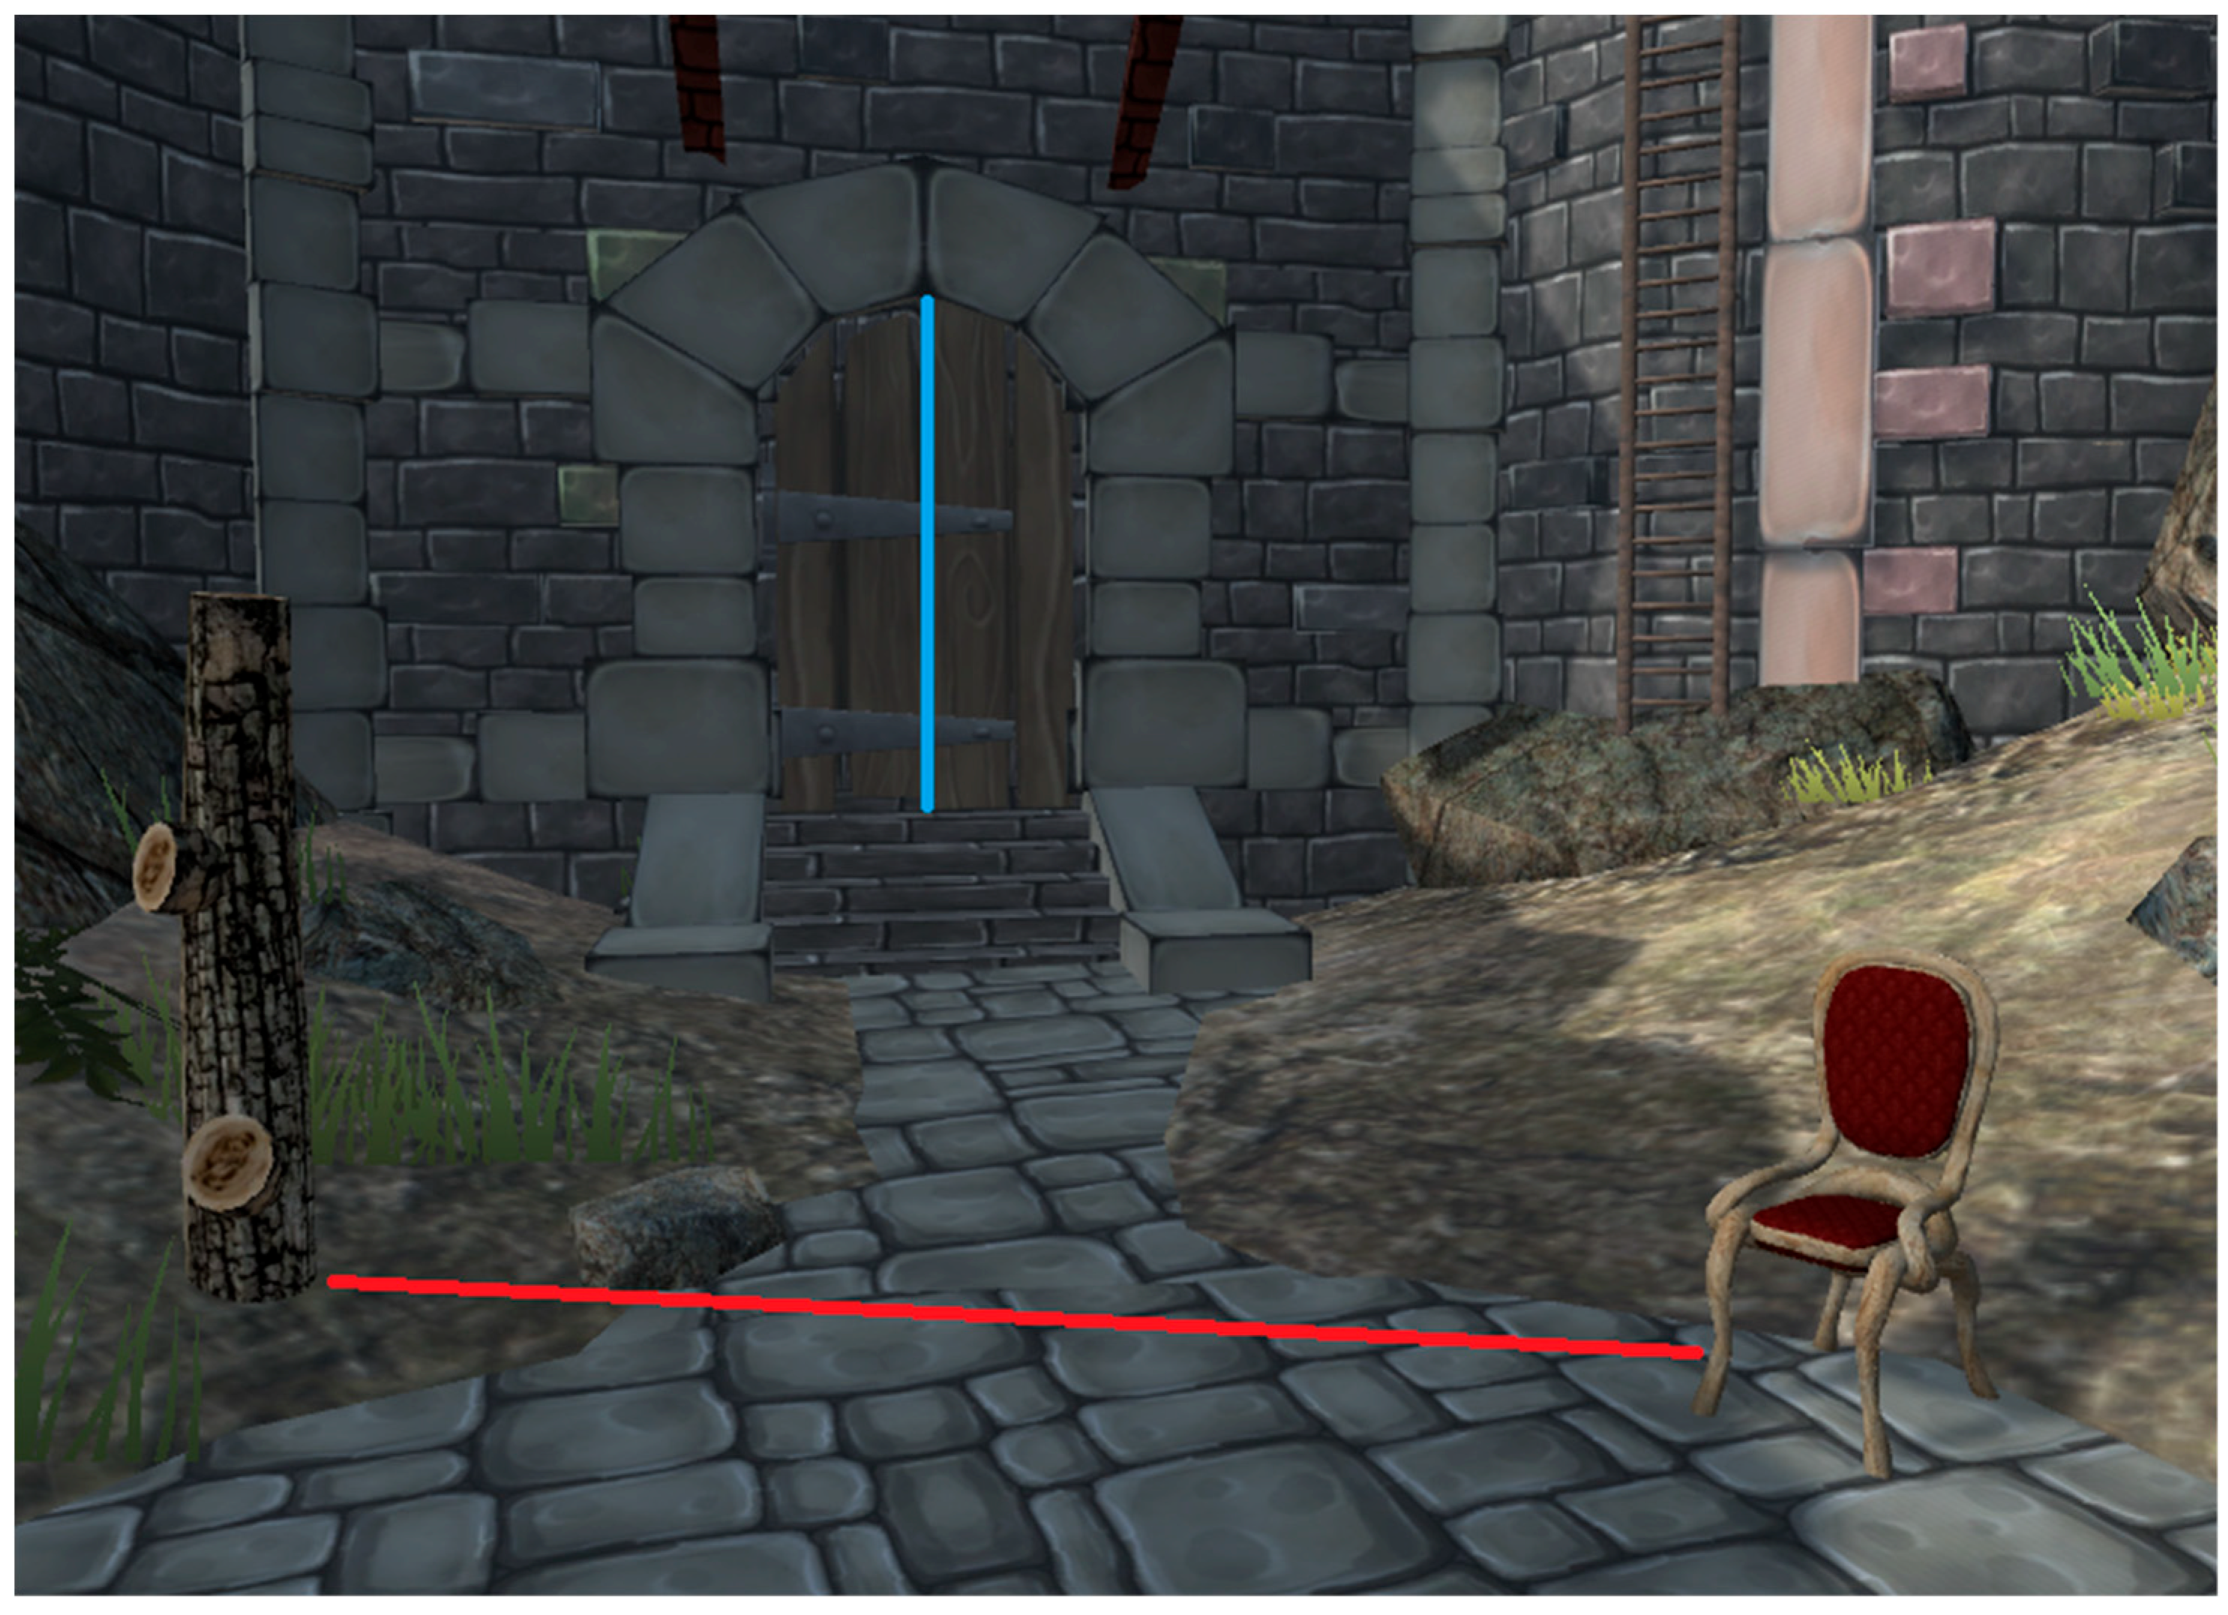
3.3.1. Spatial Relations Identification Task (SRIT)

After participants were notified or once the ten-minute period had expired, participants were transferred to a semi-interactive scenario (Figure 1c, map C), where they were asked to observe a small castle. They were allowed to look around freely, but their spatial movement/locomotion was disabled.
After an initial period of free observation of the castle, participants were asked ten questions concerning the spatial distances in the exposition, for example, the distance from their own position to a specific object in the scene, the width/height of an object or the distance between two other objects (Figure 3 for scene appearance, Appendix A for the questions asked in the task). This task’s objective was to mirror the self-reported spatial scale on the OSIVQ, specifically focusing on participants’ spatial orientation skills.

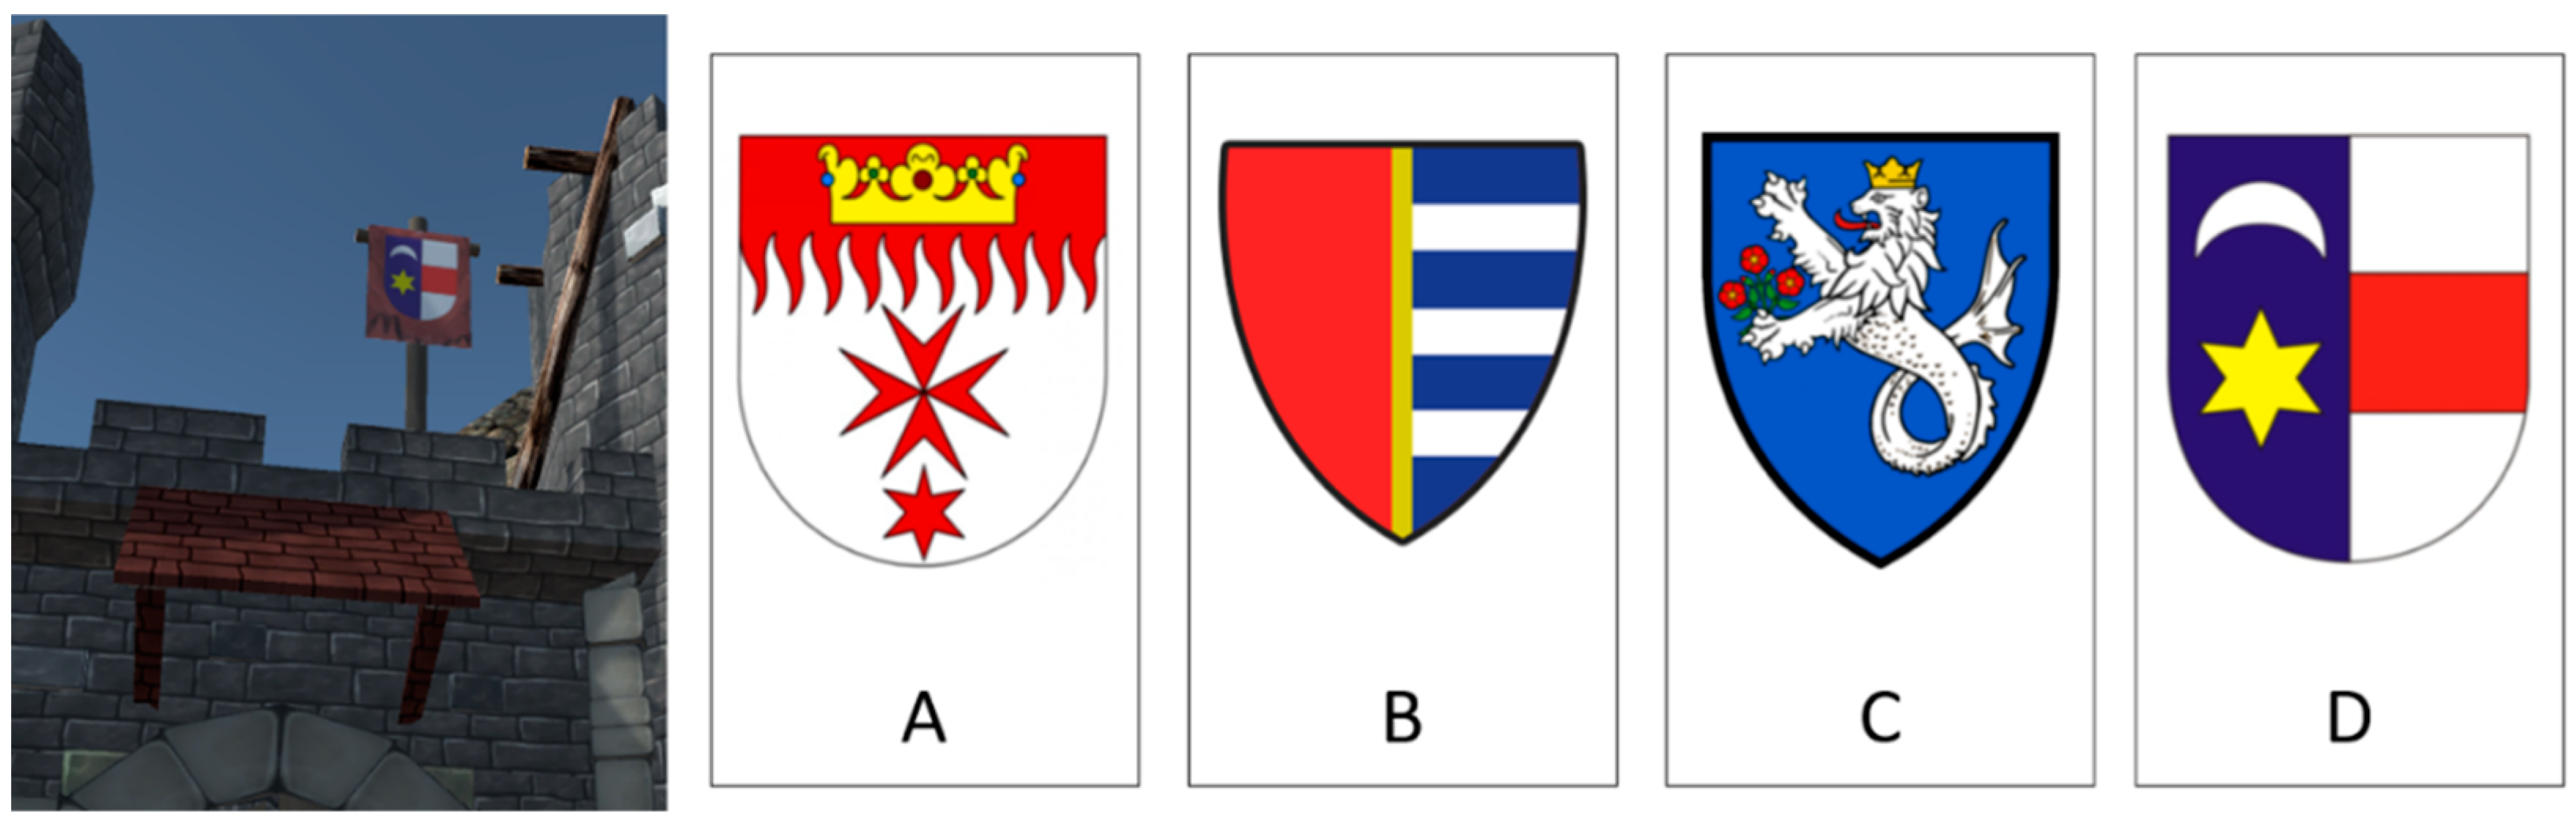
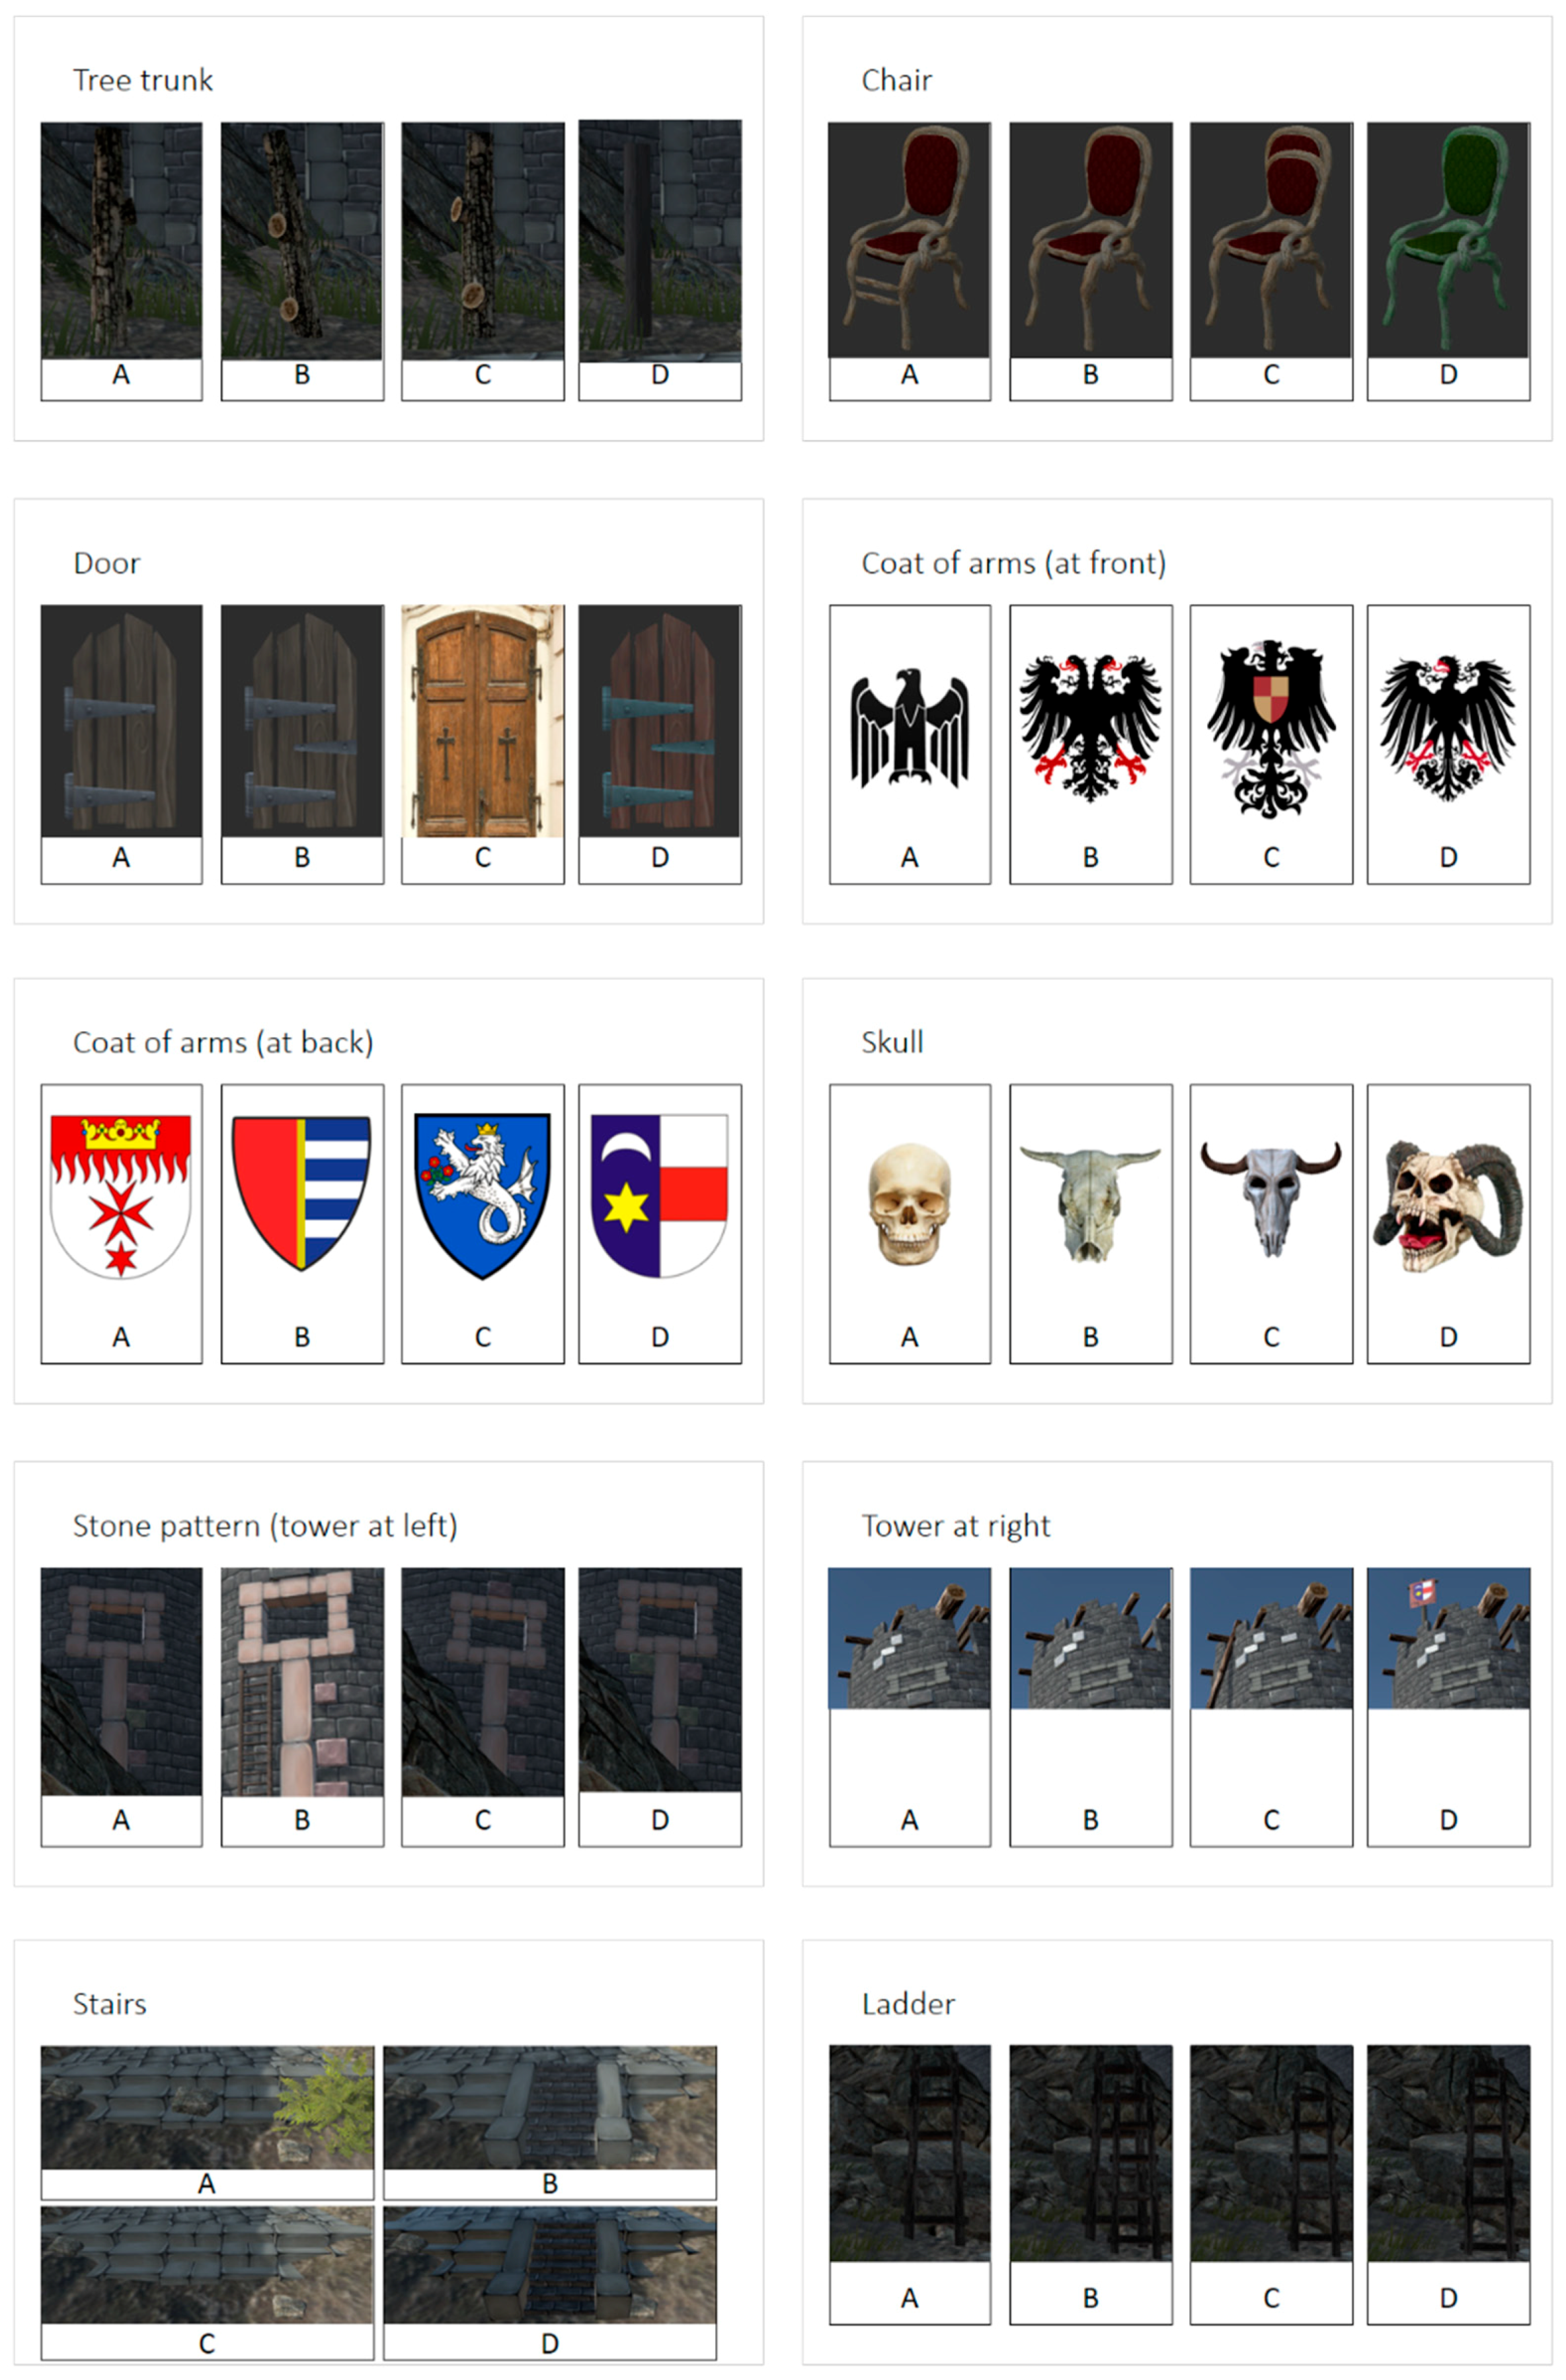
3.3.2. Object Visual Recognition Test (OVRT)

The final task was designed to evaluate participants’ visual cognition object-scale abilities in relation to the aforementioned OSIVQ, specifically focusing on participants’ spatial orientation skills. At this point, the VR headset was already set aside; this task was executed digitally on a standard 24” PC screen. In a series of full-screen slides, participants were given ten visual discrimination questions. In each of these questions, four cut-out images of a portion of the scene shown in the previous task were presented, one of which depicted an object that was present in the scene. The other three were distractors, i.e., intentionally modified or substituted objects (Figure 4 shows an example item, Appendix B for the entire test).
The participants were asked to report the correct answer for each question and then proceed to the next question by pressing a key. There was no time limit for answers, and participants were allowed to progress through this test on their own. After each keypress, the next question’s stimuli appeared with no delay. Once participants had answered the final OVRT question, the testing concluded.

4. Results

4.1. Exploration of the Virtual Environment–Descriptive Data

4.1.1. Overall Required Time

On average, participants took 396 s to explore the mountain range environment. Participants walked a distance of 1180 meters on average. Both of these trends pass the Shapiro–Wilk test for normal distribution (time, p = 0.72, distance, p = 0.99), and the experimental environment therefore met the requirements for further parametric analyses. Only three of the 20 participants exceeded 10 min in their exploration.

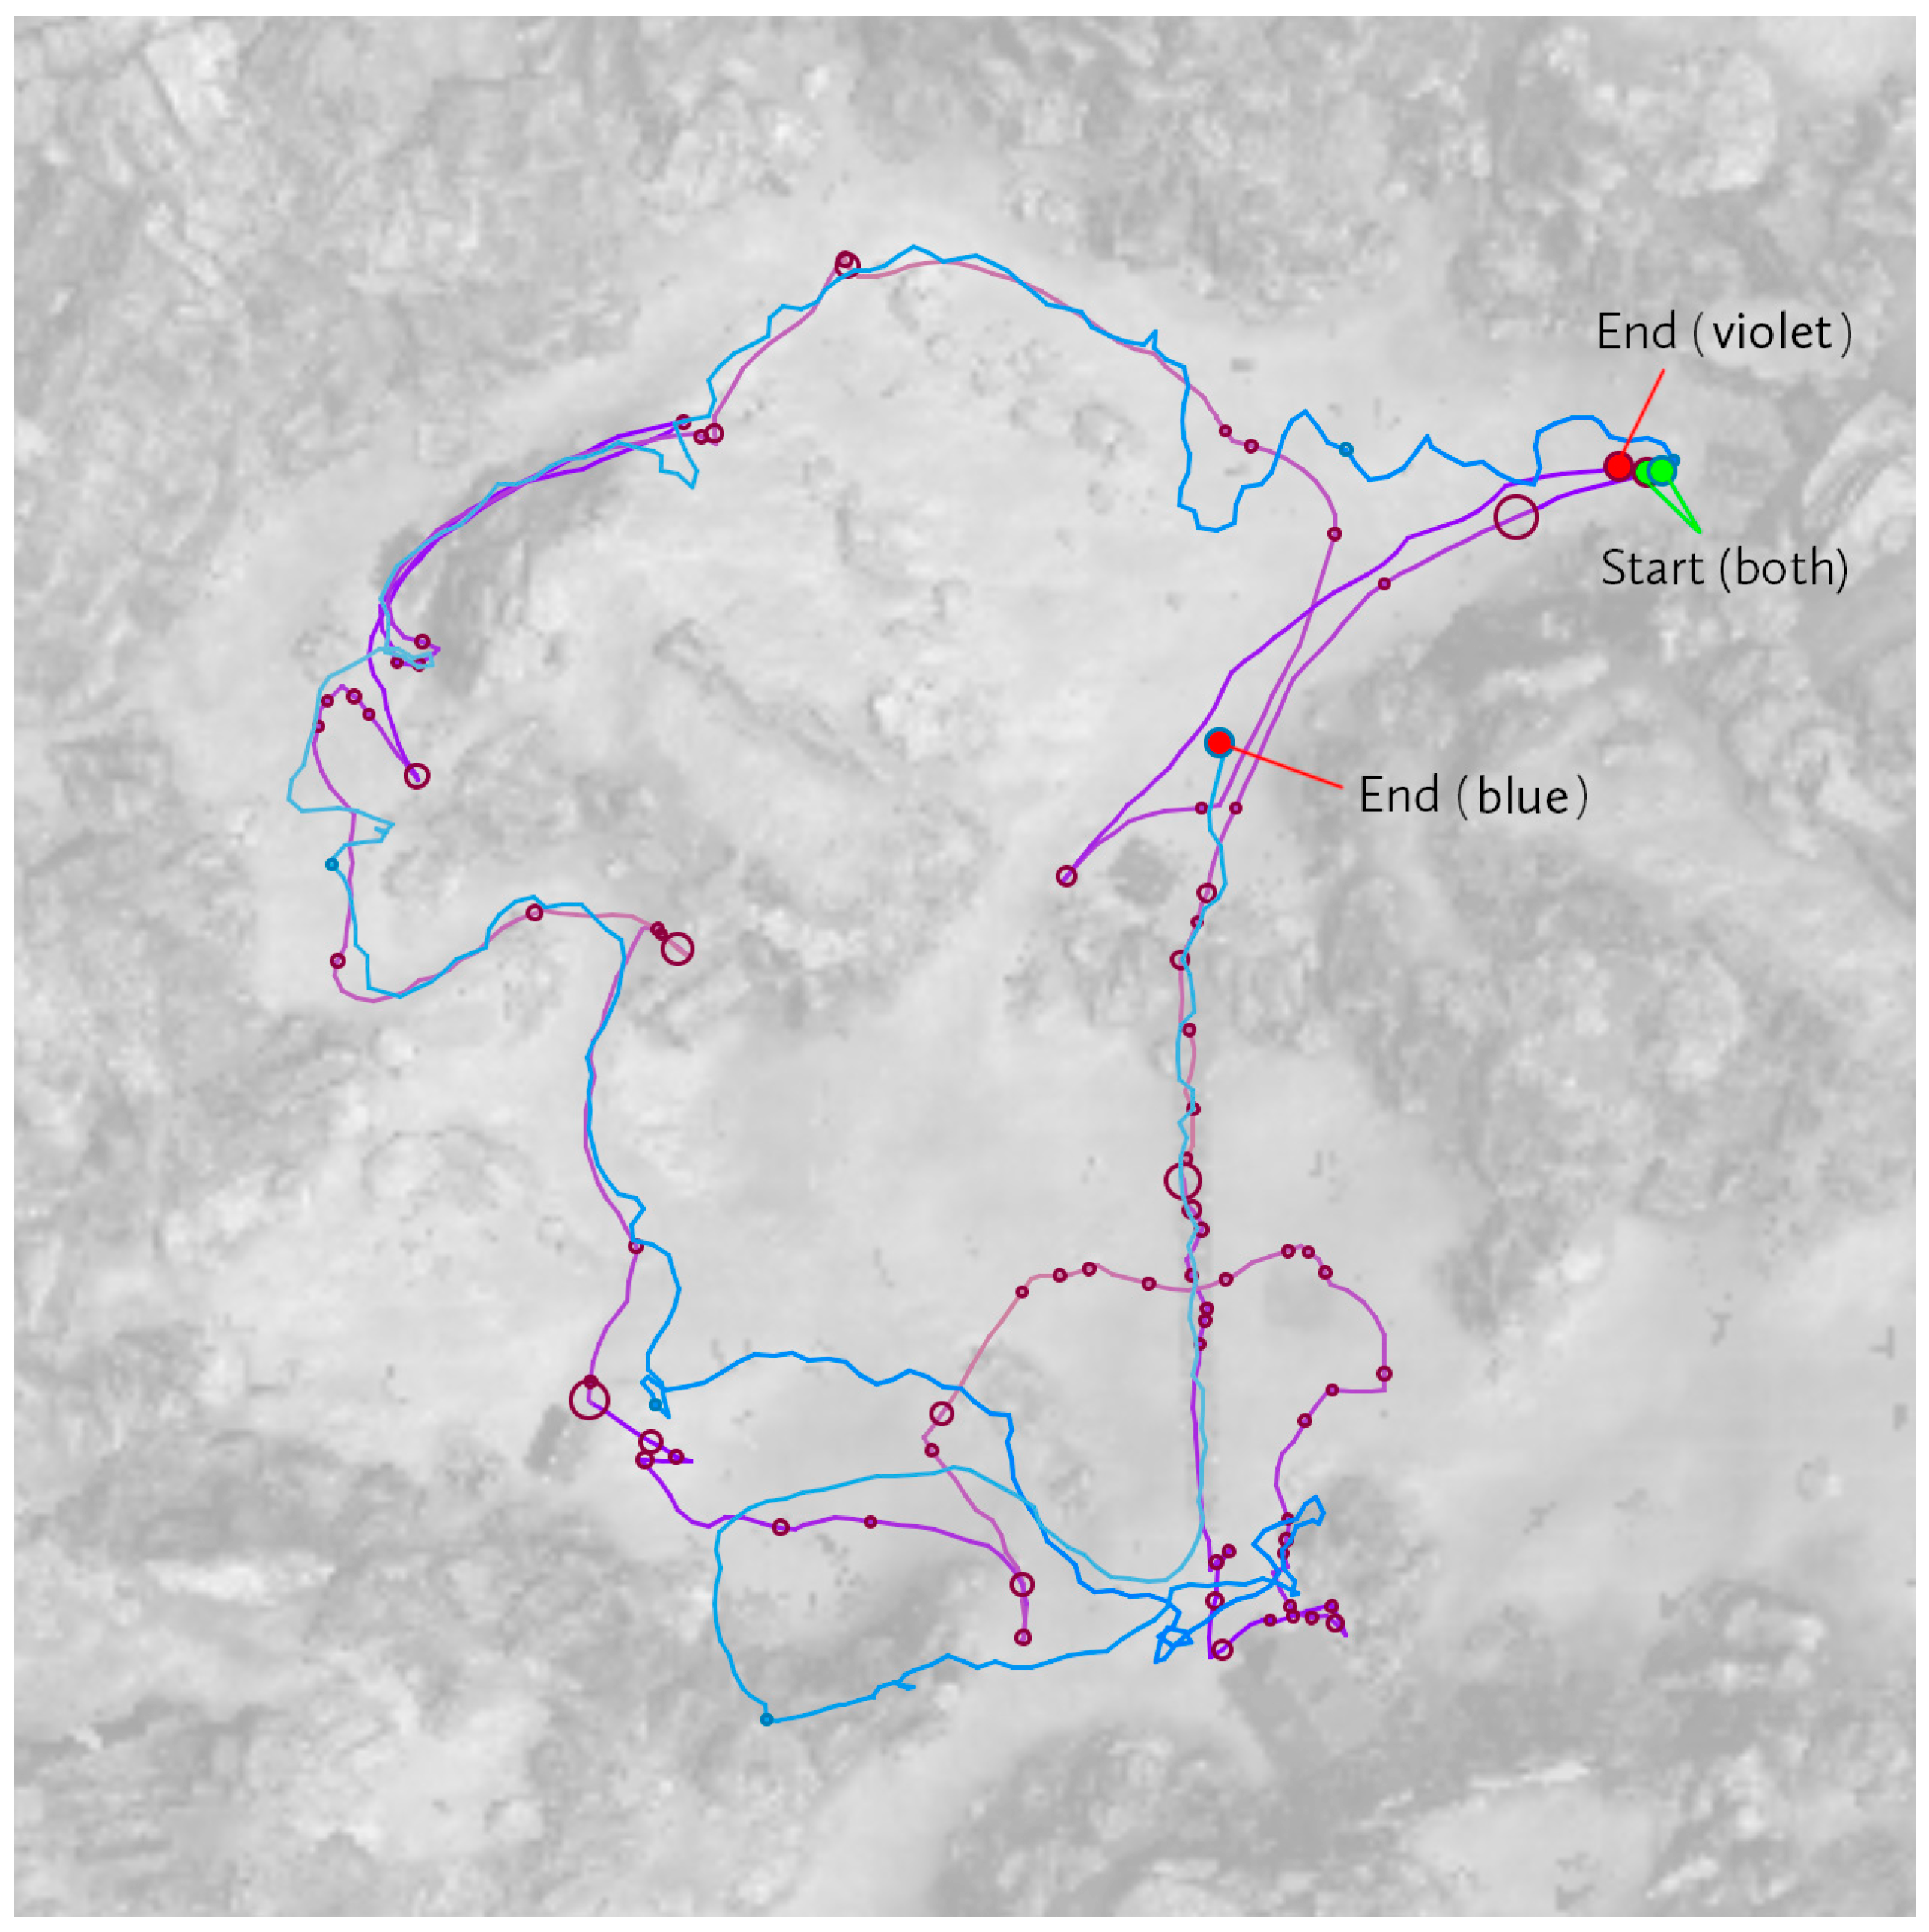
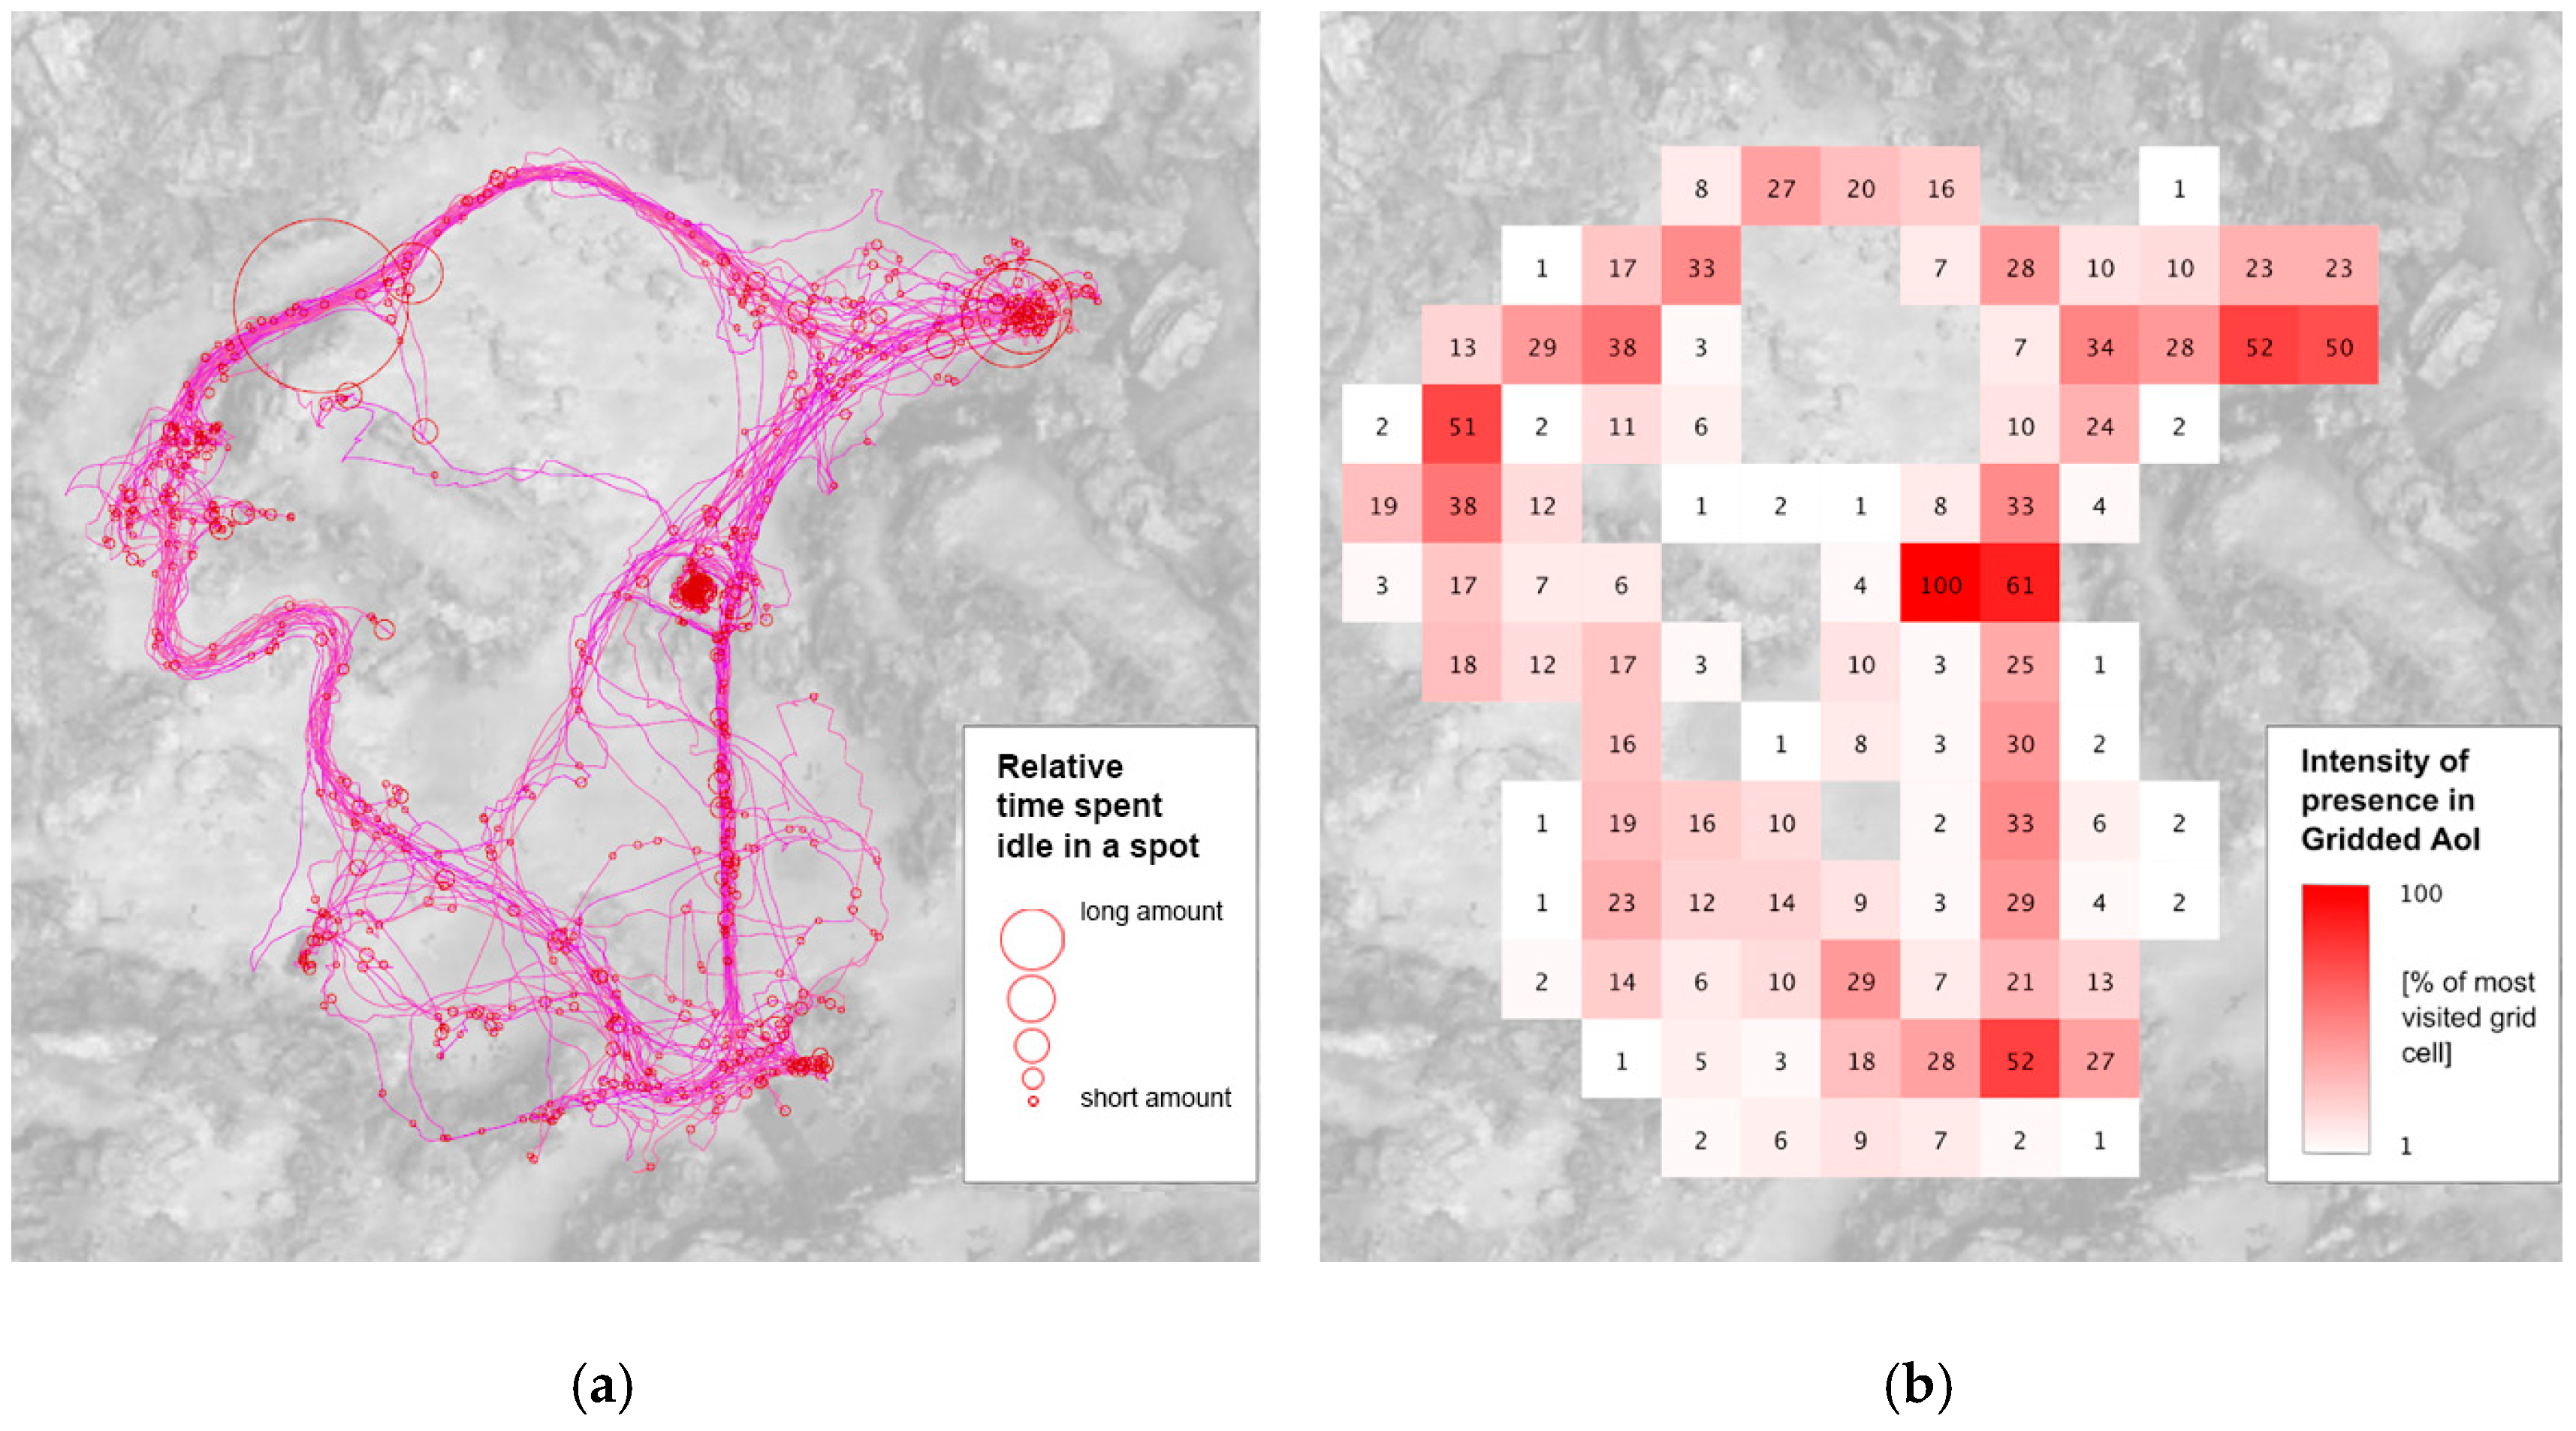
4.1.2. Visualization of Exploration Strategies Based on User Logs

Some differences in the participants’ exploration strategies were observed during user testing. Some walked almost the entire time while exploring; others tended to stop and look around. Corresponding data was measured in our visualization engine (see Section 2.1) and then visualized as virtual trajectories to provide an understanding of participants’ exploration approaches (see the comparison of virtual trajectories of two participants employing different exploration strategies in Figure 5 and an overview of all participants in Figure 6a,b). To compute and visualize this data, we used an external script in the Processing programming language (version 3.5) to load virtual movement data collected in the experimental procedure. Figure 6a is a merger of all the individual paths travelled by the participants (each red circle represents a single instance of a participant stopping in a place). Figure 6b also illustrates the use of the Gridded AoI (Areas of Interest) method. Gridded AoIs were created as squares. In each, the number of participant occurrences were determined in order to show a generalized representation of the most prominently visited areas of the environment (to improve comprehensibility, data in the grid cells were relativized). Figure 6a,b show that participants had some prominent route preferences in common; these preferences are further considered in the discussion.

4.1.3. Statistical Analysis of User Logs and Mental Measurements

Using the experiment’s logged data (Data S1), we extracted the following virtual movement parameters:
  • exploration time (the total time a participant spent in the environment, in seconds)
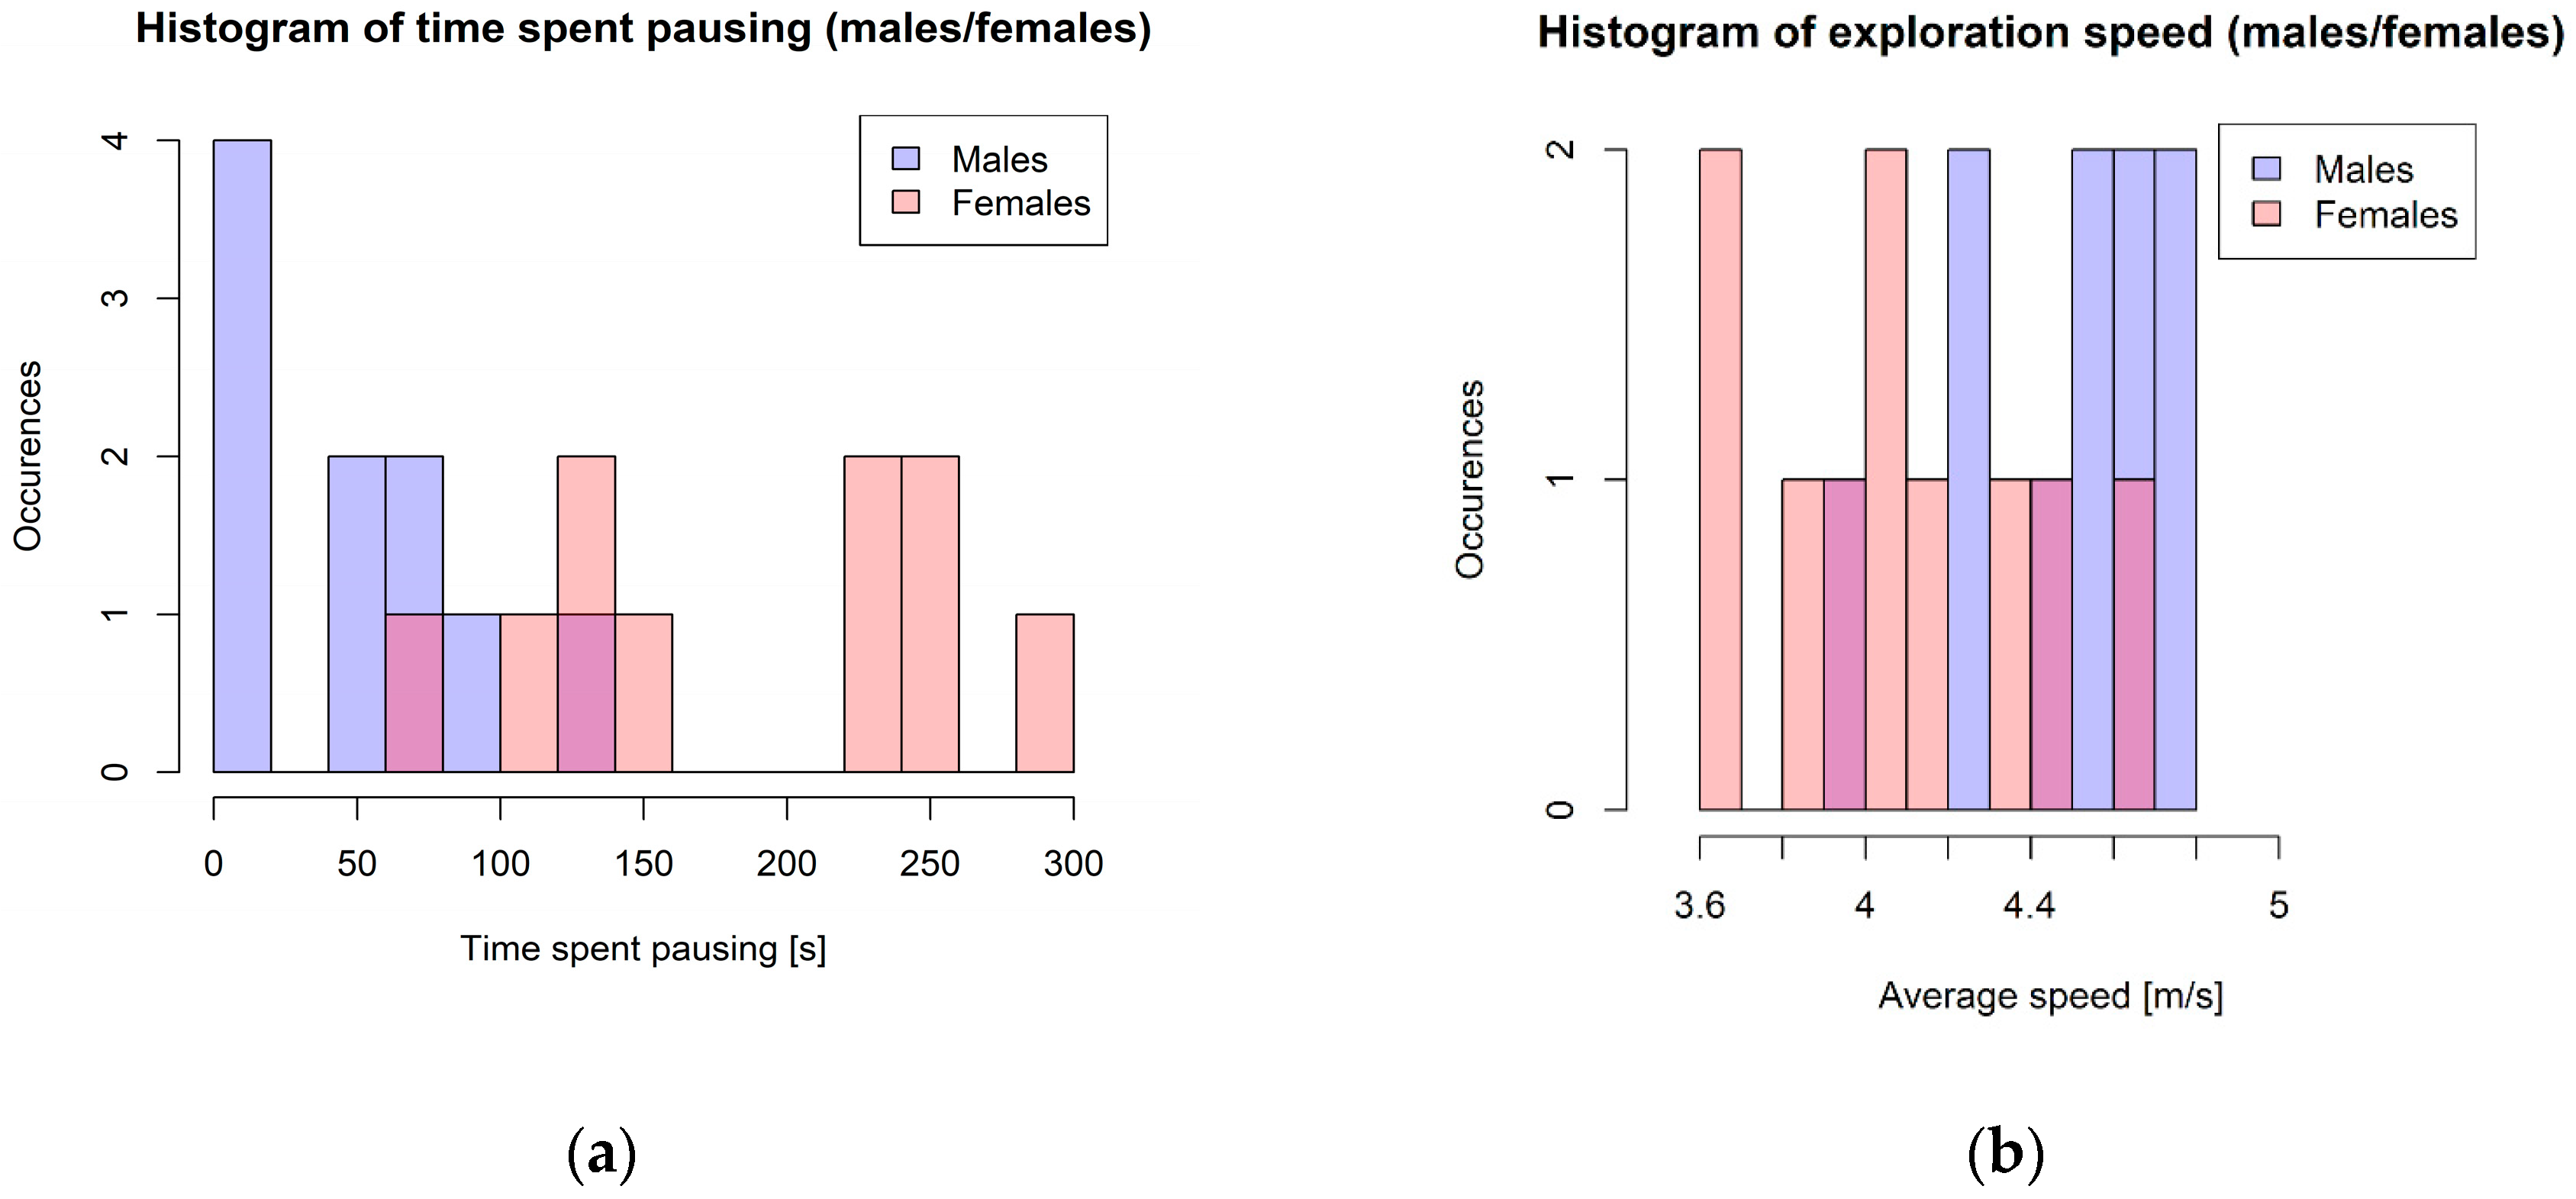
  • time spent pausing (the amount of time spent not walking, in seconds)
  • average exploration speed (walking/pausing time considered, in metres per second)
  • travel distance (the overall distance a participant travelled, in metres)
  • number of stops (the number of times a participant paused exploration)
  • number of keypresses (raw movement interface usage)
  • number of direction changes (the number of times a participant changed their keyboard-driven movement direction)
Participants also self-reported their visual cognitive styles (using objects/spatial scales) and were tested in their visual recognition and spatial relations identification abilities. We extracted the following mental scales:
  • self-reported OSIVQ object (on a 0–5 scale)
  • self-reported OSIVQ spatial (on a 0–5 scale)
  • Object Visual Recognition Test (on a 0–10 scale)
  • Spatial Relations Identification Task (on a 0–10 scale)
Differences between sexes—We explored the differences between sexes in the extracted virtual movement parameters and mental scales. The Wilcoxon rank-sum test identified differences between males and females in their Exploration Time, Time Spent Pausing, and Exploration Speed (Table 1).
The average participant stood still for approximately a quarter of the total exploration time (making 37 stops on average, idling for 116 s). The previous analyses of the sample revealed two opposite subsets consisting of “runners” (mostly males) and “lookers” (mostly females)—see Figure 7a,b. The controller’s walkthrough speed in the experimental interface was set to a constant 5 m/s. By pausing, men reduced their average walkthrough speed to 4.47 m/s, women to 4.09 m/s. Participants who exceeded the 10-min exploration limit were all females that had spent a considerable time (>4 min) pausing. Males tended to utilize their keyboard movement interface much more often, making about three times more movement direction changes on average compared to females.
Differences in VR expertise—We compared participants with respect to their self-reported VR experience. Participants reported themselves as either experienced or not experienced with VR use, and these two groups were compared. Significant differences were identified between non-proficient and proficient VR users in the ability to identify spatial relations in the virtual scene (Table 2).

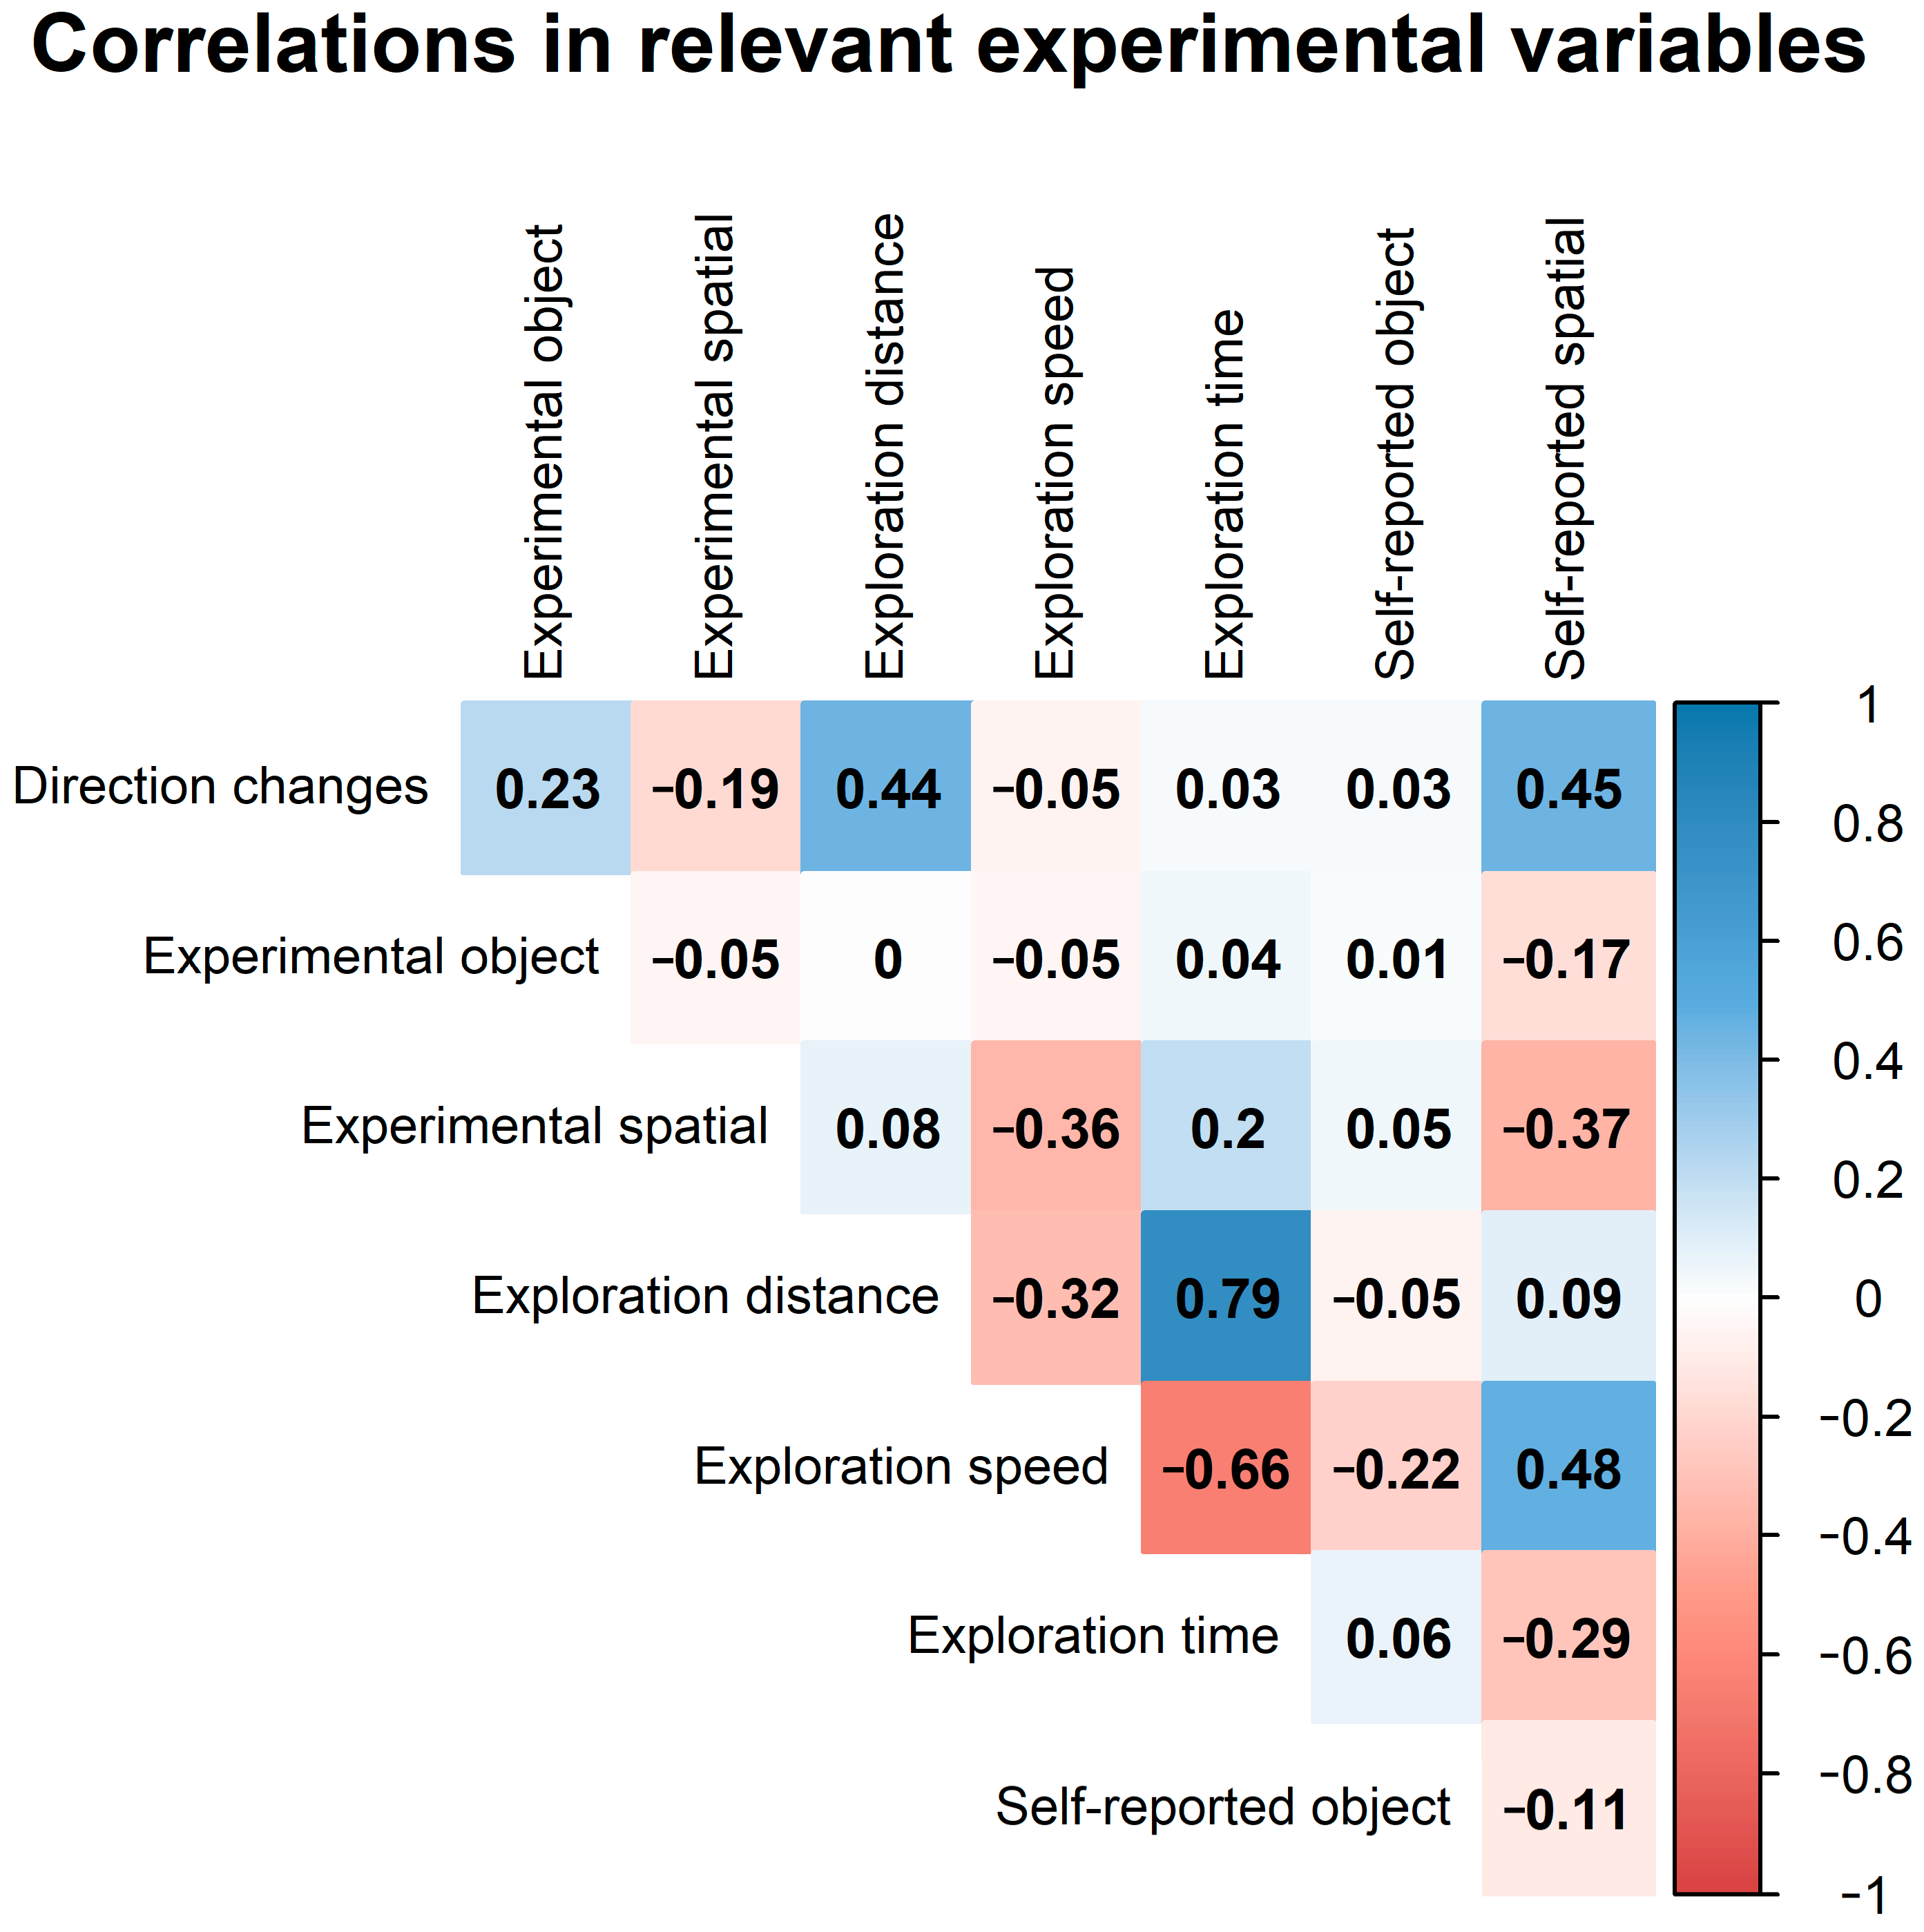
4.2. Correlation Analyses

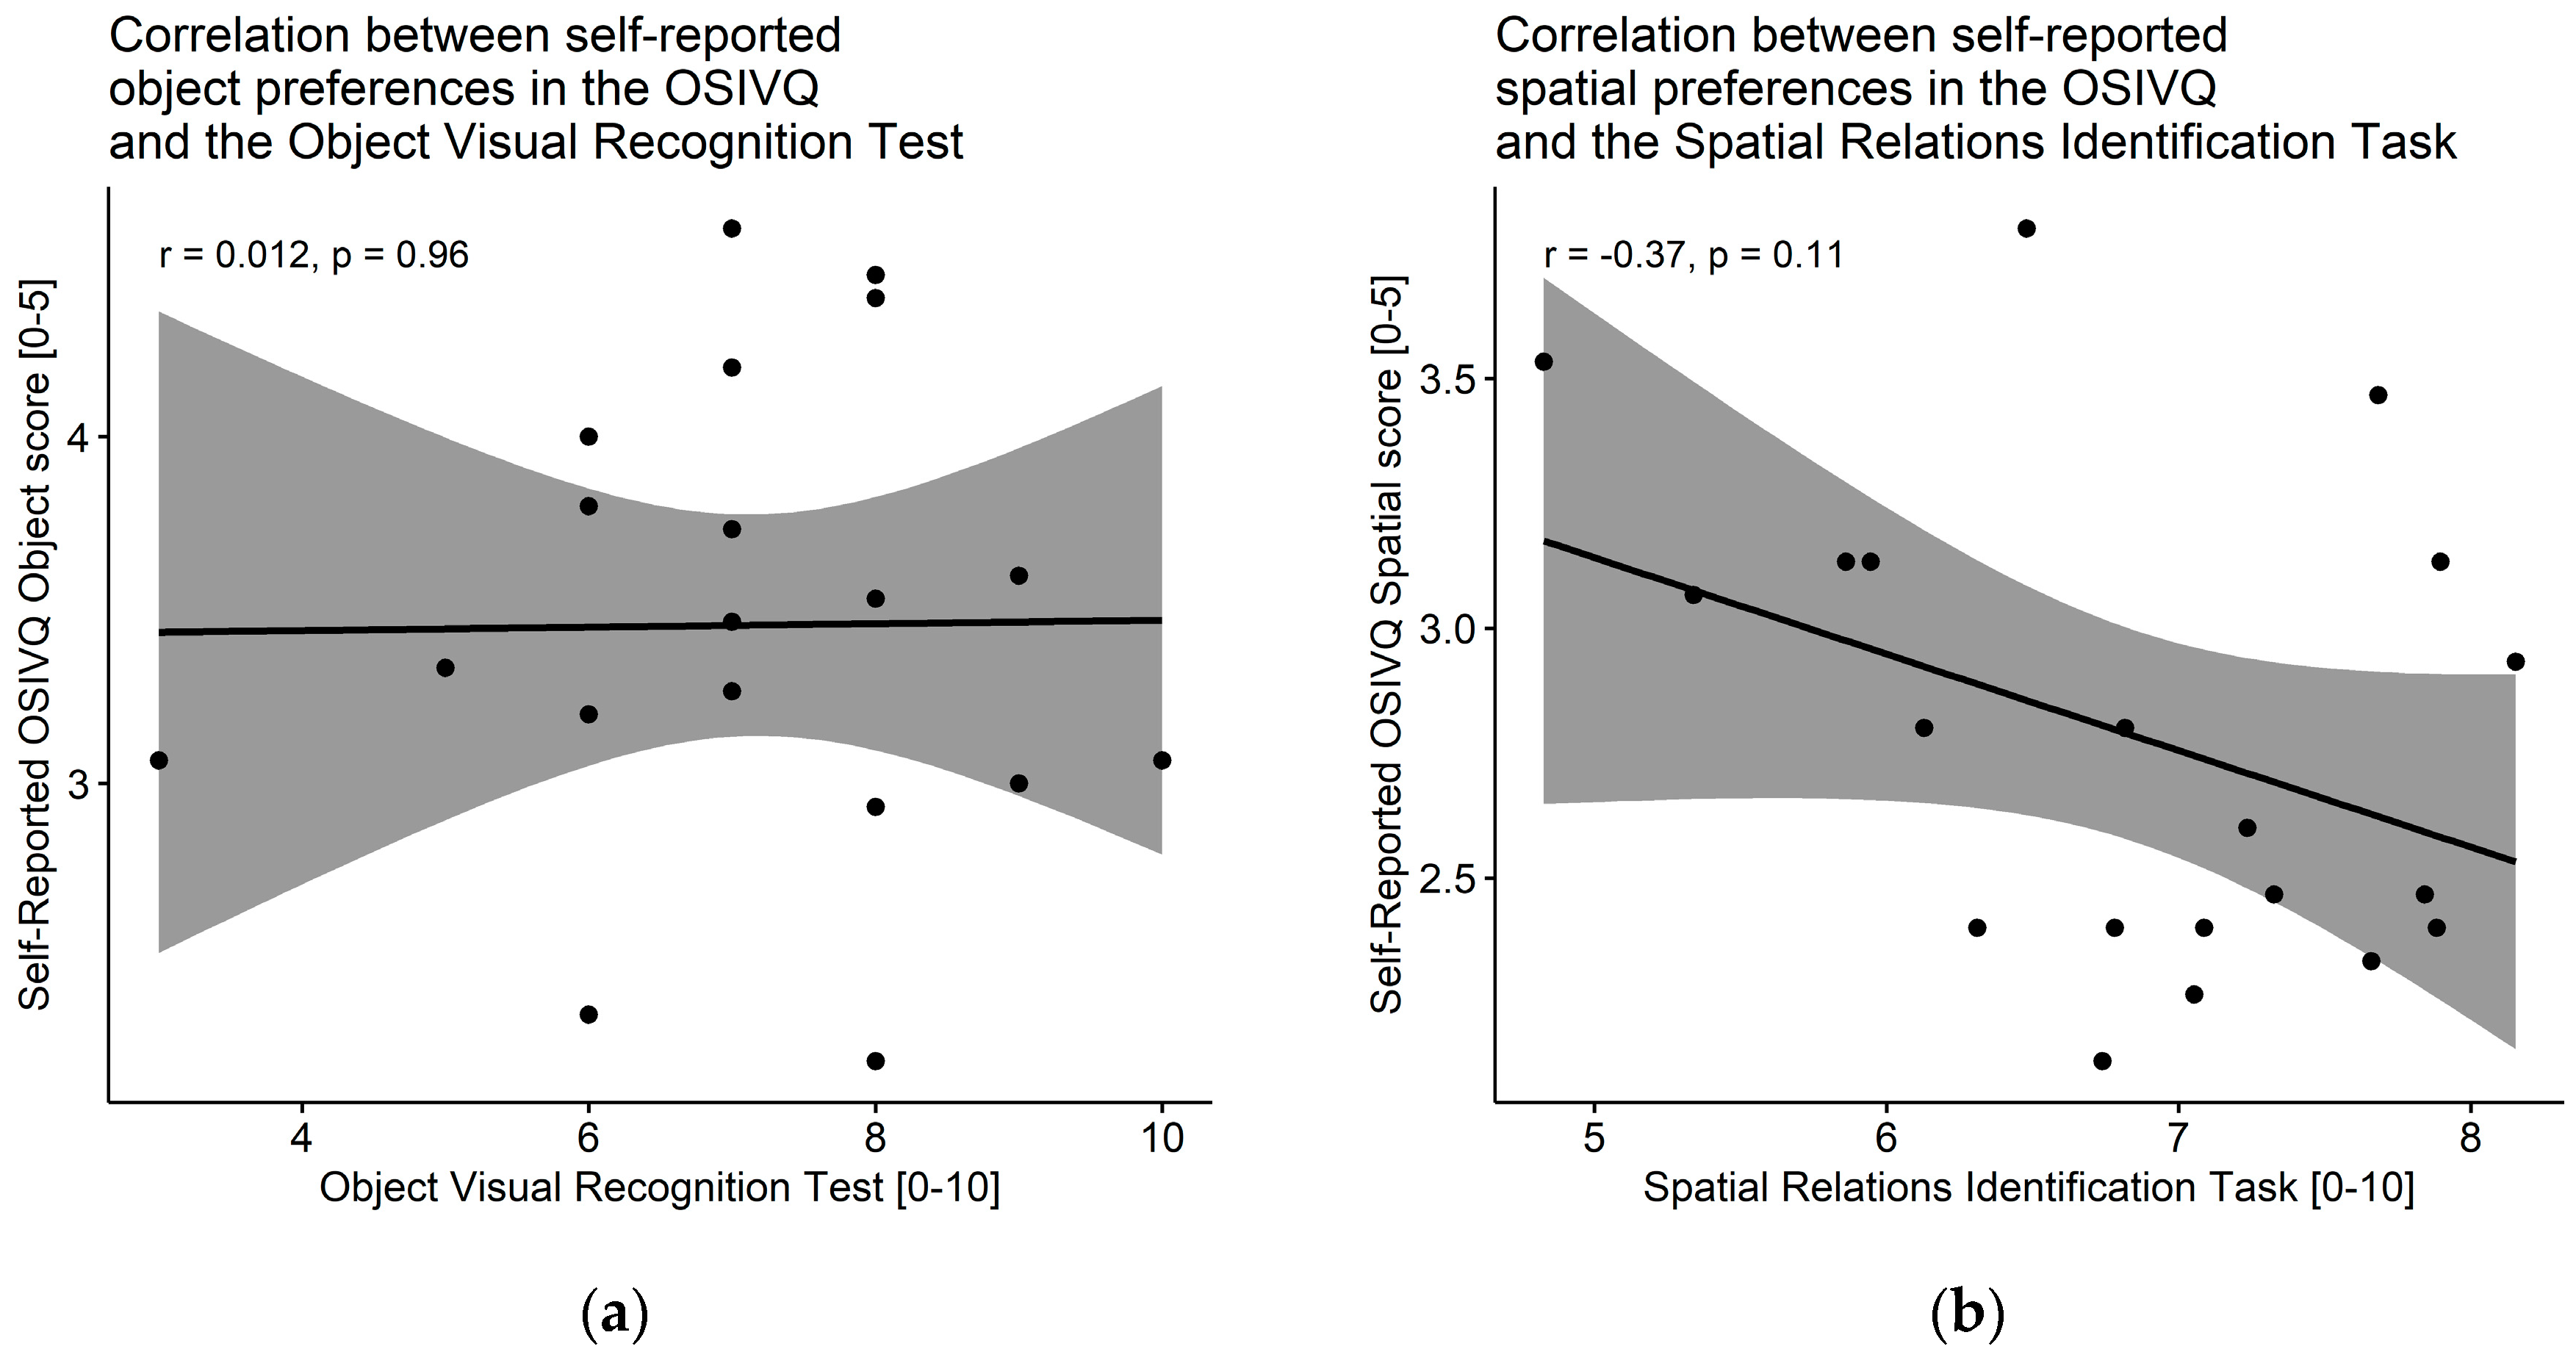
4.2.1. Self-Reported OSIVQ Object Score and Object Visual Recognition Test

According to the visual cognitive styles theory, in the context of a non-interactive object recognition task, self-reported object visualizers are expected to perform better than self-reported spatial visualizers. However, no statistically significant correlation between the self-reported preferences in the OSIVQ and the participants’ scores in the Object Visual Recognition Test were found (Figure 8a, Table 2). No relationship could be observed between a specific self-reported cognitive style and the ability to recognize a specific object that was previously presented in the virtual environment.

4.2.2. Self-Reported OSIVQ Spatial Score and Spatial Relations Identification Task

As in the previous case, spatial visualizers are expected to perform better at estimating distances in a spatial layout. However, the correlation showed a negative, non-significant trend (Figure 8b, Table 2). A non-significant trend was observed in participants who reported themselves as spatially-oriented, performing worse than on specific spatial identification tasks.
In regard to correlating the aforementioned with other continuous variables (Figure 9), only one with any relevance was found: the self-reported spatial score from the OSIVQ correlated positively with exploration speed (r = 0.48, p = 0.03), i.e., the spatially-oriented participants had a mild tendency to walk through the virtual environment more quickly. A positive correlation between exploration distance and exploration time, and a negative correlation between exploration time and exploration speed are both easily explained, as these variables were heavily dependent on each other. No other correlation approached a statistical significance.

5. Discussion and Conclusions

5.1. Methods for Analyzing and Visualizing User Strategies

The virtual movement parameters and visualizations of exploration strategies described in this paper can be categorized or compared according to different criteria. Classification of these methods according to five criteria was suggested (Table 3). This classification can be further used to select the most suitable methods for analyzing the users’ strategies in the virtual environment.
The first criterion is preservation of the spatial component of the data. When the spatial component is preserved, the results of the analysis can be applied or visualized to a certain part of the 3D scene (stimulus). Otherwise, the results focus on the non-spatial aspects of user strategies. An example of the results of a non-spatial method are measurements calculated from the virtual trajectory (its distance, average speed).
The second criterion is the attitude to the temporal component of the data. Three ways of handling the temporal aspect of user strategy data were identified. The temporal component can be preserved, and the dynamics of user interactions throughout the entire task can be analyzed (virtual trajectory visualization). Other methods aggregate characteristics to one value for the entire user interaction (Gridded AoI), and some methods also focus on specific moments. That is, for example, the visualization of pauses in virtual movement.
The data aggregation criterion describes whether the result of the method is more suitable to aggregation for all users (or specific groups of users) or if the user interaction records are distinguishable only for certain participants. An example of an aggregating method is Gridded AoI, which does not allow individual users to be identified. A contrasting example is a virtual trajectory visualization method that is more suitable for studying the virtual movement of individual users or comparing pairs of users.
The fourth criterion describes the potential for numerical or statistical analysis of user-selected aspects of strategies in participants or groups. Some methods are designed specifically for this comparison, or their output may be a numerical comparison of certain characteristics of user interaction or virtual movement (number of pauses in movement, distance of virtual trajectory, average speed). Other methods allow only visual comparison, for example, screenshots (Figure 3), or screen video (see Video S2), which allow visual (qualitative) analysis.
The last criterion is the dimensionality of the analyzed data. In the experiment, it was only possible to walk on terrain (an alternative to a flat plane), so in this case 2D visualizations of virtual trajectories and Gridded AoI could be suitably used. Other virtual worlds can employ free virtual movement in all three dimensions [58]. However, in some special cases this criterion cannot be used, when the method, for example, focuses on non-spatial aspects of user interaction.
The suggested classification can be used to compare the virtual movement parameters and visualizations mentioned in Section 1.2. Other methods that can be used according to the proposed scheme are described by, for example, Chittaro and Ieronutti [33], Zanbaka et al. [34], Cirio et al. [35], Treves et al. [36], Herman and Stachoň [20], and Herman et al. [16,59].
In future studies, researchers can employ methods and types of data visualization other than those demonstrated in this experimental design. Virtual trajectory recording combined with interface interaction data, eye-tracking and possibly think aloud protocol employed during environment exploration could provide detailed insight into the cognitive and behavioral strategies people use for specific tasks. Tracking of interface interactions and eye movements (use of the keyboard and mouse, head movement tracking and eye-tracking) permits effective quantitative assessment of exploration efficiency, both at the level of interindividual differences and the level of evaluating interface and visualization settings. For example, the pilot results of using this method to compare different types of visualization (photorealistic and non-photorealistic) was described by Stachoň et al. [21].

5.2. Exploration of User Activities and Strategies

Since the experimental group’s exploration times and times spent pausing appeared to follow normal distribution, we can assume that the experimental conditions are adequate for collecting data in larger samples. This would only need to be reconsidered if a more spacious/complex virtual environment were employed. The option to visualize the individual paths of participants’ walkthroughs as virtual trajectories in different ways (Figure 5; Figure 6a,b, and potentially by other means) also allows us to conduct precise qualitative analyses to understand exploration strategies, while numerical results provide the opportunity to harvest a large amount of data for testing hypotheses with inferential statistics. To visualize our data, we used the Processing programming language. Since this language contains an internal data structure that can load tables (e.g., CSV files), the data could be analyzed rather easily. Based on the collected data, the following visual outputs could be produced: use of the interface by the participant, behavioral patterns and temporal/spatial movement through the virtual space (as a 2D map or an interactive 3D render).
When the paths traveled by all the participants were combined (Figure 6a,b), for the most part participants followed existing pathways/routes present in the environment, only rarely straying off the path. We hypothesize that this behavior may tie to Gibson’s affordance theory [60] with consideration to the surrounding environment (e.g., Hadavi et al. [61])—in other words, where a man-made path is meant to be walked, regardless of the path being or not being the optimal route to travel through said environment. Other surroundings and patterns in the terrain may also have predetermined participants’ behaviors.
Overall, the participants preferred to visit open and flat areas, even though all areas up to 45 degrees of terrain elevation in the VGE were accessible and the participants did not need to invest any real physical effort to reach them (e.g., climbing a hill—a false affordance [60] in a virtual setting). When the surrounding terrain was constrained or elevated rapidly (height differences, sprawling vegetation, large objects occluding the view), straying from the path was far less frequent. Travelling along the centers of areas may have served the participants as the most efficient strategy in acquiring the most visual information from their surroundings and allowed connections to other potential routes [62]. Similarly, the areas off the path may have provided little to no incentive (relevant information) for exploration. If, however, the accessible surroundings had looked inviting and were furnished with interesting and detailed objects, they may have been inclined to explore the area in order to add these stimuli to their growing spatial knowledge [63].
Follow-up research to verify these route selection hypotheses is required. For this purpose, experimental environments with various (un)interesting areas populated by deliberately pre-placed objects of interest may be created. Such environments may or may not include man-made roads. Logging user route selection in these environments would allow valid behavioral data to be captured. To monitor participant movement across an area, Gridded AoI can be used (as shown in Figure 6b, or by defining some other customized examples). To hypothesize according to these data, algorithms that approximate user behavior can then be created, for example, a 360-degree raycasting visual algorithm (to provide direction-specific attractiveness in an area surrounding a vantage point based on the algorithm targeting visible objects and accessible areas of interest). If multiple 360-degree “cameras” such as these were placed into an environment as de facto route nodes, algorithmic conclusions on route selection can be produced and compared to real user behavior.
Figure 9 shows the overall correlational trends across the variables we measured. It also demonstrates a possible method for further exploration in follow-up studies. In our procedure, no relationship between the participants’ self-reported scores on the object/spatial visual scale (OSIVQ) and their objective performance in the VGE was found. No trend in the relationship between individual object-oriented visual abilities and visual recognition measured in the Object Visual Recognition Task (OVRT) was observed (Figure 8a). Contrary to our expectations, a negative non-significant trend was observed between spatial abilities and the Spatial Relations Identification Task (SRIT) (Figure 8b). In this matter, we ought to consider the small sample size of our experiment and suggest that this idea be further explored using larger samples. Reviewing the nature of experimental tasks should be also considered in order to better fulfill the theoretical requirements.
Significant differences between males and females were observed in exploration time, speed and time spent pausing (Table 1). This observation may represent valuable indicators of user tendencies in VGEs and should be further explored in larger samples in respect of not only difference in sex, but also potential customization of the VGE. We also observed that people experienced in VR use were more able to identify features in the virtual reality scene measured by the Spatial Relations Identification Task (Table 2). We can assume that previous experience may possibly decrease the level of distraction in wearing an HMD, have a lower novelty effect, and reduce motion sickness and discomfort.
However, it still needs to be considered that all participant movement happened within the pre-set context of user interface chosen to navigate the environment. Were the participants outfitted with a different kind of an interface (e.g., a motion-tracked controller with teleportation movement style, as opposed to a continuous-walkthrough keyboard and mouse solution), the results may have told a different story. Since a motion-tracked controller can be considered more of an extension of a human arm, along with a less abstract usability pattern compared to a keyboard, this would, e.g., acc. to Norman’s model [64], allow for quicker mastering of the interface by the participants, and thus having to deal with less of an extreme of beginners/experts in user distribution. Not only was it previously shown that interfaces matter [14], but there are studies that are primarily concerned with correctness of fit of VR interfaces [65]. However, this can be disputed, to an extent, since the majority of the population is familiar with the use of computer mouse, and VR interfaces have to deal with the novelty effect. While this study is not primarily focused on user interface, repeating the experiment with different interfaces (and controlling this by the means of a questionnaire) may be a worthy follow-up. However, the act of introducing different controllers would introduce further challenges, as a different concept of movement would also change user movement patterns and the level of interactibility with the environment (effectively needing a distinction in data interpretation and implementation). Furthermore, different interfaces also bring other challenges into research design and methodology—that is, a setup with motion-tracked controllers cannot be deployed to collect data on bigger samples (e.g., in computer classrooms), and it does not offer the same level of experimental control as a keyboard and a mouse do (six degrees of freedom in rotational/translational movements, as opposed to only two).

5.3. Impact of Findings

This paper introduced and described a specific VGE that can be used to measure the behavioral activity of human users in a first-person point-of-view interactive geovisualization. A technological solution was outlined, and potential obstacles were reported. A thorough testing procedure supplemented by and compared to real performance data from the VGE was also designed to reveal individual differences in visual cognitive styles.
The experimental scene appeared natural and was filled with objects of different shape, color and a range of other visual properties. During the estimation of distance, the operation of object boundary differentiation may have not been universally clear (or understood) by participants. To eliminate the potential intervening variables, we therefore suggest re-creating the experiment with more simplistic objects (e.g., a collection of unified gray boxes—a virtual implementation of research from Šikl and Šimeček [66]). The lens of the VR headset may have also introduced some distortion in the perception of distance. The research was exploratory in character, and it may have also become apparent that not all the variables were controlled and analyzed. However, based on our observations, a discussed construct such as “spatial cognitive style” seems to be rather difficult to grasp under a single experimental scenario, since we can further differentiate spatial cognitive style as egocentric and allocentric (i.e., self-centered and scene-centered [67]) design of tasks. In our future research, a larger research sample will be engaged to detect the suggested relationship between cognitive style and observed behavior in VR. Regarding the presented solution and preliminary findings, specific experimental designs for rigorous testing of hypotheses will also be used.
To further address the issue of our small, homogenous sample of participants, follow-up research could check for cross-cultural differences by comparing behavior and exploration strategies of geographically or culturally different groups, such as in Stachoň et al. [68]. Similarly, to alleviate the potential shortcomings of the user interface used in this experiment, a follow-up research employing more humanly intuitive interfaces may be proposed.
Because of the exploratory nature of the study and the low number of participants, we do not draw any general conclusions from this initial research. However, the results suggest the need to assess different levels of VGE realism and to better explore the individual differences between various user groups in order to customize and optimize the VGE. The importance of this suggestion will only grow in the future, especially with respect to the increasing trend of using immersive 3D virtual visualizations in practice.
Regarding the technological solution and the way exploratory design presented in this paper was conducted, positive conclusions can be made. By laying out a behavioral/interaction data logging framework, we have created a basis (a structure in Unity that can be appended to a virtual representation of a participant inside the VGE, along with virtual objects they interact with) from which other possible/future data can be extracted. This also applies to future interfaces—all depending on how open the interfaces are to reading and logging their interaction data. When such data is extracted, data visualization framework, for which we have also laid a foundation, can be extended. Depending on the shape of the VGE in question, the potential question of how an interface is used or the nature of the data that is to be presented, visualizations can be adapted. Since all the technologies on which our solutions are built are easily accessible, free (software) or affordable (hardware), they are easily customizable and/or deployable. Furthermore, even the process of creating VGEs themselves can be streamlined, to an extent, based on the experience gained and described through this paper.

Supplementary Materials

The following materials are available online at https://www.mdpi.com/2076-3417/9/9/1873/s1. Data S1: Experiment data, Video S2: Environment walkthrough.

Author Contributions

Conceptualization, Z.S., P.K., V.J. and Č.Š.; methodology, Č.Š.; software, P.U.; validation, P.U., V.J. and L.H.; formal analysis, P.U.; investigation, P.U.; resources, P.U.; data curation, P.U. and L.H.; writing—original draft preparation, V.J. and L.H.; writing—review and editing, V.J., L.H. and P.U.; visualization, P.U.; supervision, Z.S., P.K., and Č.Š.; project administration, Č.Š.; funding acquisition, Č.Š. and P.K.

Funding

This research was funded by a grant from the Czech Science Foundation agreement No. GC19-09265J called “The influence of socio-cultural factors and writing systems on perception and cognition of complex visual stimuli”, and Pavel Ugwitz was also supported by a grant of the Masaryk University No. MUNI/A/1576/2018 called “Complex research of the geographical environment of the planet Earth”.

Acknowledgments

This work was supported by the research infrastructure HUME Lab Experimental Humanities Laboratory, Faculty of Arts, Masaryk University. Also, our thanks go to all participants, proof readers and reviewers.

Conflicts of Interest

The authors declare no conflict of interest in relation to this study.

Appendix A. Spatial Relations Identification Task

In this VR task (Figure 1c, map C), participants were asked to verbally answer ten questions regarding spatial relations dealing with vertical or horizontal distances, derived from both egocentric and allocentric frames of reference. The questions were as follows:
  • How tall is the ladder in the background?
  • How tall is the tree stump?
  • How tall is the door?
  • How tall is the other ladder?
  • How far away from you is the chair?
  • How far away is the doorway?
  • What is the distance between the chair and the flag with the skull?
  • How far away is the chair from the tree stump?
  • How high up from the ground are the two flags on the battlements?
  • (This is the second value for the previous question, which asks for two values)

Appendix B. Object Visual Recognition Test

This test (Figure A1) followed the Spatial Relations Identification Task and had one main difference: the items were presented as a static slideshow on an LCD monitor (not in VR). Each task was presented on a separate screen, with four object variants (single correct answer, three distractors).
Figure A1. The ten sets of items for the Object Visual Recognition Test.
Applsci 09 01873 g0a1

References

  1. Robertson, A.; Zelenko, M. Voices from a Virtual Past. An Oral History of a Technology Whose Time Has Come Again. Available online: http://www.theverge.com/a/virtual-reality (accessed on 1 October 2018).
  2. Lin, H.; Gong, J. Exploring Virtual Geographic Environments. Geogr. Inf. Sci. 2001, 7, 1–7. [Google Scholar] [CrossRef]
  3. Lin, H.; Chen, M.; Lu, G.; Zhu, Q.; Gong, J.; You, X.; Wen, Y.; Xu, B.; Hu, M. Virtual Geographic Environments (VGEs): A New Generation of Geographic Analysis Tool. Earth Sci. Rev. 2013, 126, 74–84. [Google Scholar] [CrossRef] [Green Version]
  4. Voinov, A.; Çöltekin, A.; Chen, M.; Beydoun, G. Virtual geographic environments in socio-environmental modeling: A fancy distraction or a key to communication? Int. J. Digit. Earth 2017, 11, 408–419. [Google Scholar] [CrossRef]
  5. Konečný, M. Cartography: Challenges and Potentials in Virtual Geographic Environments Era. Ann. GIS 2011, 17, 135–146. [Google Scholar] [CrossRef]
  6. Lin, H.; Batty, M.; Jørgensen, S.E.; Fu, B.; Konečný, M.; Voinov, A.; Torrens, P.; Lu, G.; Zhu, A.X.; Wilson, J.P.; Gong, J. Virtual Environments Begin to Embrace Process-based Geographic Analysis. Trans. GIS 2015, 19, 493–498. [Google Scholar] [CrossRef] [Green Version]
  7. Thompson, E.M.; Horne, M.; Fleming, D. Virtual Reality Urban Modeling—An Overview. In Proceedings of the International Conference on Construction Applications of Virtual Reality, Orlando, FL, USA, 3–4 August 2006. [Google Scholar]
  8. Jamei, E.; Mortimer, M.; Seyedmahmoudian, M.; Horan, B.; Stojcevski, A. Investigating the Role of Virtual Reality in Planning for Sustainable Smart Cities. Sustainability 2017, 9, 2006. [Google Scholar] [CrossRef]
  9. Moreno, A.; Segura, Á.; Zlatanova, S.; Posada, J.; García-Alonso, A. Benefit of the integration of semantic 3D models in a fire-fighting VR simulator. Appl. Geomat. 2012, 4, 143–153. [Google Scholar] [CrossRef]
  10. Havenith, H.B.; Cerfontaine, P.; Mreyen, A.S. How Virtual Reality Can help Visualise and Assess Geohazards. Int. J. Digit. Earth 2017, 12, 173–189. [Google Scholar] [CrossRef]
  11. Maggi, S.; Fabrikant, S.I.; Imbert, J.P.; Hurter, C. How do Display Design and User Characteristics Matter in Animations? An Empirical Study with Air Traffific Control Displays. Cartographica 2015, 51, 25–37. [Google Scholar] [CrossRef]
  12. Slater, M.; Usoh, M. Presence in immersive virtual environments. In Proceedings of the IEEE Conference—Virtual Reality Annual International Symposium, San Jose, CA, USA, 18–22 September 1993. [Google Scholar]
  13. Tamasi, T. The Evolution of Computer Graphics. In Proceedings of the NVISION 08, San Jose, CA, USA, 25–28 August 2008. [Google Scholar]
  14. Juřík, V.; Herman, L.; Šašinka, Č.; Stachoň, Z.; Chmelík, J. When the Display Matters: A Multifaceted Perspective on 3D Geovisualizations. Open Geosci. 2017, 9, 89–100. [Google Scholar] [CrossRef]
  15. Zhang, F.; Hu, M.; Che, W.; Lin, H.; Fang, C. Framework for Virtual Cognitive Experiment in Virtual Geographic Environments. ISPRS Int. J. Geo Inf. 2018, 7, 36. [Google Scholar] [CrossRef]
  16. Herman, L.; Řezník, T.; Stachoň, Z.; Russnák, J. The Design and Testing of 3DmoveR: An Experimental Tool for Usability Studies of Interactive 3D Maps. Cartogr. Perspect. 2018, 9, 31–63. [Google Scholar] [CrossRef]
  17. Kubíček, P.; Šašinka, Č.; Stachoň, Z.; Herman, L.; Juřík, V.; Urbánek, T.; Chmelík, J. Identification of altitude profiles in 3D geovisualizations: The role of interaction and spatial abilities. Int. J. Digit. Earth 2019, 12, 156–172. [Google Scholar] [CrossRef]
  18. Juřík, V.; Herman, L.; Kubíček, P.; Stachoň, Z.; Šašinka, Č. Cognitive Aspects of Collaboration in 3D Virtual Environments. In International Archives of the Photogrammetry, Remote Sensing and Spatial Information Sciences; ISPRS: Leopoldshöhe, Germany, 2016; Volume XLI-B2, pp. 663–670. [Google Scholar] [CrossRef]
  19. Špriňarová, K.; Juřík, V.; Šašinka, Č.; Herman, L.; Štěrba, Z.; Stachoň, Z.; Chmelík, J.; Kozlíková, B. Human-computer Interaction in Real 3D and Pseudo-3D Cartographic Visualization: A Comparative Study. In Cartography-Maps Connecting the World; Springer: Cham, Switzerland, 2015; pp. 59–73. [Google Scholar] [CrossRef]
  20. Herman, L.; Stachoň, Z. Comparison of User Performance with Interactive and Static 3D Visualization —Pilot Study. In International Archives of the Photogrammetry, Remote Sensing and Spatial Information Sciences; ISPRS: Leopoldshöhe, Germany, 2016; Volume XLI-B2, pp. 655–661. [Google Scholar] [CrossRef]
  21. Stachoň, Z.; Kubíček, P.; Málek, F.; Krejčí, M.; Herman, L. The Role of Hue and Realism in Virtual Reality. In 7th International Conference on Cartography and GIS; Bandrova, T., Konečný, M., Eds.; Bulgarian Cartographic Association: Sofia, Bulgaria, 2018; Volume 2, pp. 932–941. [Google Scholar]
  22. Plesa, M.A.; Cartwright, W. Evaluating the Effectiveness of Non-Realistic 3D Maps for Navigation with Mobile Devices. In Lecture Notes in Geoinformation and Cartography Map-Based Mobile Services; Meng, L., Ed.; Springer: Berlin/Heidelberg, Germany, 2008; pp. 80–104. [Google Scholar] [CrossRef]
  23. Lokka, I.E.; Çöltekin, A.; Wiener, J.; Fabrikant, S.I.; Röcke, C. Virtual environments as memory training devices in navigational tasks for older adults. Sci. Rep. 2018, 8. [Google Scholar] [CrossRef] [PubMed]
  24. Popelka, S.; Dědková, P. Extinct Village 3D visualization and its Evaluation with Eye-Movement Recording. In Computational Science and Its Applications; Springer: Cham, Switzerland, 2014; pp. 786–795. [Google Scholar] [CrossRef]
  25. Zanola, S.; Fabrikant, S.I.; Coltekin, A. The Effect of Realism on the Confidence in Spatial Data Quality in Stereoscopic 3D Displays. In Proceedings of the 24th International Cartography Conference, Santiago, Chile, 15–21 November 2009. [Google Scholar] [CrossRef]
  26. Gregory, R.J. Psychological Testing: History, Principles, and Applications; Pearson: Boston, MA, USA, 2016. [Google Scholar]
  27. Manson, S.; Kne, L.; Dyke, K.; Shannon, J.; Eria, S. Using Eye-tracking and Mouse Metrics to Test Usability of Web Mapping Navigation. Cartogr. Geogr. Inf. Sci. 2012, 39, 48–60. [Google Scholar] [CrossRef]
  28. Wilkening, J.; Fabrikant, S.I. How Users Interact with a 3D Geo-browser under Time Pressure. Cartogr. Geogr. Inf. Sci. 2013, 40, 40–52. [Google Scholar] [CrossRef]
  29. You, M.; Chen, C.W.; Liu, H.; Lin, H. A Usability Evaluation of web Map Zoom and Pan Functions. Int. J. Des. 2007, 1, 15–25. [Google Scholar]
  30. Glawischnig, S.; Mahdavi, A. Human Interface Devices and Building Information Systems—A Usability Study. IADIS Int. J. 2013, 11, 29–142. [Google Scholar]
  31. Roth, R.E. Cartographic Interaction Primitives: Framework and Synthesis. Cartogr. J. 2012, 49, 376–395. [Google Scholar] [CrossRef]
  32. Bowman, D.A.; Kruijff, E.; LaViola, J.J.; Poupyrev, I. 3D User Interfaces: Theory and Practice; Addison Wesley Longman Publishing: Redwood City, CA, USA, 2005; p. 512. [Google Scholar]
  33. Chittaro, L.; Ieronutti, L. A Visual Tool for Tracing Users’ Behavior in Virtual Environments. In Proceedings of the Working Conference on Advanced Visual Interfaces, Gallipoli, Italy, 25–28 May 2004; pp. 41–47. [Google Scholar]
  34. Zanbaka, C.A.; Lok, B.C.; Babu, S.V.; Ulinsky, A.C.; Hodges, L.F. Comparison of Path Visualizations and Cognitive Measures Relative to Travel Technique in a Virtual Environment. IEEE Trans. Vis. Comput. Graph. 2005, 11, 694–705. [Google Scholar] [CrossRef] [Green Version]
  35. Cirio, G.; Marchal, M.; Olivier, A.H.; Pettré, J. Kinematic Evaluation of Virtual Walking Trajectories. IEEE Trans. Vis. Comput. Graph. 2013, 19, 671–680. [Google Scholar] [CrossRef] [Green Version]
  36. Treves, R.; Viterbo, P.; Haklay, M. Footprints in the sky: Using student tracklogs from a “bird’s eye view” virtual field trip to enhance learning. J. Geogr. High. Educ. 2015, 39, 97–110. [Google Scholar] [CrossRef]
  37. Herman, L.; Stachoň, Z. Controlling 3D Geovisualizations on Touch Screen—The Role of Users Age and Gestures Intuitiveness. In 7th International Conference on Cartography and GIS; Bandrova, T., Konečný, M., Eds.; Bulgarian Cartographic Association: Sofia, Bulgaria, 2018; Volume 1, pp. 473–480. [Google Scholar]
  38. Paivio, A.; Csapo, K. Short-term sequential memory for pictures and words. Psychon. Sci. 1971, 24, 50–51. [Google Scholar] [CrossRef] [Green Version]
  39. Ausburn, L.J.; Ausburn, F.B. Cognitive styles: Some information and implications for instructional design. Educ. Technol. Res. Dev. 1978, 26, 337–354. [Google Scholar]
  40. Martinsen, O.; Kaufmann, G. Cognitive style and creativity. In Encyclopedia of Creativity; Runco, M.A., Pritsker, S.R., Eds.; Academic Press: New York, NY, USA, 1999; Volume 1, pp. 273–282. [Google Scholar]
  41. Kirton, M.J. Adaption-Innovation: In the Context of Diversity and Change; Routledge: New York, NY, USA, 2008. [Google Scholar]
  42. Blazhenkova, O.; Kozhevnikov, M. The New Object-Spatial-Verbal Cognitive Style Model: Theory and Measurement. Appl. Cogn. Psychol. 2009, 23, 638–663. [Google Scholar] [CrossRef]
  43. Peterson, E.R.; Deary, I.J.; Austin, E.J. A New Measure of Verbal–Imagery Cognitive Style: VICS. Personal. Individ. Differ. 2005, 38, 1269–1281. [Google Scholar] [CrossRef]
  44. Kozhevnikov, M.; Kosslyn, S.; Shephard, J. Spatial versus object visualizers: A new characterization of visual cognitive style. Mem. Cogn. 2005, 33, 710–726. [Google Scholar] [CrossRef] [Green Version]
  45. Blajenkova, O.; Kozhevnikov, M.; Motes, M.A. Object-Spatial Imagery: A New Self-Report Imagery Questionnaire. Appl. Cogn. Psychol. 2006, 20, 239–263. [Google Scholar] [CrossRef]
  46. Jonassen, D.H.; Grabowski, B.L. Handbook of Individual Differences, Learning, and Instruction; Routledge: Abingdon, UK, 2012. [Google Scholar]
  47. Golledge, R.G. Human Wayfinding and Cognitive Maps. In The Colonization of Unfamiliar Landscapes: The Archaeology of Adaptation; Routledge: New York, NY, USA, 2003; pp. 25–43. [Google Scholar]
  48. Schiller, D.; Eichenbaum, H.; Buffalo, E.A.; Davachi, L.; Foster, D.J.; Leutgeb, S.; Ranganath, C. Memory and Space: Towards an Understanding of the Cognitive Map. J. Neurosci. 2015, 35, 13904–13911. [Google Scholar] [CrossRef] [Green Version]
  49. Epstein, R.A.; Patai, E.Z.; Julian, J.B.; Spiers, H.J. The cognitive map in humans: Spatial navigation and beyond. Nat. Neurosci. 2017, 20, 1504–1513. [Google Scholar] [CrossRef]
  50. Lynch, K. The Image of the City; MIT Press: Cambridge, MA, USA, 1960. [Google Scholar]
  51. Gartner, G.; Huang, H. Progress in Location-Based Services 2016; Lecture Notes in Geoinformation and Cartography; Springer: Berlin, Germany, 2017. [Google Scholar]
  52. Franz, M.O.; Mallot, H. Biomimetic robot navigation. Robot. Auton. Syst. 2000, 30, 133–153. [Google Scholar] [CrossRef] [Green Version]
  53. Golledge, R.G. Path selection and route preference in human navigation: A progress report. In Spatial Information Theory A Theoretical Basis for GIS. Lecture Notes in Computer Science; Frank, A.U., Kuhn, W., Eds.; Springer: Berlin, Germany, 1995. [Google Scholar] [CrossRef]
  54. Vilar, E.; Rebelo, F.; Noriega, P.; Teles, J.; Mayhorn, C. The influence of environmental features on route selection in an emergency situation. Appl. Ergon. 2013, 44, 618–627. [Google Scholar] [CrossRef]
  55. Duckham, M.; Kulik, L. “Simplest” Paths: Automated Route Selection for Navigation. In Proceedings of the International Conference on Spatial Information Theory, Ittingen, Switzerland, 24–28 September 2003. [Google Scholar]
  56. Collett, T.S.; Zeil, J. The selection and use of landmarks by insects. In Orientation and Communication in Arthropods; Birkhäuser: Basel, Switzerland, 1997; p. 84. [Google Scholar] [CrossRef]
  57. Nys, M.; Gyselinck, V.; Orriols, E.; Hickmann, M. Landmark and route knowledge in children’s spatial representation of a virtual environment. Front. Psychol. 2015, 5, 1522. [Google Scholar] [CrossRef]
  58. Buchroithner, M.F.; Knust, C. True-3D in cartography—Current hard and softcopy developments. In Geospatial Visualisation; Moore, A., Drecki, I., Eds.; Springer: Heidelberg, Germany, 2013; pp. 41–65. [Google Scholar]
  59. Herman, L.; Stachoň, Z.; Stuchlík, R.; Hladík, J.; Kubíček, P. Touch Interaction with 3D Geographical Visualization on Web: Selected Technological and User Issues. In International Archives of the Photogrammetry, Remote Sensing and Spatial Information Sciences; Dimopoulou, E., van Oosterom, P., Eds.; ISPRS: Leopoldshöhe, Germany, 2016; Volume XLII-2/W2, pp. 33–40. [Google Scholar] [CrossRef]
  60. Gibson, J.J. The Senses Considered as Perceptual Systems; Allen and Unwin: London, UK, 1966. [Google Scholar]
  61. Hadavi, S.; Kaplan, R.; Hunter, M.C.R. Environmental affordances: A practical approach for design of nearby outdoor settings in urban residential areas. Landsc. Urban Plan. 2014, 134, 19–32. [Google Scholar] [CrossRef]
  62. Wiener, J.M.; Schnee, A.; Mallot, H.A. Use and interaction of navigation strategies in regionalized environments. J. Environ. Psychol. 2004, 4, 475–493. [Google Scholar] [CrossRef]
  63. Meilinger, T. Strategies of Orinetation in Environmental Spaces; Logos Verlag: Berlin, Germany, 2008; pp. 72–80. [Google Scholar]
  64. Sutcliffe, A.G.; Kaur, K.D. Evaluating the usability of virtual reality user interfaces. Behav. Inf. Technol. 2000, 19, 415–426. [Google Scholar] [CrossRef]
  65. Nguyen-Vo, T.; Riecke, B.E.; Stuerzlinger, W.; Pham, D.M.; Kruijff, E. Do We Need Actual Walking in VR? Learning with Actual Rotation Might Suffice for Efficient Locomotion. In Proceedings of the 11th International Conference on Spatial Cognition, Tübingen, Germany, 5–8 September 2018. [Google Scholar]
  66. Šikl, R.; Šimeček, M. Visual space perception at different levels of depth description. Atten. Percept. Psychophys. 2015, 77, 2098–2107. [Google Scholar] [CrossRef]
  67. Kozhevnikov, M.; Hegarty, M. A dissociation between object manipulation spatial ability and spatial orientation ability. Mem. Cogn. 2001, 29, 745–756. [Google Scholar] [CrossRef] [Green Version]
  68. Stachoň, Z.; Šašinka, Č.; Čeněk, J.; Štěrba, Z.; Angsuesser, S.; Fabrikant, S.I.; Štampach, R.; Morong, K. Cross-cultural differences in figure–ground perception of cartographic stimuli. Cartogr. Geogr. Inf. Sci. 2018, 46, 82–94. [Google Scholar] [CrossRef]
Figure 1. Isometric, elevated overview of map A (a), map B (b), and map C (c).
Applsci 09 01873 g001
Figure 2. An elevated view of the experimental environment (map A) the participants were asked to explore.
Applsci 09 01873 g002
Figure 3. An example of spatial relations identification tasks as seen from the participant’s perspective; (red line—distance between the chair and the tree stump; blue line—height of the door).
Applsci 09 01873 g003
Figure 4. Example of an object visual recognition test item–coat of arms on a flag. A, B, C: distractor objects; D: correct object.
Applsci 09 01873 g004
Figure 5. The participant indicated by the blue line walked through the environment with few pauses along their virtual trajectory (path) in a rather jagged fashion (side-stepping left/right, using the keyboard interface frequently). This contrasted with the participant indicated by the violet line, who moved at a slower exploration pace primarily in a forward direction and paused more often (visualized as circles of varying size, larger circles indicating a longer pause).
Applsci 09 01873 g005
Figure 6. Virtual trajectories (paths) of all individual participants combined (a), Gridded AoI average for all paths (b).
Applsci 09 01873 g006
Figure 7. Histogram comparing males/females in time spent pausing (a). Histogram comparing males/females in average exploration speed (b).
Applsci 09 01873 g007
Figure 8. Correlation between self-reported object preferences in the OSIVQ and the Object Visual Recognition Test (a). Correlation between self-reported spatial preferences in the OSIVQ and the Spatial Relations Identification Task (b).
Applsci 09 01873 g008
Figure 9. Correlations in relevant experimental variables. Color represents the correlation direction, color intensity is correlation strength, p-values are in squares (rounded to two decimals).
Applsci 09 01873 g009
Table 1. Analysis of measured variables according to sex.
SexMeanStd. Dev.Median1st Qu.3rd Qu.Shapiro–Wilk Testp-ValueWilcoxon WCohen’s d
Exploration Time [s]M316.2141.27314216.84290.780.03 *21.51.15
F475.2136.03450.5371600.80.11
Time Spent Pausing [s]M48.341.654711700.40.0001 **42.30
F184.472.76187.5124.2244.50.17
Exploration Speed [m/s]M4.470.264.554.314.660.360.012 *831.33
F4.090.314.053.914.320.85
Direction Changes [Count]M377.4309316.5246.2426.20.890.019 *81.51.12
F111.8133.295419173.80.8
Significance levels: * 0.05; ** 0.001.
Table 2. Analysis of measured variables according to VR expertise.
VR UsersMeanStd. Dev.Median1st Qu.3rd Qu.Shapiro–Wilk Testp-ValueWilcoxon WCohen’s d
Spatial Relations
Identification Task [0–10]
Non-proficient6.120.885.955.66.760.850.009 **60.01
Proficient7.370.597.376.997.860.6
Significance levels: ** 0.001.
Table 3. Comparison of methods of analysis or visualization of user interaction and virtual movement according to their application.
MethodPreservation of Spatial ComponentAttitude to Temporal ComponentSuitable for Groups of UsersStatistical or Numerical ComparisonDimensionality of Data
Gridded AoIyesaggregationyesyes2D or 3D
Statisticsnoaggregation or selected momentsyesyes2D or 3D
Videoyespreservationonly individual usersonly visual3D
Views (screenshots)yespreservationonly individual usersonly visual3D
Virtual trajectoryyespreservationonly individual usersonly visual2D or 3D

