Wave Force Characteristics of Large-Sized Offshore Wind Support Structures to Sea Levels and Wave Conditions


Abstract
1. Introduction
2. Wave Force Tests
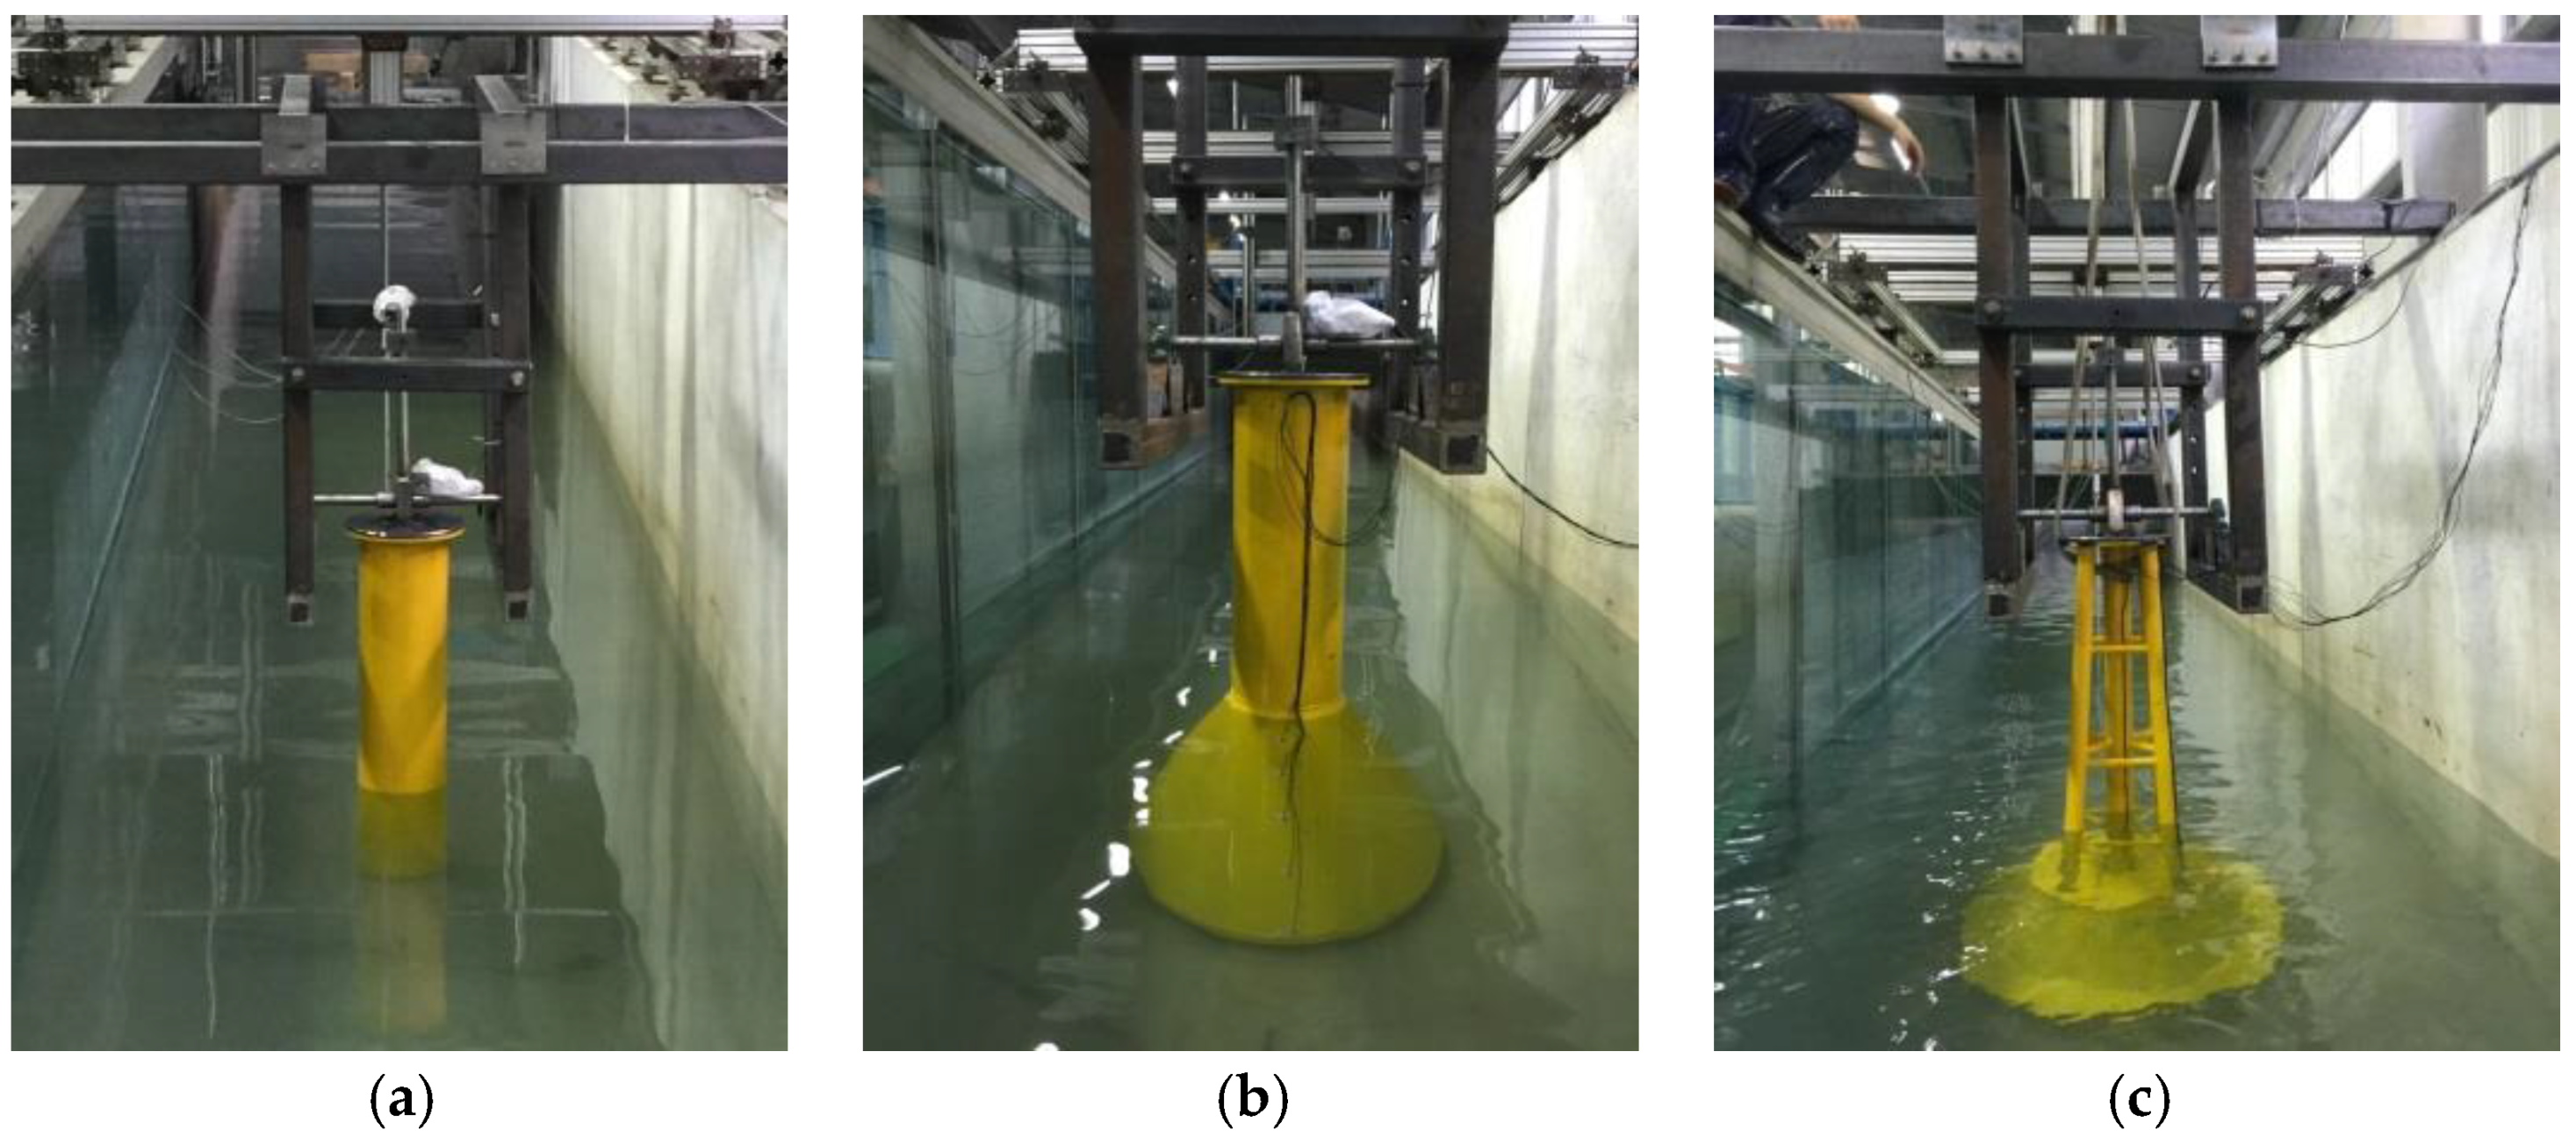
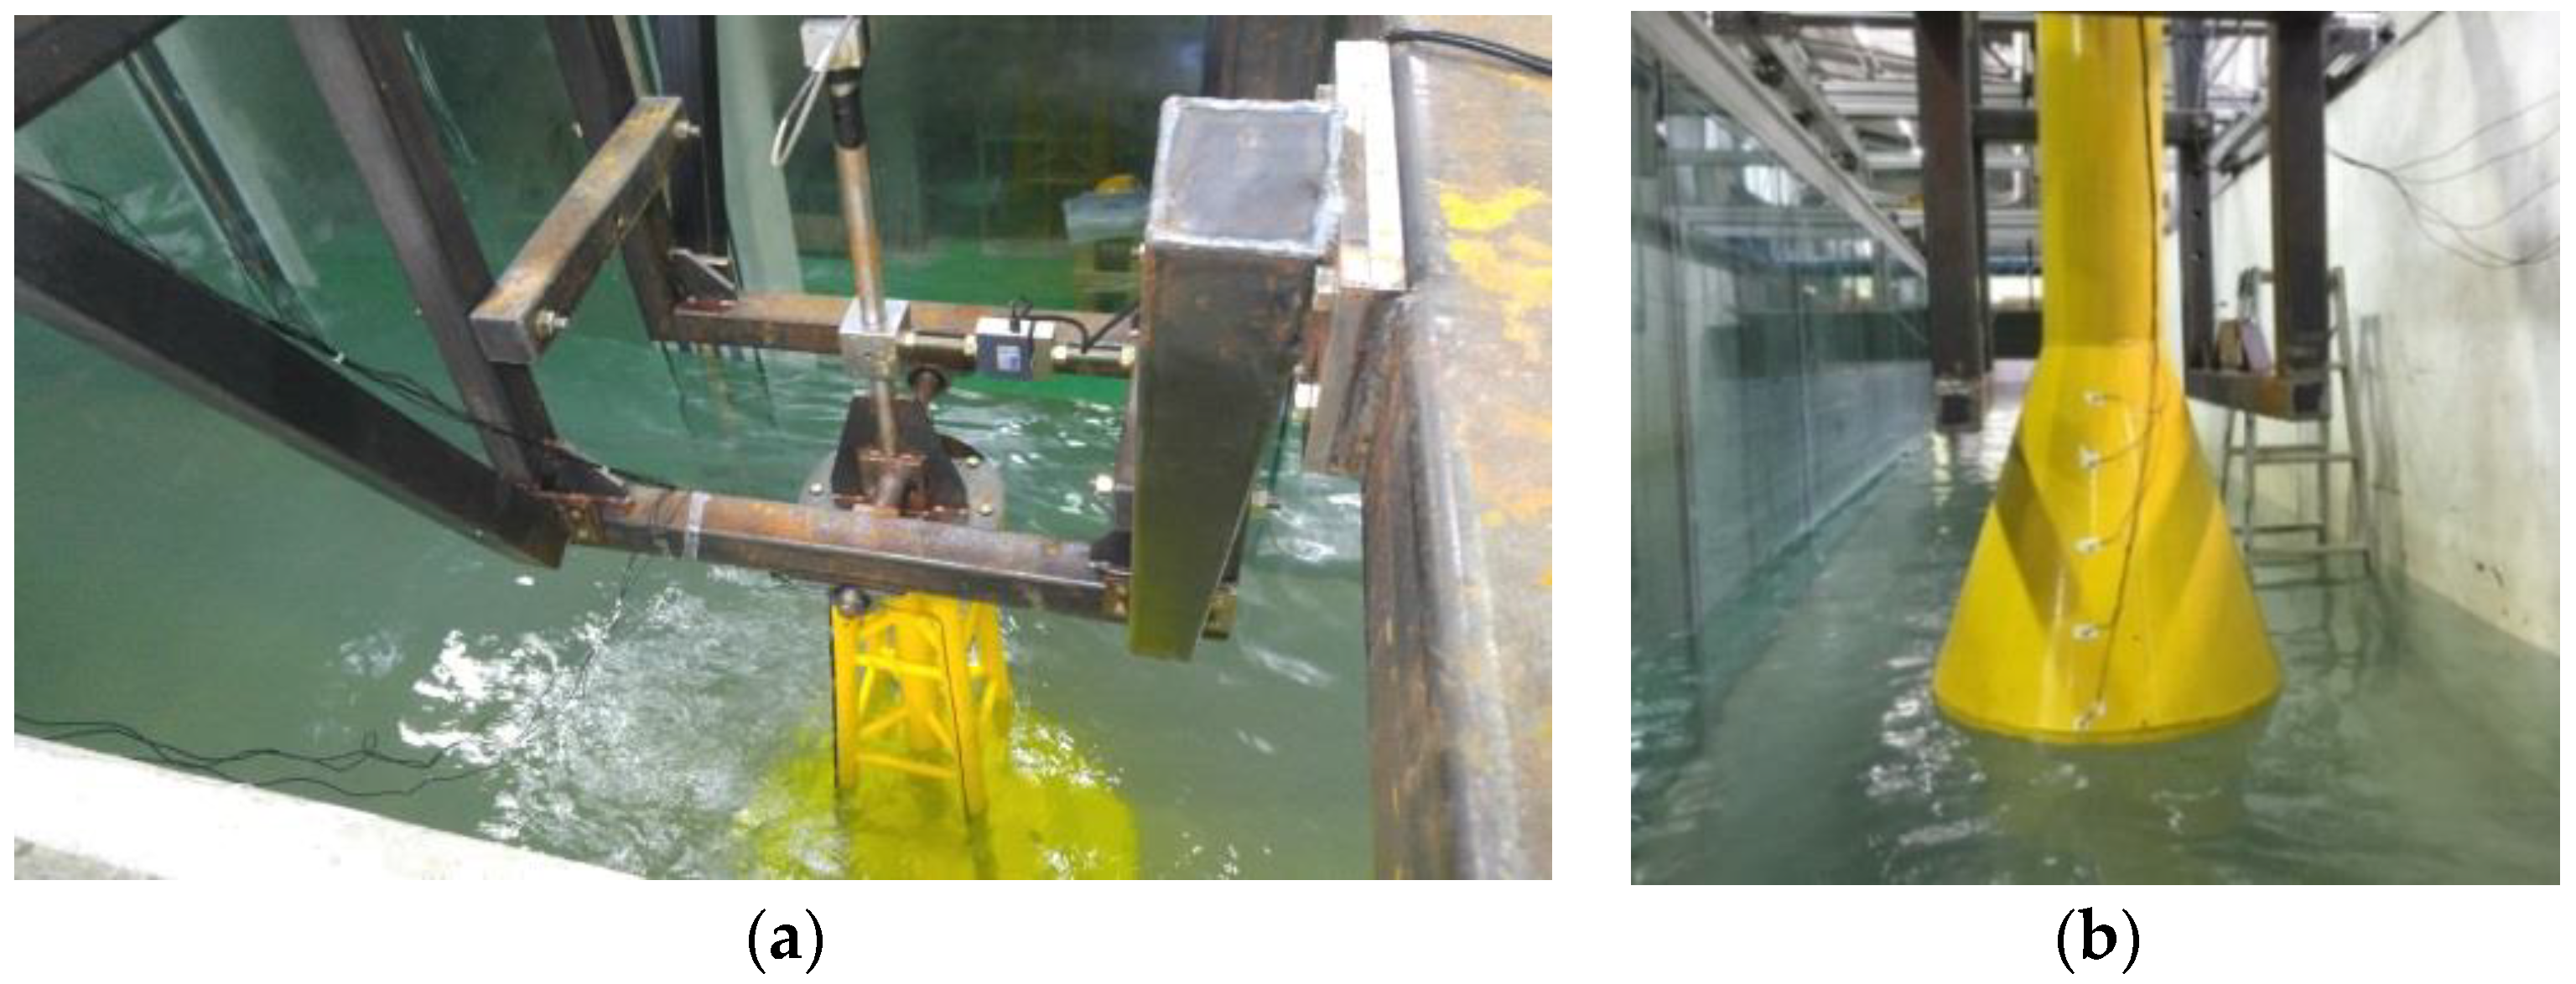
2.1. Test Models
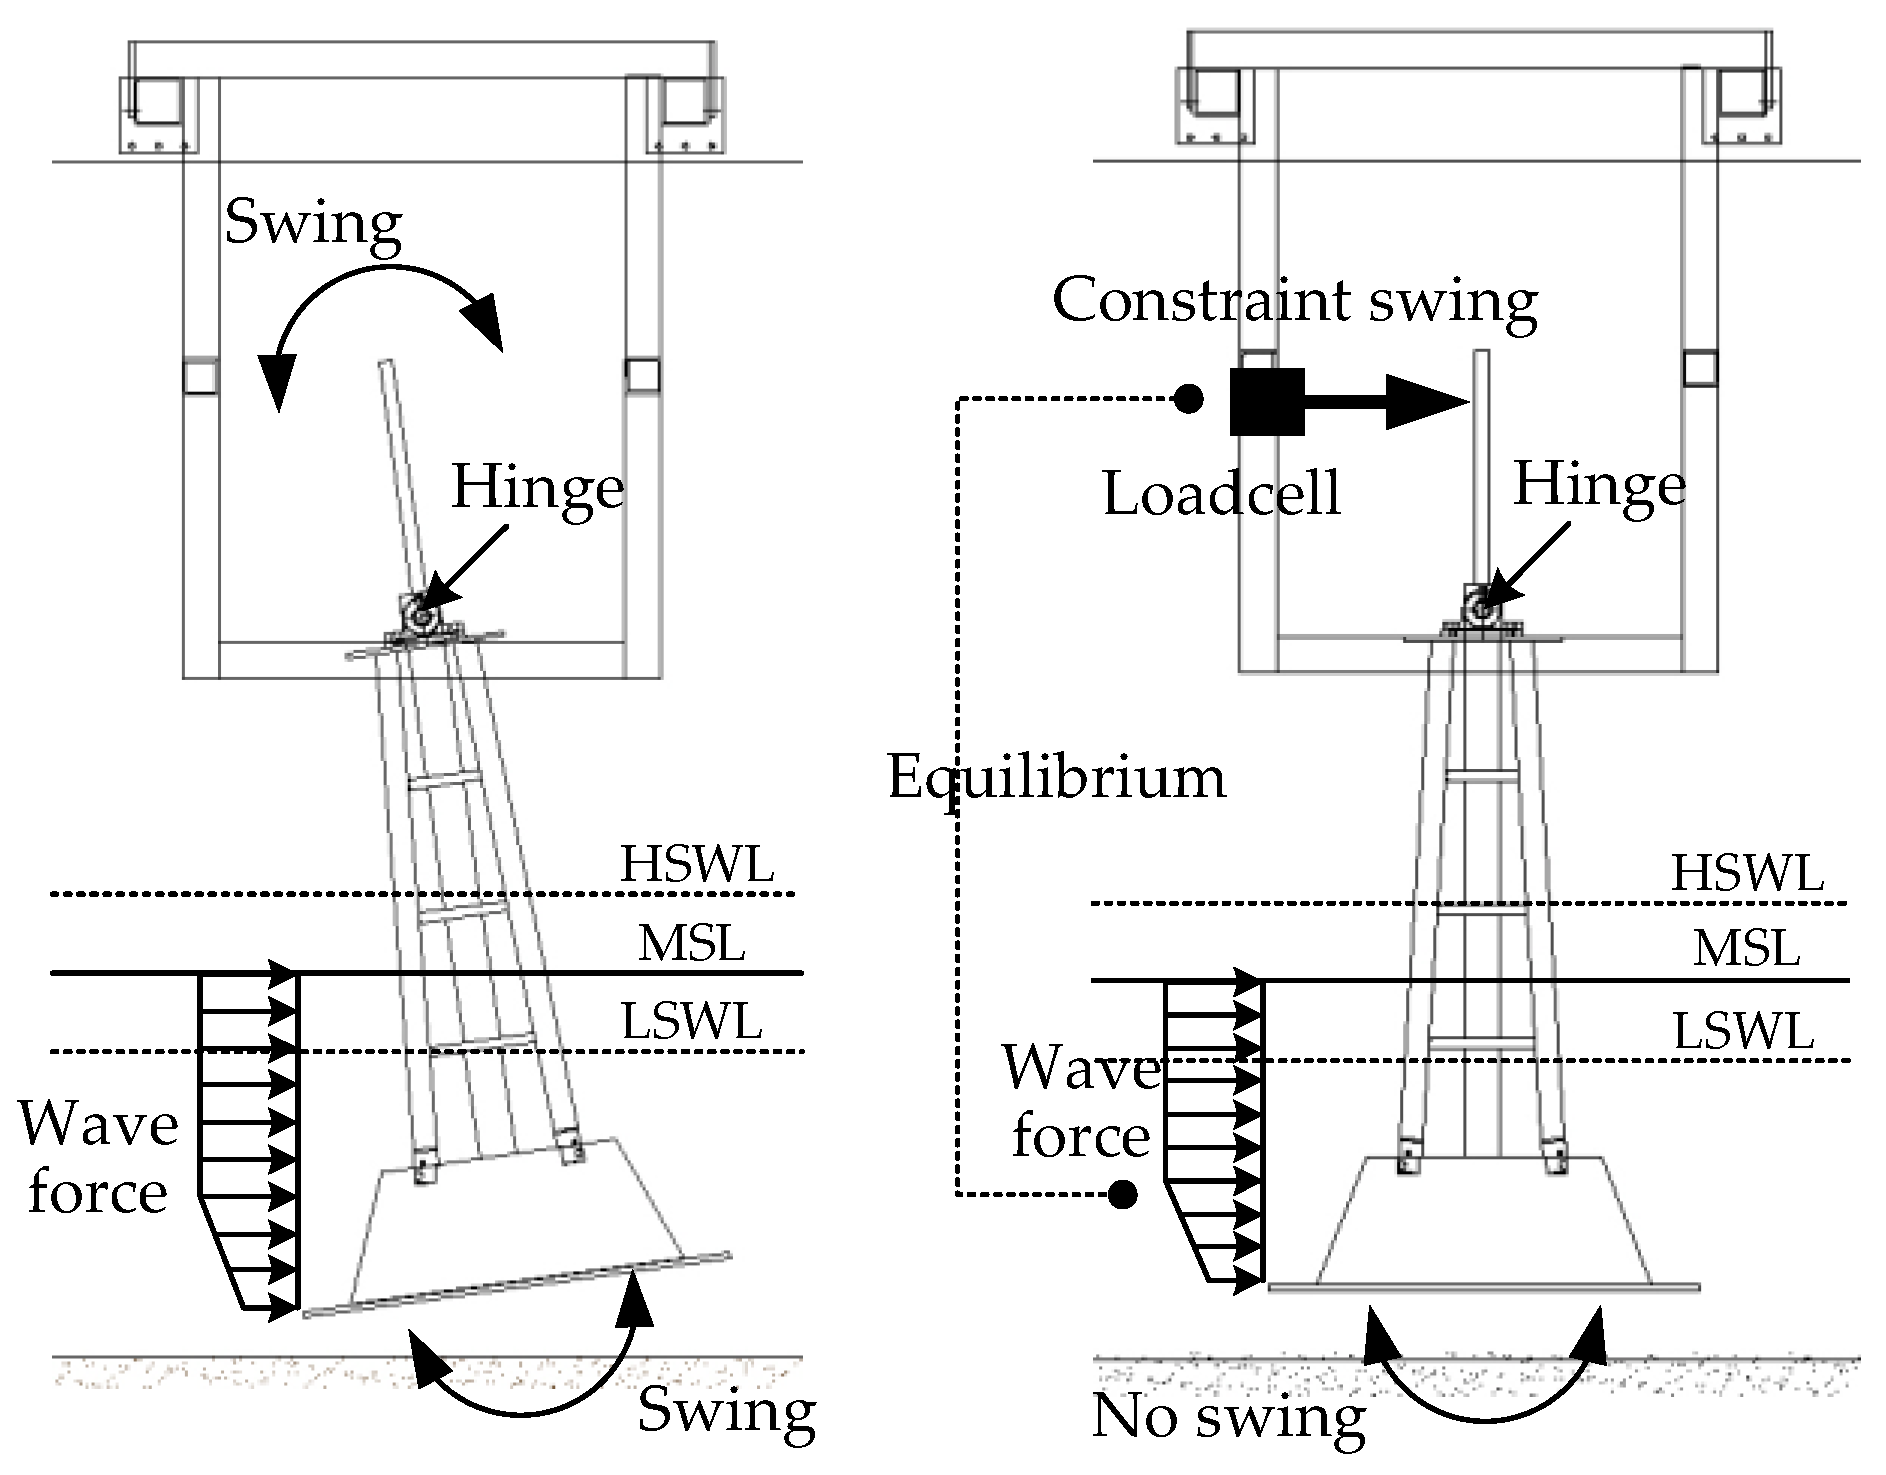
2.2. Test Setup
2.3. Wave Conditions and Sea Levels
3. Test Results
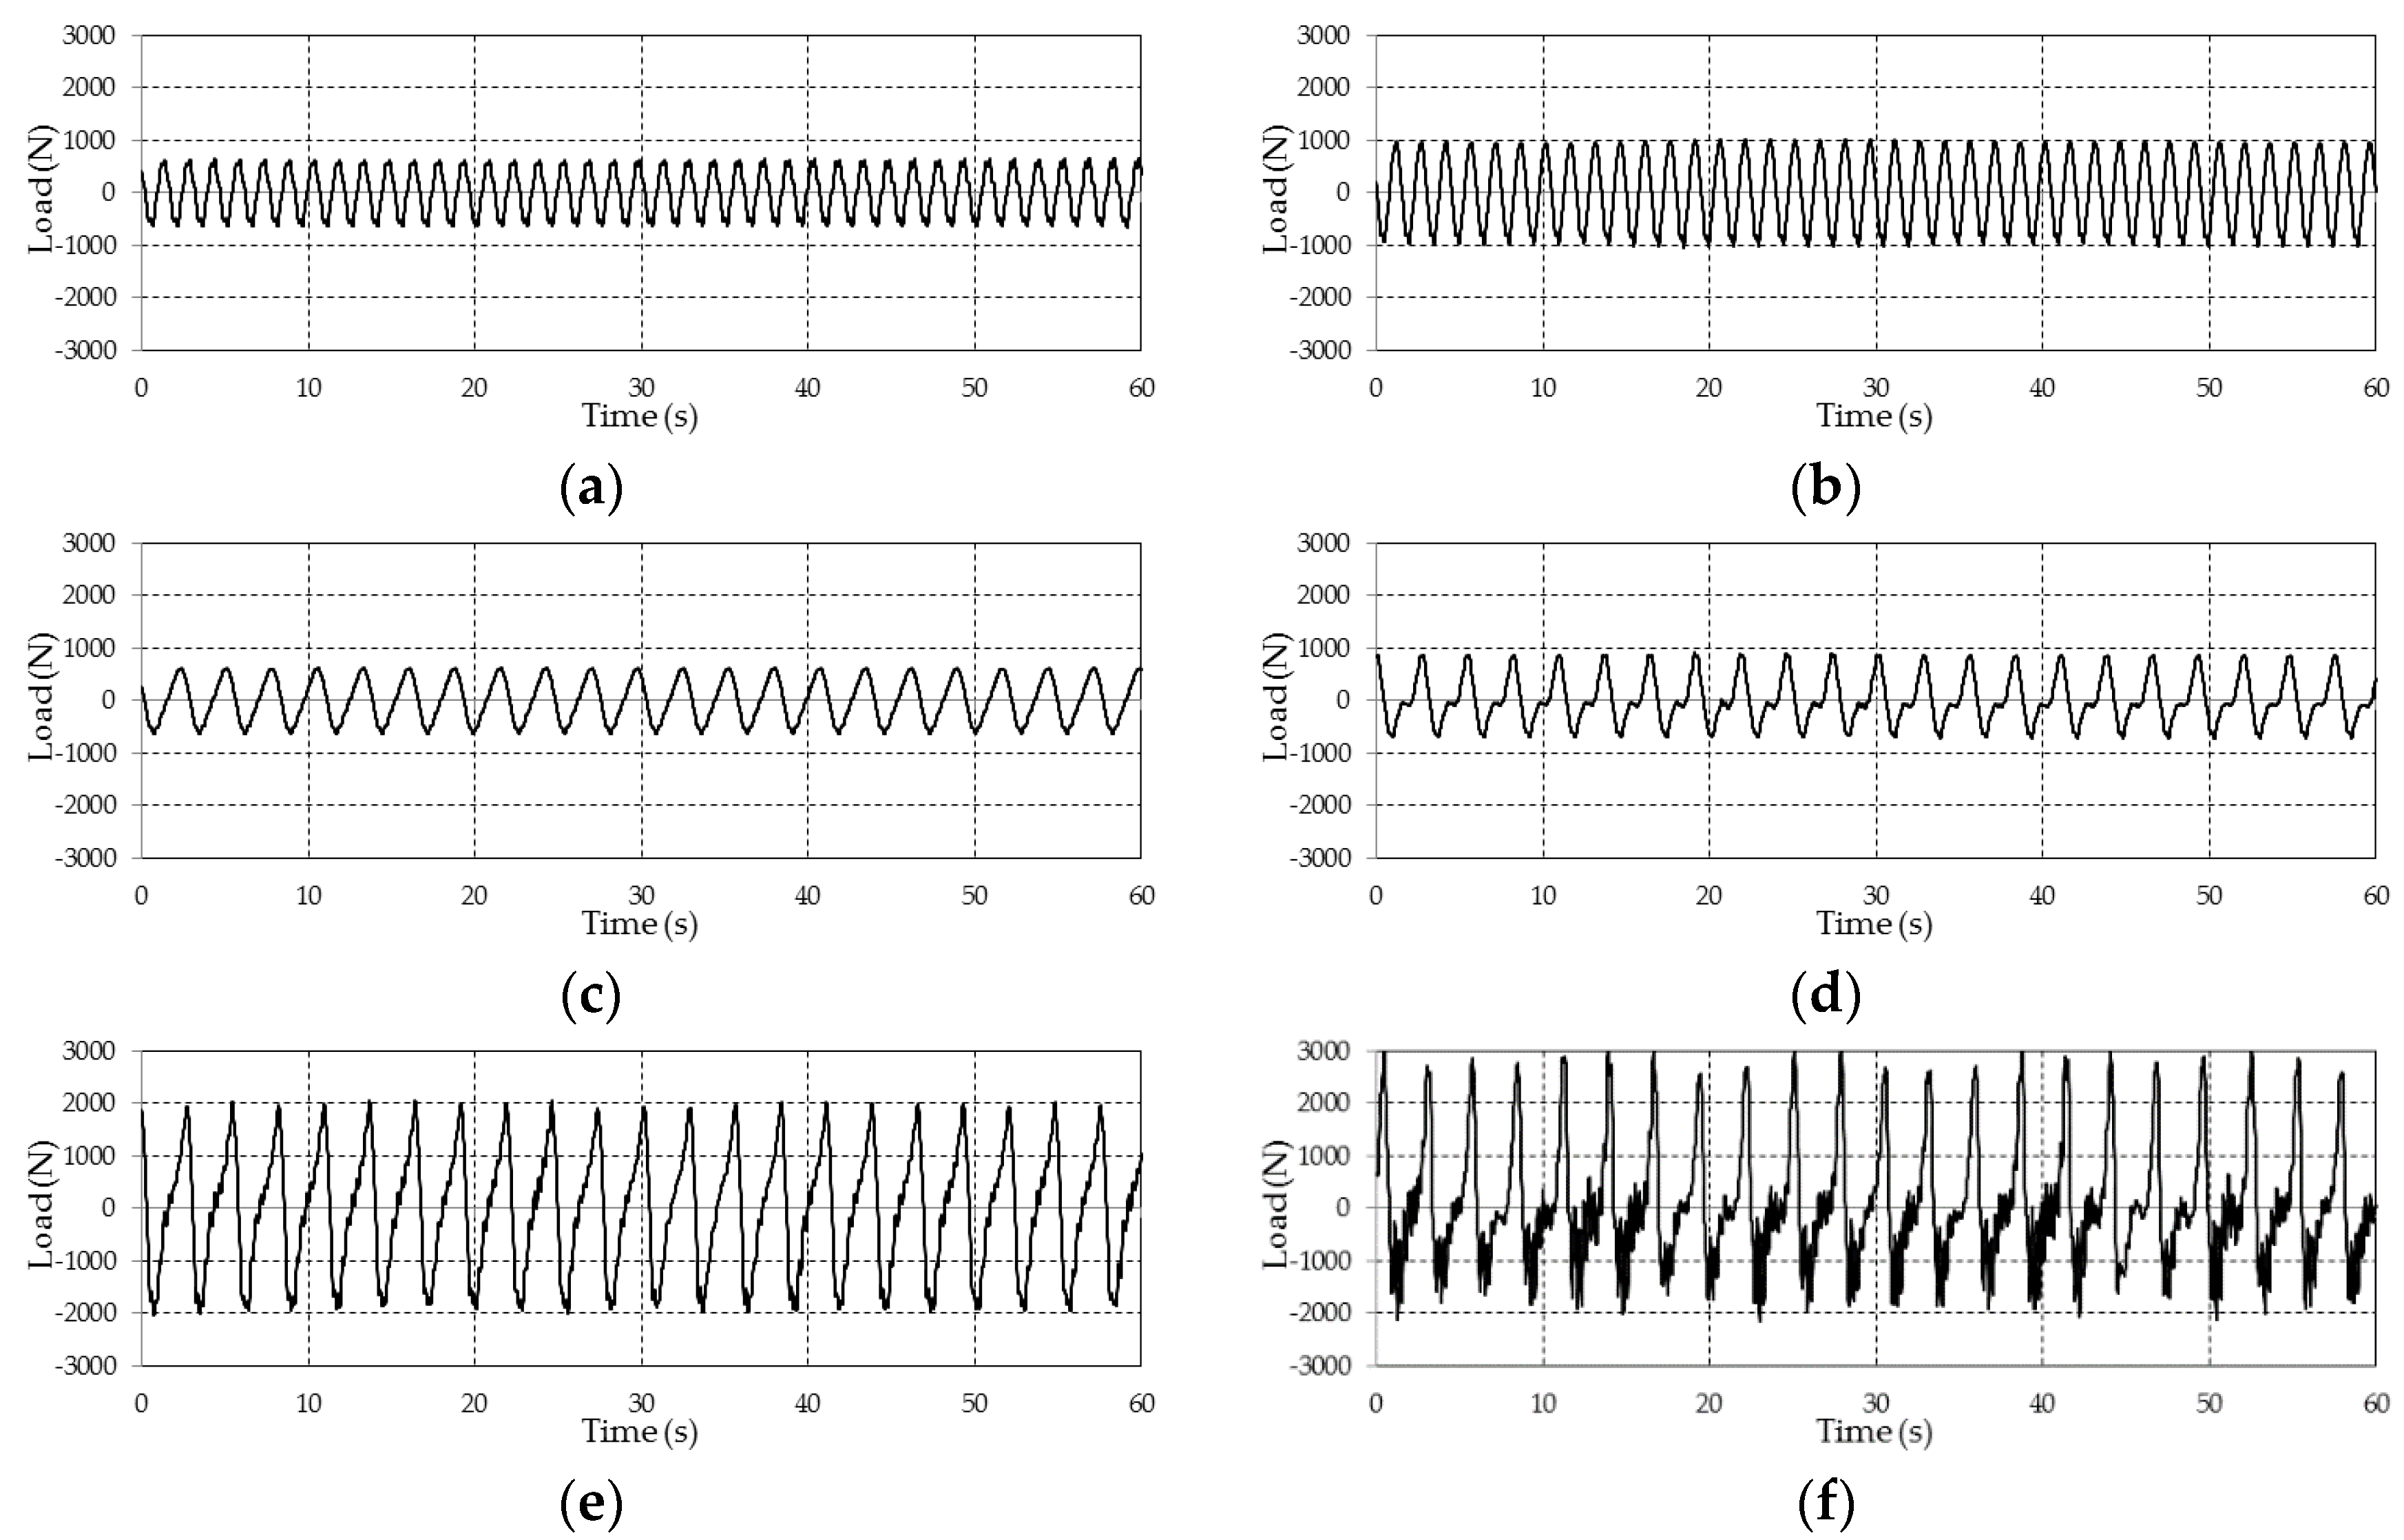
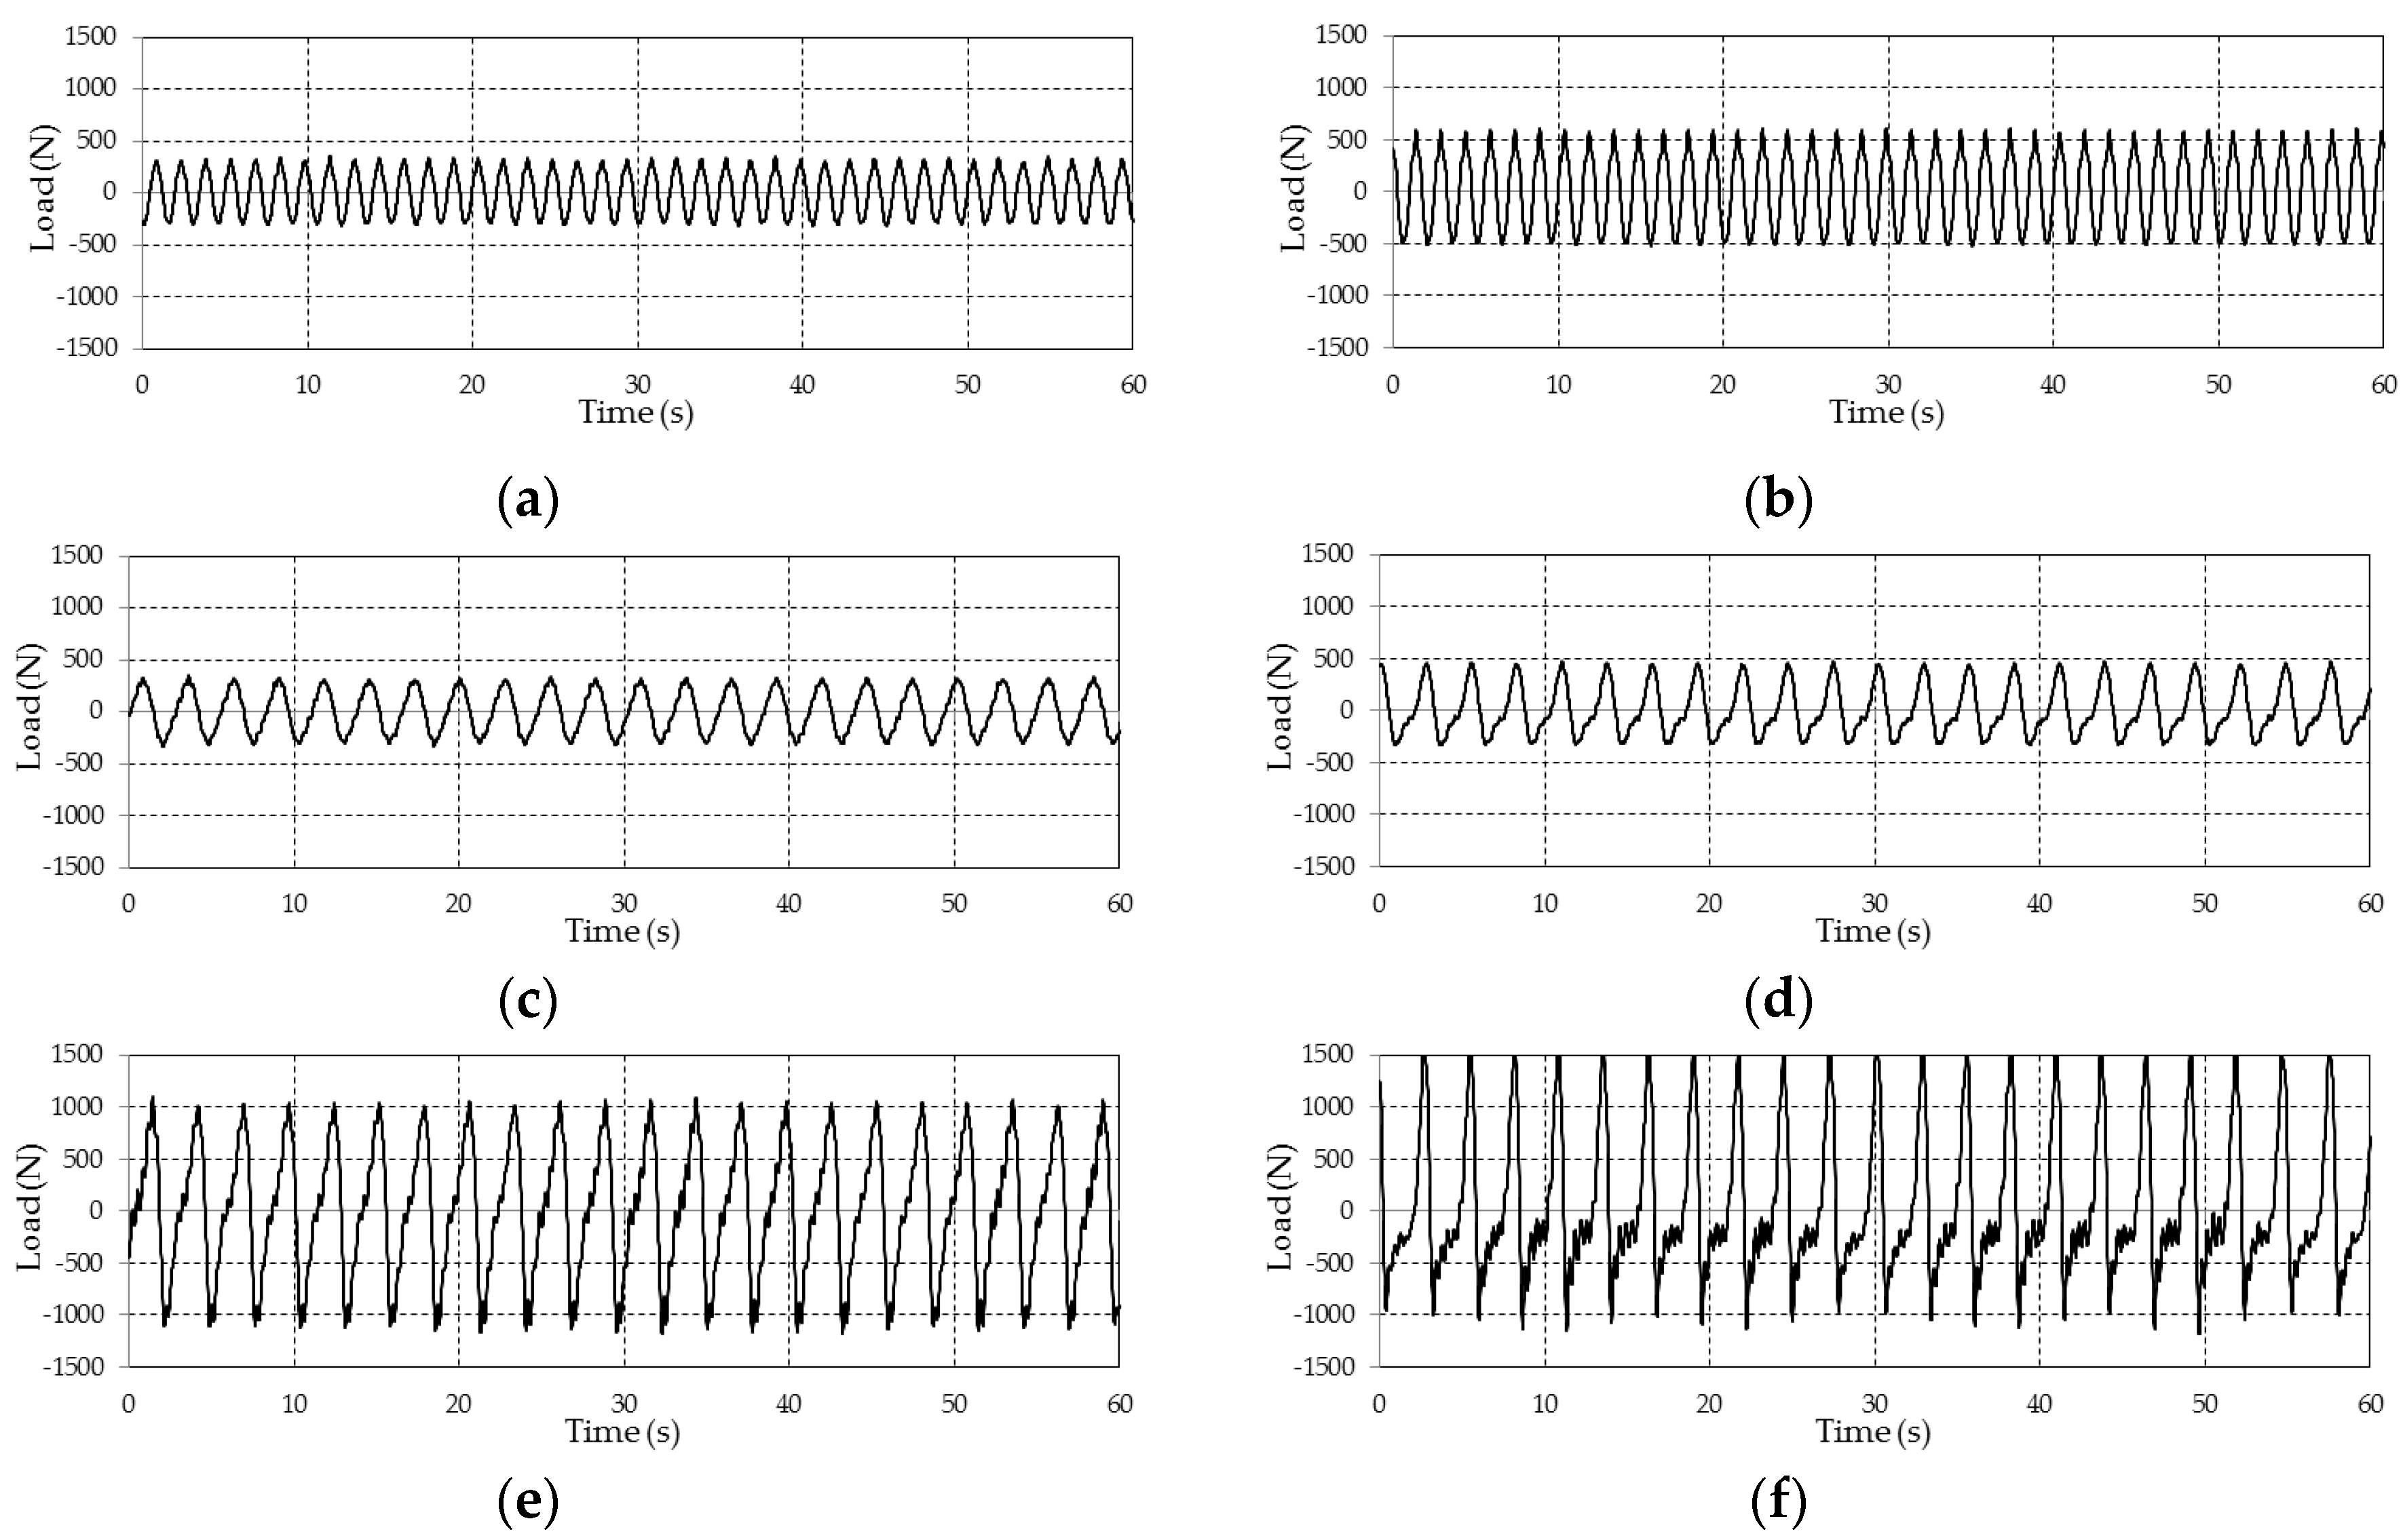
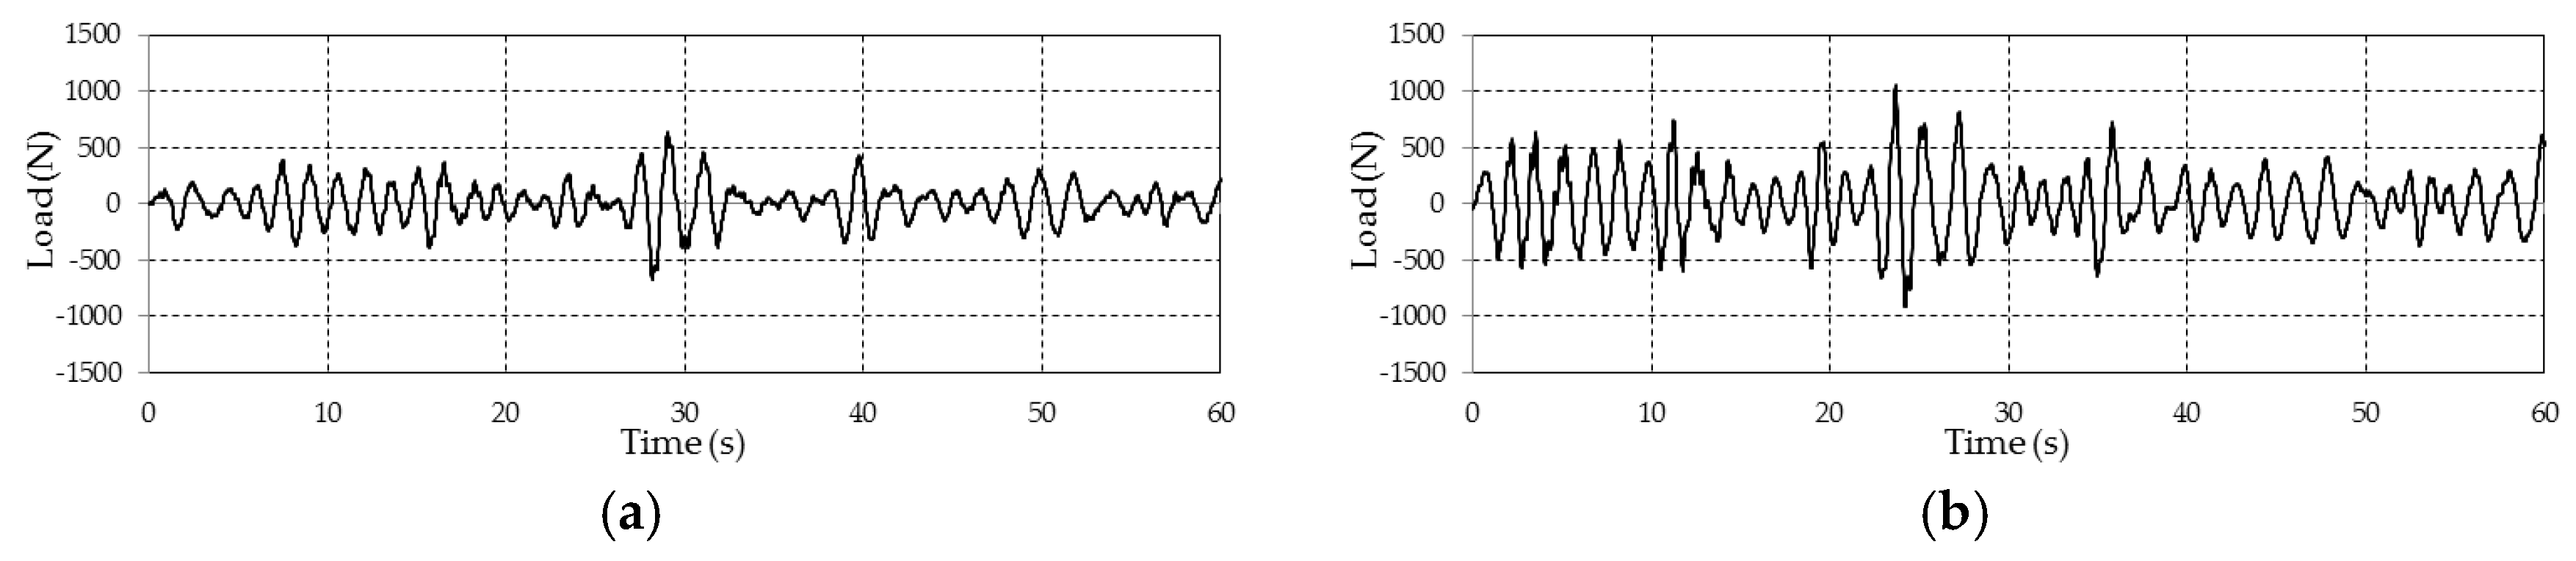
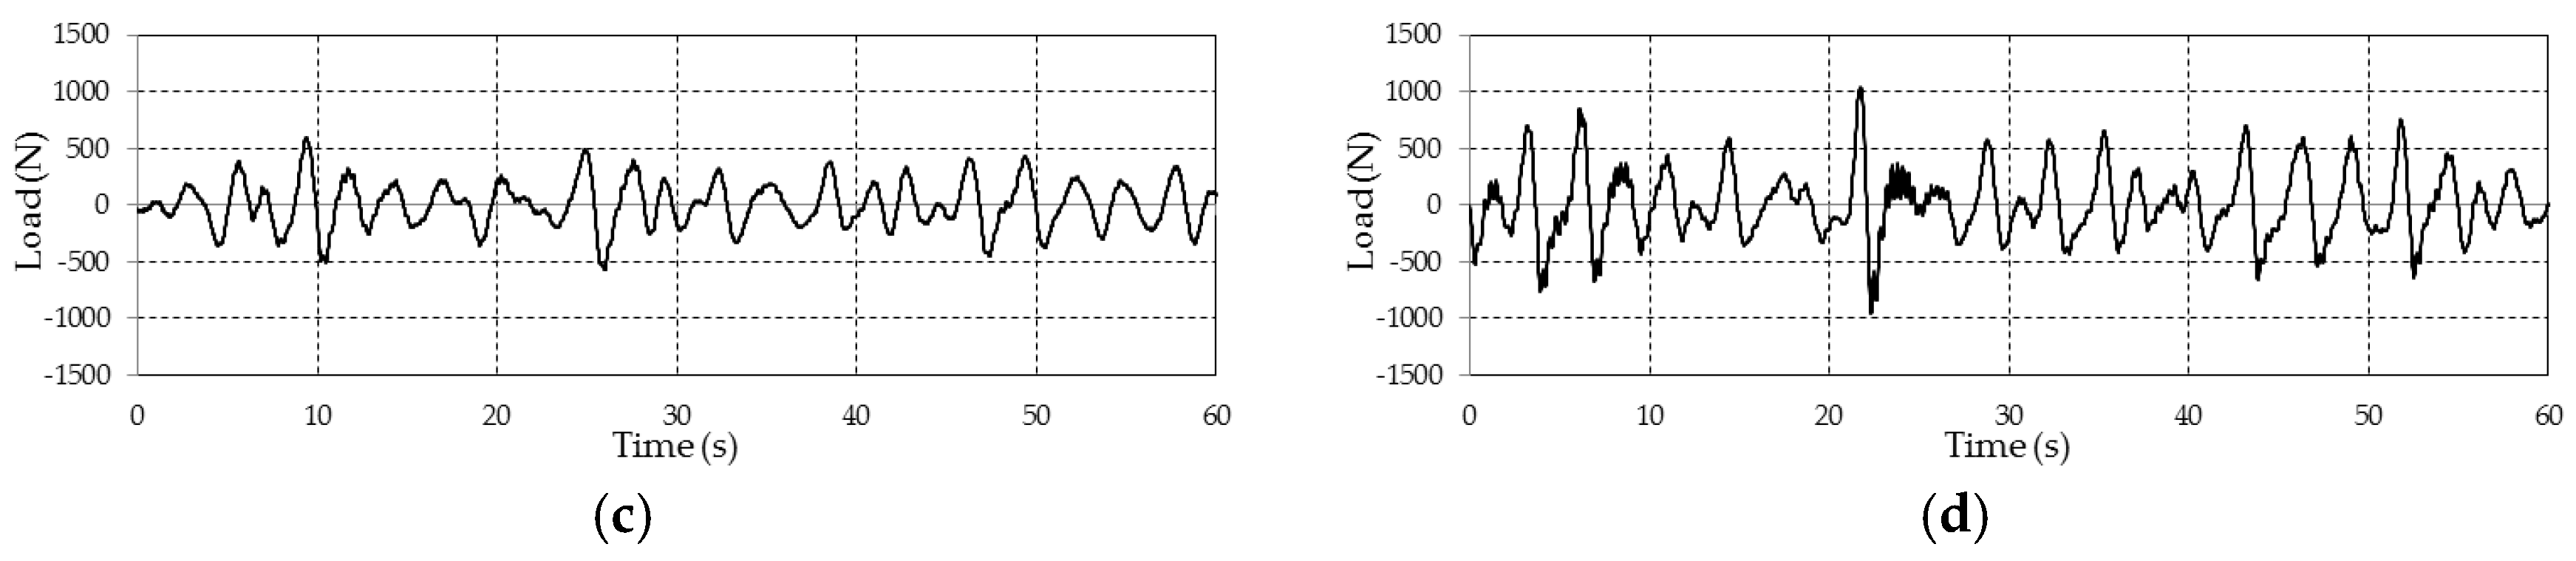
3.1. Wave Force Measurement
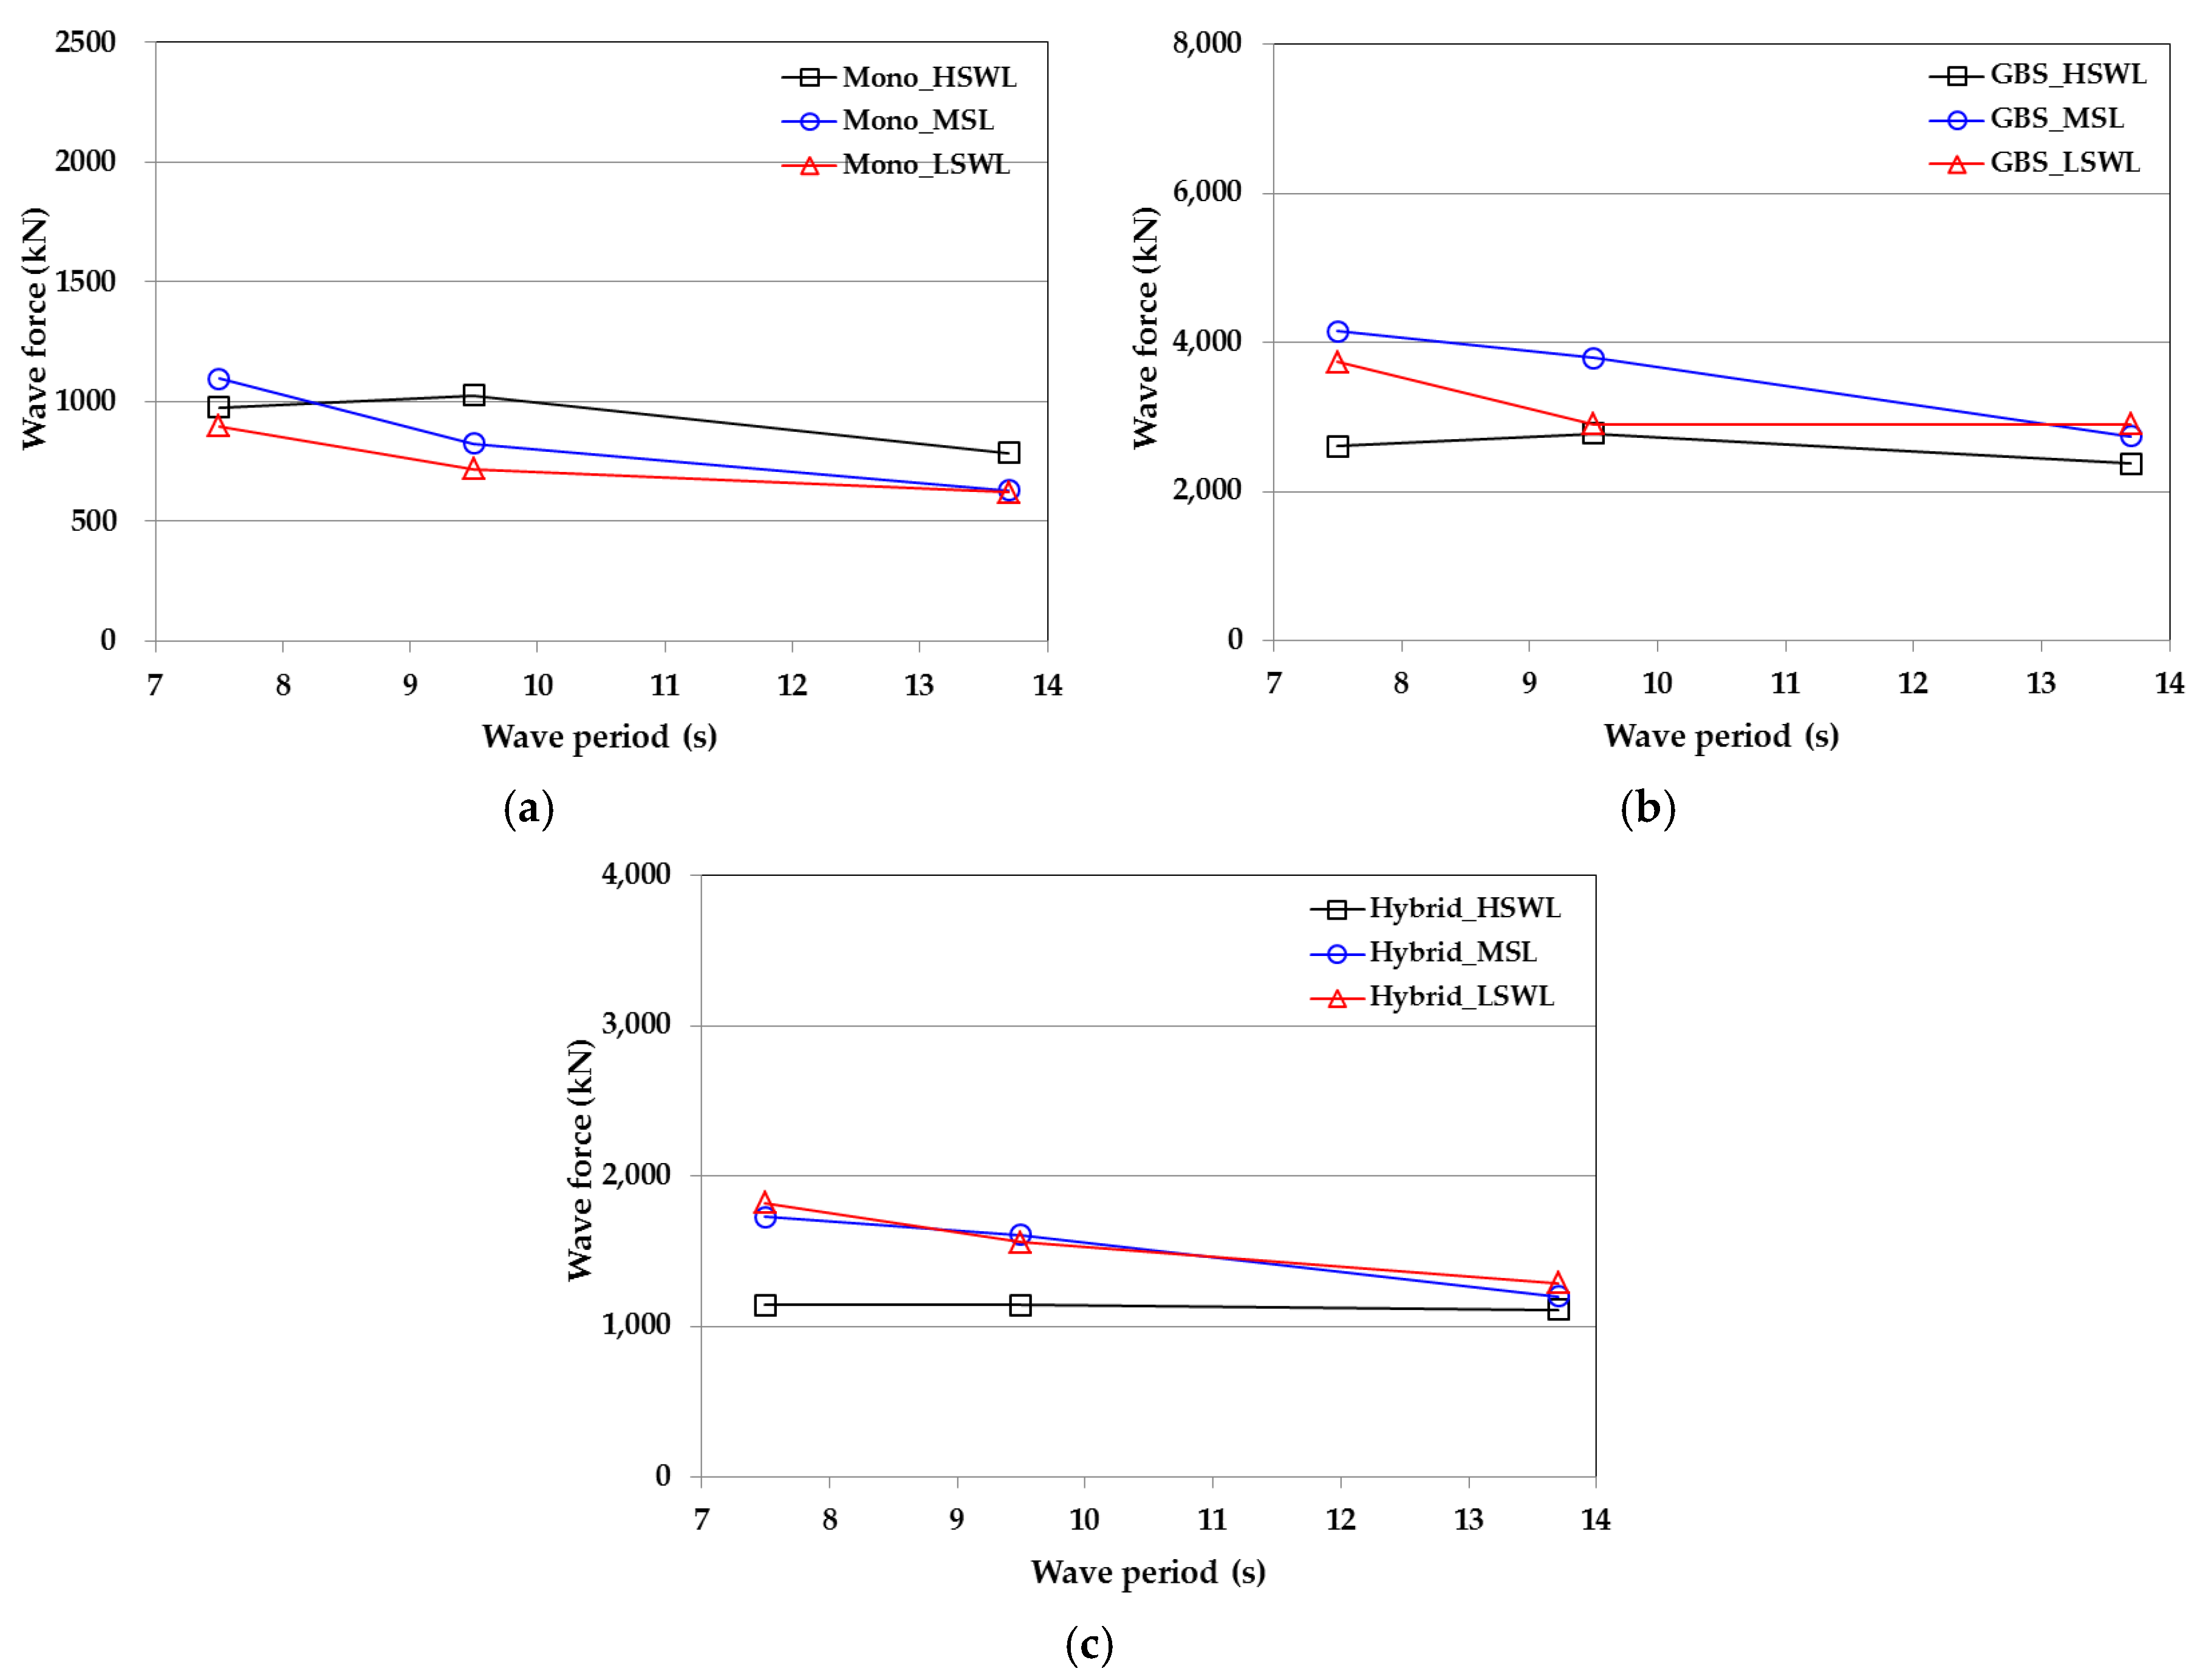
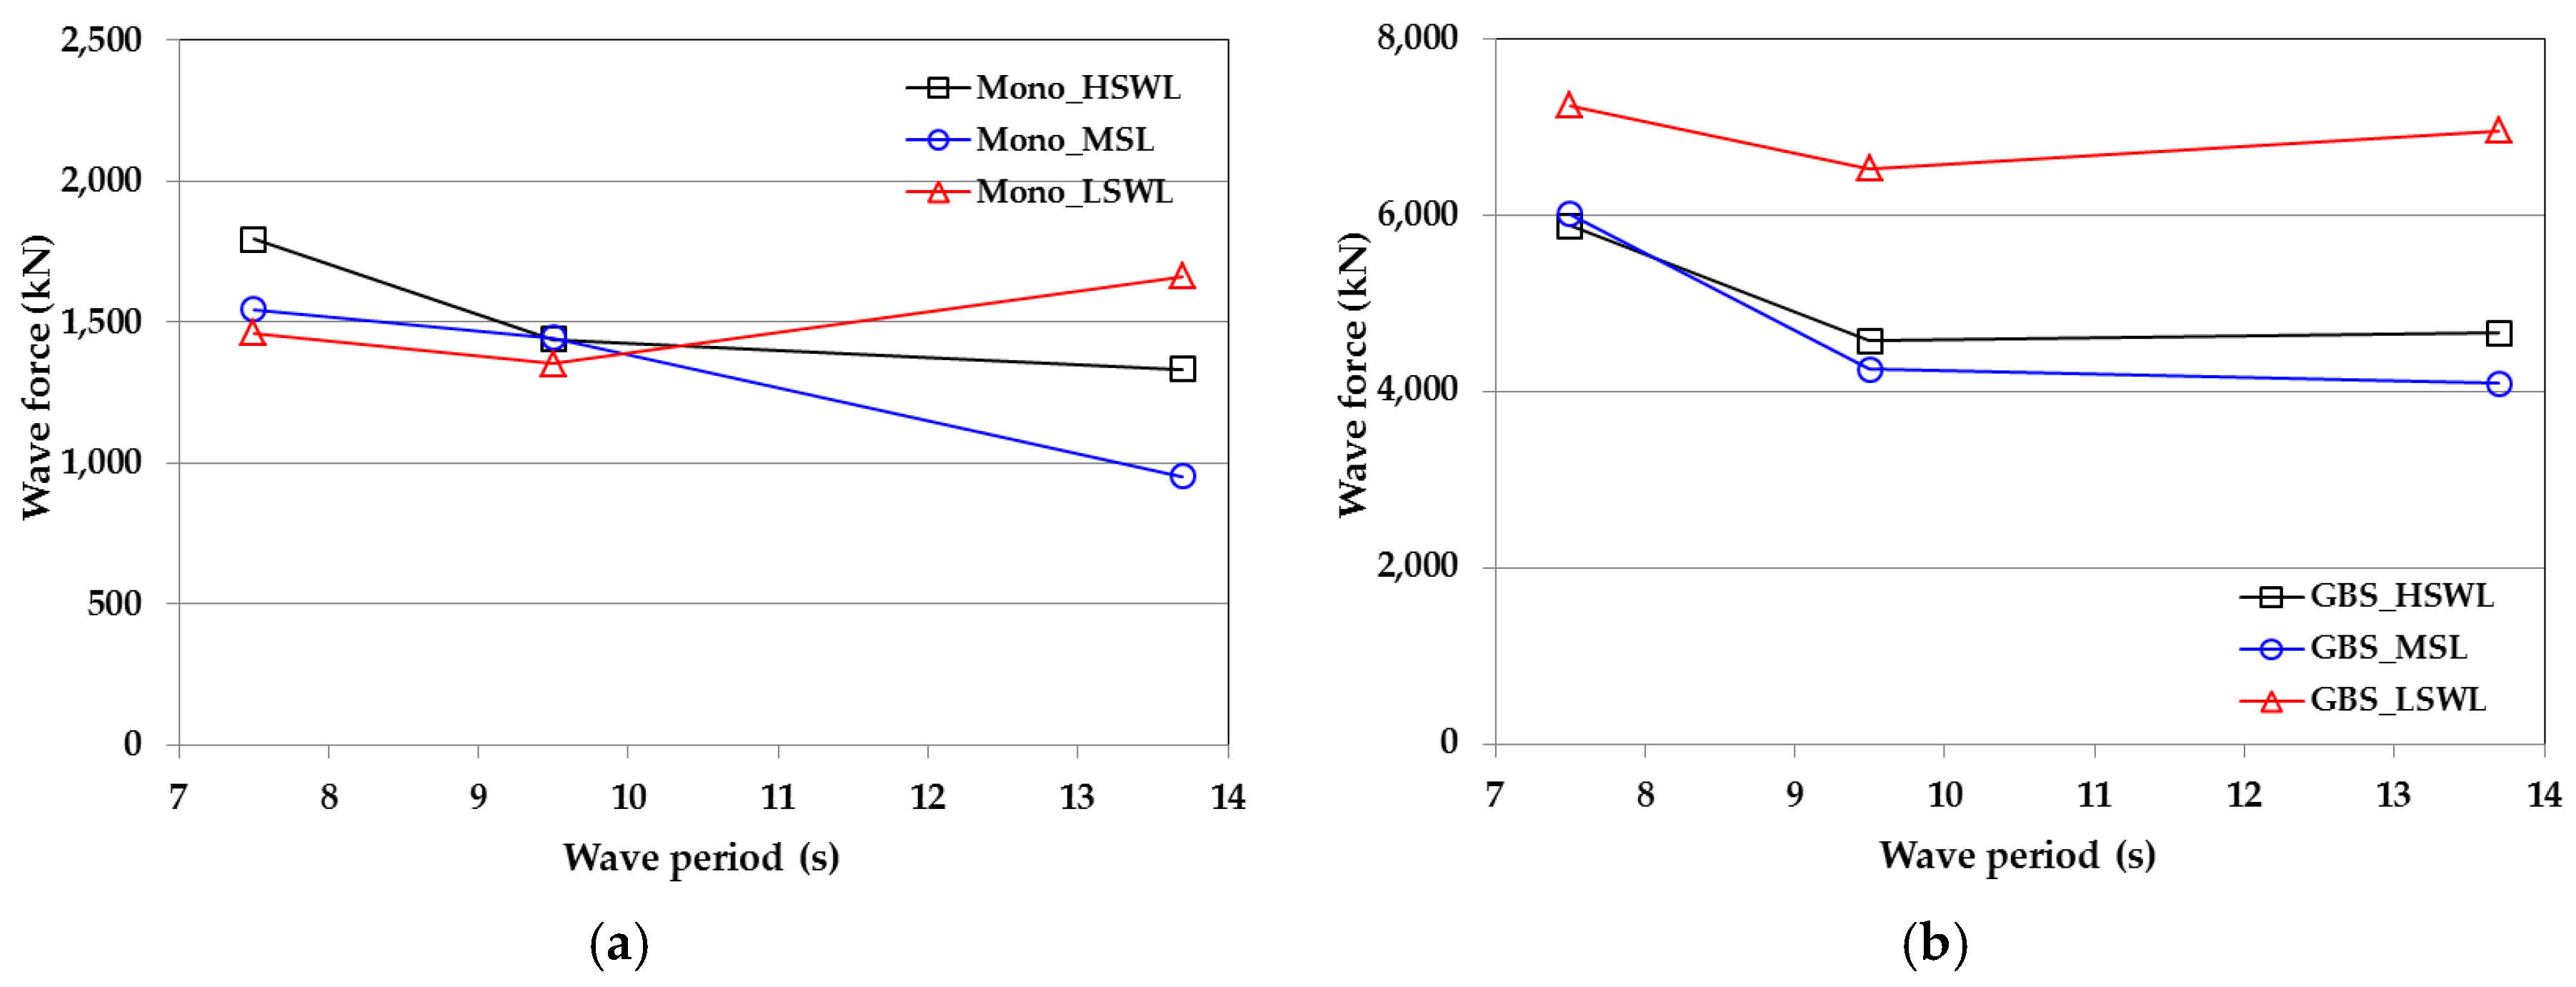
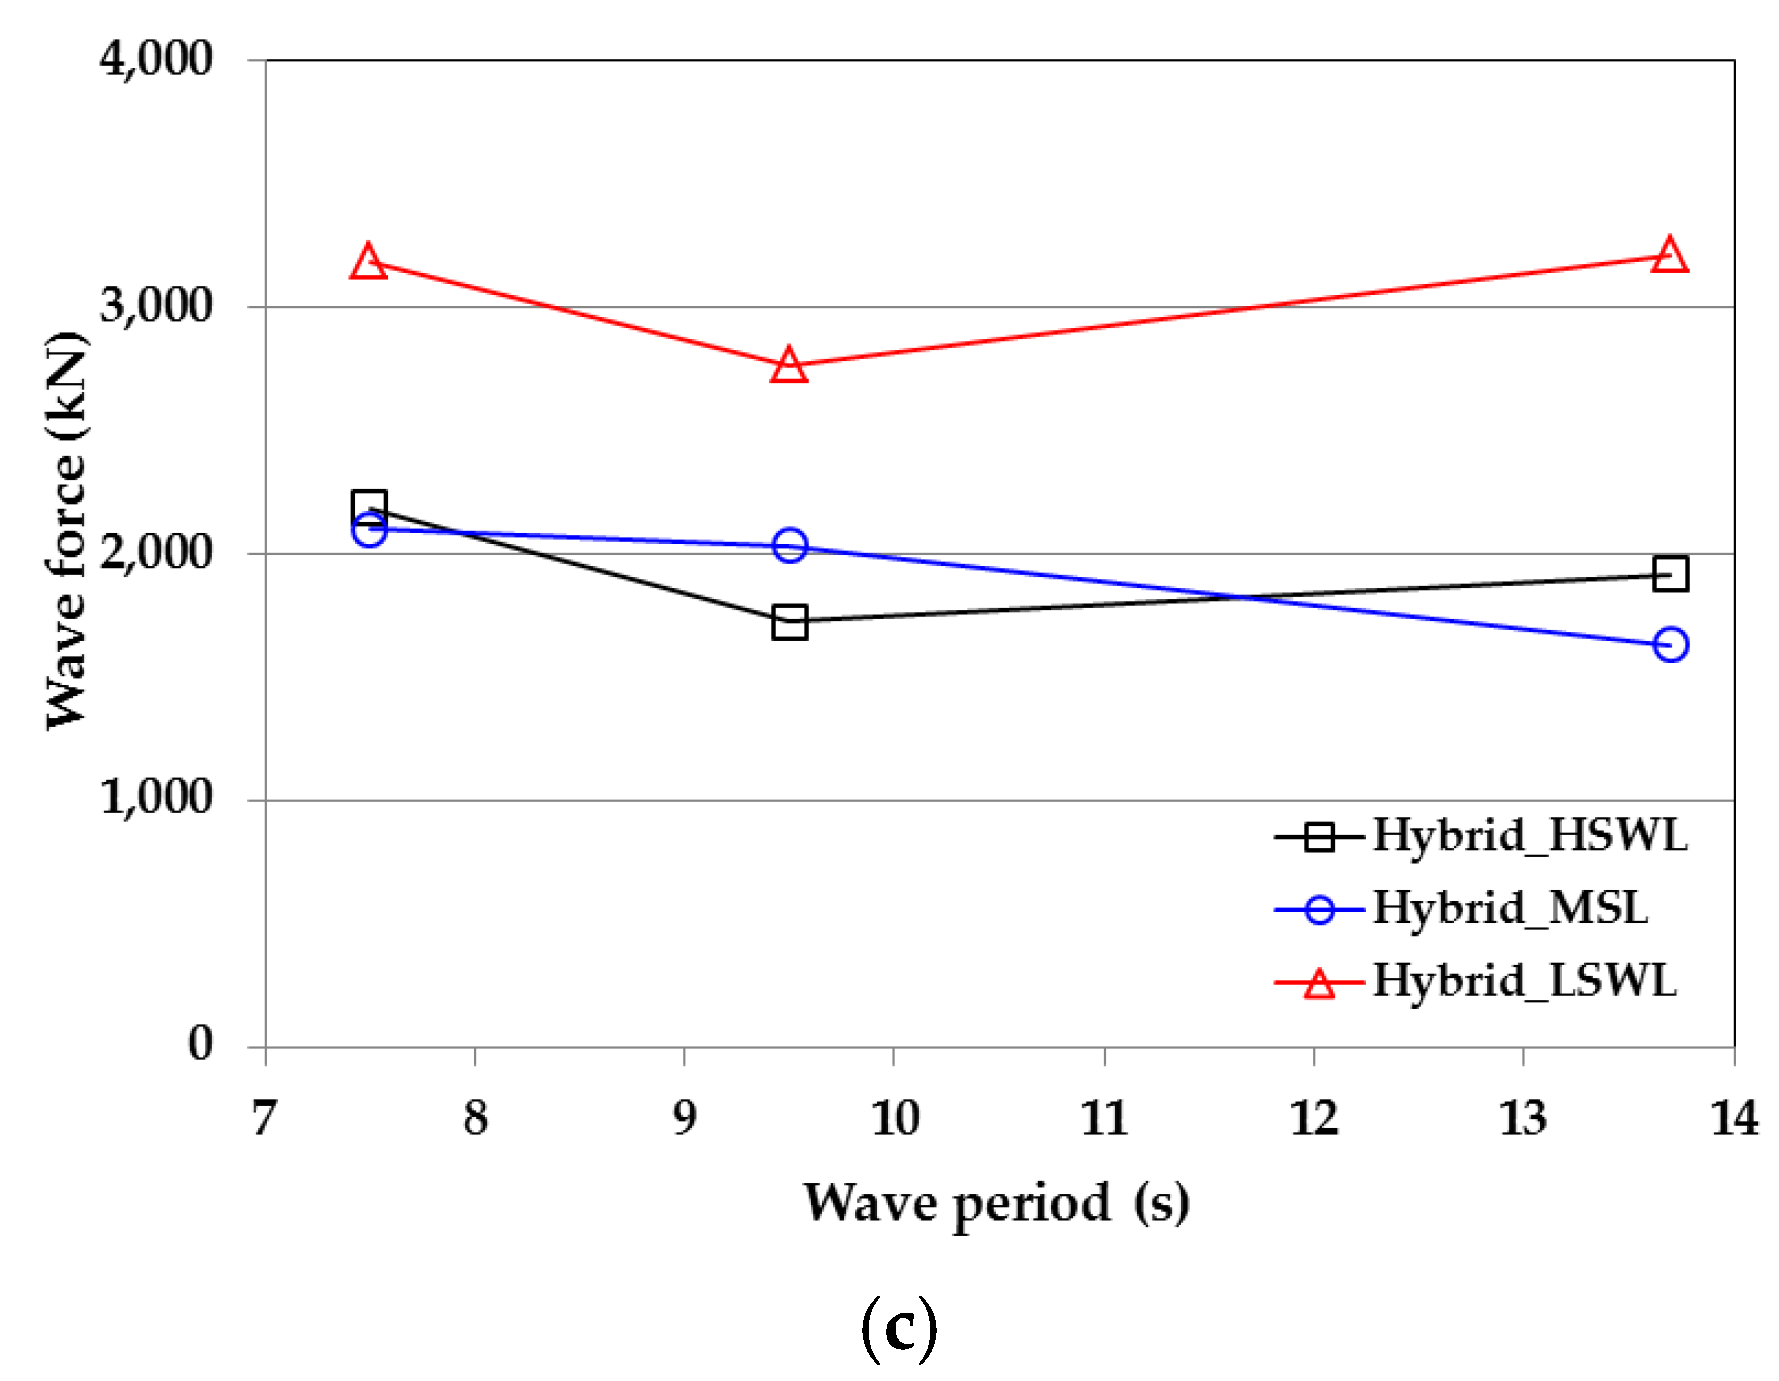
3.2. Wave Forces According to Wave Periods of Regular Waves
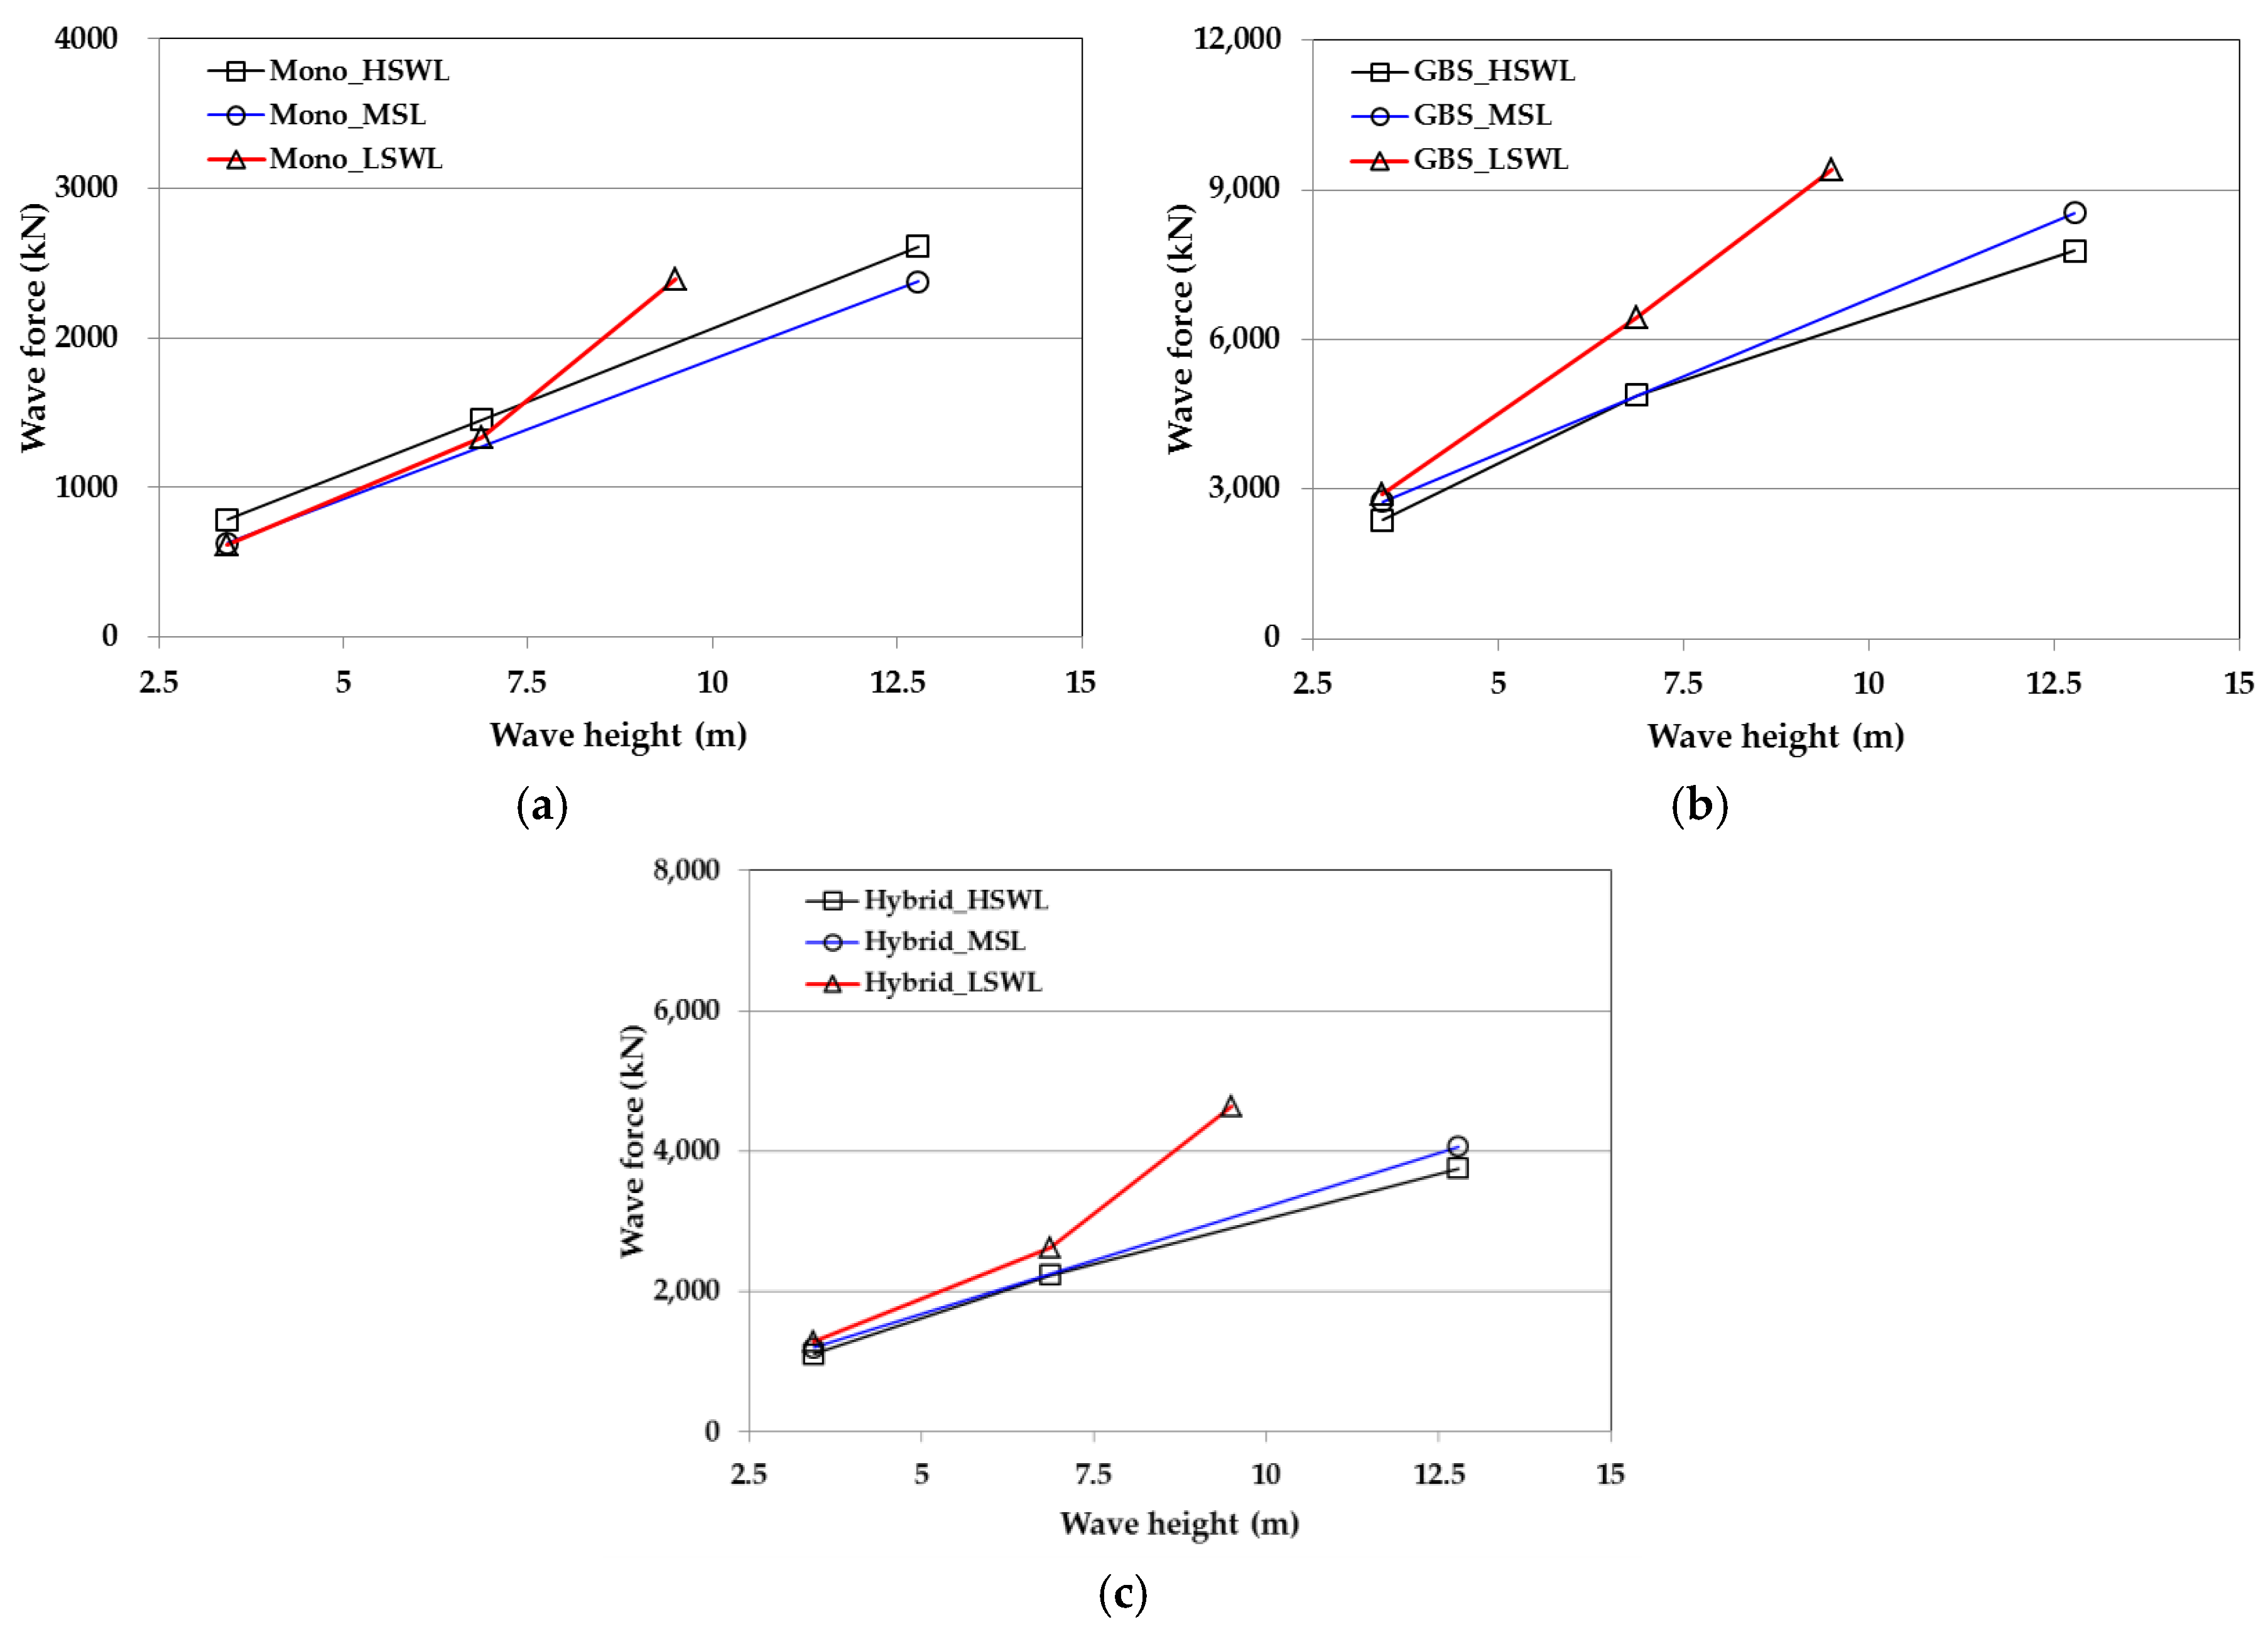
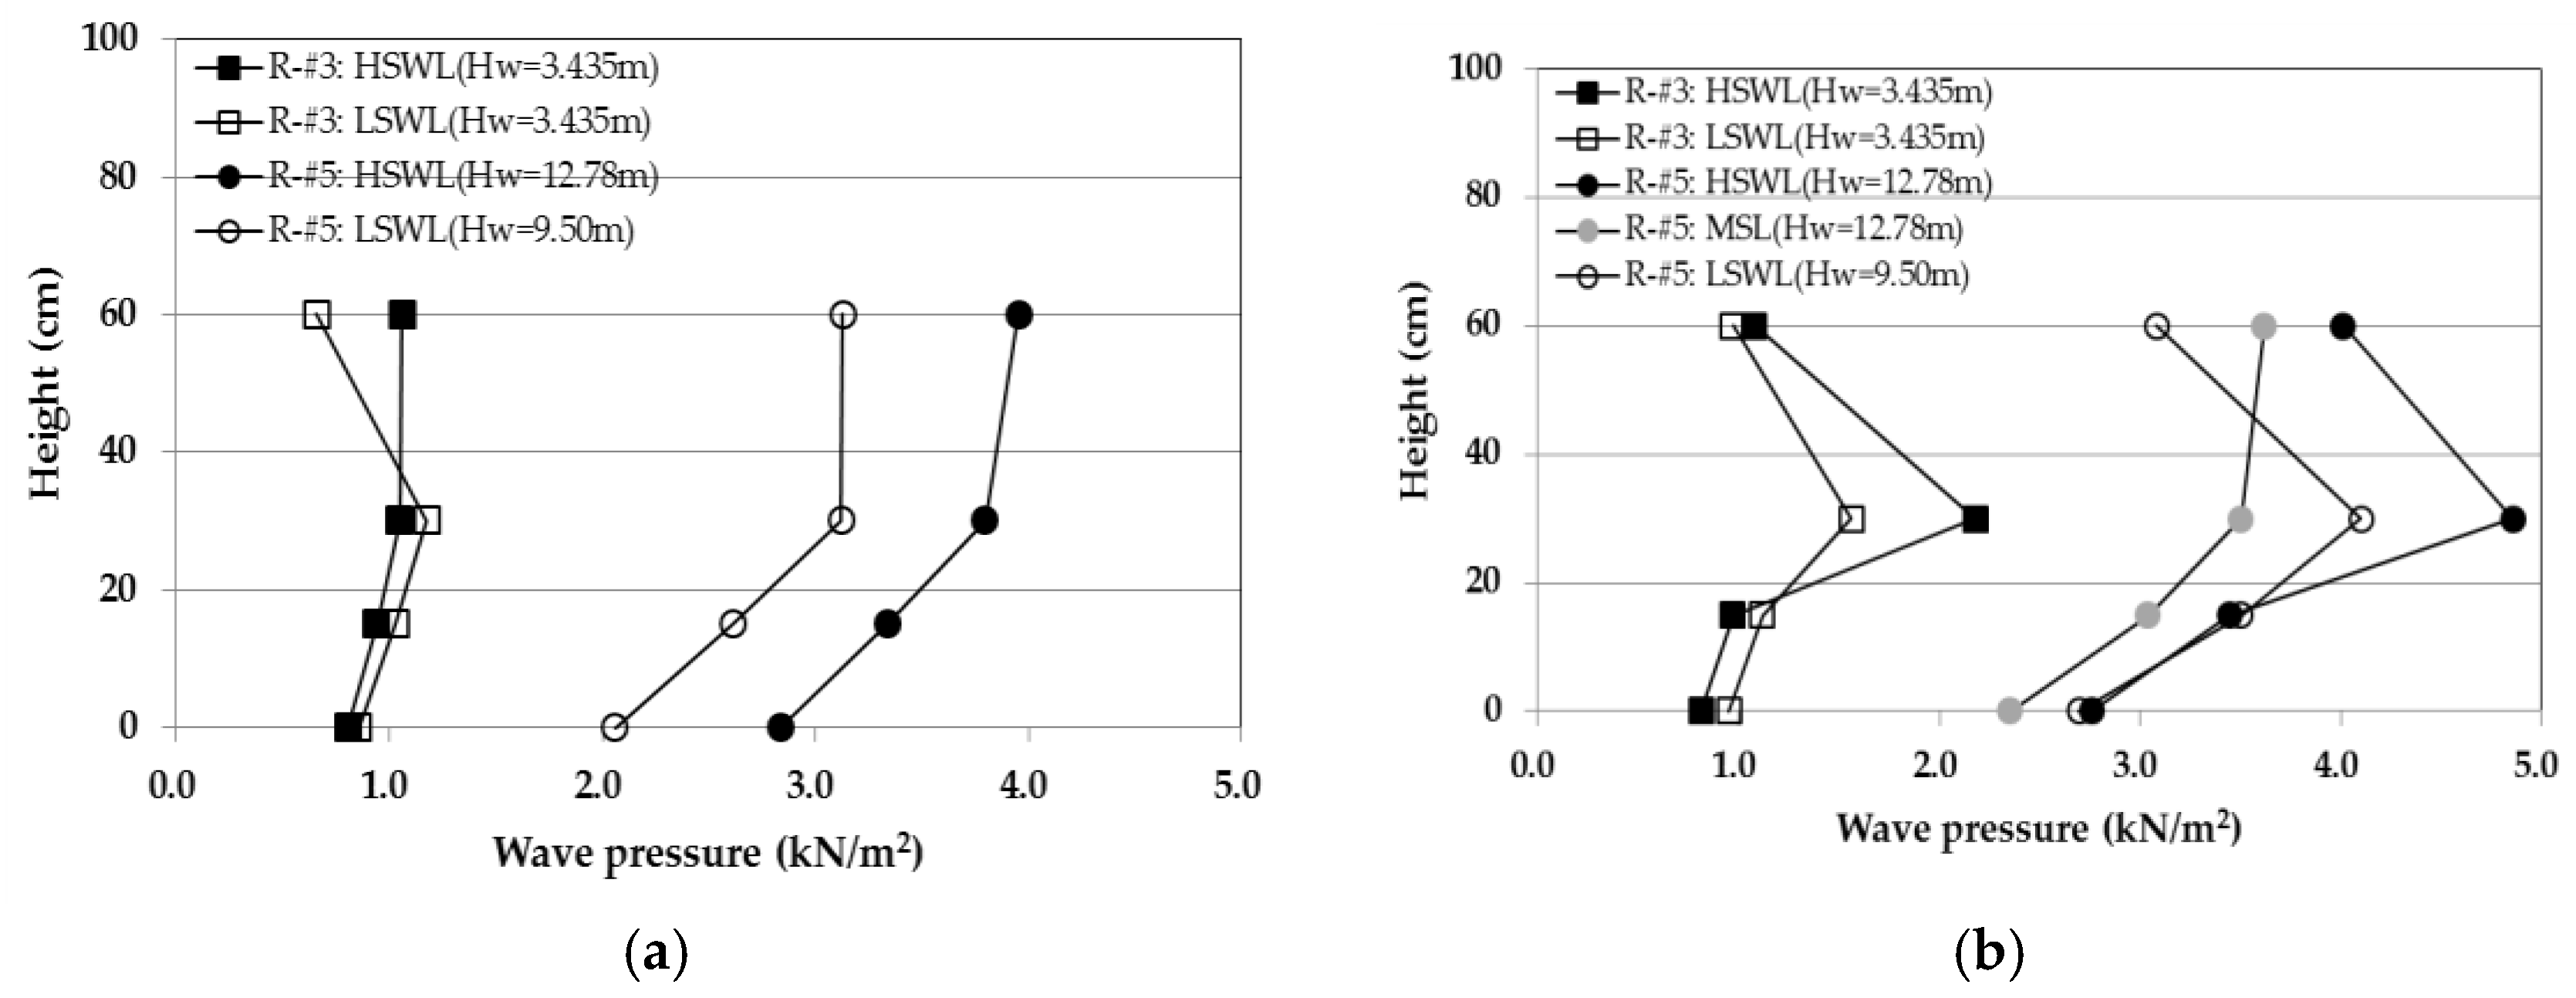
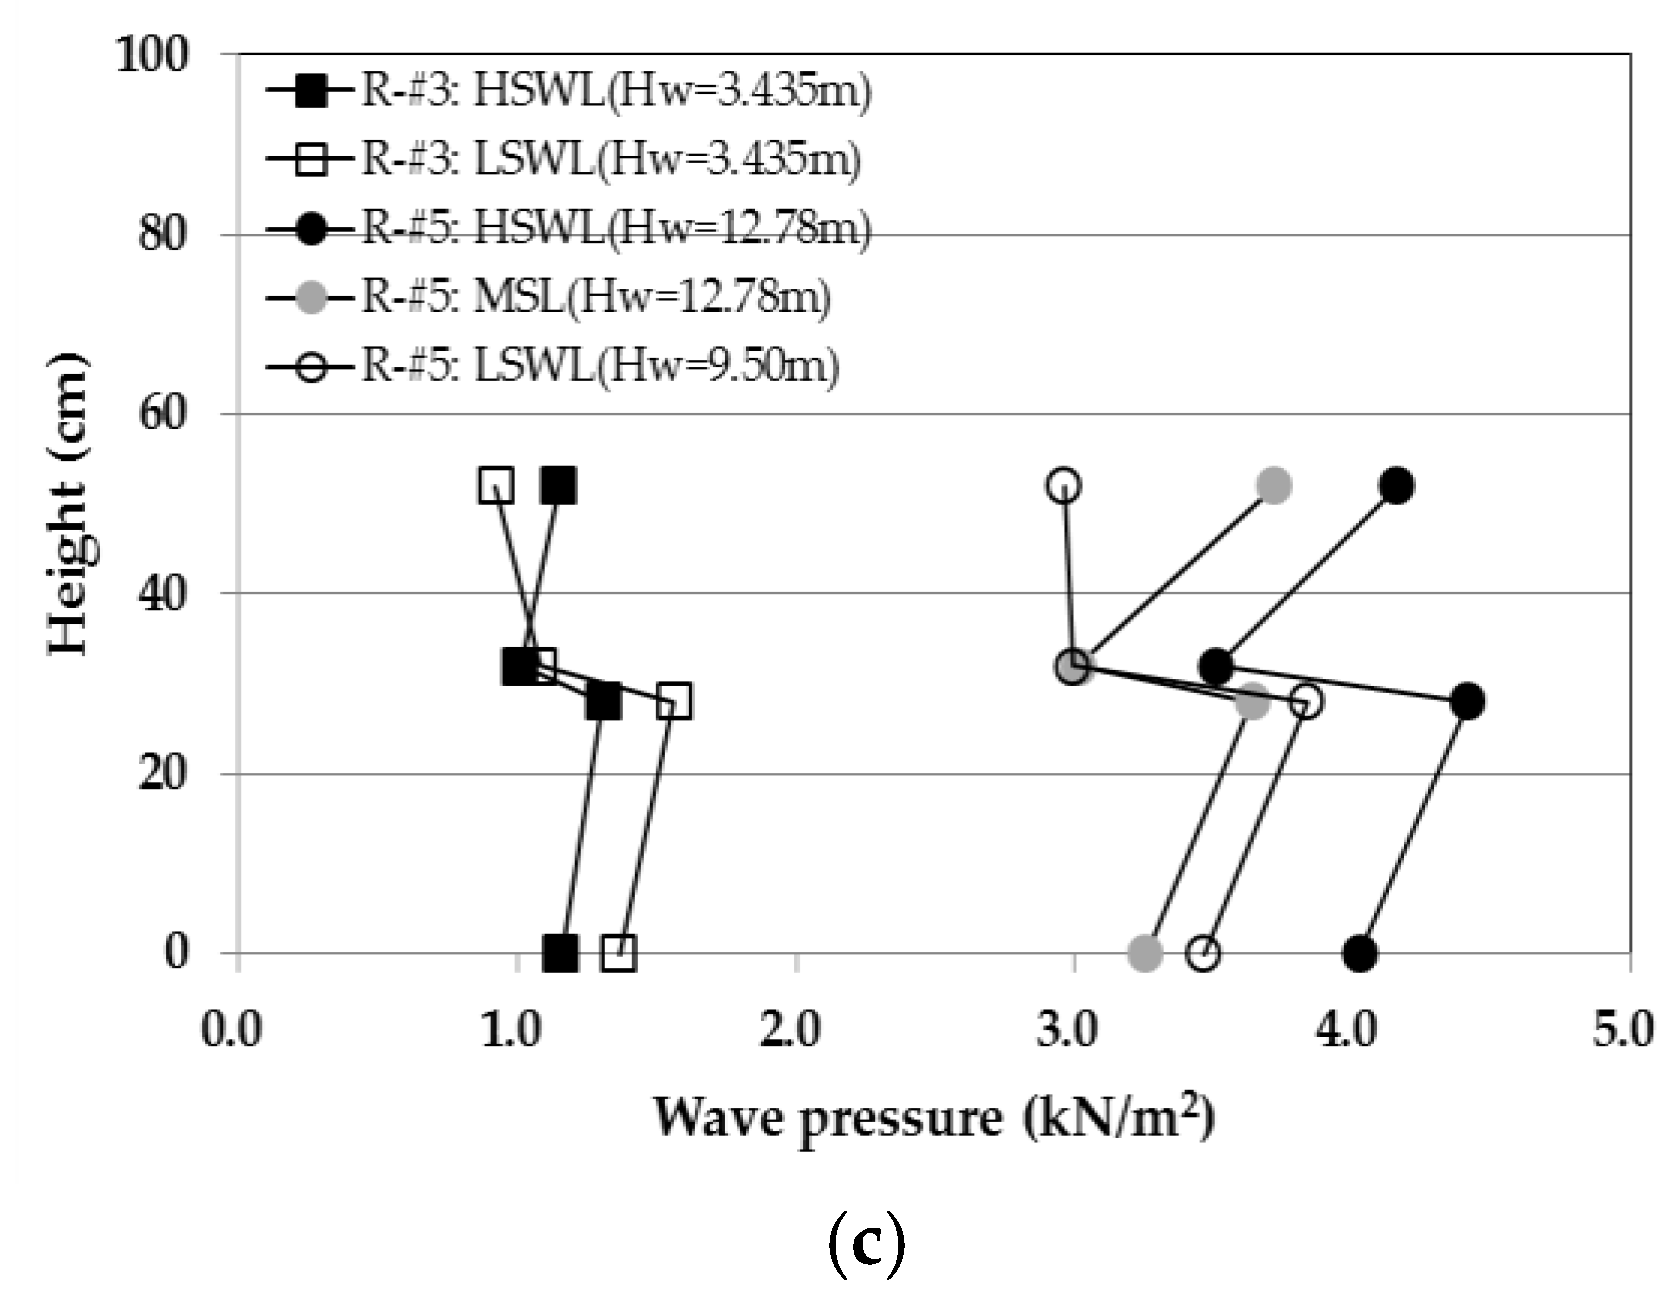
3.3. Wave Forces According to Wave Heights of Regular Waves
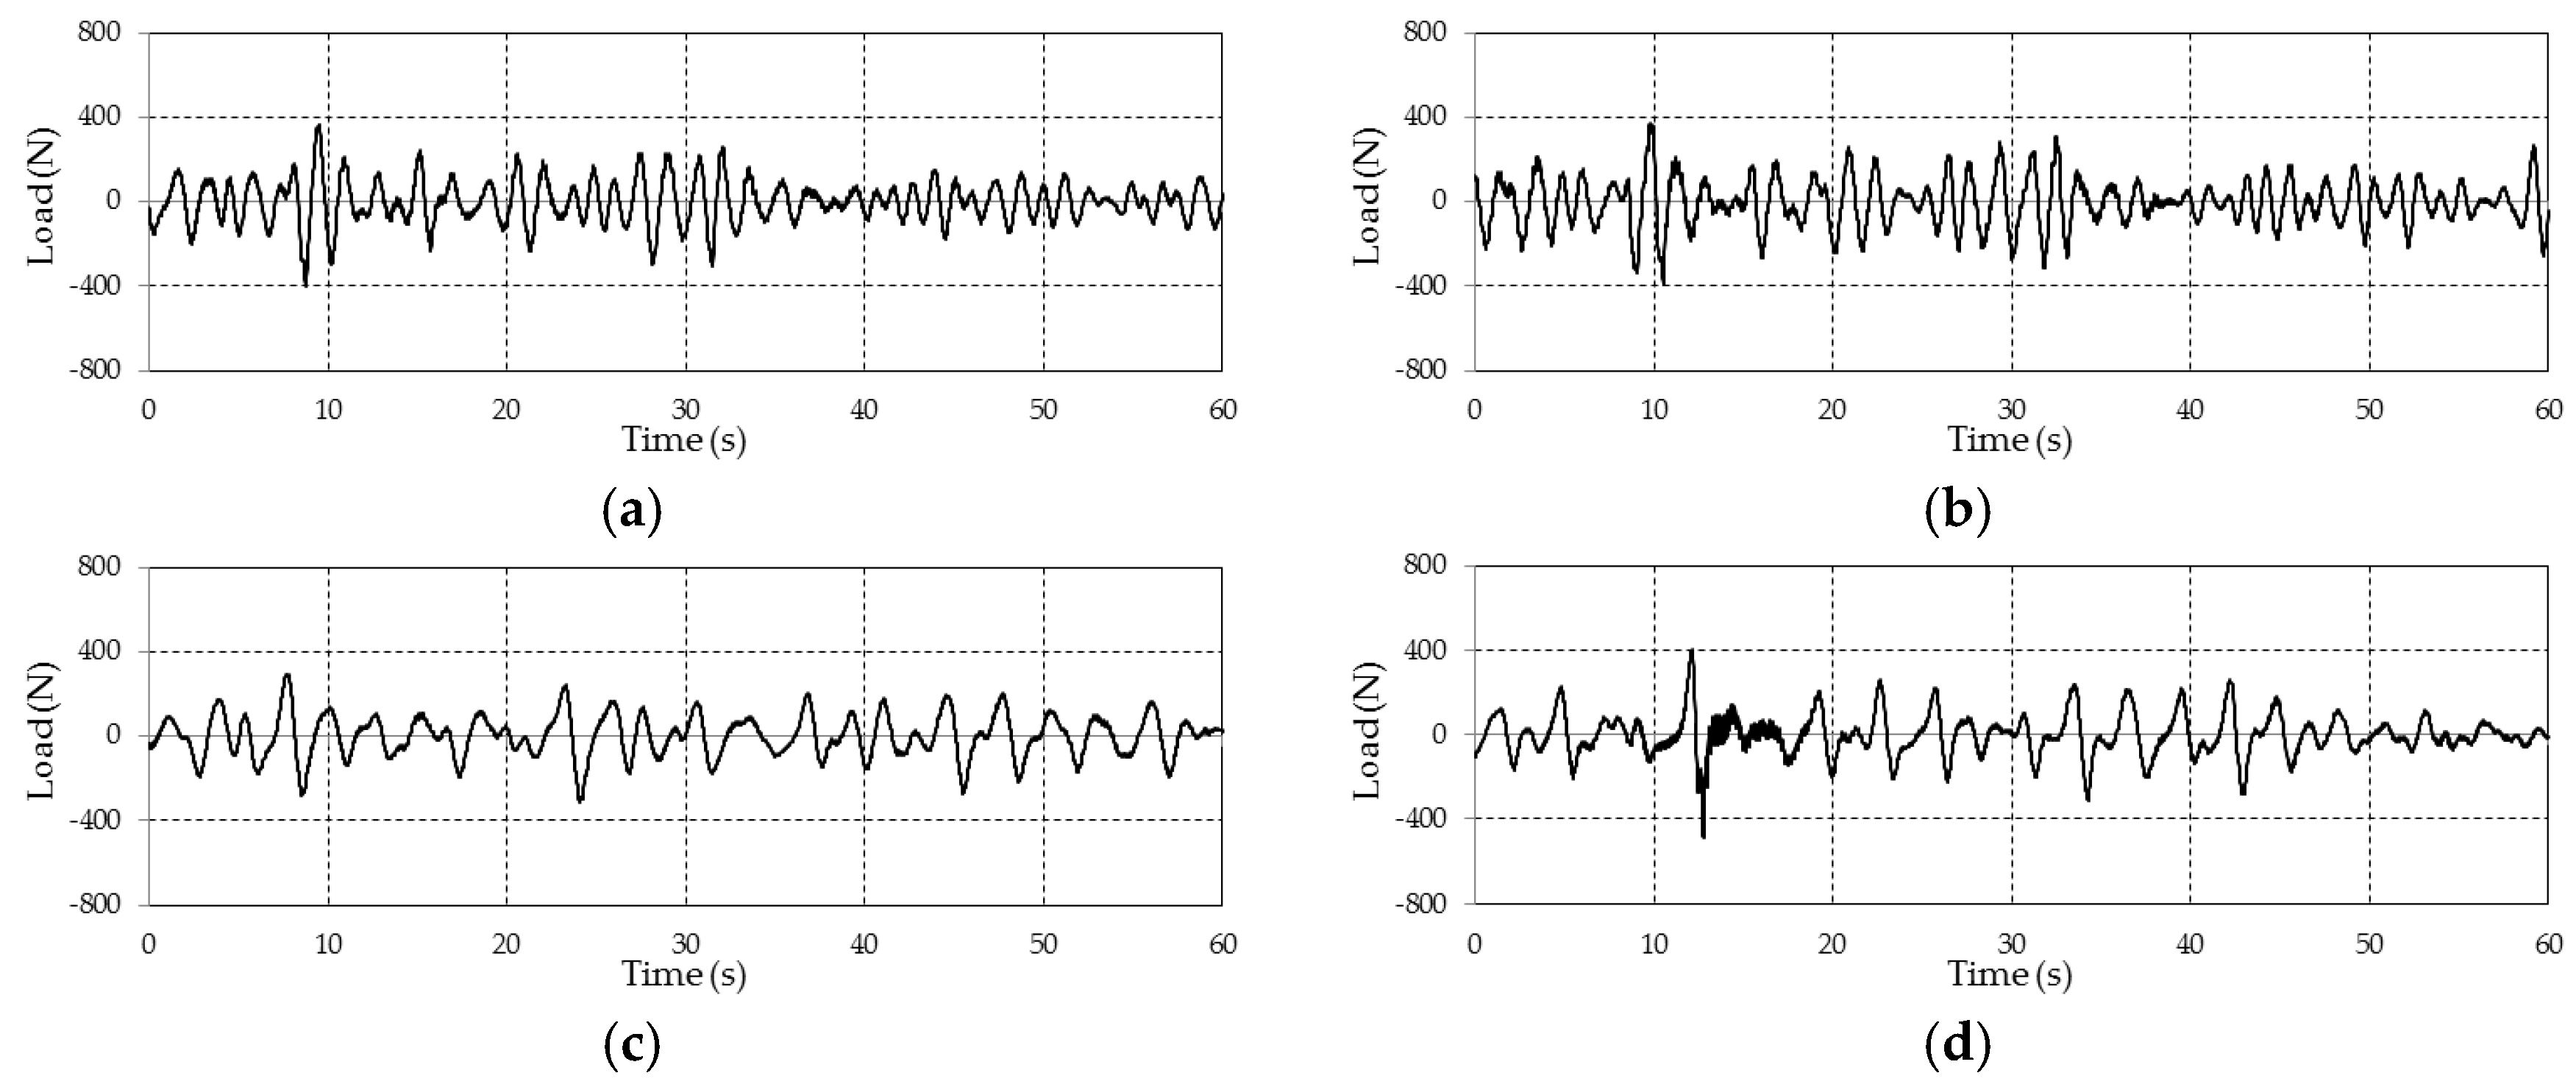
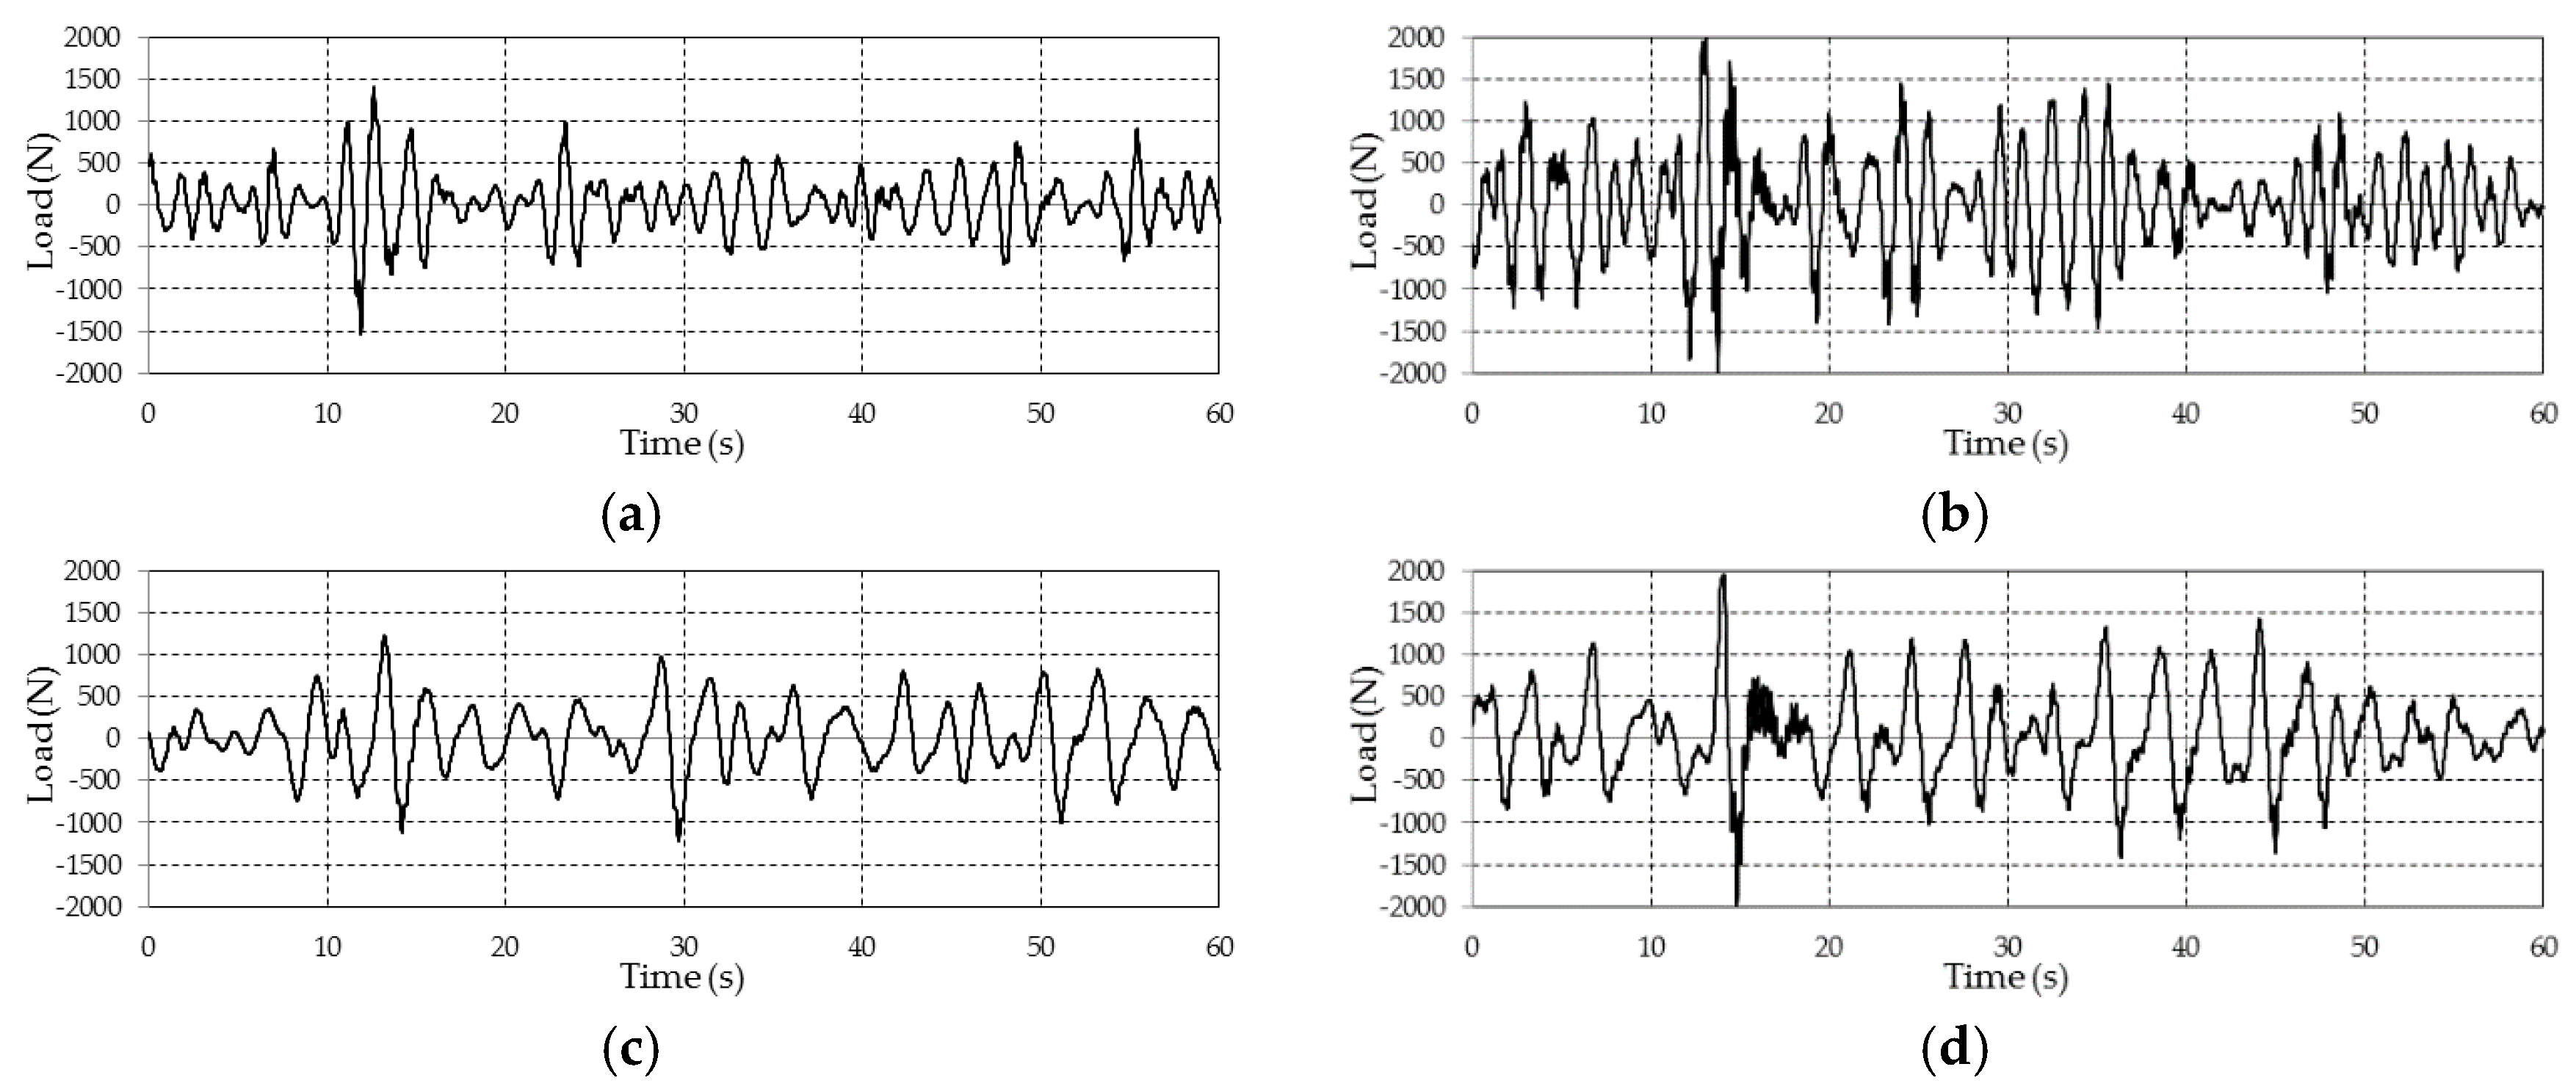
3.4. Wave Forces According to Wave Periods of Irregular Waves
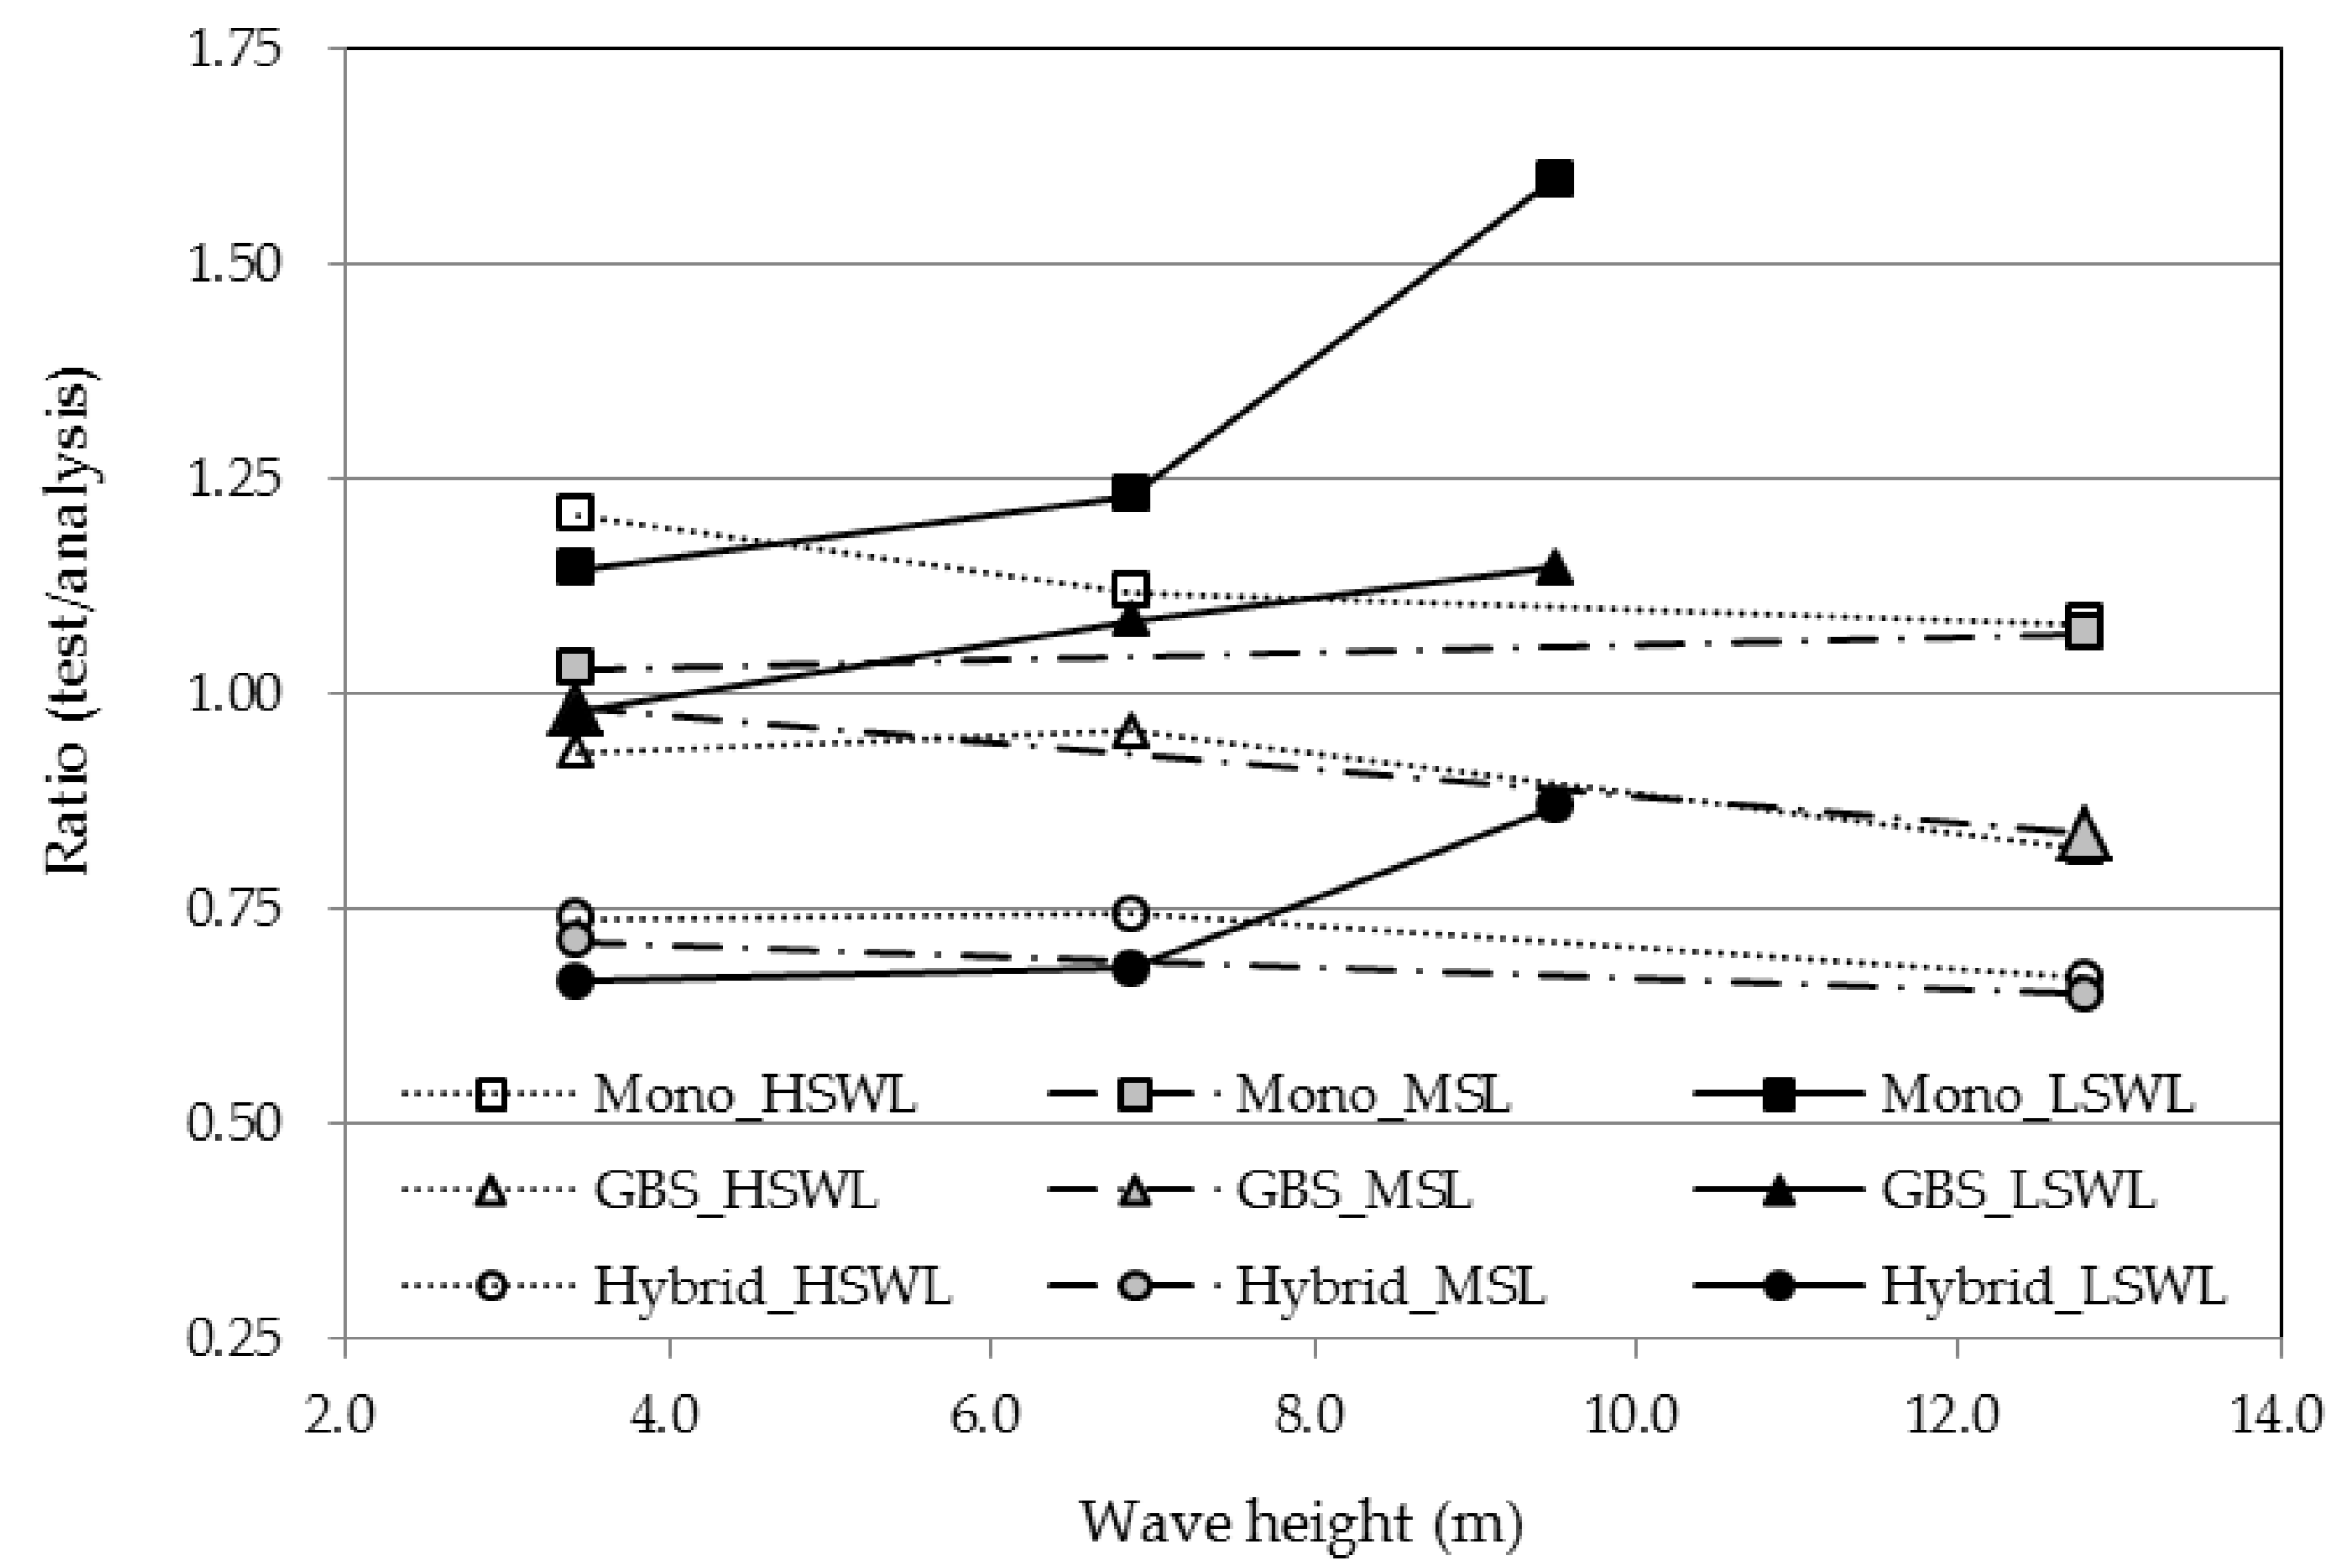
3.5. Comparison Test Results with Analytical Results
4. Conclusions
Author Contributions
Funding
Conflicts of Interest
References
- Park, M.S.; Koo, W.C.; Choi, Y.R. Hydrodynamic interaction with an array of porous circular cylinders. Int. J. Naval Arch. Ocean Eng. 2010, 2, 146–154. [Google Scholar] [CrossRef]
- Park, M.S.; Koo, W.C.; Kawana, K. Numerical analysis of the dynamic response of an offshore platform with a pile-soil foundation system subjected to random waves and currents. J. Waterway Port Coast. Ocean Eng. ASCE 2012, 138, 275–285. [Google Scholar] [CrossRef]
- Christensen, E.D.; Bredmose, H.; Hansen, E.A. Extreme wave forces and wave run-up on offshore wind turbine foundations. In Proceedings of the Copenhagen Offshore Wind Conference, Copenhagen, Denmark, 10–12 March 2005; pp. 1–10. [Google Scholar]
- Michael, R.G. Wave Shoaling and Refraction; Springer: Berlin, Germany, 2011. [Google Scholar]
- Orzech, M.; Herbers, T.H.C.; Elgar, S.; Guza, R.T. Shoaling transformation of wave frequency-directional spectra. J. Geophys. Res. 2003, 108, 1–17. [Google Scholar]
- De Vos, L.; Frigaard, P.; Rouck, J.D. Wave run-up on cylindrical and cone shaped foundations for offshore wind turbines. Coast. Eng. 2007, 54, 17–29. [Google Scholar] [CrossRef]
- Chella, M.A.; Torum, A.; Myrhaug, D. An overview of wave impact forces on offshore wind turbine substructures. Energy Proc. 2012, 20, 217–226. [Google Scholar] [CrossRef]
- Cao, D.; Yat-Man, E.L.; Jian, W.; Huang, Z. An experimental study of wave runup: cylinder fixed in waves versus cylinder surging in still water. In Proceedings of the 3rd International Conference on Coastal and Ocean Engineering, Tokyo, Japan, 15 February 2016. [Google Scholar]
- Fischer, T.; De Vries, W.; Schmidt, B. Upwind Design Basis (WP4: Offshore Foundations and Support Structures). In Upwind; University Stuttgart: Stuttgart, Germany, 2010. [Google Scholar]
- Brook-Hart, W.; Jakson, P.A.; Meyts, M.; Gifford, P. Competitive Concrete Foundations for Offshore Wind Turbines; International Foundation: Fairfield, NJ, USA, 2010. [Google Scholar]
- Park, M.S.; Jeong, Y.J.; You, Y.J.; Lee, D.H. Numerical analysis of a gravity substructure with suction bucket foundation for 5MW offshore wind turbine. Int. J. Emerg. Technol. Adv. Eng. 2015, 5, 59–65. [Google Scholar]
- Park, M.S.; Jeong, Y.J.; You, Y.J. Safety evaluation of a hybrid substructure for offshore wind turbine. Adv. Mater. Sci. Eng. 2016, 1–20. [Google Scholar] [CrossRef]
- NEDO. NEDO Offshore Wind Energy Progress; NEDO: Tokyo, Japan, 2013. [Google Scholar]
- Tsai, C.P.; Chen, H.B.; Huang, M.J. Wave shoaling on steep slopes and breaking criteria. In Proceedings of the 12th International Offshore and Polar Engeneering Conference, Kitakyushu, Japan, 26–31 May 2002. ISOPE-I-02-353. [Google Scholar]
- Schloer, S.; Bredmose, H.; Bingham, H.B. Irregular wave forces on monopile foundation: Effect of full nonlinearity and bed Slope. In Proceedings of the 30th International Conference on Ocean, Offshore and Arctic Engineering, Rotterdam, The Netherlands, 19–24 June 2011. OMAE2011-49709. [Google Scholar]
- Jeong, Y.J.; Park, M.S.; You, Y.J. Experimental study on wave forces to offshore support structures. Struct. Eng. Mech. 2016, 60, 193–209. [Google Scholar] [CrossRef]
- Marino, E.; Borri, C.; Peil, U. A fully nonlinear wave model to account for breaking wave impact loads on offshore wind turbines. J. Wind Eng. Ind. Aerodyn. 2011, 99, 483–490. [Google Scholar] [CrossRef]
- Aashamar, M.Z. Wave Slamming Forces on Truss Support Structures for Wind Turbines. Master’s Thesis, Norwegian University of Science and Technology, Trondheim, Norway, 2012. [Google Scholar]
- Ros, X. Impact Forces on a Vertical Pile from Plunging Breaking Waves. Master’s Thesis, Norwegian University of Science and Technology, Trondheim, Norway, 2011. [Google Scholar]
- Kudeih, M.; Cornett, A.; Nistor, I. An experimental study of wave and current-induced forces on a compact linear array of vertical cylinders in shallow water. Coast. Eng. 2010, 32, 1–10. [Google Scholar] [CrossRef]
- Henry, P.Y.; Myrhaug, D. Wave-induced drag force on vegetation under shoaling random waves. Coast. Eng. 2013, 78, 13–20. [Google Scholar] [CrossRef]
- DNV. Offshore Standard DNV-OS-J101: Design of Offshore Wind Turbine Structures; Det Norske Veritas AS: Høvik, Norway, 2013. [Google Scholar]
- Goda, Y. Random Seas and Design of Maritime Structures, 3rd ed.; World Scientific: Singapore, 2010. [Google Scholar]
- Jeong, Y.J.; Park, M.S. Experimental study on wave force variation to sea levels of large circular marine structures. In Proceedings of the 12th International Conference on Structural Safety & Reliability, Vienna, Austria, 6–10 August 2017; pp. 907–915. [Google Scholar]
- Jeong, Y.J.; Park, M.S.; Kim, J. Comparing wave force and wave-induced overturning moment of three offshore support structures. In Proceedings of the ASME 2017 36th International Conference on Ocean, Offshore and Arctic Engineering, Trondheim, Norway, 25–30 June 2017. OMAE2017-61073. [Google Scholar]
- Peng, Z. Wave slamming impact on offshore wind turbine foundations. Coast. Eng. Conf. 2014, 34, 1–8. [Google Scholar] [CrossRef]
- Park, M.S.; Jeong, Y.J.; You, Y.J.; Lee, D.H.; Kim, B.C. Numerical Analysis of a Hybrid Substructure for Offshore Wind Turbines. Ocean Syst. Eng. 2014, 4, 169–183. [Google Scholar] [CrossRef]


| Type | Dimensions (mm) | Weight (kg) | Wave Projected Area (cm2) | ||
|---|---|---|---|---|---|
| HSWL | MSL | LSWL | |||
| Monopile | 240 (D1) × 240 (D2) × 1500 (H) | 203.00 | 2328.0 | 1920.0 | 1512.0 |
| GBS | 260 (D1) × 740 (D2) × 1500 (H) | 203.00 | 4442.0 | 4000.0 | 3471.3 |
| Hybrid (0°, 45°) | 272 (D1) × 740 (D2) × 1500 (H) D1 = (4 · Ø48 + Ø80) | 203.00 | 3924.8 | 3462.4 | 3000.0 |
| Wave | No. | HSWL | MSL | LSWL | Variables | ||||
|---|---|---|---|---|---|---|---|---|---|
| HW (m) | TW (s) | HW (m) | TW (s) | HW (m) | TW (s) | TW | HW | ||
| Regular | R-#1 | 0.137 | 1.500 | 0.137 | 1.500 | 0.137 | 1.500 | ● | |
| (3.435) | (7.5) | (3.435) | (7.5) | (3.435) | (7.5) | ||||
| R-#2 | 0.137 | 1.900 | 0.137 | 1.900 | 0.137 | 1.900 | ● | ||
| (3.435) | (9.5) | (3.435) | (9.5) | (3.435) | (9.5) | ||||
| R-#3 | 0.137 | 2.740 | 0.137 | 2.740 | 0.137 | 2.740 | ● | ● | |
| (3.435) | (13.7) | (3.435) | (13.7) | (3.435) | (13.7) | ||||
| R-#4 | 0.275 | 2.740 | - | - | 0.275 | 2.740 | ● | ||
| (6.870) | (13.7) | (6.870) | (13.7) | ||||||
| R-#5 | 0.511 | 2.740 | 0.511 | 2.740 | 0.380 | 2.740 | ● | ||
| (12.78) | (13.7) | (12.78) | (13.7) | (9.500) | (13.7) | ||||
| Irregular | IR-#1 | 0.137 | 1.500 | 0.137 | 1.500 | 0.137 | 1.500 | ● | |
| (3.435) | (7.5) | (3.435) | (7.5) | (3.435) | (7.5) | ||||
| IR-#2 | 0.137 | 1.900 | 0.137 | 1.900 | 0.137 | 1.900 | ● | ||
| (3.435) | (9.5) | (3.435) | (9.5) | (3.435) | (9.5) | ||||
| IR-#3 | 0.137 | 2.747 | 0.137 | 2.300 | 0.137 | 2.747 | ● | ||
| (3.435) | (13.7) | (3.435) | (11.5) | (3.435) | (13.7) | ||||
| Sea Levels | Wave | Pw | Monopile | GBS | Hybrid 0° | Hybrid 45° |
|---|---|---|---|---|---|---|
| sec | kN (Ratio) | kN (Ratio) | kN (Ratio) | kN (Ratio) | ||
| HSWL | R-#1 | 7.5 | 973 (1.00) | 2608 (1.00) | 1140 (1.00) | 1095 (1.00) |
| R-#2 | 9.5 | 1024 (1.05) | 2778 (1.07) | 1141 (1.00) | 1171 (1.07) | |
| R-#3 | 13.7 | 783 (0.80) | 2377 (0.91) | 1110 (0.97) | 1047 (0.96) | |
| MSL | R-#1 | 7.5 | 1095 (1.00) | 4151 (1.00) | 1730 (1.00) | 1695 (1.00) |
| R-#2 | 9.5 | 823 (0.75) | 3793 (0.91) | 1611 (0.93) | 1569 (0.93) | |
| R-#3 | 13.7 | 627 (0.57) | 2748 (0.66) | 1198 (0.69) | 1191 (0.70) | |
| LSWL | R-#1 | 7.5 | 896 (1.00) | 3738 (1.00) | 1820 (1.00) | 1743 (1.00) |
| R-#2 | 9.5 | 717 (0.80) | 2905 (0.78) | 1562 (0.86) | 1549 (0.89) | |
| R-#3 | 13.7 | 619 (0.69) | 2906 (0.78) | 1287 (0.71) | 1282 (0.74) |
| Sea Levels | Wave | Hw | Monopile | GBS | Hybrid 0° | Hybrid 45° |
|---|---|---|---|---|---|---|
| m (Ratio) | kN (Ratio) | kN (Ratio) | kN (Ratio) | kN (Ratio) | ||
| HSWL | R-#3 | 3435 (1.00) | 783 (1.00) | 2377 (1.00) | 1110 (1.00) | 1047 (1.00) |
| R-#4 | 6870 (2.00) | 1451 (1.85) | 4877 (2.05) | 2238 (2.02) | 2180 (2.08) | |
| R-#5 | 12,780 (3.72) | 2610 (3.33) | 7774 (3.27) | 3752 (3.38) | 3633 (3.47) | |
| MSL | R-#3 | 3435 (1.00) | 627 (1.00) | 2748 (1.00) | 1198 (1.00) | 1191 (1.00) |
| R-#4 | 6870 (2.00) | - | - | - | - | |
| R-#5 | 12,780 (3.72) | 2375 (3.79) | 8541 (3.11) | 4070 (3.40) | 4087 (3.43) | |
| LSWL | R-#3 | 3435 (1.00) | 619 (1.00) | 2906 (1.00) | 1287 (1.00) | 1282 (1.00) |
| R-#4 | 6870 (2.00) | 1332 (2.15) | 6435 (2.21) | 2631 (2.04) | 2618 (2.04) | |
| R-#5 | 9500 (2.77) | 2391 (3.86) | 9412 (3.24) | 4640 (3.61) | 4537 (3.54) |
| Water Depth | ⇒ Waves Higher and Steeper | ||
|---|---|---|---|
| Shoaling | Breaking | ||
| Deep water | - | ||
| Transitional zone | - | ||
| Shallow water | - | ||
| Sea Levels | Wave | Pw | Monopile | GBS | Hybrid 0° | Hybrid 45° |
|---|---|---|---|---|---|---|
| Sec | kN (Ratio) | kN (Ratio) | kN (Ratio) | kN (Ratio) | ||
| HSWL | IR-#1 | 7.5 | 1792 (1.00) | 5883 (1.00) | 2186 (1.00) | 1912 (1.00) |
| IR-#2 | 9.5 | 1437 (0.80) | 4570 (0.78) | 1726 (0.79) | 1694 (0.89) | |
| IR-#3 | 13.7 | 1332 (0.74) | 4664 (0.79) | 1916 (0.88) | 1918 (1.00) | |
| MSL | IR-#1 | 7.5 | 1544 (1.00) | 6014 (1.00) | 2101 (1.00) | 2027 (1.00) |
| IR-#2 | 9.5 | 1444 (0.94) | 4251 (0.71) | 2031 (0.97) | 2132 (1.05) | |
| IR-#3 | 11.5 | 953 (0.62) | 4095 (0.68) | 1631 (0.78) | 1628 (0.80) | |
| LSWL | IR-#1 | 7.5 | 1459 (1.00) | 7248 (1.00) | 3185 (1.00) | 3127 (1.00) |
| IR-#2 | 9.5 | 1351 (0.93) | 6533 (0.90) | 2764 (0.87) | 2781 (0.89) | |
| IR-#3 | 13.7 | 1662 (1.14) | 6965 (0.96) | 3214 (1.01) | 3248 (1.04) |
© 2019 by the authors. Licensee MDPI, Basel, Switzerland. This article is an open access article distributed under the terms and conditions of the Creative Commons Attribution (CC BY) license (http://creativecommons.org/licenses/by/4.0/).
Share and Cite
Jeong, Y.-J.; Park, M.-S.; Kim, J.; Song, S.-H. Wave Force Characteristics of Large-Sized Offshore Wind Support Structures to Sea Levels and Wave Conditions. Appl. Sci. 2019, 9, 1855. https://doi.org/10.3390/app9091855
Jeong Y-J, Park M-S, Kim J, Song S-H. Wave Force Characteristics of Large-Sized Offshore Wind Support Structures to Sea Levels and Wave Conditions. Applied Sciences. 2019; 9(9):1855. https://doi.org/10.3390/app9091855
Chicago/Turabian StyleJeong, Youn-Ju, Min-Su Park, Jeongsoo Kim, and Sung-Hoon Song. 2019. "Wave Force Characteristics of Large-Sized Offshore Wind Support Structures to Sea Levels and Wave Conditions" Applied Sciences 9, no. 9: 1855. https://doi.org/10.3390/app9091855
APA StyleJeong, Y.-J., Park, M.-S., Kim, J., & Song, S.-H. (2019). Wave Force Characteristics of Large-Sized Offshore Wind Support Structures to Sea Levels and Wave Conditions. Applied Sciences, 9(9), 1855. https://doi.org/10.3390/app9091855