Article

Damage Detection in Beam Bridges Using Quasi-static Displacement Influence Lines

School of Transportation Science and Engineering, Harbin Institute of Technology, Harbin 150090, China
*
Author to whom correspondence should be addressed.
Appl. Sci. 2019, 9(9), 1805; https://doi.org/10.3390/app9091805
Submission received: 26 March 2019 / Revised: 27 April 2019 / Accepted: 28 April 2019 / Published: 30 April 2019
(This article belongs to the Special Issue Structural Damage Detection and Health Monitoring)

Abstract

:
Quasi-static strain influence lines (ILs) based on the Brillouin optical time domain analysis (BOTDA) technique have been proposed to effectively locate damage in beam bridges. Using measurement points with a high spatial resolution, the BOTDA technique supplies enough strain ILs to help detect damage in bridges. Unlike quasi-static strain ILs based on the BOTDA technique, quasi-static displacement ILs are relatively easy to implement in actual bridges; furthermore, only a few quasi-static displacement ILs are necessary for actual bridges. On this basis, an improved method is proposed to determine the existence of damage in beam bridges by using only a few quasi-static displacement ILs. First, the Hankel matrix of the damage feature, established based on the number of strain ILs, is reconstructed to generate the damage feature using only a few quasi-static displacement ILs. Second, the method used to obtain the metric for evaluating the damage feature is improved, thereby greatly increasing the efficiency of damage detection using quasi-static ILs. Finally, the effectiveness of the proposed method is demonstrated through both numerical analysis and experimentally measured data obtained during a quasi-static load test of a model bridge.

1. Introduction

In contrast to dynamic methods [1,2,3], static methods [4,5] exhibit obvious advantages in the detection of damage in civil structures: (1) static methods easily ensure a high accuracy of the measured static deformation of structures; (2) they effectively avoid the difficulties associated with identifying damage in structures; and (3) they do not need to consider various effects, such as the mass of the structure. Therefore, static methods have been increasingly employed to detect damage in structures using various static features, for example, the static displacement [6,7,8], static strain [9] and static flexibility of structures [10,11]. Compared with the static deformation of other civil structures, the static deformation of bridges is relatively easy to measure during the operational period. The static load test is commonly implemented to measure the static deformation of operational bridges to, for example, ascertain the displacement and strain along a cross-section of the superstructure. Similar to dynamic methods, static methods boast increasingly accurate damage detection results with increasingly large numbers of sensors. The static influence line (IL) technique can be used to effectively overcome limitations on the number of sensors because, in theory, only one sensor is needed to obtain the complete IL. Taking advantage of the above property, some researchers have focused on identifying damage in structures using ILs [12,13,14] and have identified the location and extent of structural damage using displacement IL curvatures [14,15], the stress IL curvatures [16], the second derivative of displacement IL [17,18] and so forth. Therefore, the IL technique has been deemed a promising damage index [19,20].
However, the theoretical static ILs cannot be obtained for operational bridges because only quasi-static moving loads, that is, loads at low uniform velocities, are implemented under actual loading conditions. With quasi-static loading, the displacement or strain IL of the bridge superstructure is approximated to a static IL and the abovementioned IL is referred to as a quasi-static IL. A two-stage damage detection method utilizing quasi-static displacement ILs was proposed to rapidly locate and quantify damage and this method does not necessitate time-consuming finite element model updating [21]. Furthermore, an intuitive damage index based on quasi-static ILs was presented to locate damage in a bridge and the effects of local damage on different components of the displacement IL were investigated in detail [22]. A damage locating method using stress ILs under a quasi-static moving load was proposed and applied to an actual suspension bridge [16]. In addition, both the quasi-static displacement IL and the strain IL techniques were utilized to locate the damage in a bridge without the baseline finite element model; accordingly, the feasibility, effectiveness and limitations of this approach were investigated both numerically and experimentally [23].
Similar to other static-based methods, the accuracy and robustness of quasi-static IL-based damage detection techniques depend mainly on the consistency of the loading conditions before and after bridge damage occurs [24], that is, the quasi-static loading conditions before and after damage should be identical. However, the above loading condition is difficult to implement during actual load testing of a bridge. To address this issue, a method for identifying damage using the strain ILs based on the Brillouin optical time domain analysis (BOTDA) technique is proposed by the authors of this study [25]. Quasi-static strain ILs are applied to generate a damage location index that is independent of the difference between the weight of the loading vehicle before and after damage. Additionally, if the sensing optical fiber is placed along the longitudinal direction of the bridge superstructure under quasi-static loading conditions, quasi-static strain ILs are obtained through the use of measurement points with a high spatial resolution and the long-distance measurement range of the BOTDA technique [26,27]. Because the stain reflects the local performance of structures, the use of a sufficient number of quasi-static strain ILs can accurately locate damage in bridges.
Unlike quasi-static strain ILs based on the BOTDA technique, quasi-static displacement ILs can be feasibly obtained for the bridge superstructure of actual bridges. Furthermore, only a few quasi-static displacement ILs need to be implemented for the load testing of actual bridges. However, because the displacement reflects the overall performance of a structure, it is not appropriate to attempt to locate bridge damage using only a few measured points. The displacement information helps determine if damage exists. In consideration of the above issues, on the basis of the previous method [25], an improved method is proposed to detect the damage of beam bridges using only a few quasi-static displacement ILs. While the reconstruction of the Hankel matrix of the damage feature is presented to establish the damage feature using a few quasi-static displacement ILs, the method used to obtain the metric for evaluating the damage feature is improved so that the efficiency of damage detection using quasi-static ILs is greatly increased. The proposed method is independent of the difference in the loading weight before and after damage and this performance is verified using numerical and experimental examples in this study. In addition, combining with structural health monitoring technique [28], the proposed method is applied to detect the damage of bridge under the load-moving excitation [29,30].
The remainder of this paper is organized as follows. The method based on quasi-static displacement ILs is introduced in detail in the next section. The performance of the proposed method is discussed numerically in Section 3. Then, the effectiveness of the proposed method is identified in Section 4 using the measured data of a model bridge. Finally, conclusions are drawn in Section 5.

2. Damage Detection Using the Quasi-static Displacement Influence Lines of Bridges

In this section, we first discuss the method of generating the quasi-static displacement ILs of actual bridges. Then, we discuss some key issues, such as establishing the damage feature, defining the metric used to evaluate the damage feature and determining the threshold of damage detection.

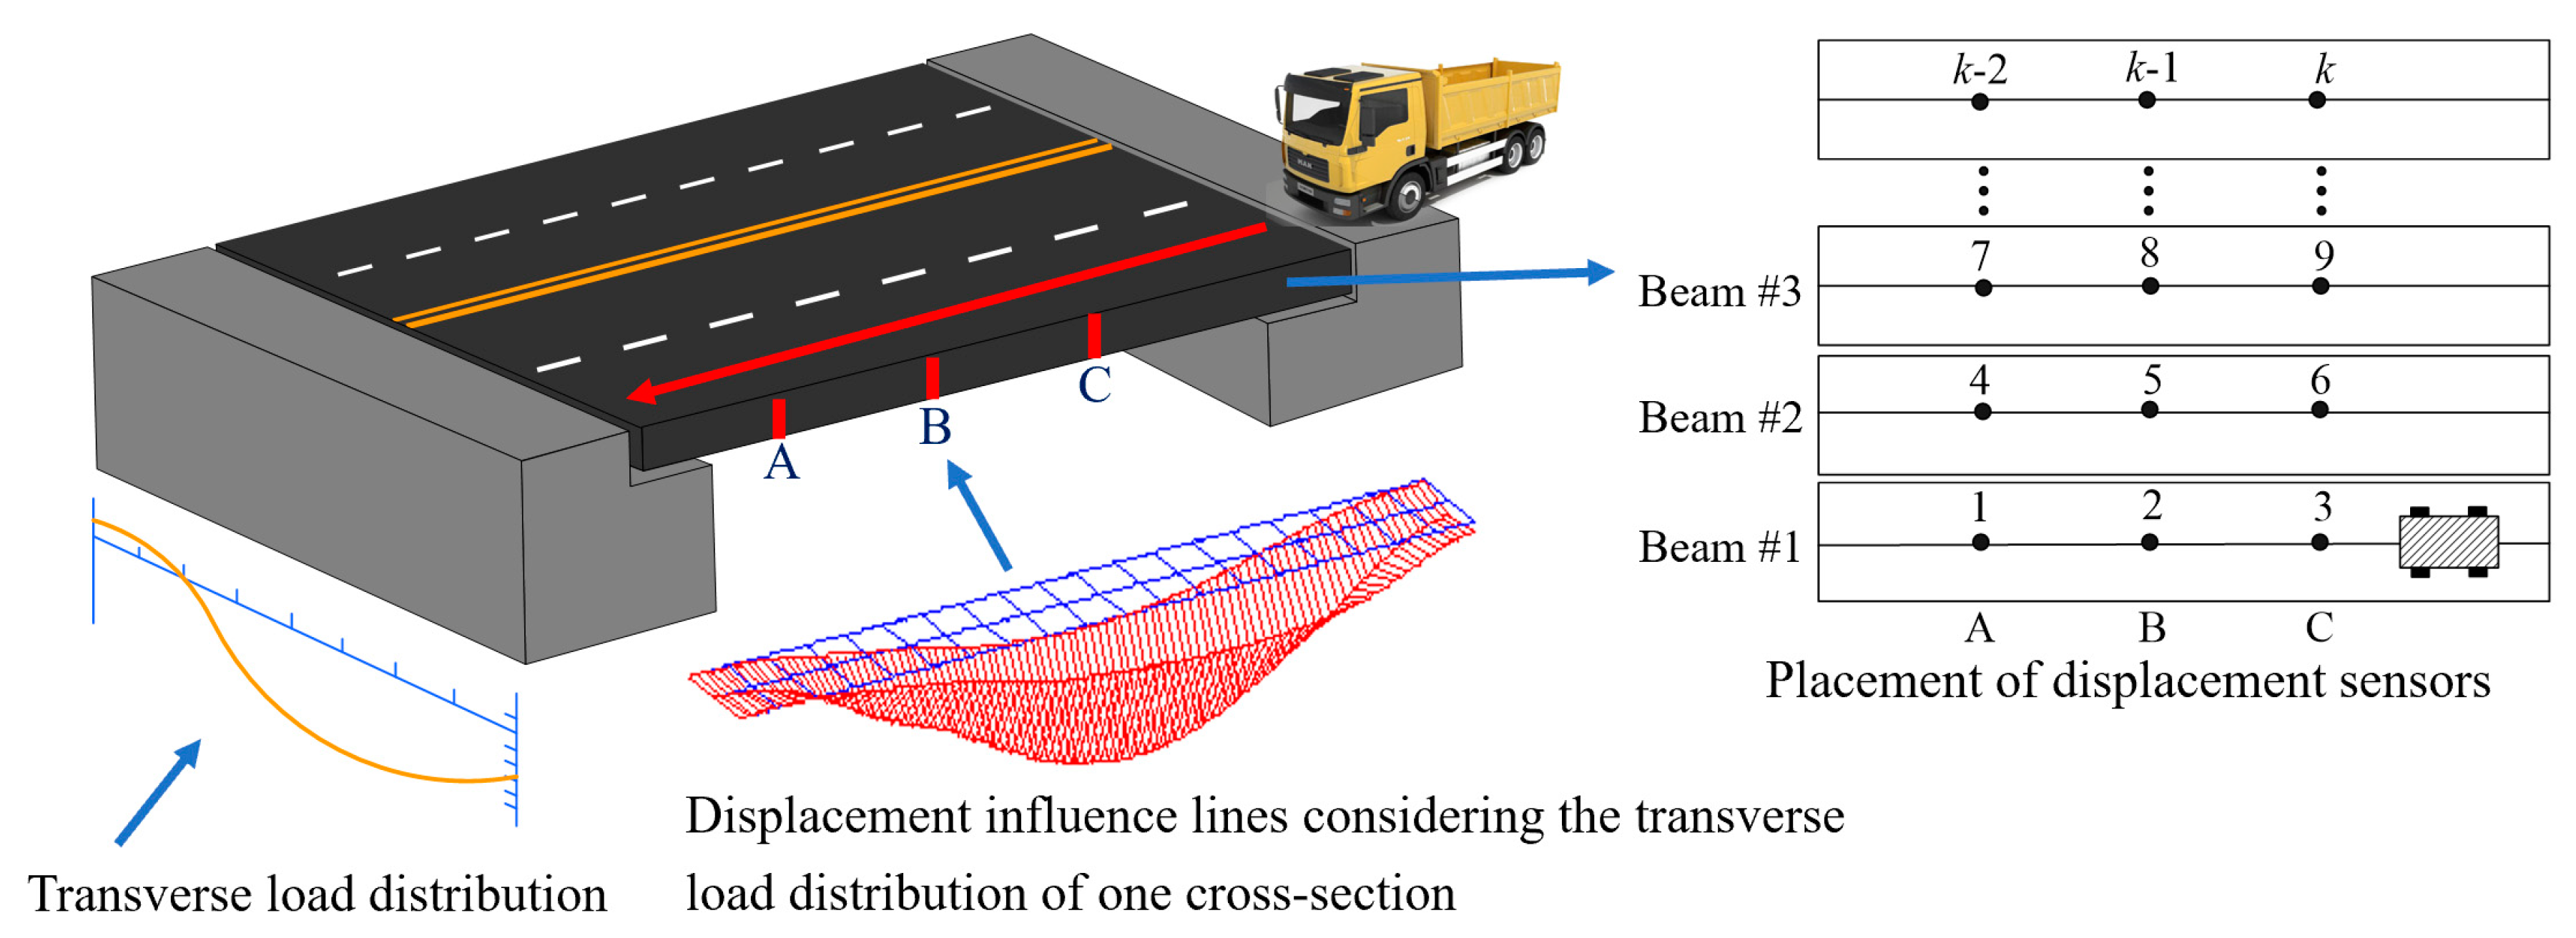
2.1. Generation of the Quasi-static Displacement Influence Lines of Actual Bridges

The principles of quasi-static load testing are described as follows. As shown in Figure 1, a quasi-static load is represented by a loading vehicle that drives over the bridge along one lane at a constant slow velocity; this procedure requires that the bridge be cordoned off from all traffic. In theory, the excitation frequency band of the loading vehicle should be lower than the first natural frequency of the tested bridge; that is, the bridge in question should be as close to static as possible. To achieve this type of excitation load, the loading vehicle is usually forced to drive over the bridge at a constant slow velocity. Because the natural frequency varies by bridge, the velocity of the loading vehicle may change according to the bridge. Of course, this loading procedure should be repeated several times along the transverse direction of the bridge or along one lane to obtain reliable test data while keeping the vehicle velocity constant for each case. For medium- and small-span bridges, the above procedure can be completed quickly than traditional load experiments on bridges; thus, this technique constitutes an effective way to avoid a long-term interruption of the traffic flow.
Suppose that the bridge is simply supported and composed of several beams in the transverse direction, as shown in Figure 1. Three sensors are placed on cross-section A, cross-section B and cross-section C on the side beam beneath the bridge (Beam #1) to measure the vertical displacement. Although the loading vehicle has an additional axis along the longitudinal direction of the vehicle, the vehicle can be considered equivalent to a concentrated vertical load by using the translation theorem of forces theoretically. Therefore, under a quasi-static loading situation, the displacement time histories of the three cross-sections along which the abovementioned sensors are placed are similar to three static displacement ILs, that is, the quasi-static displacement ILs defined in this study. For an actual bridge, considering the transverse distribution of the load, there should be more than one displacement IL for each cross-section of the bridge superstructure. For example, cross-section B is composed of several beams, as shown in Figure 1 and thus, all ILs form the influence surface of cross-section B under quasi-static loading.
Generally, the loading vehicle should be sufficiently heavy to ensure that the measured displacement induced by the loading vehicle is sensitive to the potential damage of the bridge. However, for actual bridges, especially existing bridges characterized by bad conditions, loading vehicles that are excessively heavy may damage the bridge. Therefore, the weight of the loading vehicle is determined on a case-by-case basis in consideration of the real technical conditions of the bridge. It is recommended that, for an actual bridge [25], the reference weight of the loading vehicle should first be equal to the weight of one loading vehicle determined by using the design of a transitional load test; then, this reference weight can be adjusted to the final load by evaluating the real structural conditions of the bridge.
Based on the above discussion, a method is proposed and described in detail in the next section to show how to detect bridge damage using quasi-static displacement ILs. In this study, we focus on a method of detecting damage in medium- and small-span beam bridges using measured quasi-static displacement ILs.

2.2. Damage Detection Using the Null Space Method Based on Quasi-static Displacement Influence Lines

Unlike quasi-static strain ILs based on the BOTDA technique, only a few quasi-static displacement ILs are usually obtained for actual bridges. Based on the method presented in Reference [25], an improved method is proposed to determine if bridges are damaged by using a low number of quasi-static displacement ILs. In this section, the main damage detection process based on quasi-static displacement ILs consists of three parts: the determination of the damage feature, the generation of a metric for evaluating the damage feature and the discussion of the quasi-static load conditions before and after damage, each of which is described in detail as follows.

2.2.1. Hankel Matrix of the Damage Feature Established with Quasi-static Displacement ILs

Unlike the Hankel matrix described in Reference [25], the Hankel matrix of the damage feature is reconstructed; thus, it is suitable for establishing the damage feature using a few quasi-static displacement ILs.
We obtain the displacement IL of one quasi-static load test; then, the corresponding matrix Y is defined by the following equation:
Y = [ X 11 X 12 X 1 n X 21 X 22 X 2 n X m 1 X m 2 X m n ] m × n
where Y is the set of all measured displacement ILs from one quasi-static load test; n is the number of sensors placed within the cross-sections of the bridge superstructure; m represents the total number of sampling points along each displacement IL; and X m n is an element of Y , where each column of the matrix Y represents only the quasi-static displacement IL of a certain sensor, that is, ω j R m × 1 , j ( 1 , 2 , , n )
ω j = { X 1 j , X 2 j , , X a j , , X m j } T m × 1
where X a j is the a th ( a ( 1 , 2 , , m ) ) element of the denoised quasi-static displacement IL of the jth sensor.
According to Equation (1), it is easy to obtain the correlation coefficient β between two quasi-static displacement ILs through a certain cross-section of the bridge superstructure, that is,
β = a = 1 m ( ( X a j μ j ) ( X a k μ k ) ) / ( a = 1 m ( X a j μ j ) 2 · a = 1 m ( X a k μ k ) 2 ) 1 2 , j k
where j and k are different measured points of displacement, that is, k j ,   k ( 1 , 2 , , n ) . μ j is the mean of the quasi-static displacement IL at the jth measured point of displacement and is calculated by the following equation.
μ j = 1 m a = 1 m X a j
Using Equation (3), the vector β is defined by the following equation:
β = s o r t ( { β 1 , β 2 , , β i , , β s } )
where β is the ordered set of β i ( i = 1 , 2 , , s ) , which is defined in Equation (3); s o r t ( · ) is the operator used to order the elements from small to large; and s is the total number of correlation coefficients of two vectors of quasi-static displacement ILs.
The correlation coefficient β i defined in Equations (3) and (4) is completely different from the subspace between the quasi-static strain ILs at two different measured points, as defined in Reference [25]. Herein, the correlation coefficient represents the correlation between two quasi-static displacement ILs at different measured points under the same load test, while the subspace defined in Reference [25] is used to describe the change in the relationship between two quasi-static strain ILs before and after bridge damage occurs.
In this study, vector β is defined as the damage feature because this vector includes all information regarding the displacement ILs of the bridge superstructure, as defined in Equation (5). The success of damage detection depends mainly on the change in feature β before and after damage. Thus, it is advisable to arrange all vectors of damage feature β according to certain regulations to maintain consistency in damage feature β results among different load tests. Considering the structural symmetry of beam bridges, if we arrange all damage features β in order of location, the same effects at each pair of symmetrical locations can be ignored. Therefore, the numerical order is adopted in this study, as shown in Equation (5).
During subsequent damage detection of bridges, damage feature β is considered in the form of a Hankel matrix, which is defined as follows:
H = [ β 1 β 2 β q β 2 β 3 β q + 1 β p β p + 1 β p + q 1 ]
where H is the Hankel matrix of damage feature β and p and q are the number of matrix rows and the number of matrix columns, respectively, that satisfy the relationship [25] s = p + q 1 , ( p < q ) . Based on the feature design of the Hankel matrix, each column of matrix H is highly correlated. Each column of the Hankel matrix is called a delay vector φ b , which is described according to the following equation:
φ b = { β b , β b + 1 , , β b + p + 1 } p × 1 T
For a certain Hankel matrix, if p (the length of delay vector φ b ) decreases in size, q (the number of delay vectors φ b ) increases in size, thereby reducing the degree of correlation between the two delay vectors.
If p is equal to one, then the Hankel matrix H changes into the vector β . In this situation, as only one β i is varied, only 1 / s delay vectors φ b in the vector β will change and thus, it is difficult to detect the variation in the vector β . With the help of the Hankel matrix, if only one β i is varied, p / ( s p + 1 ) delay vectors φ b of matrix H will change. In particular, when p is close to s / 2 , almost all delay vectors in the Hankel matrix will change, which makes it easier to identify the variation in β . Therefore, it is advisable to treat the damage feature β as a Hankel matrix.
The method used to construct the Hankel matrix in Reference [25] cannot be directly adopted for the quasi-static displacement ILs used in this study. If we take the form of the Hankel matrix defined in Reference [25], due to the limited number of displacement ILs, the size of the Hankel matrix will be so small that the damage feature will not be sensitive to the damage in the bridge. To address this issue, we propose to reconstruct the Hankel matrix of the damage feature, as described in Equation (6). With this new form of the Hankel matrix, a reasonable Hankel matrix of the damage feature is established even though only a few quasi-static displacement ILs are obtained for one load test of the bridge.

2.2.2. Metric for Evaluating the Damage Feature

With the generated Hankel matrix of the damage feature, a new metric for evaluating the damage feature is proposed in this section. Under the reference state (initial conditions) of a bridge, we generate the Hankel matrix H r (described in Equation (6)) by taking the displacement ILs of one quasi-static load test. The following equation is obtained:
H r N r = 0
where N r R q × 1 is one arbitrary column of the right null space matrix of H r .
Under healthy bridge conditions, after repeating the load test K times, it is easy to generate the Hankel matrix H c by using one arbitrary test, for example, the cth test. Using the reference vector N r defined in Equation (8), the residual vector is obtained by the following equation:
α c = H c N r
where α c R p × 1 , c ( 1 , 2 , , K ) is the residual vector, which is approximately equivalent to the Gaussian distribution.
For the practical application of the proposed method, a quasi-static load test will be carried out regularly (e.g., every year) at the field site. In this way, an increasing number of reference samples will be accumulated under a healthy state; consequently, the novel detection technique [31,32,33,34], which is described below, can be used to detect the damage of an actual bridge. The sample mean of the residual of the damage feature for a bridge in a healthy state is denoted by the following equation:
α ¯ = 1 K c = 1 K α c
Accordingly, the sample covariance is defined by the following equation:
θ = 1 K 1 c = 1 K ( α c α ¯ ) ( α c α ¯ ) T
Given the sample mean and covariance for a bridge in a healthy state, a new metric of the damage feature is obtained using K samples obtained under the healthy state.
γ c = ( α c α ¯ ) θ 1 ( α c α ¯ ) T
With the above equation, the K metric values are obtained for the healthy state, after which a threshold λ needs to be determined on the basis of an acceptable level of false positives or type I errors (e.g., 5%).
λ = [ γ 1 , γ 2 , , γ c , , γ K ] 0.95
Here, [ · ] 0.95 represents the operator within the 95% confidence interval.
To investigate the state of damage, the damage metric is calculated with the same procedure, that is,
γ d = ( α d α ¯ ) θ 1 ( α d α ¯ ) T
where α d ( d ( 1 , 2 , ) ) is the residual of the damage feature defined in Equation (9) using the data of the dth load test to investigate the damage and α ¯ and θ are the sample mean and covariance, respectively, for a bridge in a healthy state. In this study, we test whether the residual of the damage feature γ d satisfies the following conditions:
{ Z d = 1 under γ d λ Z d = 0 under γ d < λ
where Z d takes a value of either one or zero to represent the acceptance or rejection of the null hypothesis, that is, indicating either the presence or the absence of damage.
As shown in Equations (9) and (13), each metric γ c is calculated by using all the measured quasi-static displacement ILs from one load test. For the method described in Reference [25], the same calculation has to be repeated n times (i.e., the total number of measured points of one quasi-static strain IL) to obtain this metric. Therefore, with the proposed method, the efficiency of damage detection using quasi-static ILs is improved dramatically.
Note that the environmental conditions during each quasi-static load test should be controlled to reduce the effects of environmental factors as much as possible. This condition is relatively feasible because the time period of each quasi-static load test is not excessively long, for example, a half-hour for each test according to our experience.

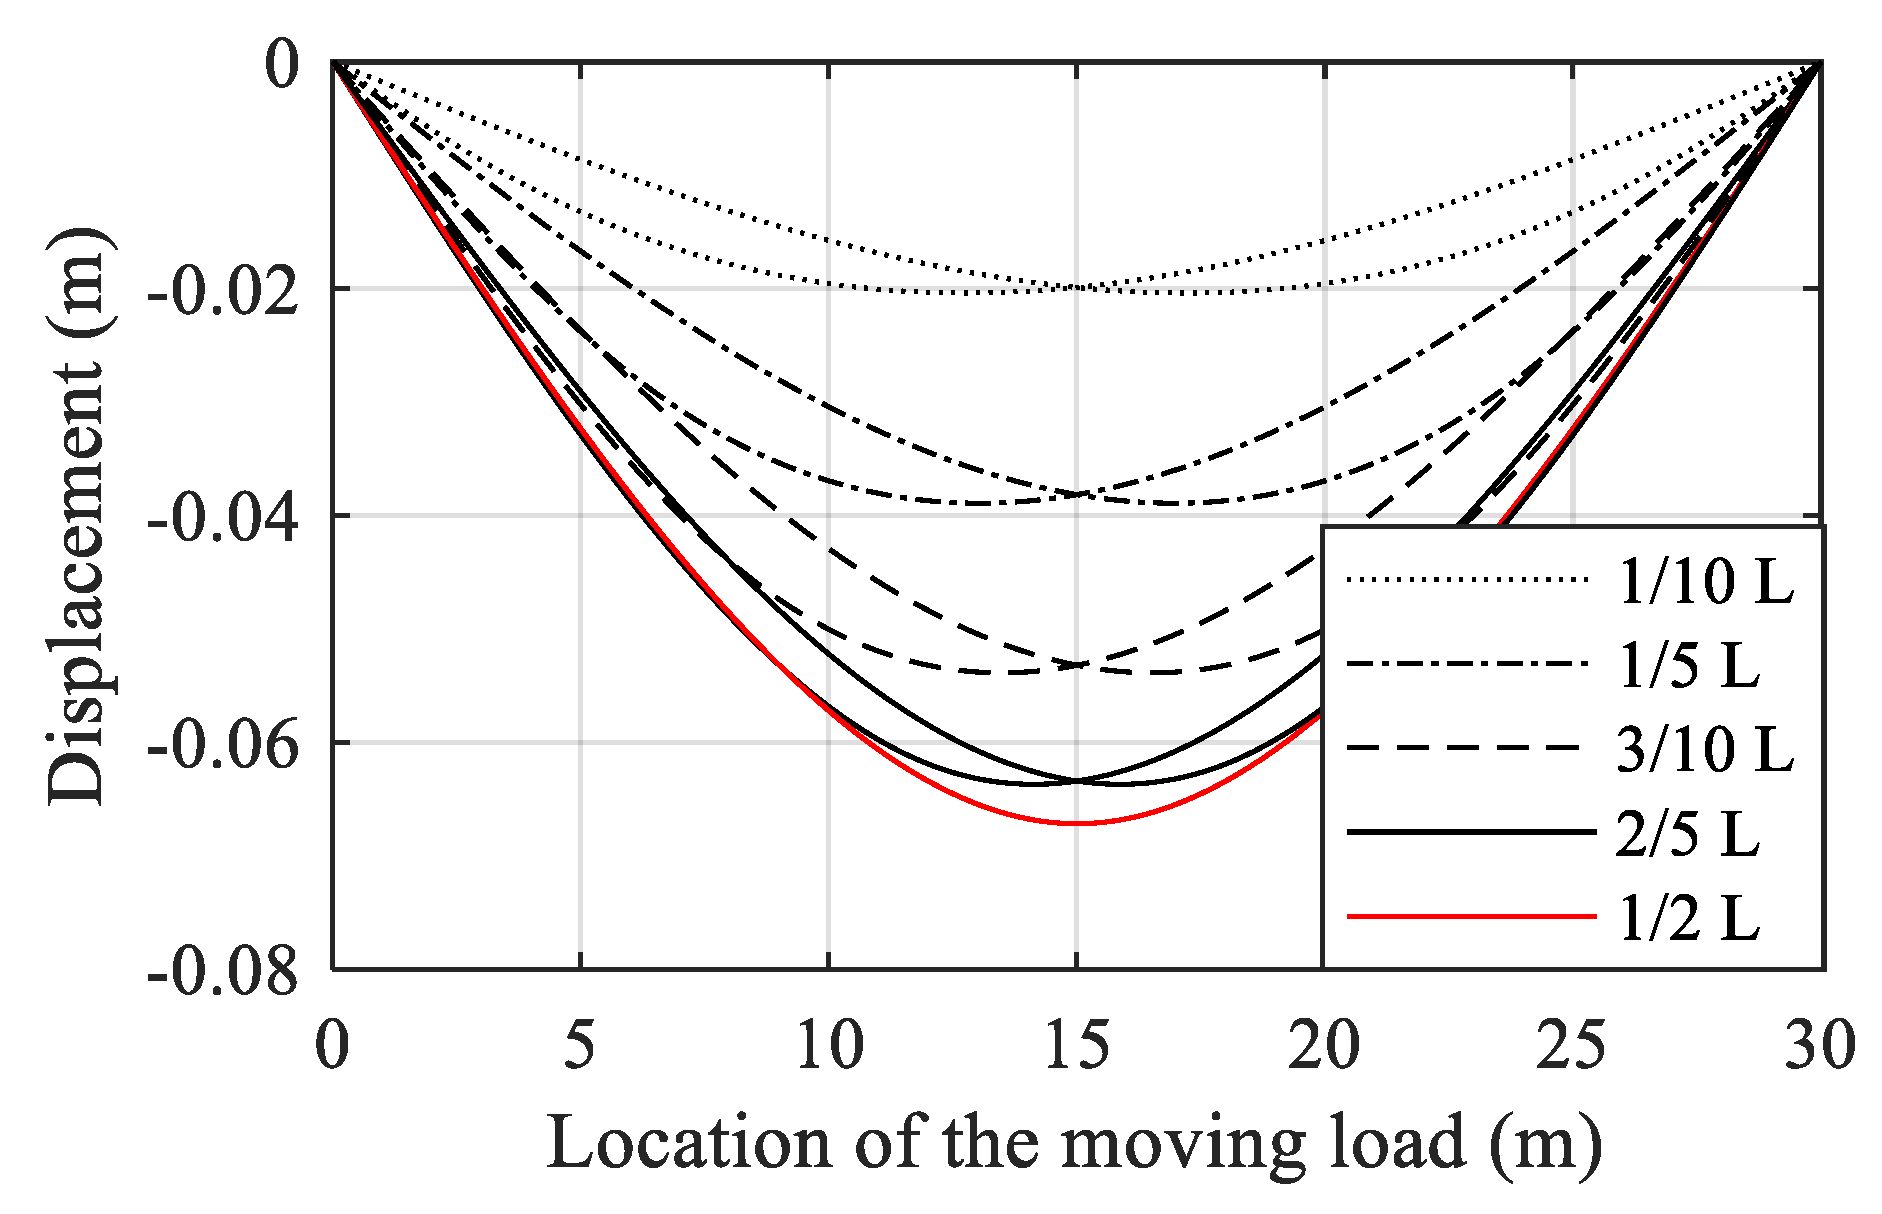
2.2.3. Discussion of the Quasi-static Loading Conditions Before and After Damage

As mentioned in previous research [12,13,14], applying the same loading conditions before and after damage is fundamental to successfully detecting the state of damage of a bridge by using the difference in the displacement ILs between the healthy and damaged states. However, during the practical implementation of a quasi-static load test on a bridge, it is impossible to ensure that the weight of the loading vehicle remains constant for every test. Therefore, the effect of an inconsistent loading vehicle weight during quasi-static load tests before and after bridge damage is worth discussing.
The displacement IL of a bridge superstructure describes the vertical deformation of a certain cross-section due to the unit load acting at different positions along the longitudinal direction of the bridge. The unit load is replaced by a certain load for practical applications. The vertical displacement of the bridge superstructure directly reflects the stiffness performance of the bridge and thus, the displacement ILs are deemed effective features with respect to the damage of the bridge superstructure. A simply supported beam bridge is assumed to be acted upon by a quasi-static moving load F R characterized by a longitudinal position x t and the displacement of the cross-section A of the main beam ω A ( x t ) is calculated by the following equation with the virtual work principle:
ω A ( x t ) = F R 0 l 1 E I ( x ) M A ( x ) M R ( x ) d x
where E I represents the stiffness of the main beam of this bridge, x is the longitudinal position of a certain cross-section and l is the length of the main beam of the bridge. Similarly, under the action of a virtual unit force F I acting upon cross-section A, the bending moment of a certain cross-section is M A ( x ) . Under the action of the unit load, the bending moment of a certain cross-section is M R ( x ) .
Assuming that the quasi-static load after damage changes from F R to η F R , the displacement IL through cross-section A after damage is obtained by:
ω A ( x t ) = η F R 0 l 1 E I ( x ) M A ( x ) M R ( x ) d x = η ω A ( x t )
where ω A ( x t ) is the displacement IL through cross-section A after bridge damage occurs and η is the coefficient describing the change in the quasi-static load. Using the above two equations, the correlation coefficient between two displacement ILs defined in Equation (3) is calculated by the following equation:
β = a = 1 m η 2 ( ( X a j μ j ) ( X a k μ k ) ) / η 2 ( a = 1 m ( X a j μ j ) 2 · a = 1 m ( X a k μ k ) 2 ) 1 2 , j k
Similar to the method presented in Reference [25], the effect of the difference in the weight of the loading vehicle before and after damage is eliminated when the damage feature proposed in this study is applied to detect the damage state of a bridge. Therefore, the proposed method based on quasi-static displacement ILs has no relation to the inconsistency in the loading conditions before and after damage (the detailed results of the numerical example are shown in Section 3.2). Of course, this method is limited insomuch as the damaged bridge approximates a linear elastic state, that is, the damage is not sufficiently severe to force the mechanical performance of the bridge into a nonlinear state. However, for most medium- and small-span bridges, this limitation is easily satisfied in theory.

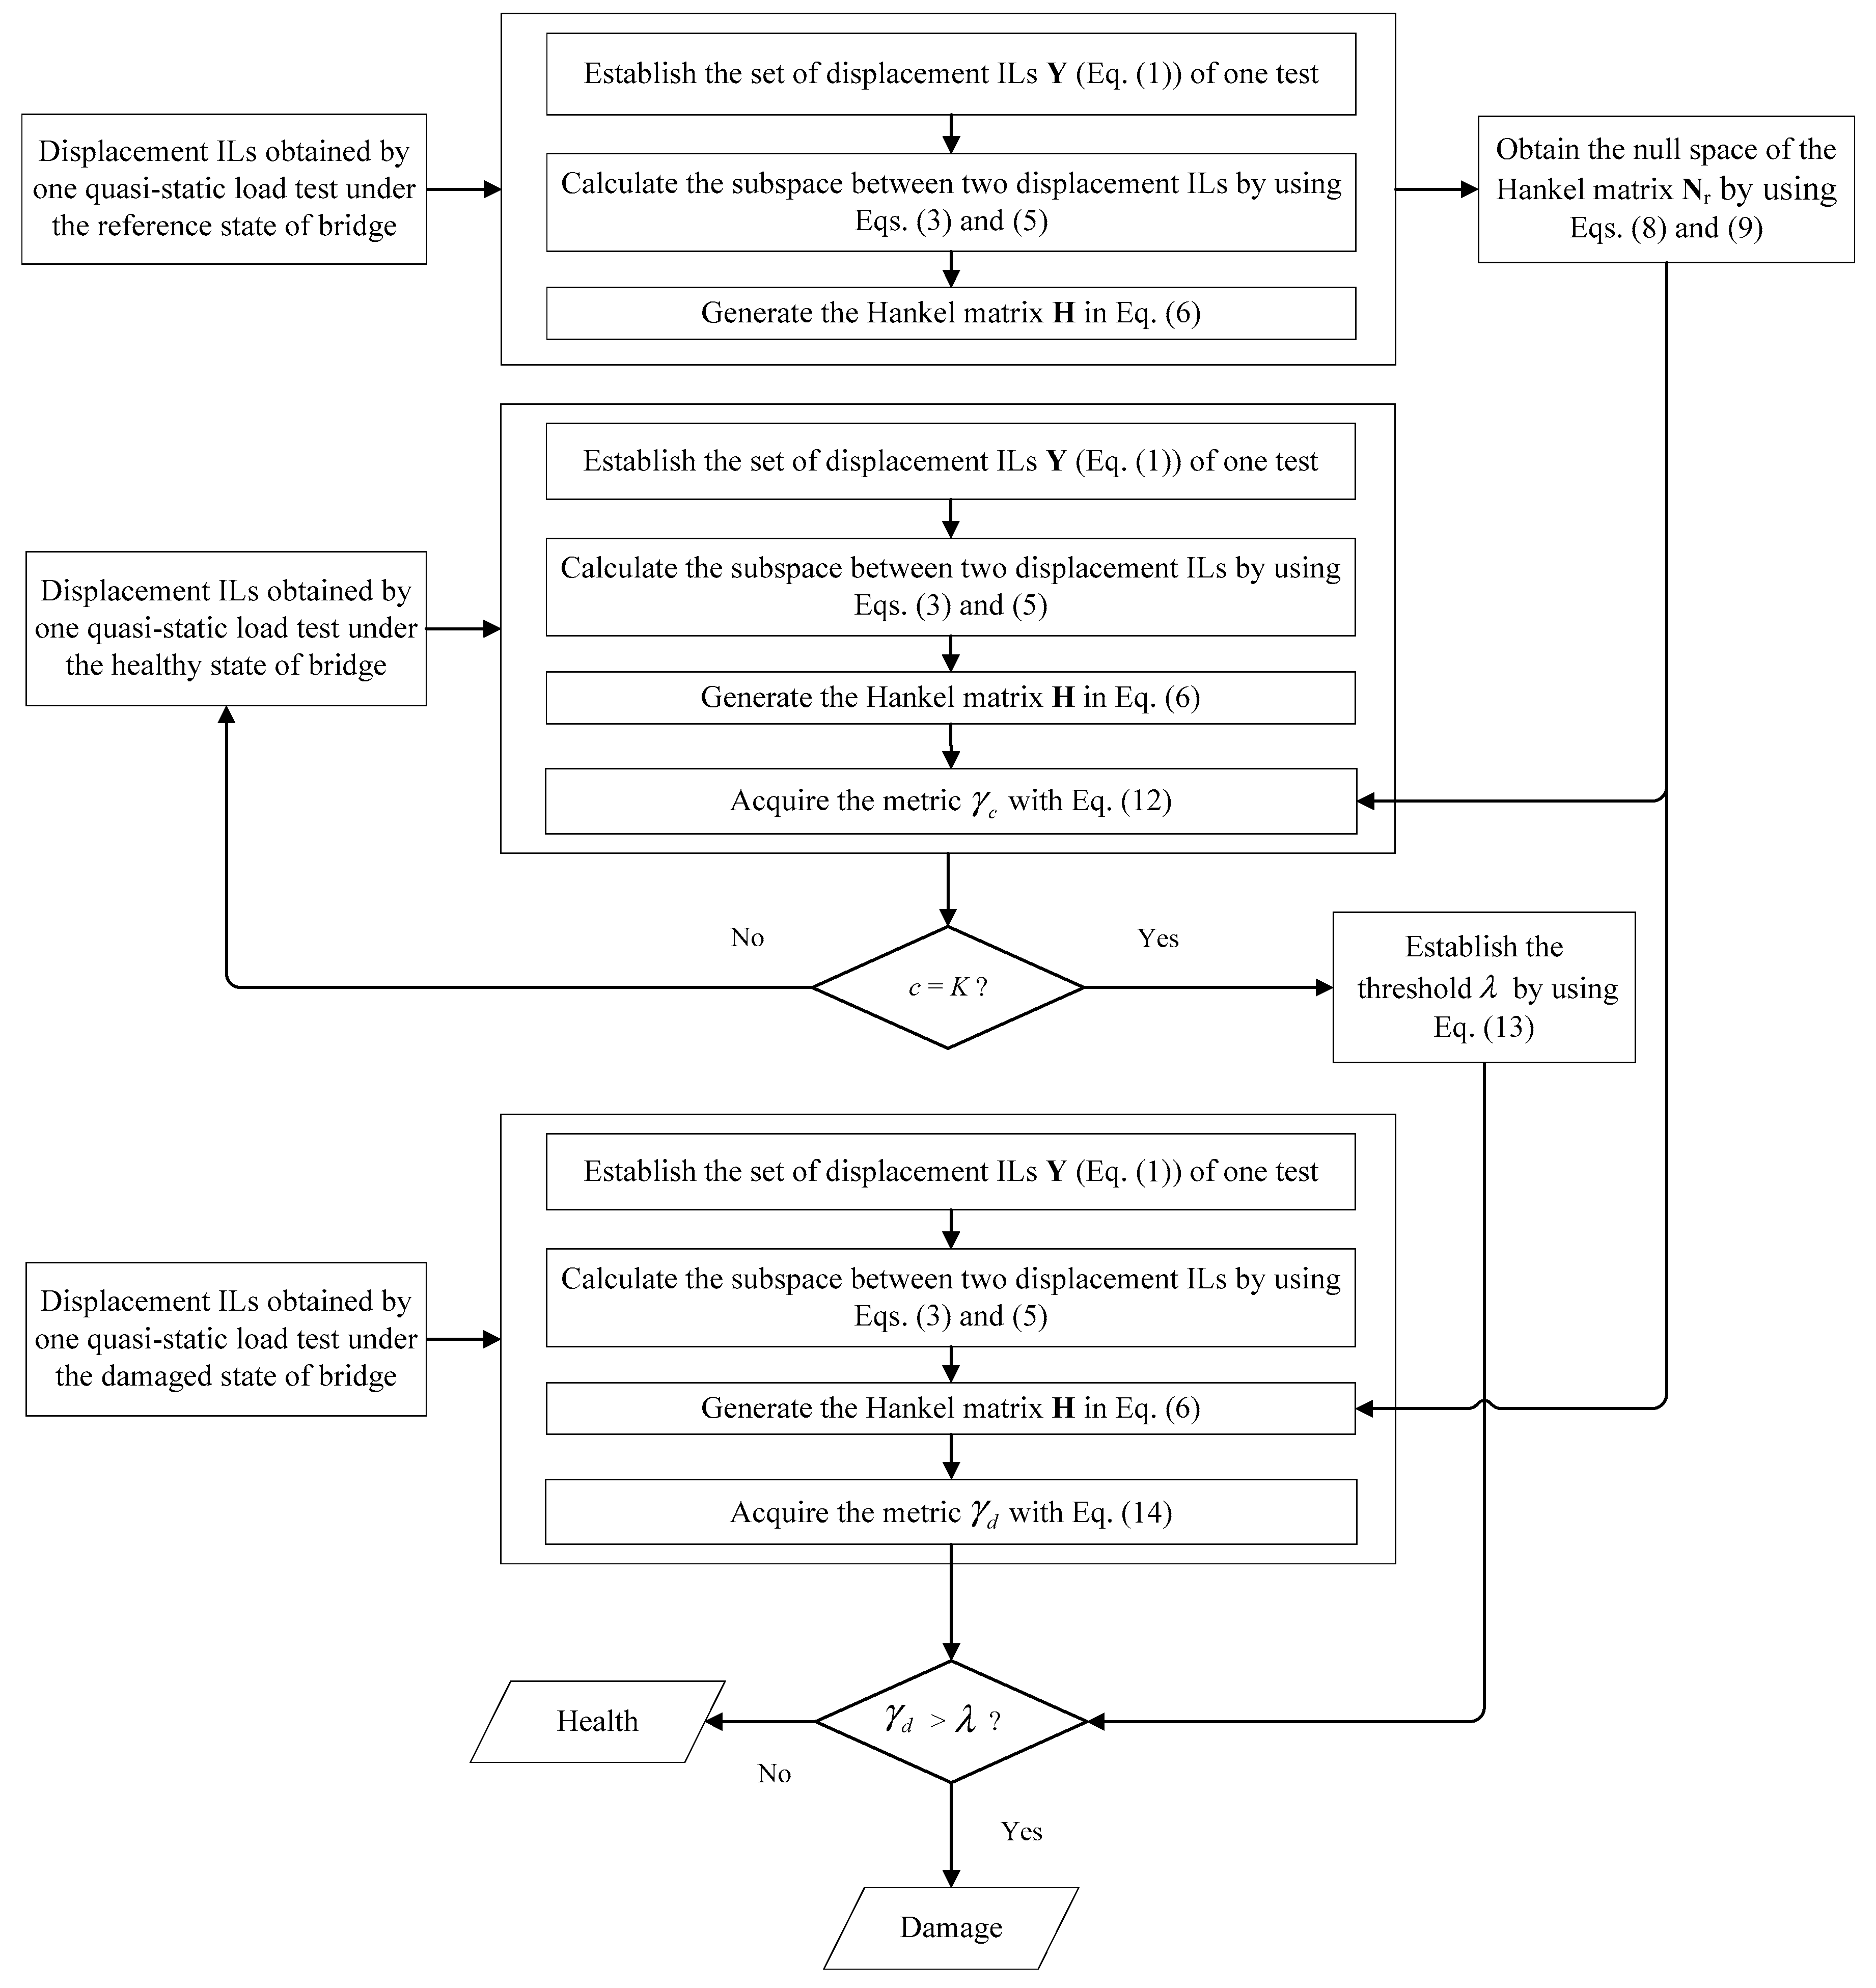
2.2.4. Procedure of the Proposed Method

Based on the above description of the proposed method, the algorithm framework considers three main states: the reference state of the bridge, the healthy state of the bridge and the unknown state (damaged or not) of the bridge. Usually, the first quasi-static load test is the reference state of the bridge and the null space of the Hankel matrix N r , described by Equations (8) and (9), is determined by using the displacement ILs measured in this state. The healthy state is defined as the state in which we believe the bridge to be in good condition. For the healthy state, the metric of the damage feature γ c and the damage detection threshold λ are obtained by using the measured displacement ILs and the generated N r under the reference state. For the unknown state, the metric of damage feature γ d is calculated using the measured displacement ILs, after which the determination regarding the presence of damage is made by evaluating whether γ d is larger than the threshold λ . The detailed procedure is illustrated schematically in Figure 2.

3. Numerical Example

The difference between displacement ILs before and after damage is commonly used for damage detection [12,13,14] and this method is called the traditional method in this study. In this section, a simply supported bridge is taken as a numerical example and the performance of the proposed method is evaluated and compared with the traditional approach.

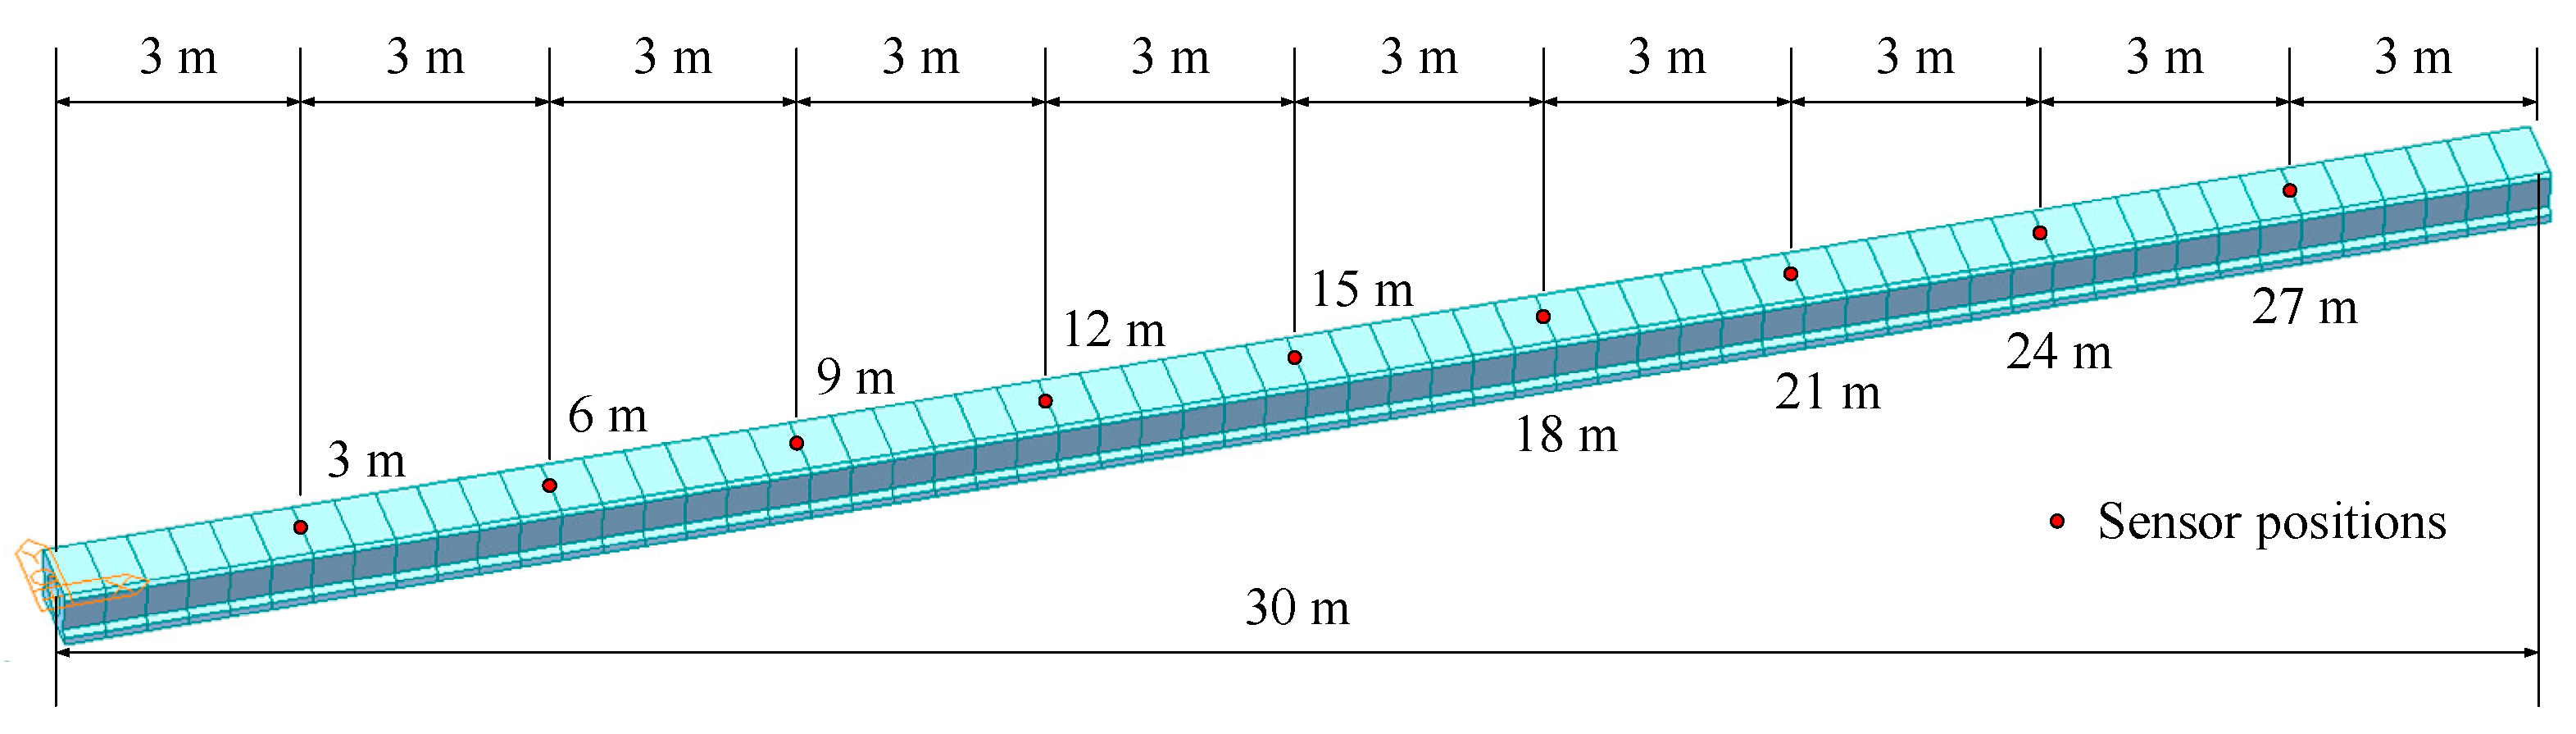
3.1. Brief Description of the Numerical Example

A simply supported bridge with a length of 30 m composed of C50 concrete is taken as a numerical example to demonstrate the effectiveness of the proposed method. The finite element model of this bridge was built with Midas Civil software (version number: 8.32), as shown in Figure 3. A total of 60 elements with lengths of 0.5 m and 61 nodes compose the model, the parameters of which are listed in Table 1.
To simulate the quasi-static load test, a quasi-static moving load (100 kN or 50 kN) is implemented to obtain the displacement ILs of the modelled bridge. A total of 9 sensors are placed along the superstructure of this bridge, as shown in Figure 3. The damaged region is modelled by reducing the stiffnesses of one element with different degree of damage. For example, 5% extent of damage is occurred at the 3 m position of the bridge, which means the stiffnesses of element at this position is reduced 5%. All the detailed damage cases are listed in Table 2. All simulations are executed in the MATLAB software environment (version number: 9.2.0.556344).

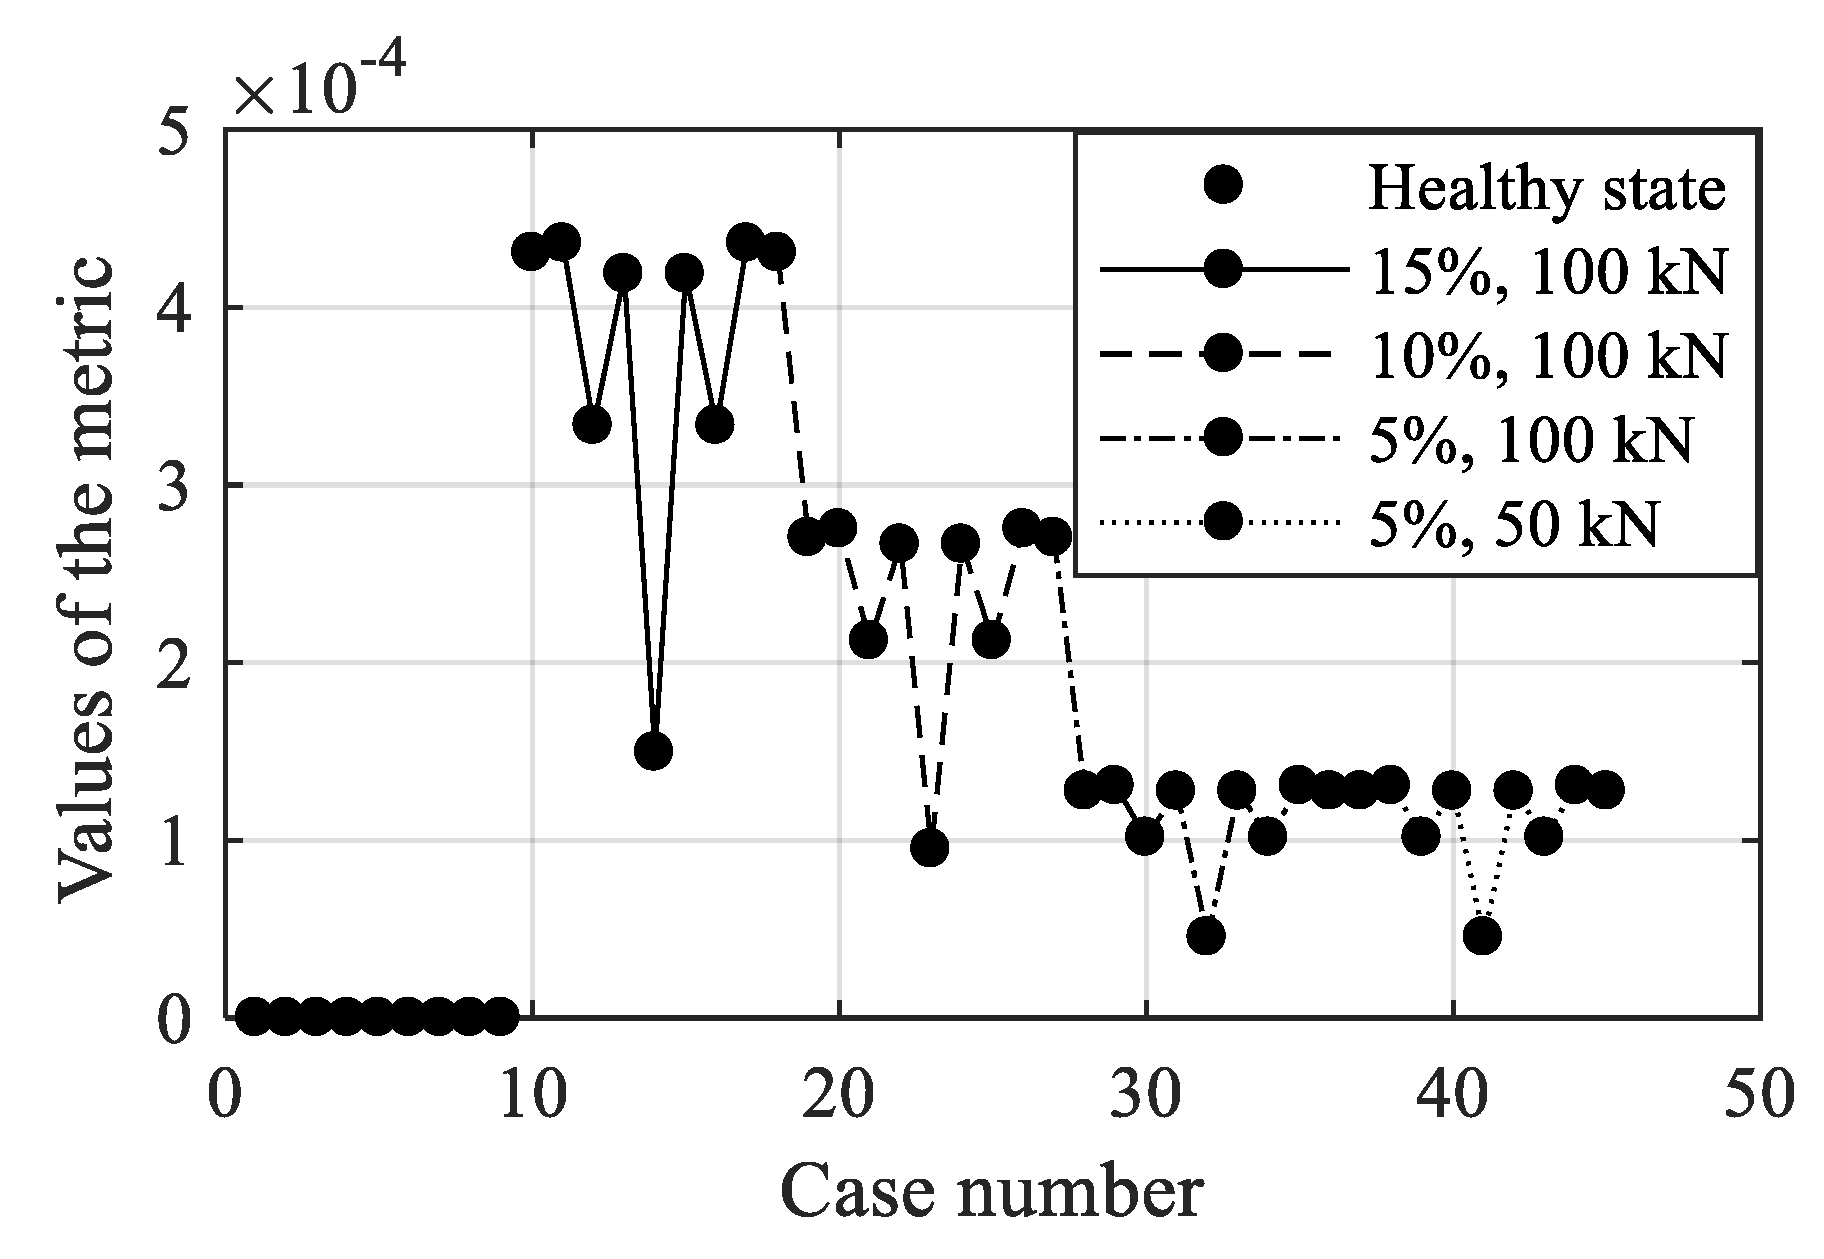
3.2. Damage Detection Performance of the Proposed Method

With the numerical model described in the preceding section, 45 different cases are considered and two types of quasi-static loads are utilized; specifically, 100-kN quasi-static loads are applied in the first 36 cases and 50-kN loads are applied in the other 9 cases. For the first 36 cases, three different damage extents, namely, 5%, 10% and 15%, are implemented and 9 different damage locations are considered for each degree of damage. For the last 9 cases, only an extent of 5% is simulated and the same 9 damage locations are employed. For each case, a total of 9 displacement ILs are obtained and one metric is calculated using the data of those ILs. The damage detection results of all cases are listed in Table 2. A comparison of the metrics among the different cases is shown in Figure 4.
As shown in Figure 4, the following results are obtained. The value of the damage feature metric obtained by Equation (12) increases for the same damage location as the extent of damage becomes more serious. However, under the same extent of damage, the values of the damage feature metric change as the damage location varies; the closer the damage location is to the supported end, the greater the value of the damage feature metric obtained. When the damage location is at the middle of the span of the main beam of the bridge, 4 of the displacement ILs are similar, whereas when the damage location is near the supported end, almost all 9 displacement ILs exhibit discrepancies. Consequently, more information in the displacement ILs is affected by the damage when the damage exists at the supported end than when the damage exists in the middle span of the main beam. This discrepancy constitutes the main reason for the observed phenomenon. Furthermore, as shown in Figure 4, the metric values of the last two groups (total 18 cases) are identical, which means that the proposed method is independent of the load conditions before and after damage.
As discussed above, similar to the traditional method, the effectiveness of the proposed method lies in the change in the displacement ILs before and after damage occurs; however, in contrast to the traditional approach, the proposed damage feature based on the correlation coefficient between different displacement ILs has no relation to the difference in the quasi-static weight of the loading vehicle before and after damage. This characteristic is demonstrated in the numerical example illustrated in Figure 4.

3.3. Comparison of the Performance Between the Proposed Method and the Traditional Approach

To evaluate the performance of the proposed method, we compare the following damage detection results with the traditional approach: damage detection without the effect of noise, damage detection with the effect of noise and damage detection in consideration of different quasi-static loading conditions before and after damage.

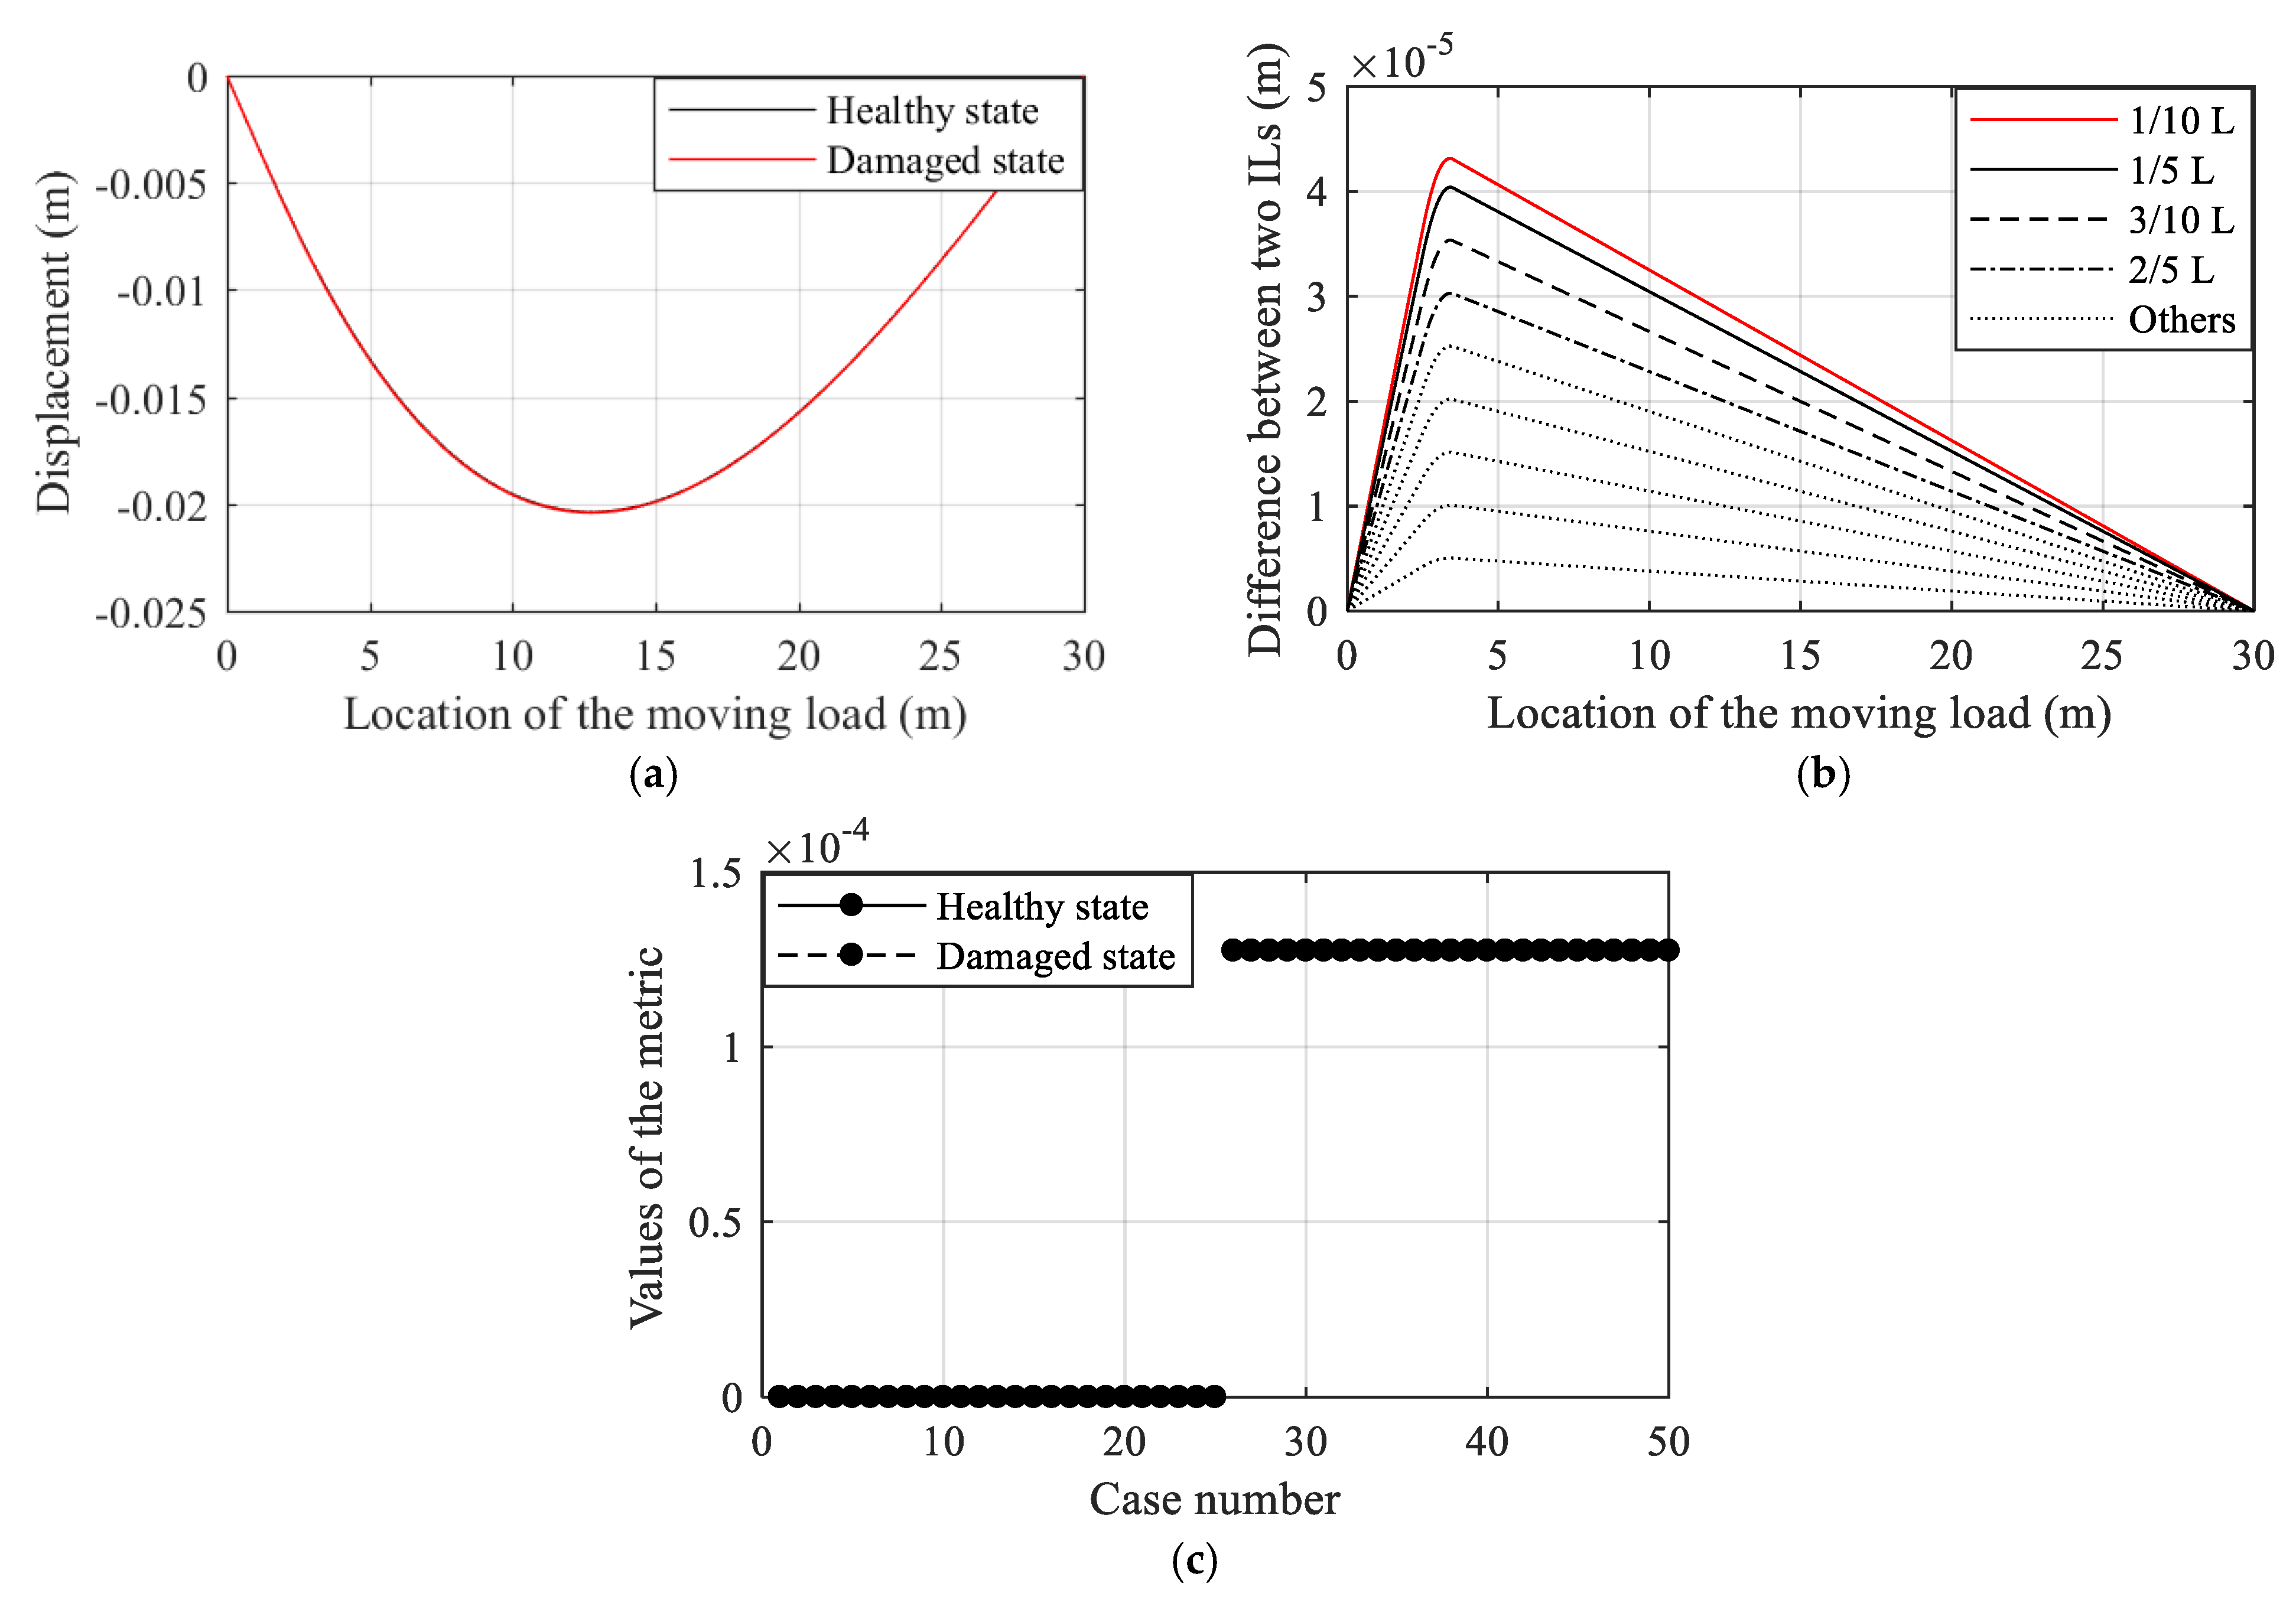
3.3.1. Damage Detection Without the Effect of Measurement Noise

In this situation, the damage is modelled through the 1/10L cross-section and the damage extent is set as 5%. Under the same quasi-static loading conditions before and after damage, 50 cases are simulated without any measurement noise, that is, 25 cases for a healthy bridge and 25 cases for a damaged bridge. For each case, 9 displacement ILs are obtained; all displacement ILs through different cross-sections are drawn in Figure 5. As shown in Figure 6a, it is difficult to directly detect the damage with the displacement ILs because the extent of damage is relatively small. With the traditional method, the difference in the displacement ILs before and after damage is applied to detect the damage, as shown in Figure 6b; obviously, the damage can be identified directly. Using the proposed method, the damage is also detected easily, as shown in Figure 6c. Therefore, both the proposed method and the traditional approach are effective at detecting damage without the effect of measurement noise under the same loading conditions before and after the bridge suffers damage.

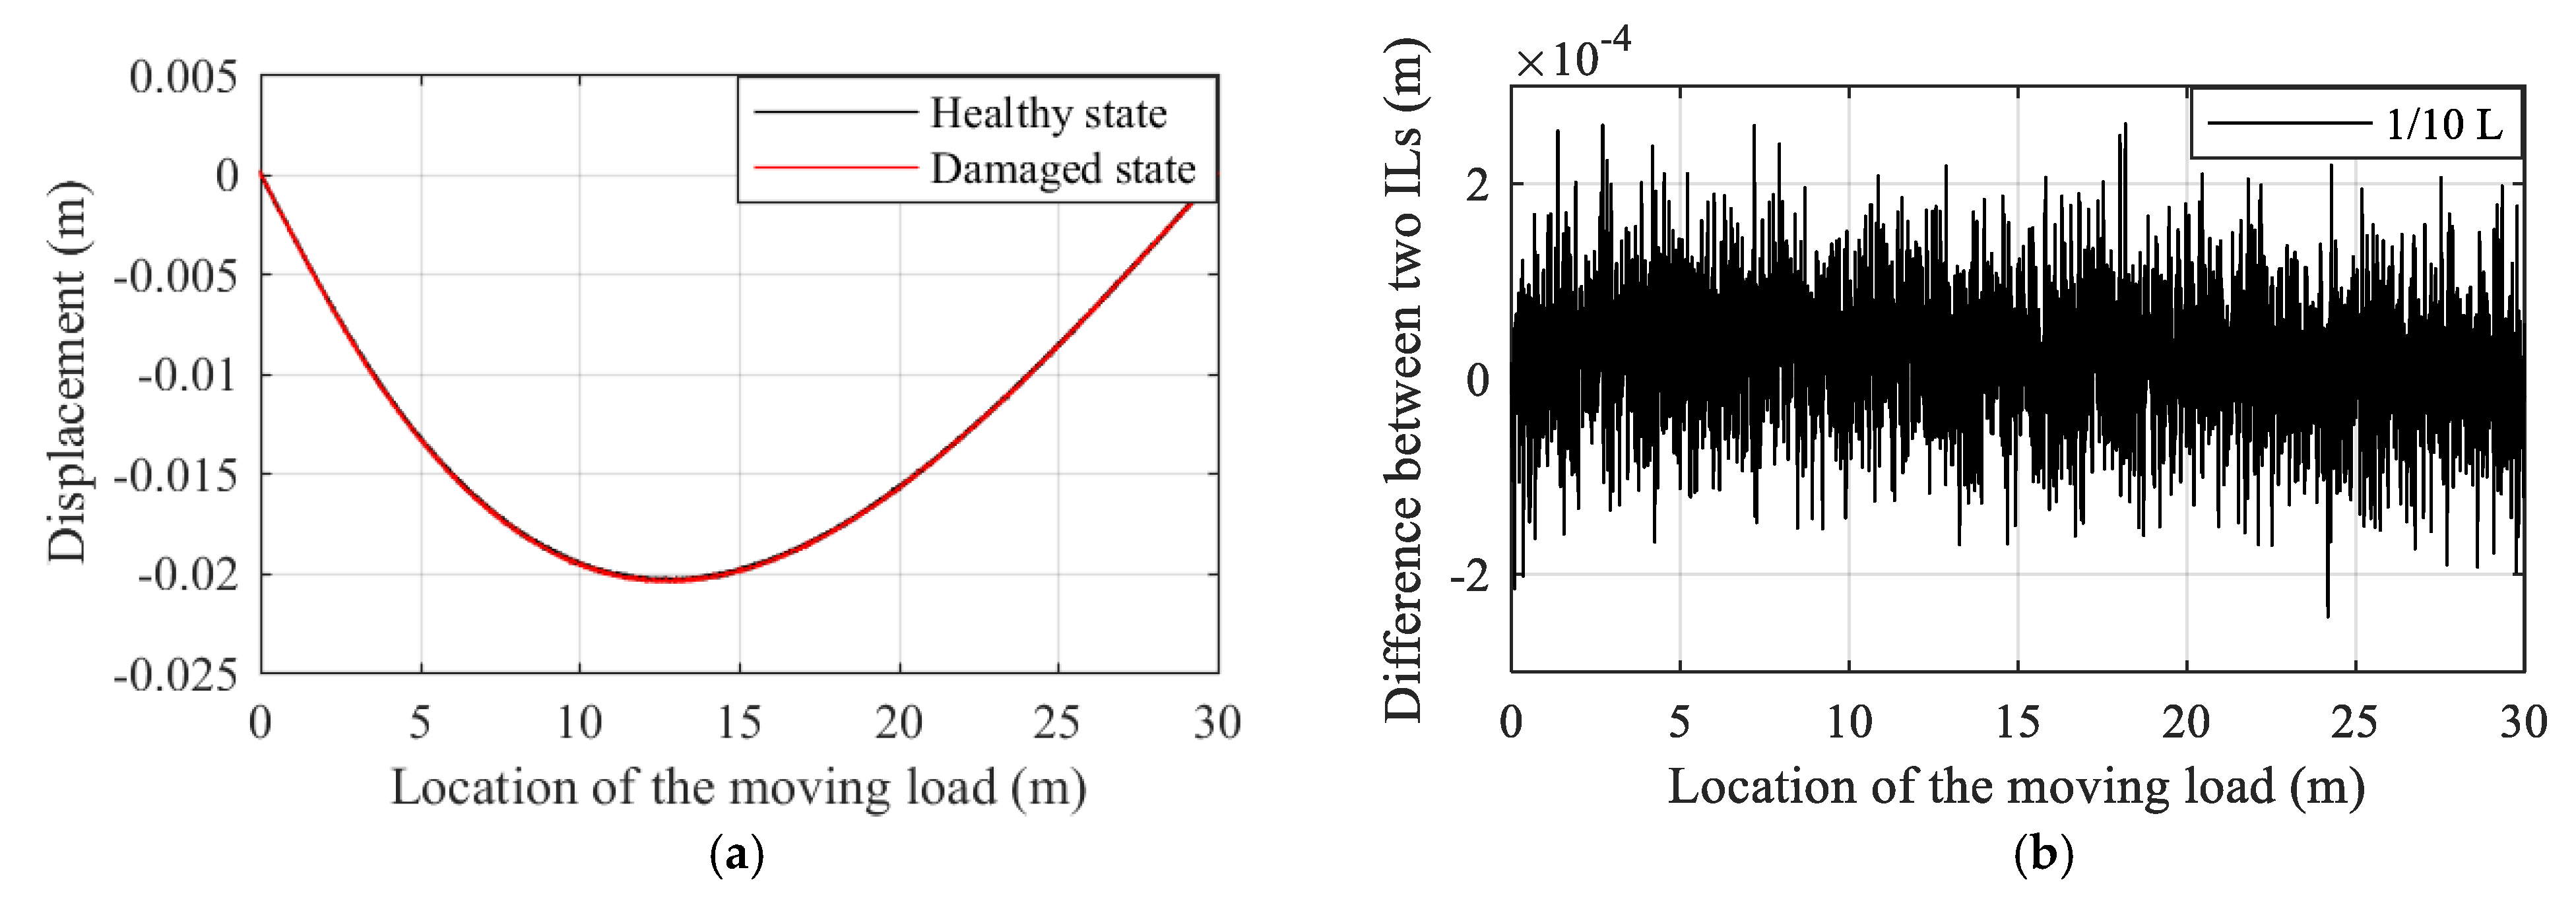
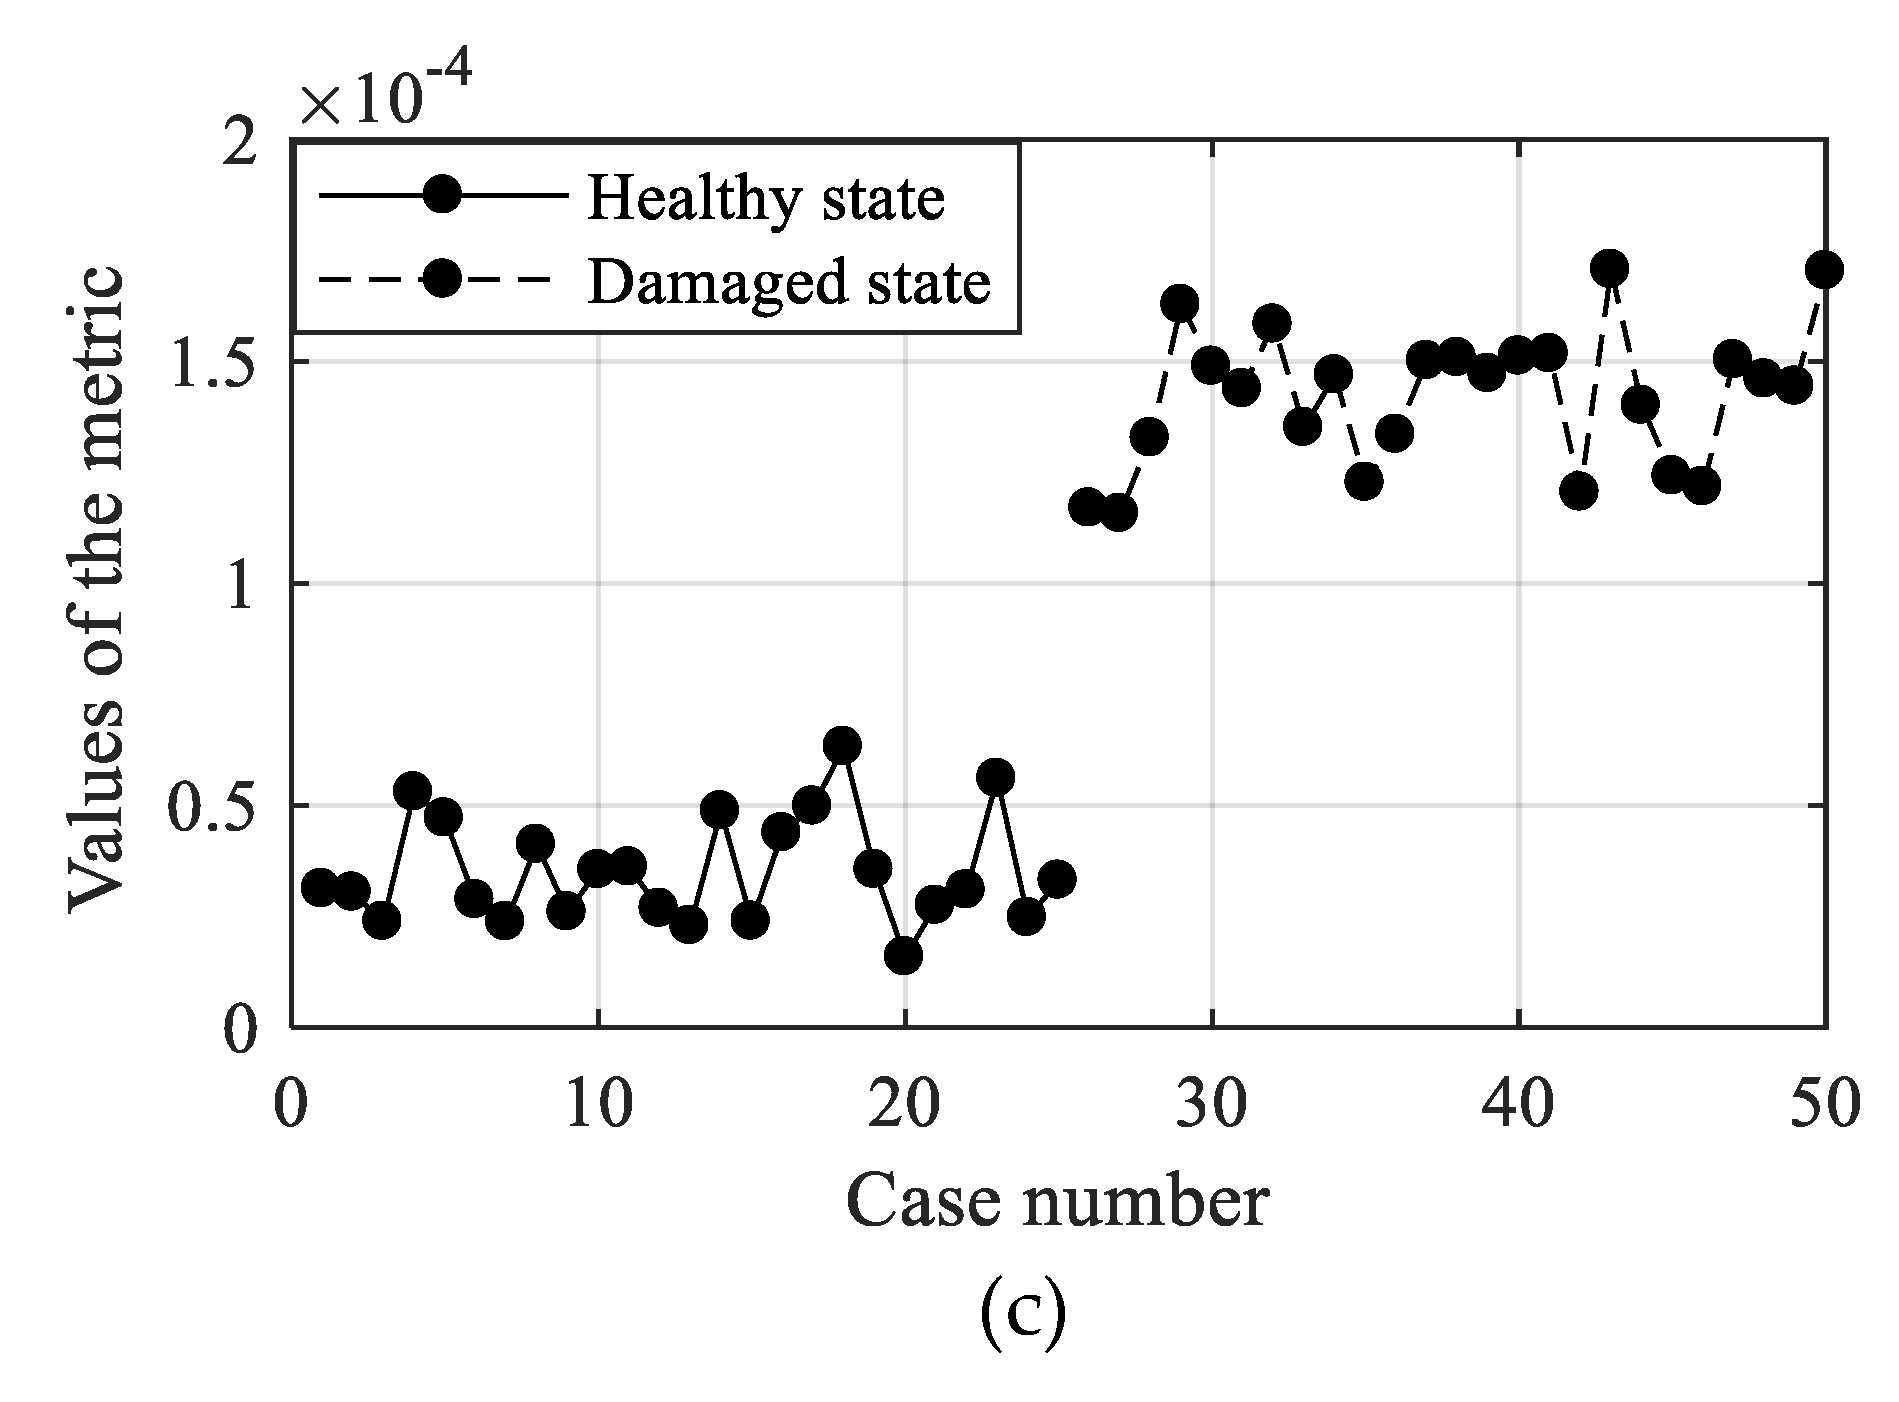
3.3.2. Damage Detection Considering the Effect of Measurement Noise

The damage case described in Section 3.3.1 is adopted again in this section; however, in contrast to the previous comparison, the effect of measurement noise is discussed in detail. Herein, the effects of different noise levels on the damage detection results are compared, as described in Table 3. For the sake of brevity, detailed information for only one case (1.6% noise level) is presented. As shown in Figure 7a, it is difficult to directly detect damage using the displacement ILs. Furthermore, it is impossible to utilize the difference in the displacement ILs before and after damage to identify the damage, as shown in Figure 7b. It appears that the effect of measurement noise misleads the damage detection results obtained by the traditional method. Nevertheless, Figure 7c shows that damage can still be identified clearly using the proposed method, which is clearly more effective than the traditional approach at detecting damage.
Next, random white noise is added directly to the displacement ILs. As shown in the first four columns of Table 3, the traditional method is effective at detecting the damage only in the cases in which the noise level is less than 1.6%. In contrast, the proposed method works well for all cases in which the noise level is no larger than 4.8%. The noise level of the correlation coefficient between two displacement ILs before and after damage may be greater than the damage extent, which explains why it is difficult for the proposed method to detect damage when the noise level (5.2%) is greater than the damage extent (5%) of the bridge. Similar results are shown for the other cases with damage extents of 10% and 15%, as listed in Table 3.

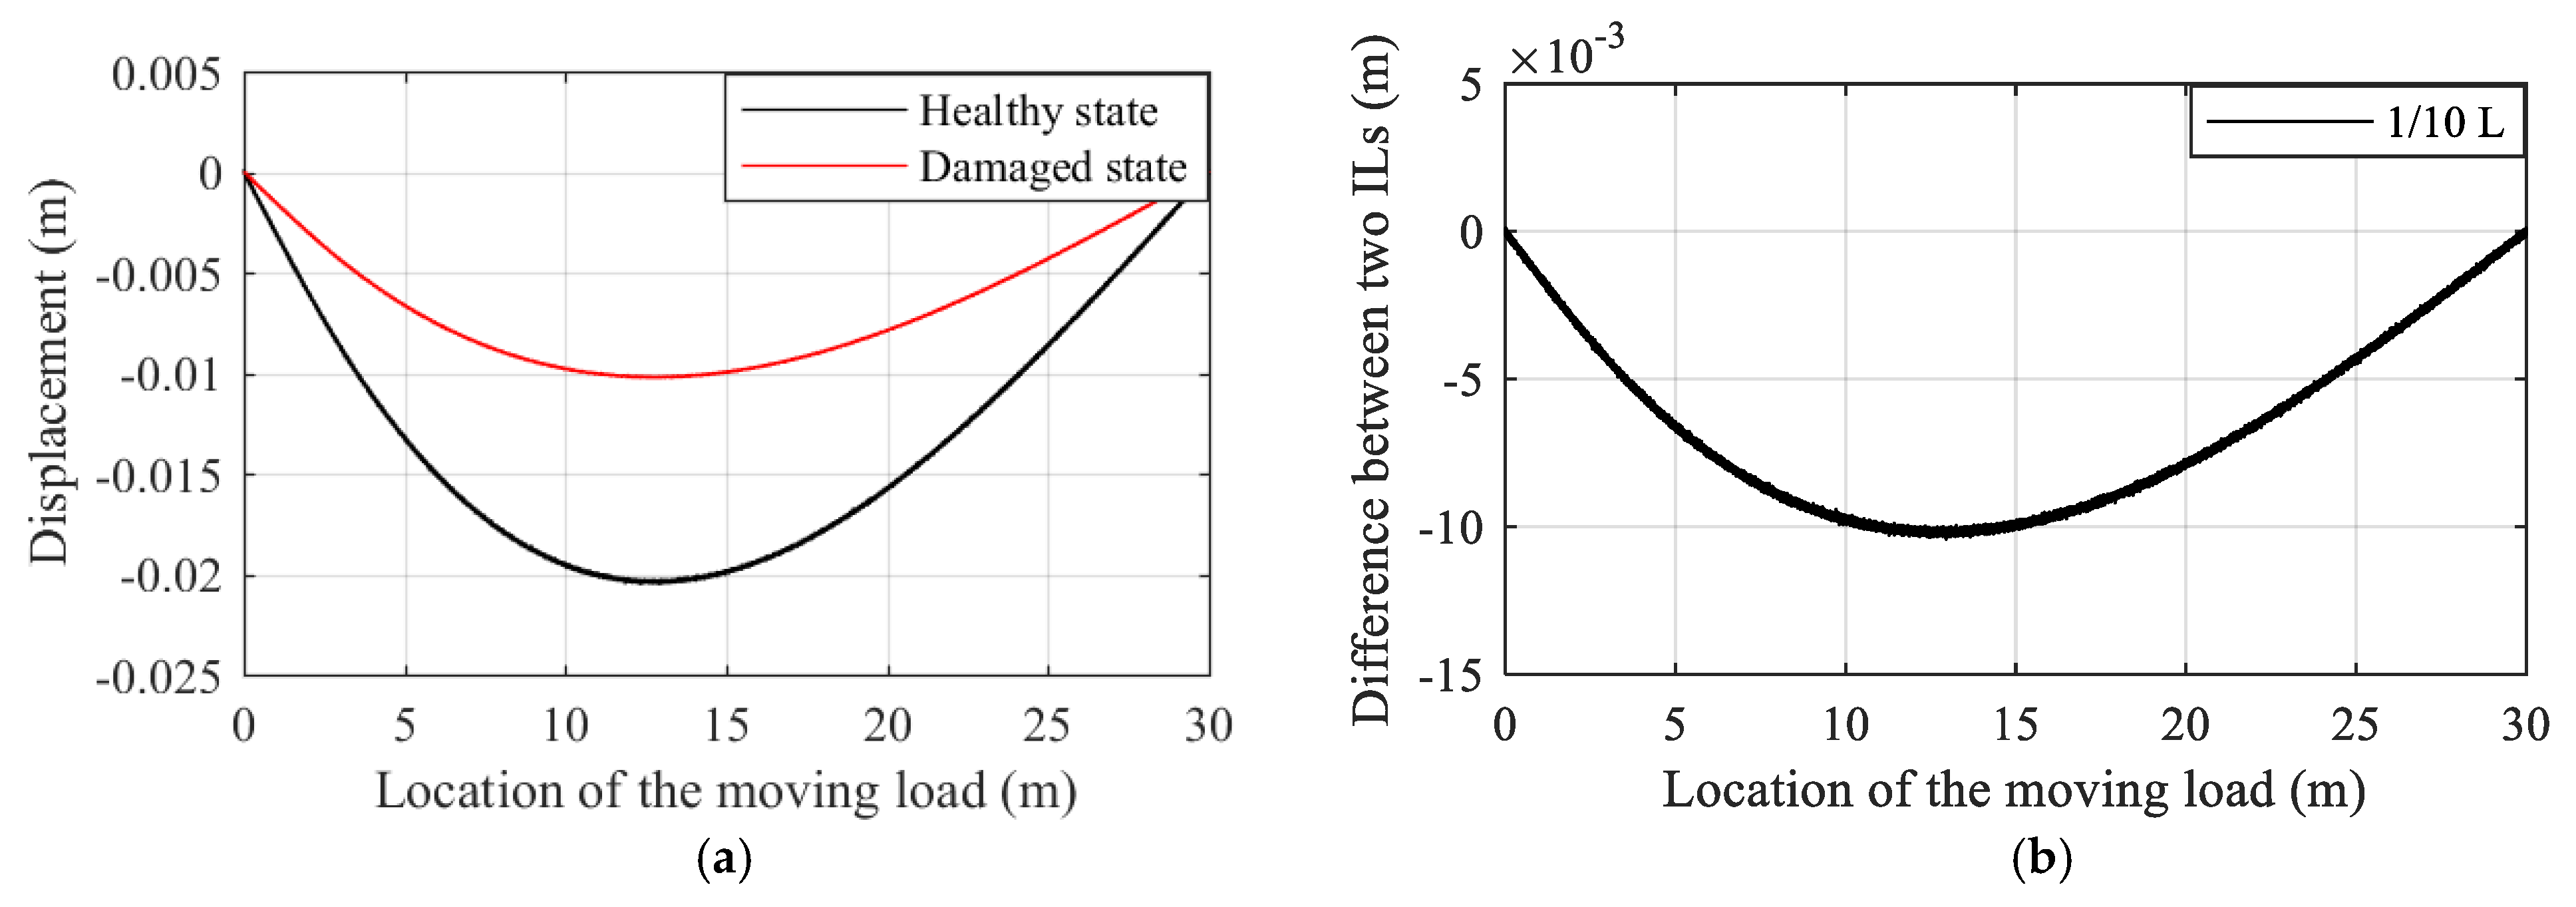
3.3.3. Damage Detection Considering Different Loading Conditions before and after Damage

Based on the results acquired in Section 3.3.2, we evaluate the effect of measurement noise on the inconsistency in the quasi-static loading conditions before and after damage. As discussed in Section 3.2, the traditional method—that is, analyzing the difference in the displacement ILs—does not work when the weight of the quasi-static loading vehicle is inconsistent before and after bridge damage occurs. To assess the effectiveness of the proposed method, the damage case described in Section 3.3.2 is taken as an example and the inconsistency in the loading condition is achieved by using quasi-static loading vehicles with weights of 100 kN and 50 kN for healthy and damaged bridges, respectively. As shown in Figure 8a,b, there is an obvious difference in the displacement ILs for the healthy bridge acted upon by the two different quasi-static loads; however, under the above two loading conditions, the difference in the displacement ILs before and after damage does not exhibit any discrepancy. Unlike the traditional approach, the proposed method works effectively under the influence of measurement noise, as shown in Figure 8c. Therefore, the large difference in the weight of the loading vehicle is used in this section to evaluate the performance of the proposed method. For practical applications, the weight of the loading vehicle before and after damage should be as consistent as possible and should be sufficiently heavy to obtain precise data on the damage experienced by the bridge, as described in Section 2.1.

3.3.4. Robust Performance of the Proposed Method

The determination of the damage feature with the proposed method depends on the generated Hankel matrix; hence, the form of the Hankel matrix influences the robustness and accuracy of damage detection. To discuss the rules followed to generate the Hankel matrix, we use the following numerical example. Nine sensors are placed along the main beam of the bridge and a total of 36 elements are supplied to establish the Hankel matrix. If row number p and column number q are equal to 1 and 36, respectively, the Hankel matrix takes the row matrix form. For this situation, there are 35 null space matrices in the Hankel matrix, as described in Equation (8). With this Hankel matrix, the damage detection results are shown in Figure 9a, in which 35 damage detection results are obtained using 35 different null space matrices. These results demonstrate a substantial discrepancy and some results even provide the wrong determination. If p and q take values of 7 and 30, respectively, the Hankel matrix contains 23 null space matrices. All damage detection results are presented in Figure 9b, which shows that the robustness of the proposed method is significantly improved. We repeat this calculation until p and q take values of 17 and 20, respectively; the corresponding damage detection results are shown in Figure 9c. For this situation, the robustness and accuracy of the proposed method are evidently superior. Therefore, it is recommended that the form of the Hankel matrix be approximately square, that is, the value of p is equal to either q 1 or q 2 .

4. Experimental Example

For the above numerical example, only one quasi-static displacement IL through each cross-section is applied to evaluate the performance of the proposed method. In this section, a model bridge with a cross-section consisting of three T-shaped beams is taken as an example. The assessment of the proposed method is expanded to use the displacement ILs in consideration of the transverse load distribution.

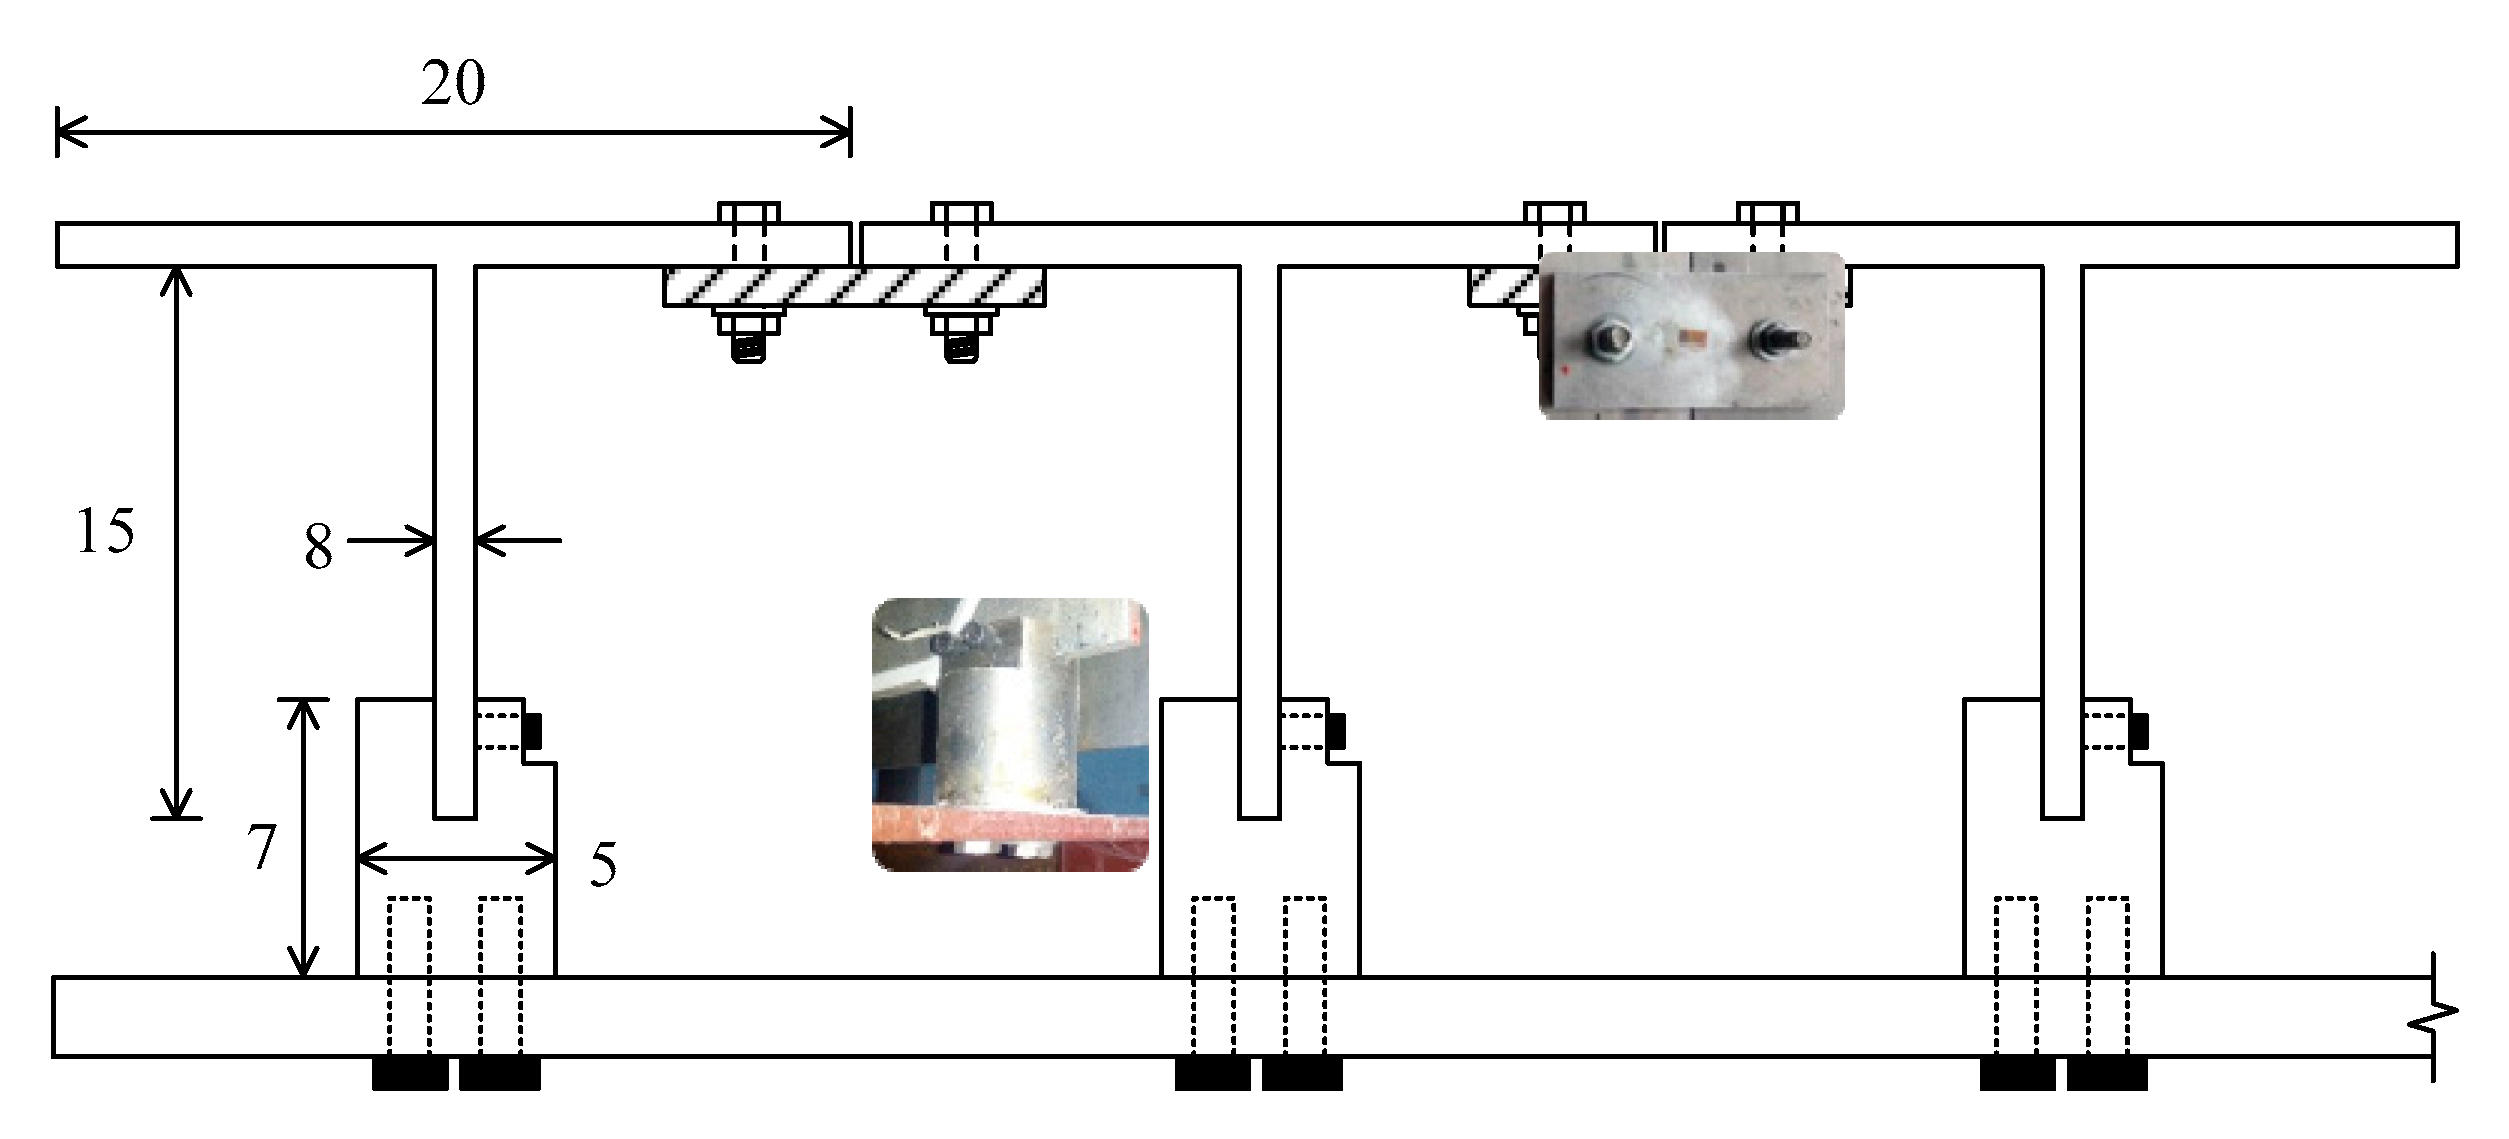
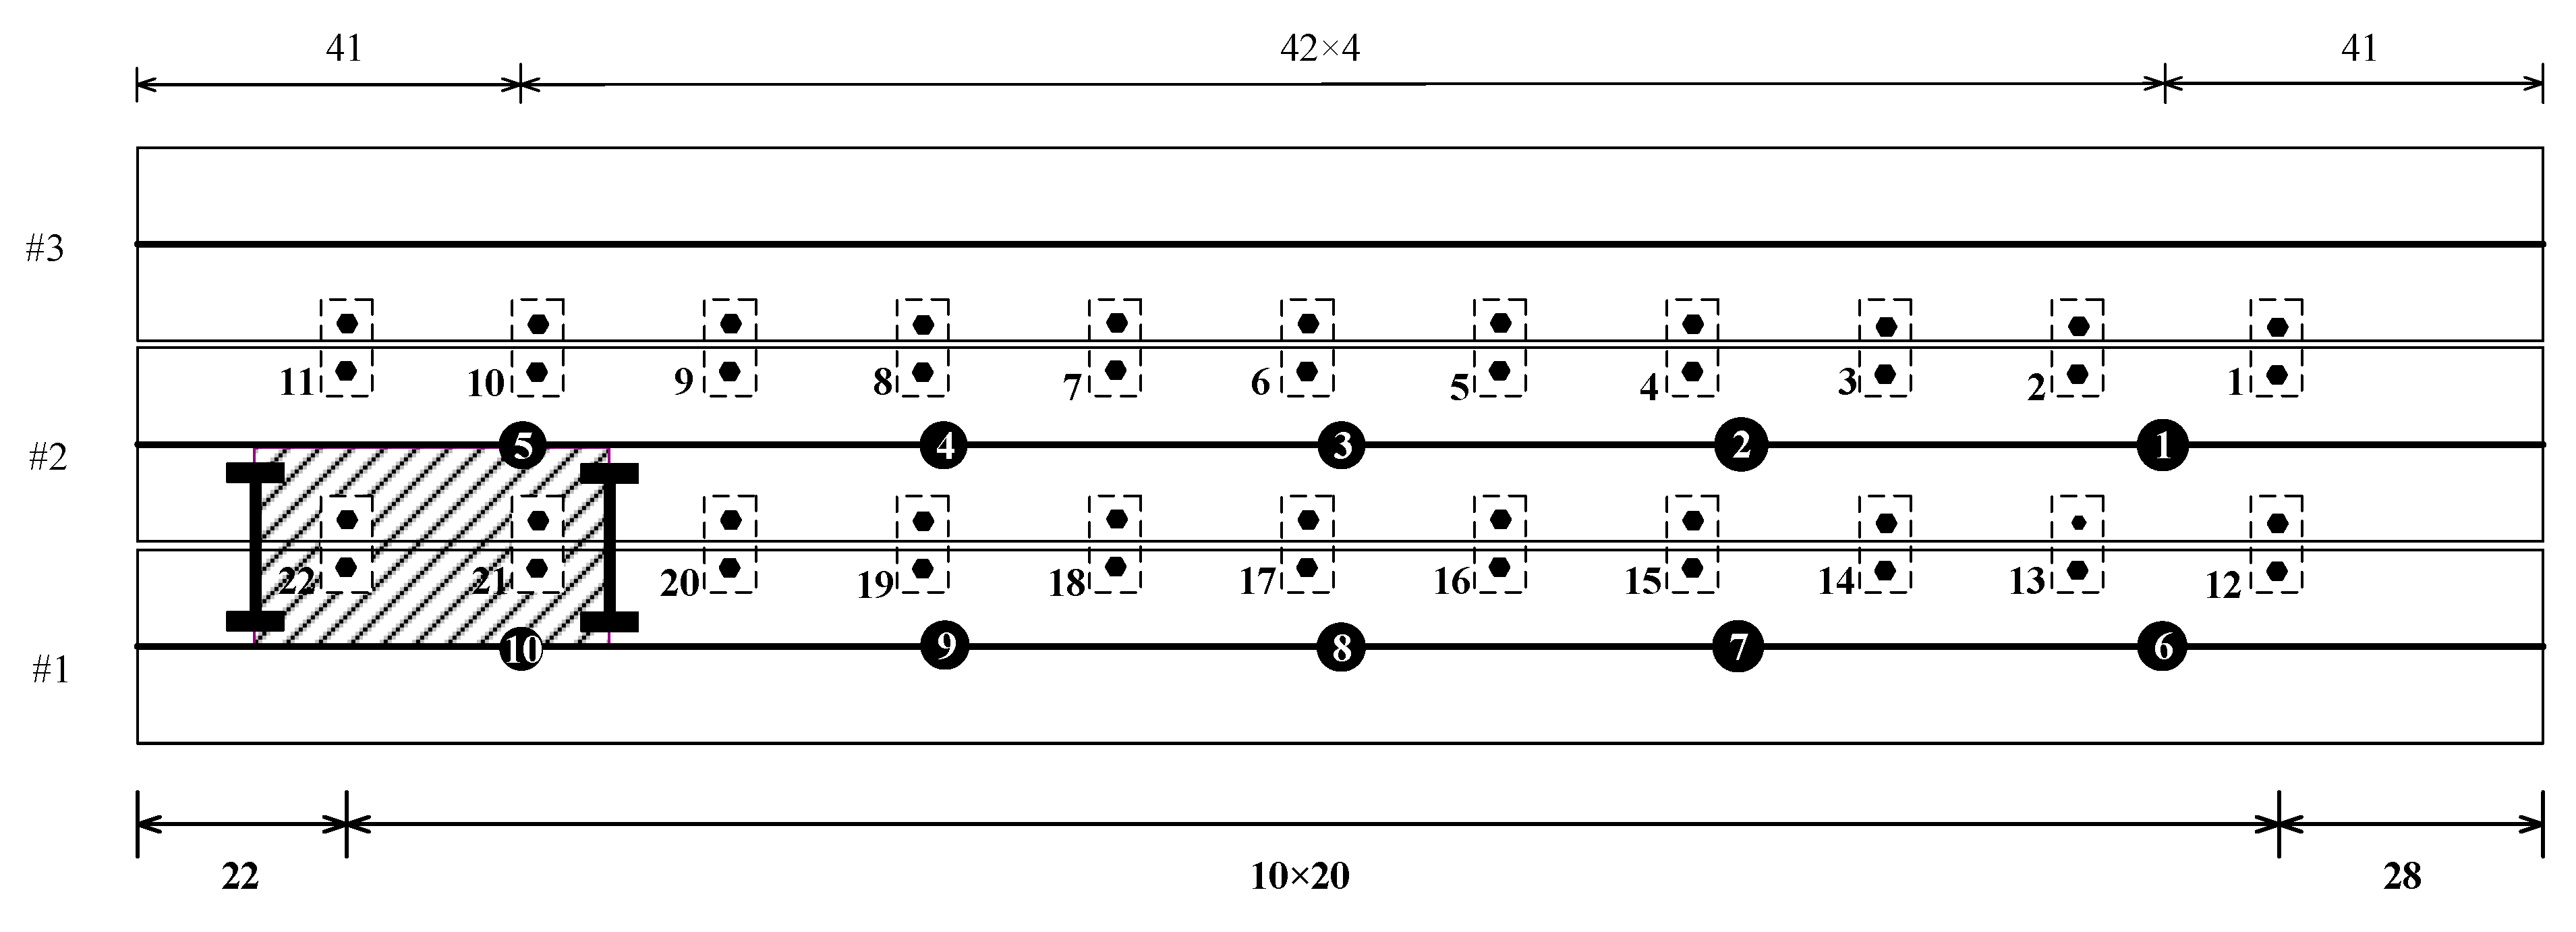
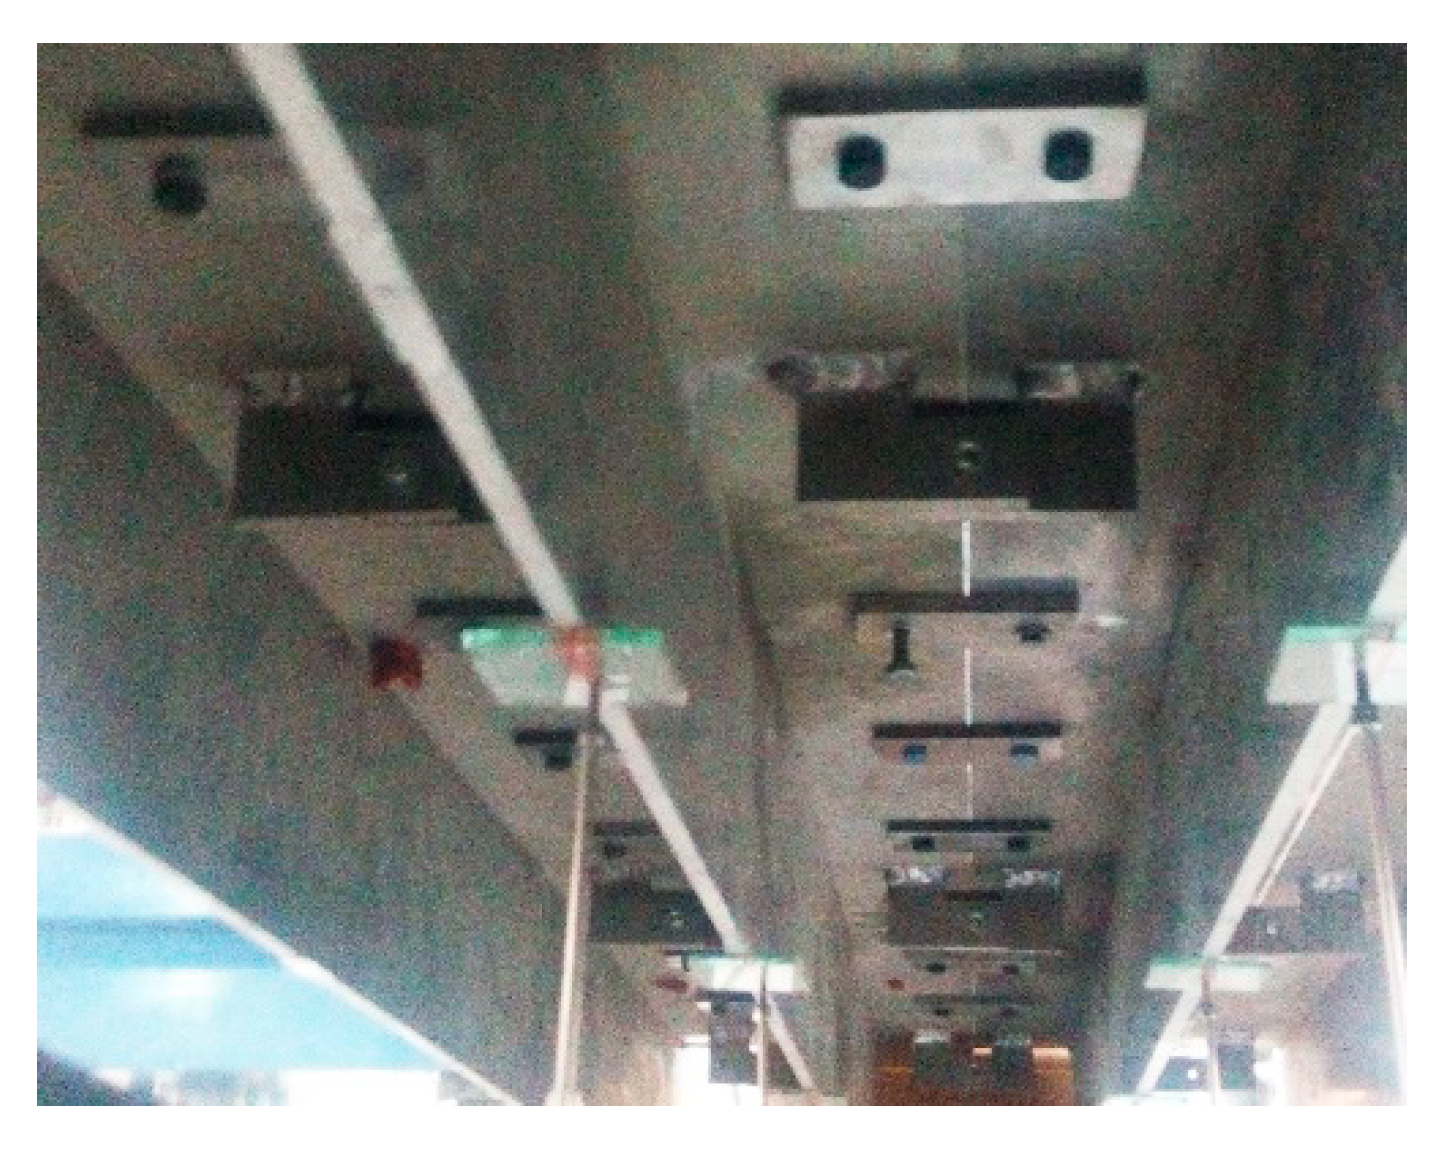
4.1. Brief Description of the Model Bridge

The entire experimental system in this section consists of three parts, namely, the superstructure of the model bridge, the bridge bearing and supporting frame and the loading vehicle, as shown in Figure 10. The superstructure of the bridge is composed of three T-shaped steel beams (with a Young’s modulus of 2.0 × 10¹¹ Pa), a detailed drawing of which is shown in Figure 11. The entire supporting system consists of the supported bearing and the steel frame, which are equivalent to bridge piers. The moving vehicle system includes an electronic machine and a steel vehicle, in addition to several steel clump weights (each of which weighs 20 kg) and two aluminum tracks (detailed information is also described in Reference [25]). The two aluminum tracks keep the vehicle moving over the bridge along the designed trajectory and the electronic machine draws the vehicle at a slow uniform velocity.

4.2. Introduction of Sensor Placement and Damage Cases

Considering the #1 and #2 T-shaped beams supporting the moving vehicle, a total of 10 displacement sensors are placed along the towing beams, that is, 5 sensors are attached to each beam; a detailed drawing is provided in Figure 12. As shown in Figure 13, a total of 22 devices are designed to simulate the damage of the transverse connection between the two T-shaped beams. Different damage extents are simulated by removing different numbers of the above devices. During the test, a total of 32 cases are implemented and 10 displacement ILs are obtained in every case, as described in Table 4.
Using the electronic machine, the loading vehicle is pulled over the model bridge with a slow uniform velocity representing the quasi-static load test defined in this study. During one test, 10 sensors record 10 quasi-static displacement ILs. All 32 cases of the quasi-static load tests can be divided into 5 parts as follows:
Part I: reference state, that is, case 1, as listed in Table 4.
Part II: healthy state under the same loading conditions as the reference state, that is, cases 2 to 10, as listed in Table 4.
Part III: damaged state under the same loading conditions as the reference state, that is, cases 11 to 20, as listed in Table 4.
Part IV: damaged state under different loading conditions from the reference state, that is, cases 21 to 30, as listed in Table 4.
Part V: healthy state under different loading conditions from the reference state, that is, cases 31 to 32, as listed in Table 4.

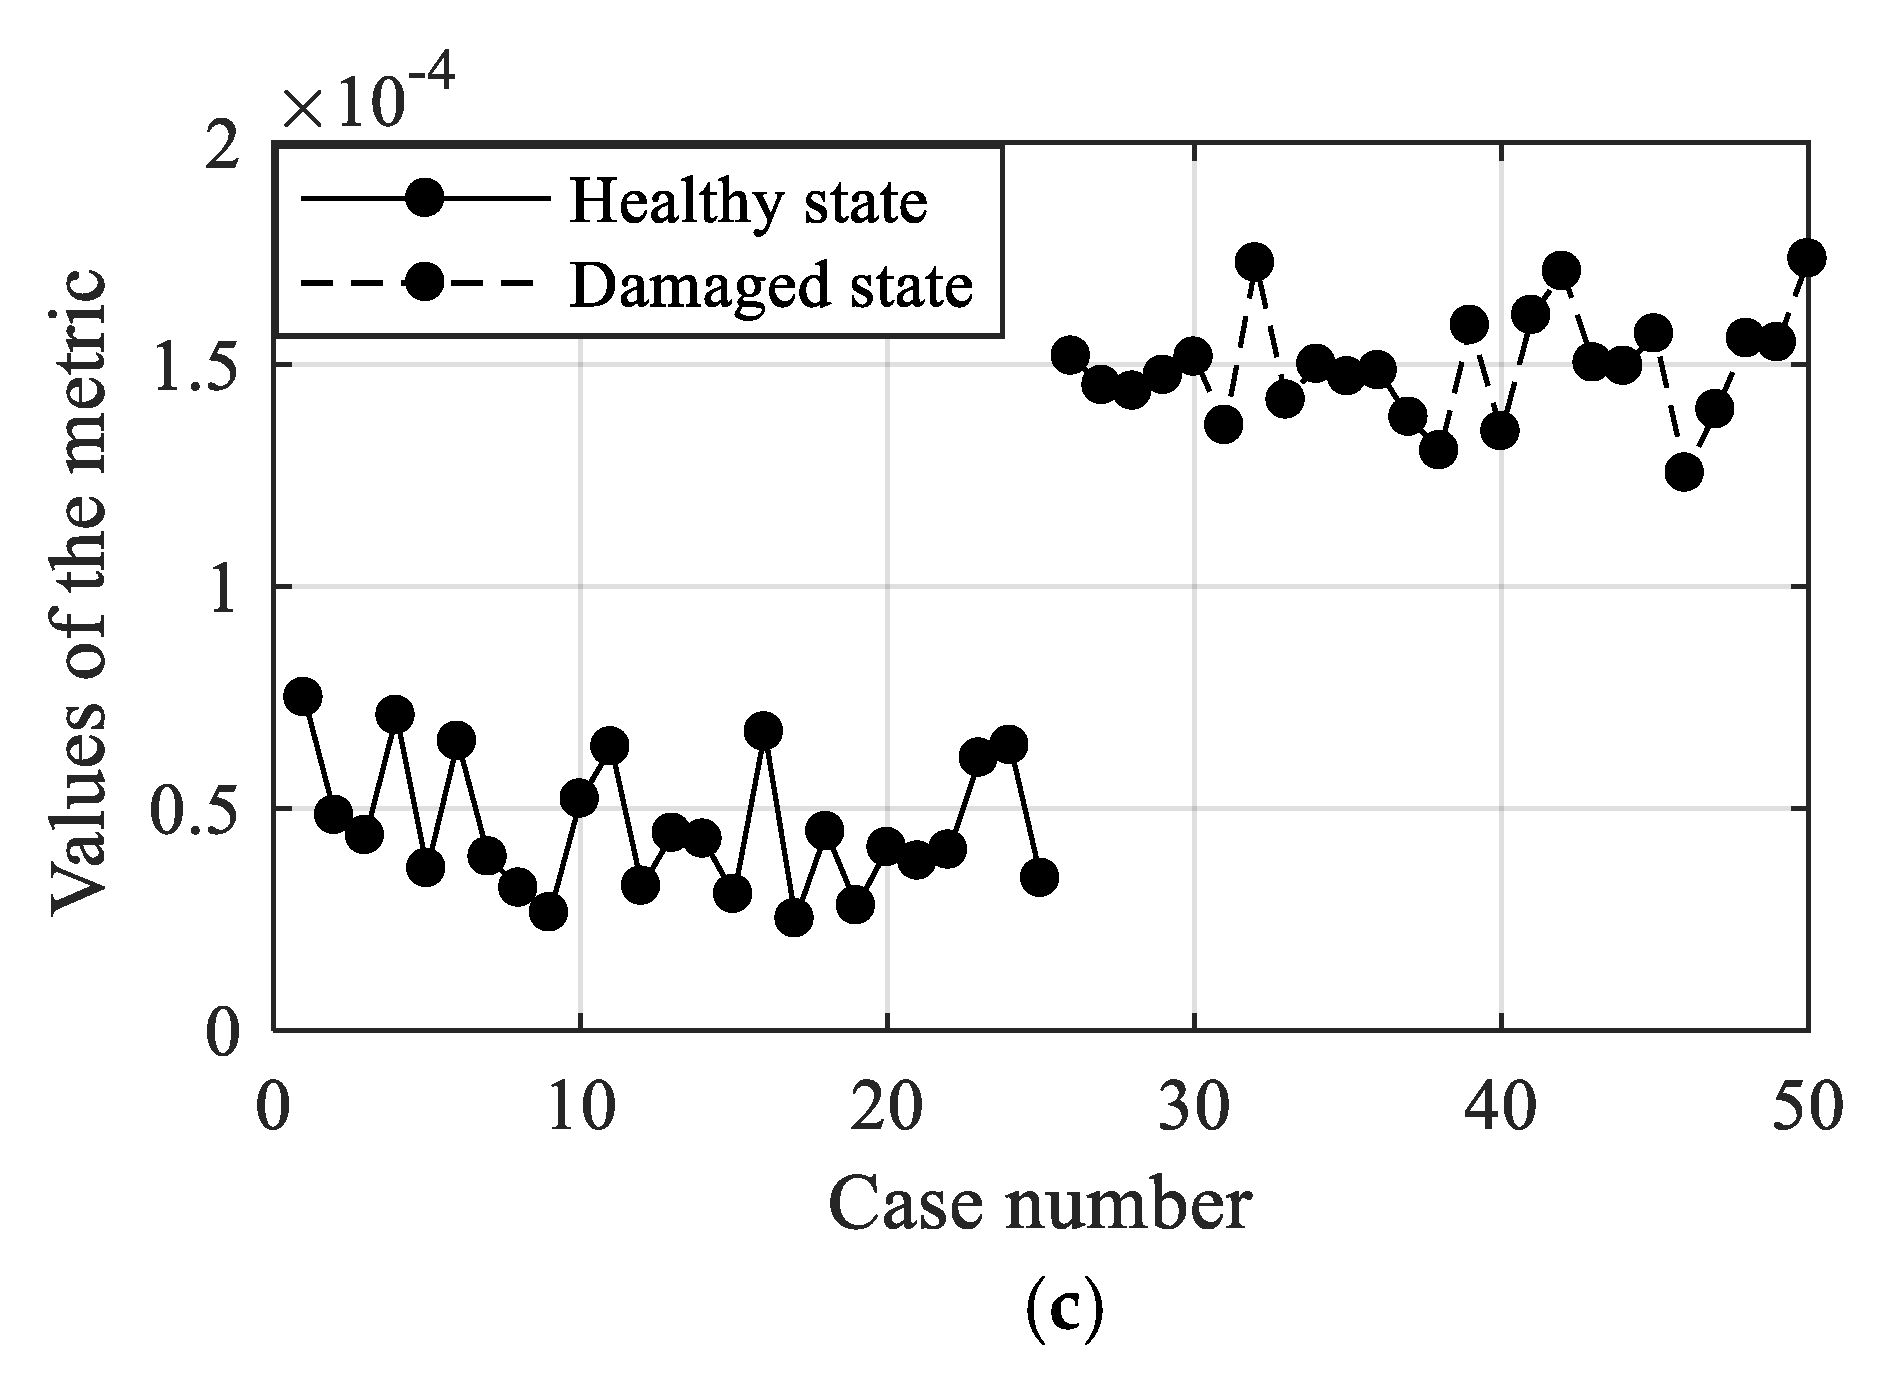
4.3. Comparison of the Experimental Results Between the Proposed Method and the Traditional Method

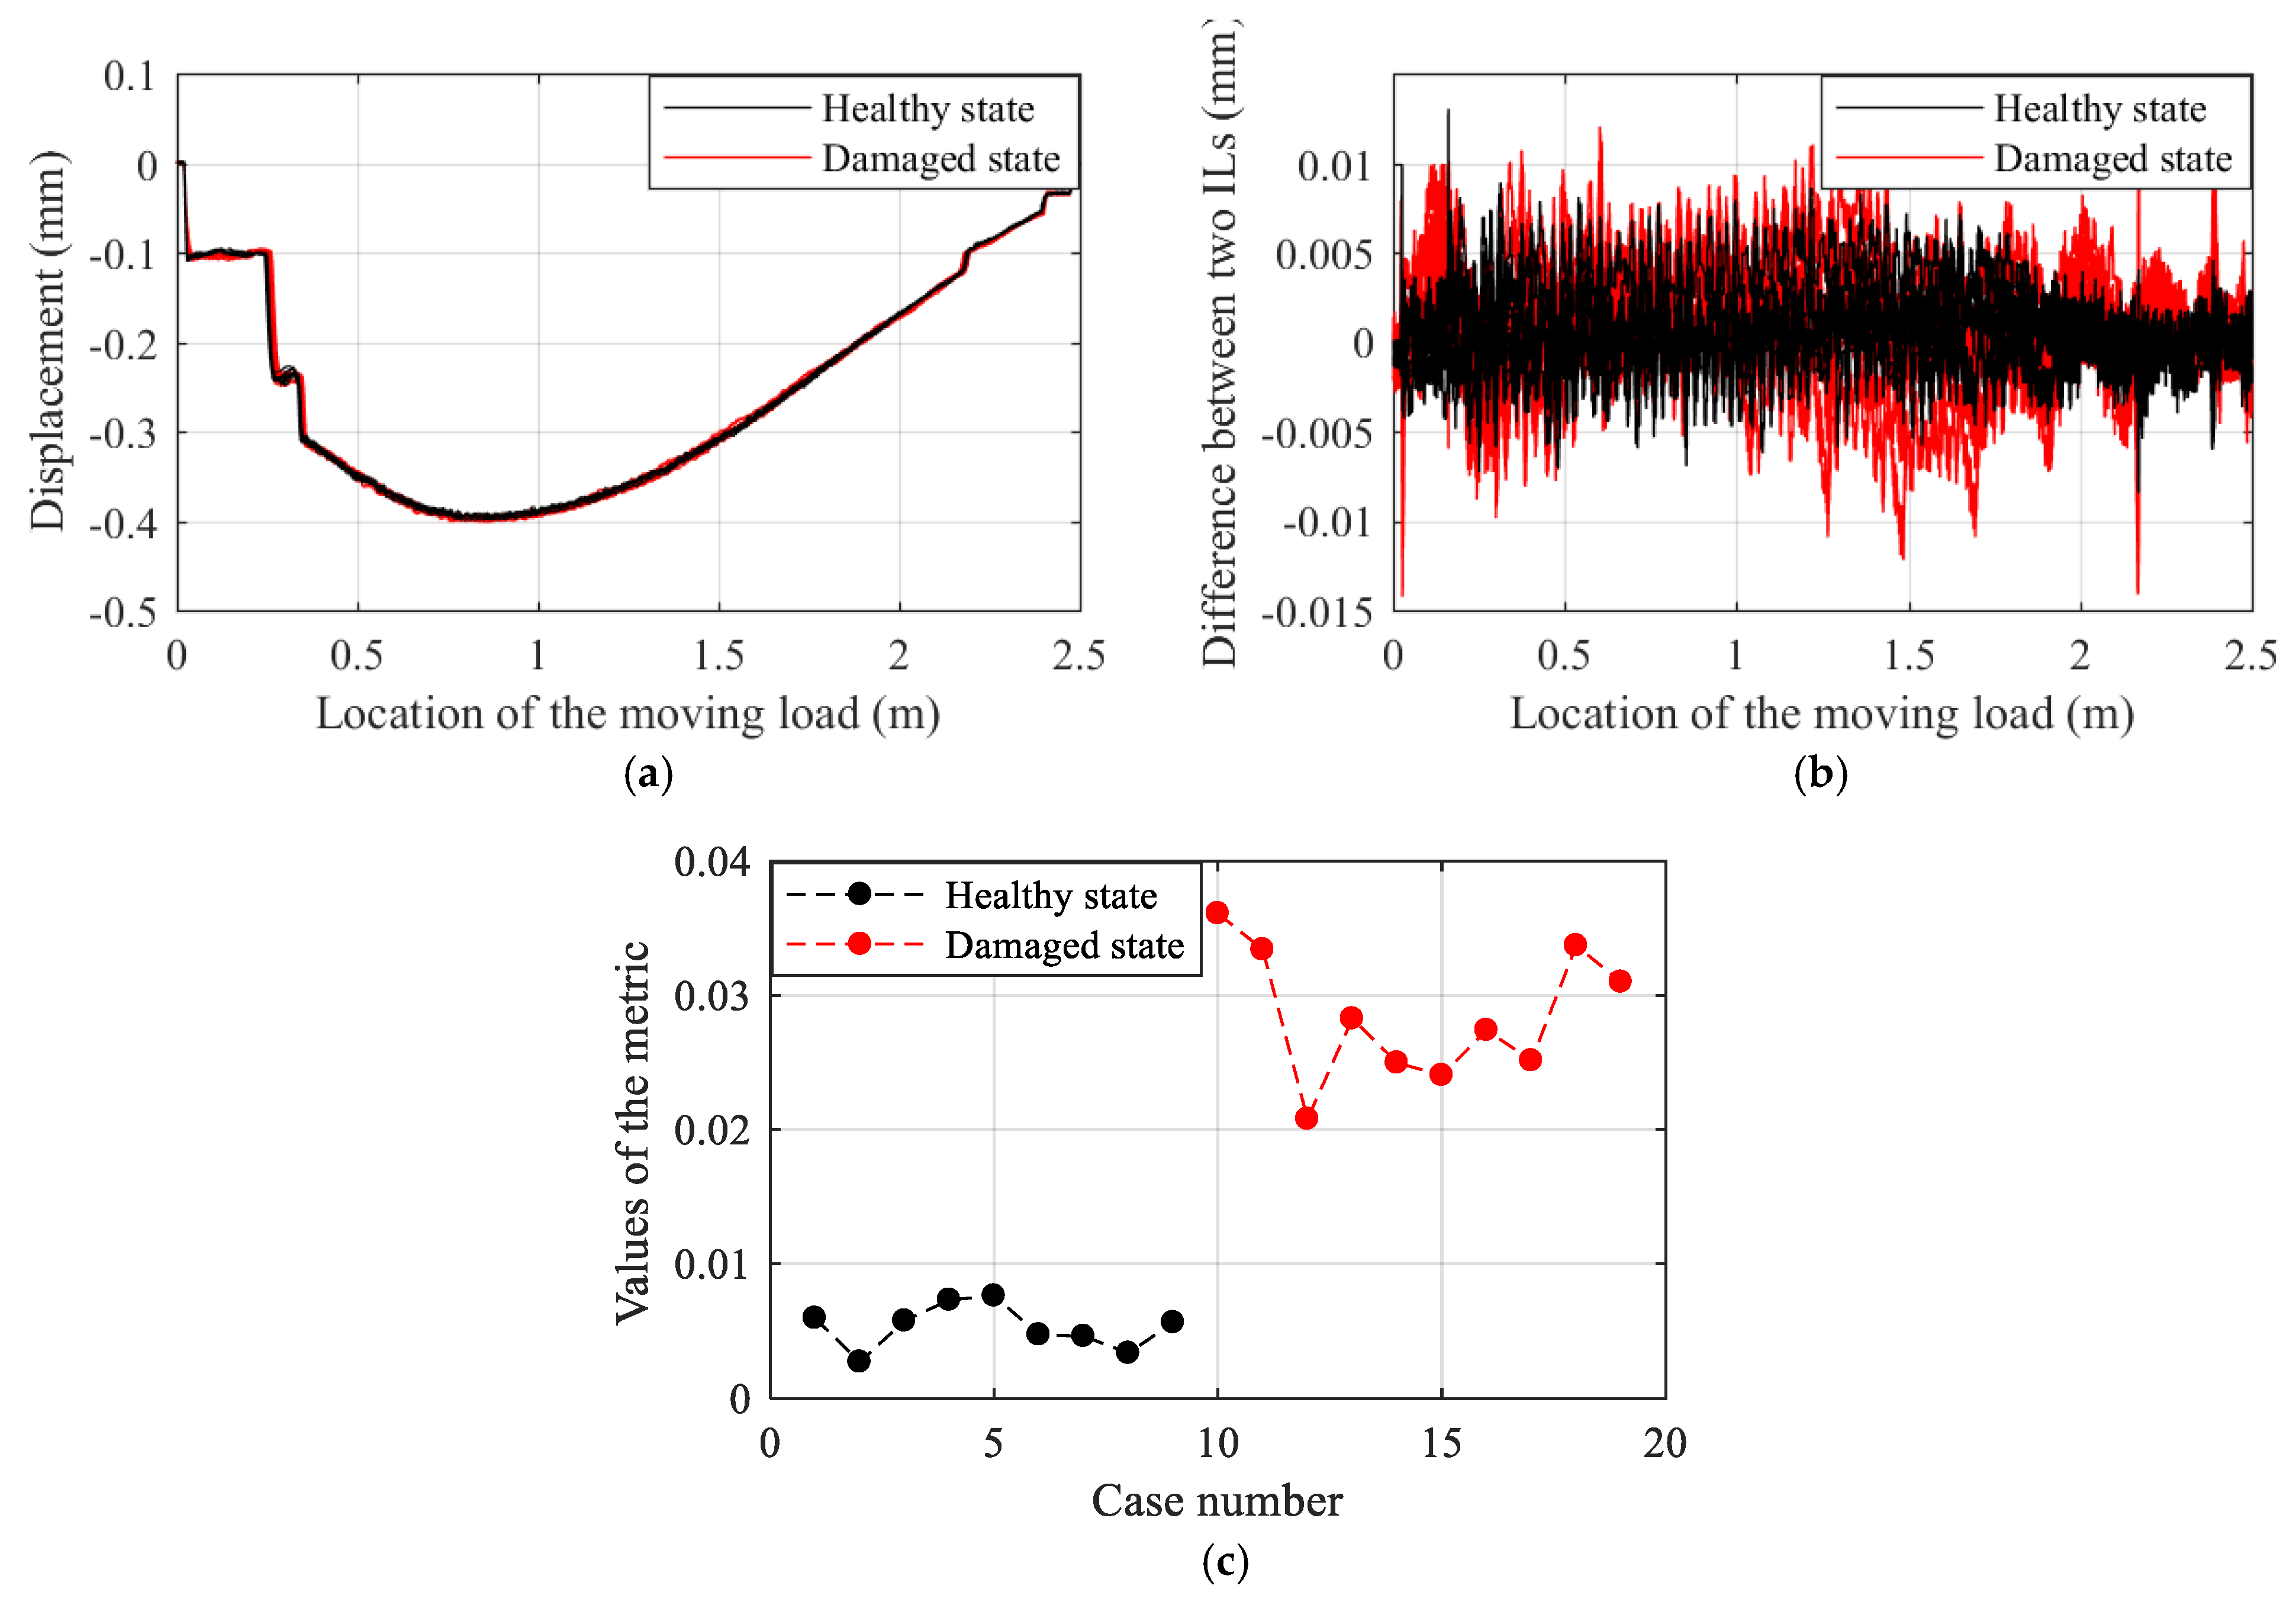
4.3.1. Results with the Same Loading Conditions before and after Damage

In this section, the data obtained from Part I to Part III are used to compare the performance of the proposed method with that of the traditional approach. As shown in Figure 14a, compared with the reference state (case 1), it is difficult to differentiate the displacement ILs between the healthy state (case 2 through case 10) and the damaged state (case 11 through case 20). With the traditional method, the difference between the displacement ILs before and after damage (sensor #10 is randomly selected; note that all displacement ILs of the other sensors have variations that are similar to those of sensor #10) are drawn in Figure 14b. Evidently, the traditional method does not work for this damaged case. The reason for this inefficacy lies in the fact that the quasi-static displacement ILs are no longer smooth curves but volatile curves and thus, the difference in the ILs is no longer sensitive to the damage suffered by the bridge, especially under conditions of small degrees of damage. As discussed in Section 2.2.1, the Hankel matrix of the damage feature contains 22 rows and 24 columns due to the 10 sensors used in this test; the damage feature metrics for the healthy and damaged model bridges are drawn in Figure 14c. The effectiveness of the proposed method is therefore demonstrated by this experimental example.

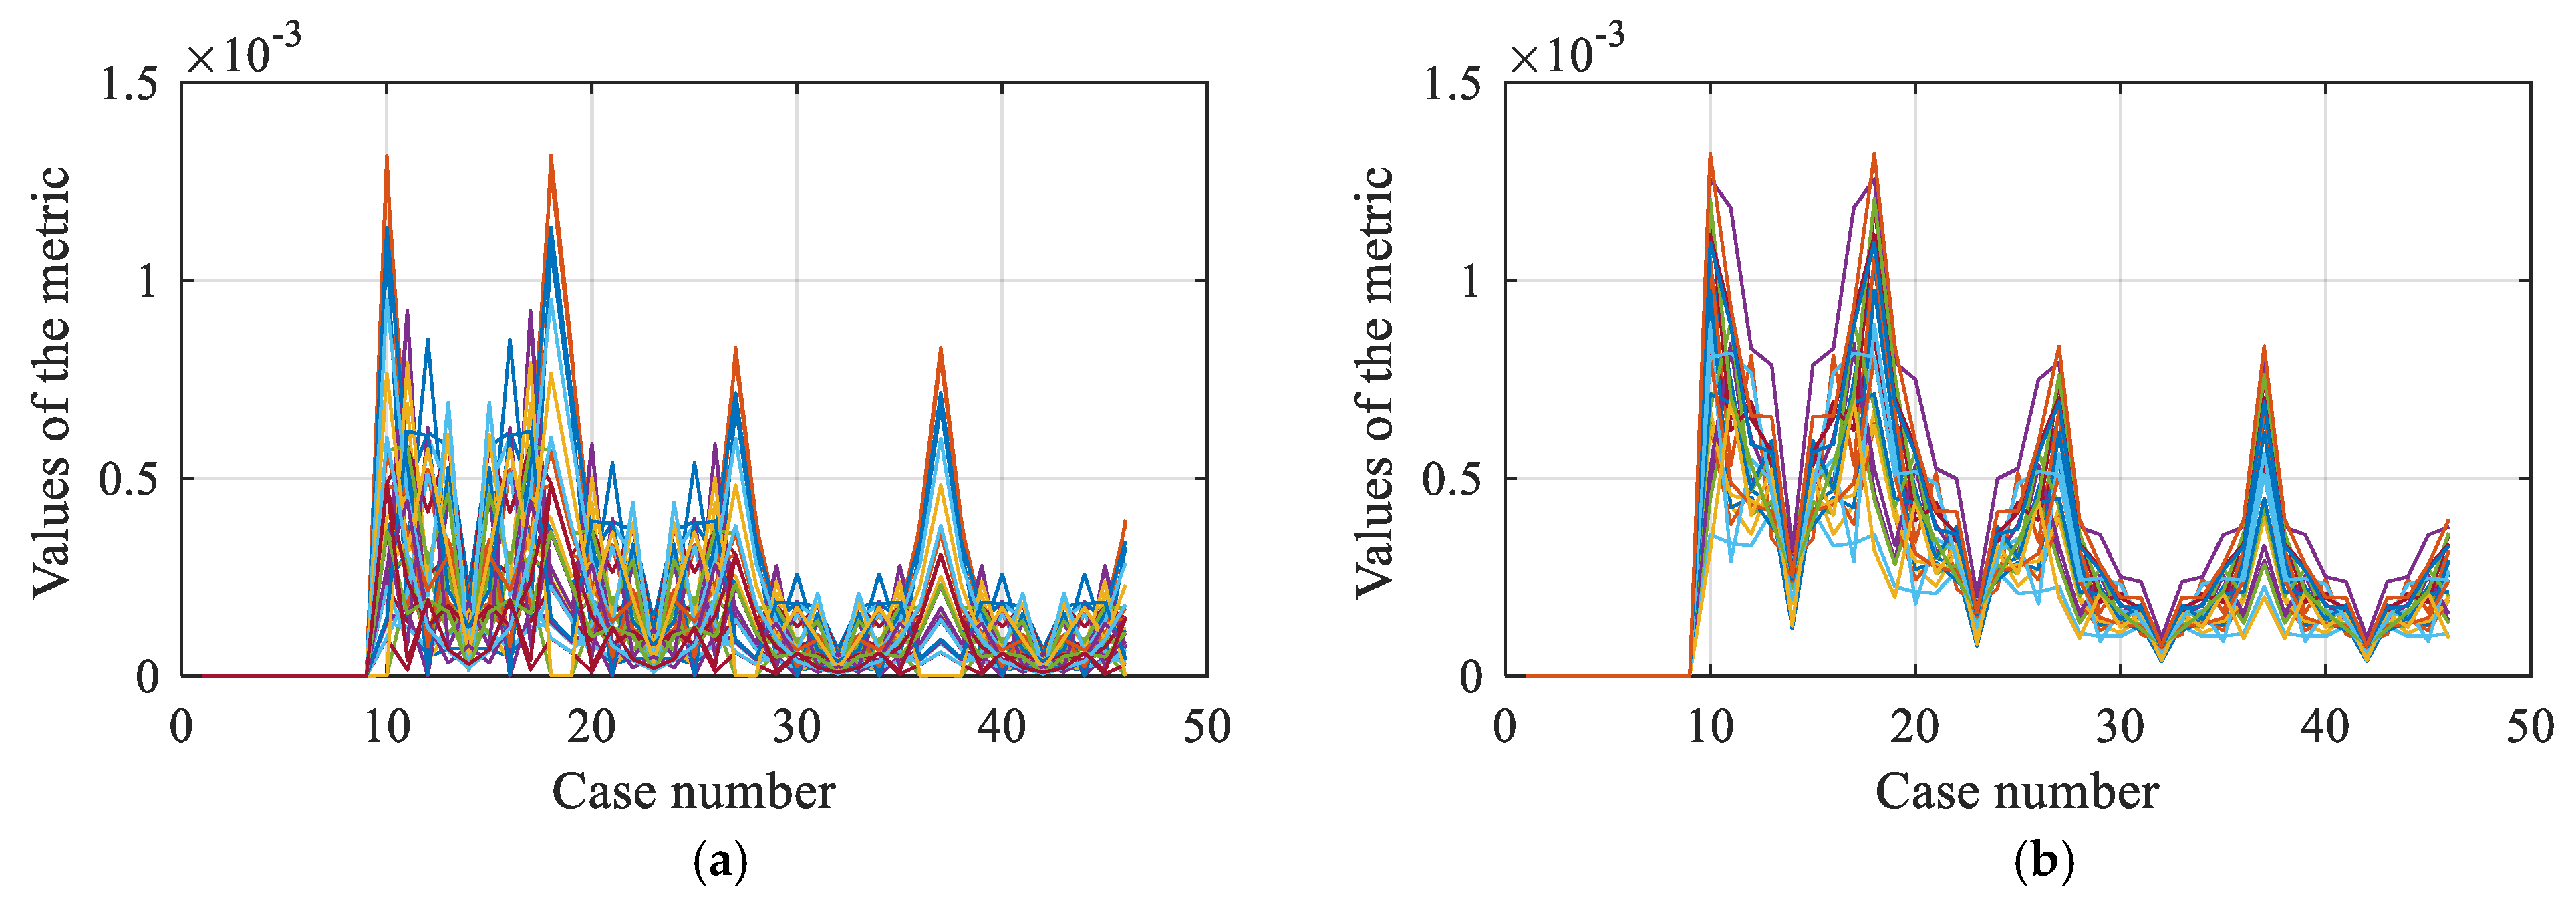
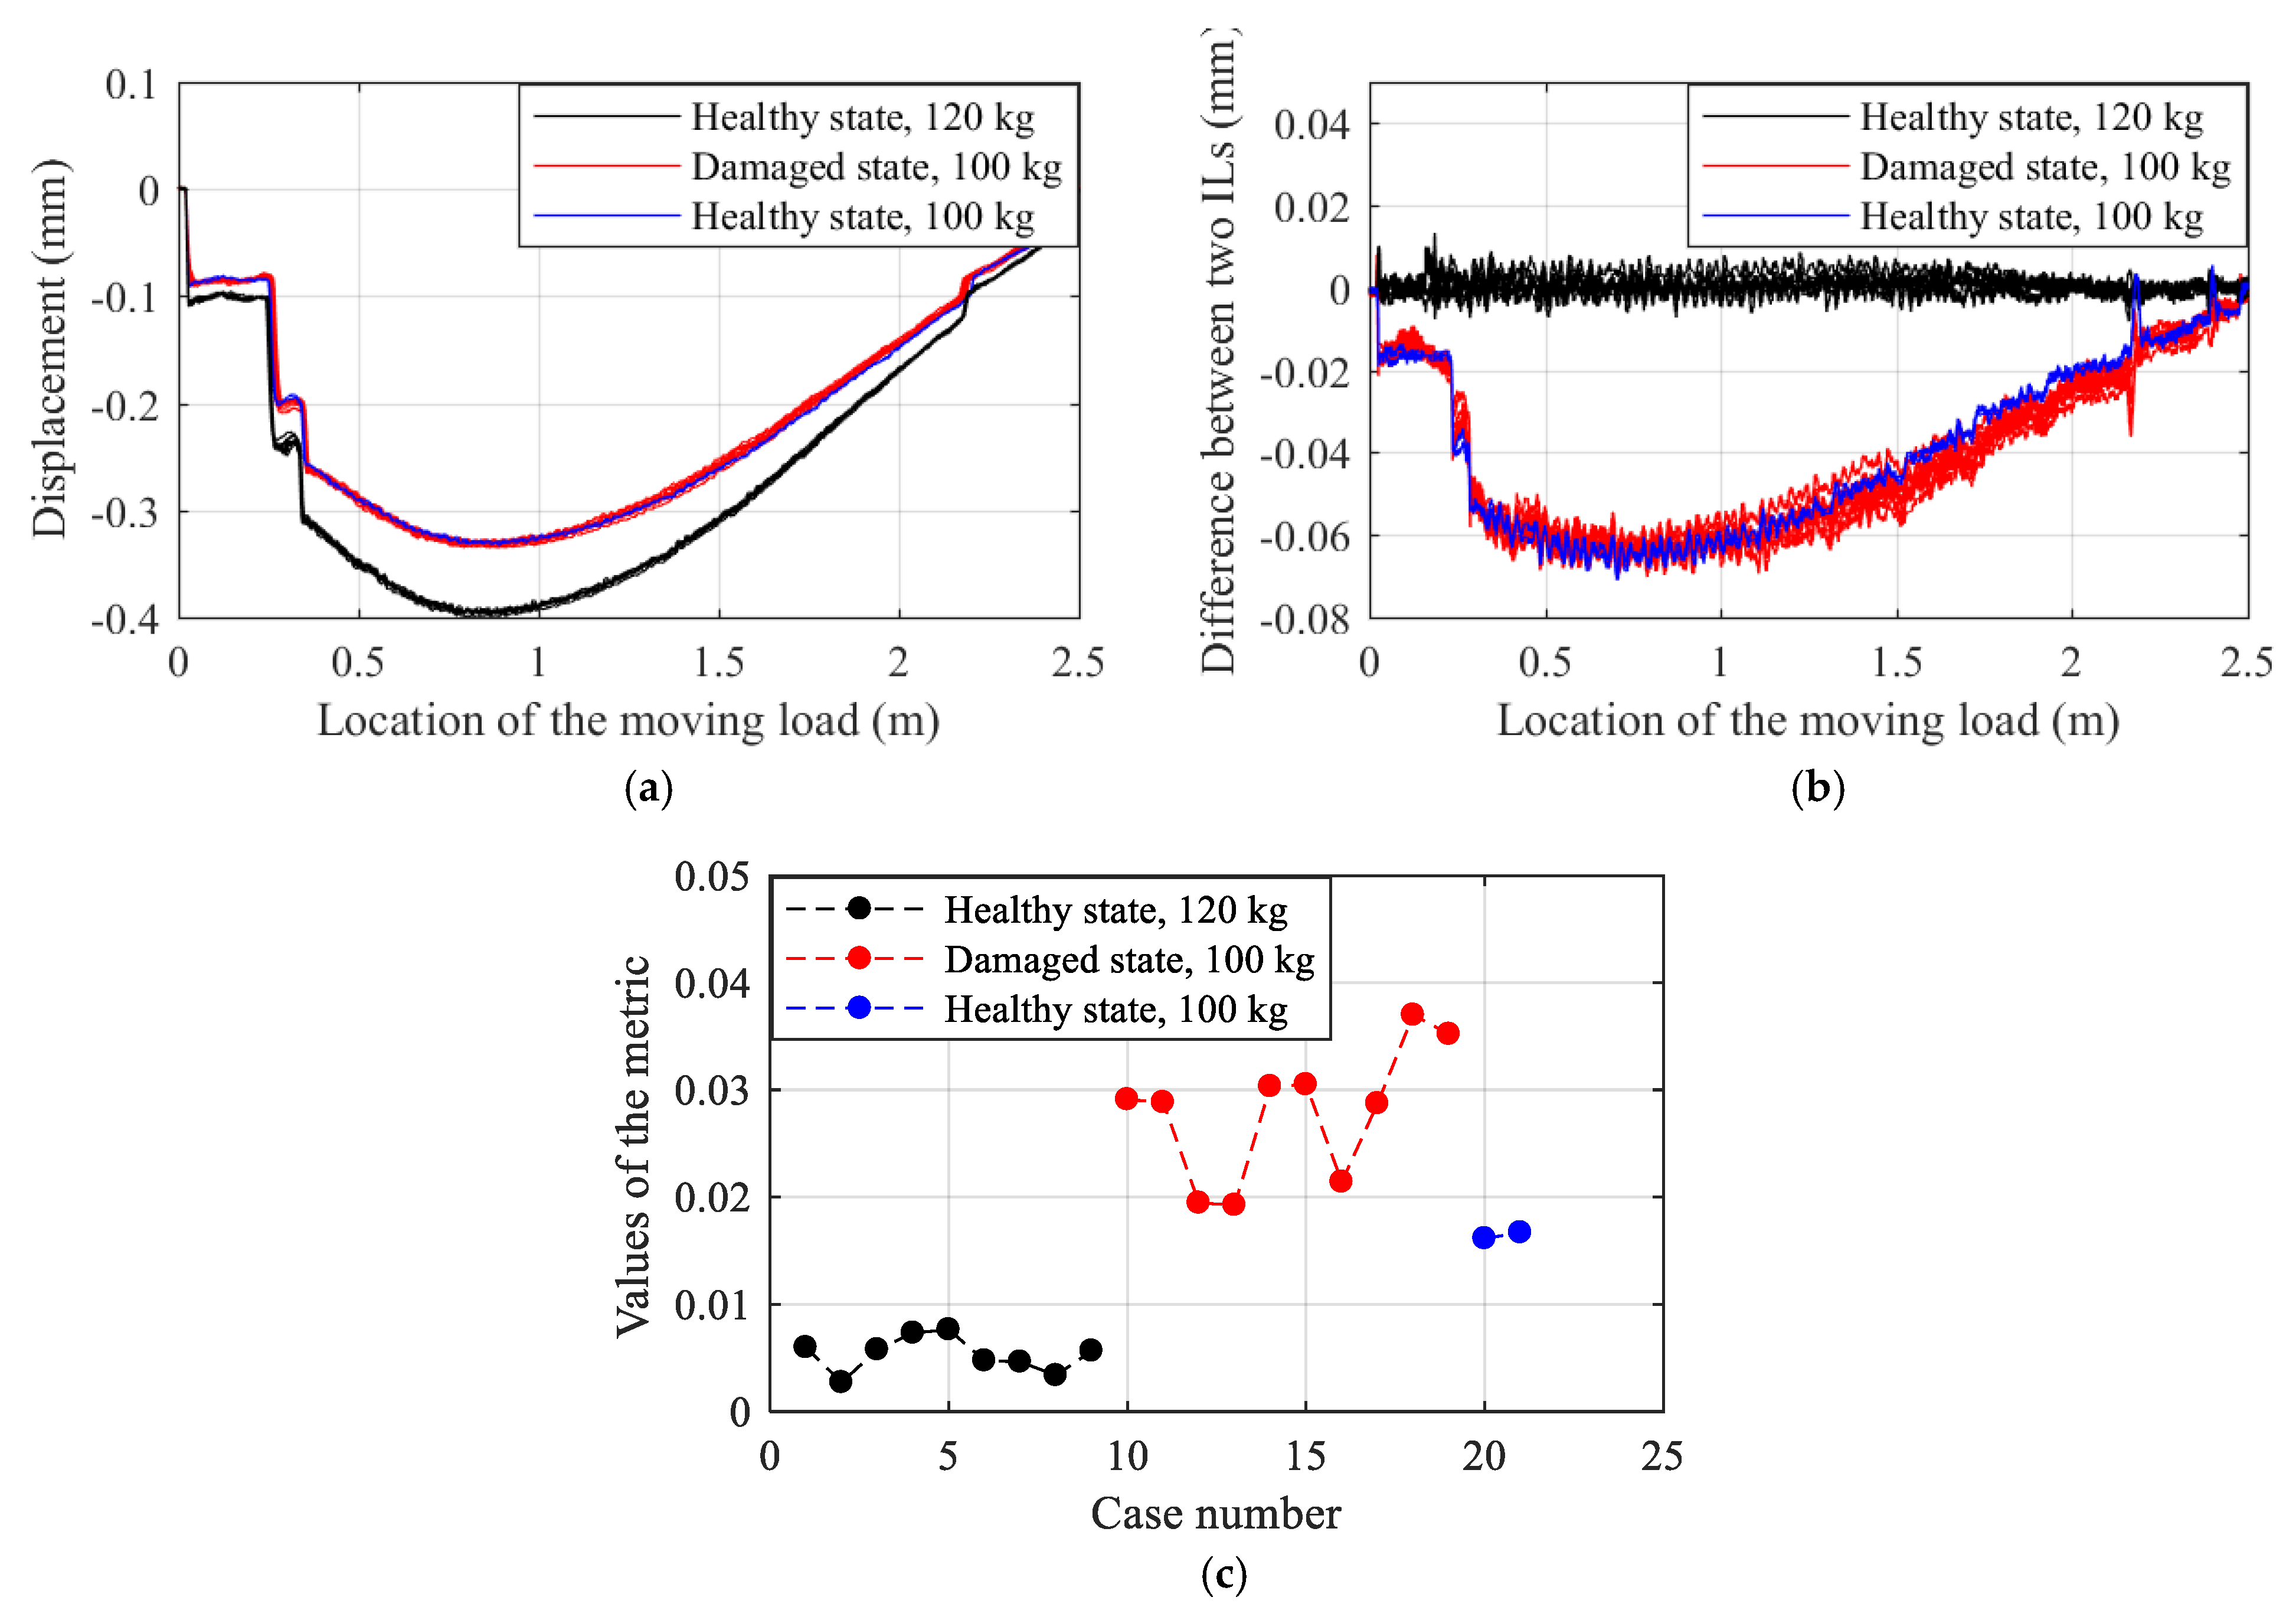
4.3.2. Results with Different Loading Conditions Before and After Damage

The data obtained in Part I, Part IV and Part V are applied here to evaluate the performance of the proposed method and the traditional approach in consideration of the differences in the loading conditions before and after damage (all displacement ILs are shown in Figure 15a). With the traditional method, as shown in Figure 15b, there is an enormous difference in the displacement ILs between Part I and Part IV (sensor #10), that is, the reference and damage states of the bridge; however, it is still necessary to obtain an obvious difference in the displacement ILs between Part I and Part V and therefore, the incorrect determination of damage is drawn. Consequently, the traditional method is invalid for situations involving different loading conditions before and after damage. Using the proposed method, the results drawn in Figure 15c show that damage can be detected even though the loading conditions of the reference state (Part I) and the damaged state (Part IV) are different; moreover, an erroneous determination of damage is avoided for both the reference state (Part I) and the healthy state (Part V). The above discussion demonstrates that the proposed method is more effective and robust than the traditional approach at detecting damage using quasi-static displacement ILs.

5. Conclusions

In this study, a method based on quasi-static displacement ILs is proposed to detect damage in the superstructure of a beam bridge. The following conclusions are drawn:
(i) Based on a previous method [25], an improved method based on the correlation coefficient between quasi-static displacement ILs is proposed and numerical and experimental results show that this method is sensitive to damage in the superstructure of a beam bridge. Furthermore, similar to the previous method, the proposed damage feature is independent of inconsistency in the loading conditions before and after damage. Therefore, the proposed method is suitable for detecting the damage of beam bridges using quasi-static displacement ILs.
(ii) Considering that only a few quasi-static displacement ILs are obtained for actual bridges, we reconstructed the Hankel matrix of the damage feature. The results of numerical and experimental examples show that the new form of the Hankel matrix of the damage feature is beneficial for damage detection and it is robust to the effects of measurement noise.
(iii) A new metric for evaluating the damage feature is proposed. Unlike the previous method [25], the calculation of this metric does not need to be repeated for each measured point of displacement in one load test; thus, the efficiency of damage detection is improved dramatically.
(iv) Unlike the method based on the difference between displacement ILs before and after damage, a certain threshold is adopted in this study to resist the effects of measurement noise on the damage determination.
(v) For the practical application of the proposed method, the measured data, obtained by the first quasi-static load test, have to be utilized to build the data model for reference state, therefore, it cannot detect the damage of bridge for the first load test.

Author Contributions

All authors discussed and agreed upon the idea and made scientific contributions. S.Z. wrote the original paper; Y.L. reviewed and modified the paper.

Funding

This study is supported by the National Key Research & Development Program of China “Strategic International Cooperation in Scientific and Technological Innovation” Key Special Project of 2016 Annual Project (Grant No: 2016YFE0202400) and the Ministry of Housing and Urban-rural Development of China (Grant Nos: 2016-K4-068 and 2015-K5-014).

Conflicts of Interest

The authors declare no conflict of interest.

References

  1. Kong, X.; Cai, C.S.; Hu, J. The state-of-the-art on framework of vibration-based structural damage identification for decision making. Appl. Sci. 2017, 7, 497. [Google Scholar] [CrossRef]
  2. Moughty, J.J.; Casas, J.R. A state of the art review of modal-based damage detection in bridges: Development, challenges, and solutions. Appl. Sci. 2017, 7, 510. [Google Scholar] [CrossRef]
  3. Cao, M.S.; Ding, Y.J.; Ren, W.X.; Wang, Q.; Ragulskis, M.; Ding, Z.C. Hierarchical wavelet-aided neural intelligent identification of structural damage in noisy conditions. Appl. Sci. 2017, 7, 391. [Google Scholar] [CrossRef]
  4. Zhao, H.; Uddin, N.; O’Brien, E.J.; Shao, X.D.; Zhu, P. Identification of vehicular axle weights with a Bridge Weigh-in-Motion system considering transverse distribution of wheel loads. ASCE J. Bridge Eng. 2014, 19, 165–184. [Google Scholar] [CrossRef]
  5. Wang, X.; Hu, N.; Fukunaga, H.; Yao, Z.H. Structural damage identification using static test data and changes in frequencies. Eng. Struct. 2001, 23, 610–621. [Google Scholar] [CrossRef]
  6. Banan, M.R.; Banan, M.R.; Hjelmstad, K.D. Parameter estimation of structures from static response. I: Computational aspects. J. Struct. Eng. 1994, 120, 3243–3258. [Google Scholar] [CrossRef]
  7. Banan, M.R.; Banan, M.R.; Hjelmstad, K.D. Parameter estimation of structures from static response. II: Numerical simulation studies. J. Struct. Eng. 1994, 120, 3259–3283. [Google Scholar] [CrossRef]
  8. Abdo, M.A.B. Parametric study of using only static response in structural damage detection. Eng. Struct. 2012, 34, 124–131. [Google Scholar] [CrossRef]
  9. Guo, T.; Li, A.Q.; Song, Y.S.; Zhang, B.; Liu, Y.; Yu, N.S. Experimental study on strain and deformation monitoring of reinforced concrete structures using PPP-BOTDA. Sci. China Ser. E Technol. Sci. 2009, 52, 2859–2868. [Google Scholar] [CrossRef]
  10. Yang, Q.W. A new damage identification method based on structural flexibility disassembly. J. Vib. Control 2011, 17, 1000–1008. [Google Scholar] [CrossRef]
  11. Yang, Q.W.; Liu, J.K. Damage identification by the eigenparameter decomposition of structural flexibility change. Int. J. Numer. Methods Eng. 2009, 78, 444–459. [Google Scholar] [CrossRef]
  12. Choi, I.Y.; Lee, J.S.; Choi, E.; Cho, N.H. Development of elastic damage load theorem for damage detection in a statically determinate beam. Comput. Struct. 2004, 82, 2483–2492. [Google Scholar] [CrossRef]
  13. Wang, C.Y.; Huang, C.K.; Chen, C.S. Damage assessment of beam by a quasi-static moving vehicular load. Adv. Adapt. Data Anal. 2011, 3, 417–445. [Google Scholar] [CrossRef]
  14. Grandić, I.Š.; Grandić, D.; Bjelanović, A. Comparison of techniques for damage identification based on influence line approach. Mach. Technol. Mater. 2011, 7, 9–13. [Google Scholar]
  15. Štimac, I.; Mihanović, A.; Kožar, I. Damage detection from analysis of displacement influence lines. In Proceedings of the International Conference on Bridges, Dubrovnik, Croatia, 21–24 May 2006; pp. 1001–1008. [Google Scholar]
  16. Chen, Z.W.; Zhu, S.; Xu, Y.L.; Li, Q.; Cai, Q.L. Damage detection in long suspension bridges using stress influence lines. J. Bridge Eng. 2014, 20, 05014013. [Google Scholar] [CrossRef]
  17. Zeinali, Y.; Story, B.A. Impairment localization and quantification using noisy static deformation influence lines and Iterative Multi-parameter Tikhonov Regularization. Mech. Syst. Signal Process. 2018, 109, 399–419. [Google Scholar] [CrossRef]
  18. Zeinali, Y.; Story, B.A. Framework for Flexural Rigidity Estimation in Euler-Bernoulli Beams Using Deformation Influence Lines. Infrastructures 2017, 2, 23. [Google Scholar] [CrossRef]
  19. Zaurin, R.; Catbas, F.N. Integration of computer imaging and sensor data for structural health monitoring of bridges. Smart Mater. Struct. 2009, 19, 1–15. [Google Scholar] [CrossRef]
  20. Zaurin, R.; Catbas, F.N. Structural health monitoring using video stream, influence lines, and statistical analysis. Struct. Health Monit. 2011, 10, 309–332. [Google Scholar] [CrossRef]
  21. He, W.Y.; Ren, W.X.; Zhu, S. Damage detection of beam structures using quasi-static moving load induced displacement response. Eng. Struct. 2017, 145, 70–82. [Google Scholar] [CrossRef]
  22. He, W.Y.; Zhu, S. Moving load-induced response of a damaged simply-supported beam and its application in damage localization. J. Vib. Control 2016, 22, 3601–3617. [Google Scholar] [CrossRef]
  23. He, W.Y.; Ren, W.X.; Zhu, S. Baseline-free damage localization method for statically determinate beam structures using dual-type response induced by quasi-static moving load. J. Sound Vib. 2017, 400, 58–70. [Google Scholar] [CrossRef]
  24. Cavadas, F.; Smith, I.F.C.; Figueiras, J. Damage detection using data-driven methods applied to moving-load responses. Mech. Syst. Signal Process. 2013, 39, 409–425. [Google Scholar] [CrossRef] [Green Version]
  25. Liu, Y.; Zhang, S. Damage Localization of Beam Bridges Using Quasi-Static Strain Influence Lines Based on the BOTDA Technique. Sensors 2018, 18, 4446. [Google Scholar] [CrossRef]
  26. Chen, Z.; Li, Q.; Ansari, F.; Mendez, A. Serial multiplexing of optical fibers for sensing of structural strains. J. Struct. Control 2000, 7, 103–117. [Google Scholar] [CrossRef]
  27. Bao, X.; DeMerchant, M.; Brown, A.; Bremner, T. Tensile and compressive strain measurement in the lab and field with the distributed Brillouin scattering sensor. J. Lightwave Technol. 2001, 19, 1698–1704. [Google Scholar]
  28. Kaloop, M.; Hu, J.; Elbeltagi, E. Evaluation of high-speed railway bridges based on a nondestructive monitoring system. Appl. Sci. 2016, 6, 24. [Google Scholar] [CrossRef]
  29. Kong, Q.; Robert, R.; Silva, P.; Mo, Y. Cyclic crack monitoring of a reinforced concrete column under simulated pseudo-dynamic loading using piezoceramic-based smart aggregates. Appl. Sci. 2016, 6, 341. [Google Scholar] [CrossRef]
  30. Kordestani, H.; Xiang, Y.Q.; Ye, X.W.; Jia, Y.K. Application of the random decrement technique in damage detection under moving load. Appl. Sci. 2018, 8, 753. [Google Scholar] [CrossRef]
  31. Markou, M.; Singh, S. Novelty detection: A review-part 1: Statistical approaches. Signal Process. 2003, 83, 2481–2497. [Google Scholar] [CrossRef]
  32. Pimentel, M.A.F. A review of novelty detection. Signal Process. 2014, 99, 215–249. [Google Scholar] [CrossRef]
  33. Surace, C.; Worden, K. Novelty detection in a changing environment: A negative selection approach. Mech. Syst. Signal Process. 2010, 24, 1114–1128. [Google Scholar] [CrossRef]
  34. Worden, K.; Sohn, H.; Farrar, C.R. Novelty detection in a changing environment: Regression and interpolation approaches. J. Sound Vib. 2002, 258, 741–761. [Google Scholar] [CrossRef]
Figure 1. Schematic of the quasi-static load test of a bridge.
Applsci 09 01805 g001
Figure 2. Diagram of the proposed damage detection method.
Applsci 09 01805 g002
Figure 3. Finite element model of a simply supported bridge.
Applsci 09 01805 g003
Figure 4. Comparison of the metric values of the different cases.
Applsci 09 01805 g004
Figure 5. Displacement influence lines (ILs) obtained by 9 sensors for a healthy bridge.
Applsci 09 01805 g005
Figure 6. Comparison of the damage detection performance between the traditional method and the proposed method before and after damage without the effect of measurement noise: (a) displacement ILs; (b) difference between two displacement ILs obtained by the traditional method; (c) metric of the damage feature obtained by the proposed method.
Applsci 09 01805 g006
Figure 7. Comparison of the damage detection performance between the traditional method and the proposed method before and after damage with a 1.6% noise level: (a) displacement ILs; (b) difference between two displacement ILs obtained by the traditional method; (c) metric of the damage feature obtained by the proposed method.
Applsci 09 01805 g007aApplsci 09 01805 g007b
Figure 8. Comparison of the damage detection performance between the traditional method and the proposed method before and after damage with a 1.6% noise level (with vehicle weights of 100 kN and 50 kN before and after damage, respectively): (a) displacement ILs; (b) difference between two displacement ILs obtained by the traditional method; (c) metric of the damage feature obtained by the proposed method.
Applsci 09 01805 g008aApplsci 09 01805 g008b
Figure 9. Damage detection results: (a) p is equal to 1; (b) p is equal to 7; (c) p is equal to 17.
Applsci 09 01805 g009aApplsci 09 01805 g009b
Figure 10. Photo of the entire experimental system of the model bridge.
Applsci 09 01805 g010
Figure 11. Detailed drawing of the cross-section of the three main beams of the model bridge (unit: mm).
Applsci 09 01805 g011
Figure 12. Placement of the sensors and device simulating the damage of the transverse connection (unit: cm).
Applsci 09 01805 g012
Figure 13. Photo of the devices designed to simulate the damage of the transverse connection between the two T-shaped beams.
Applsci 09 01805 g013
Figure 14. Comparison of the damage detection performance between the traditional method and the proposed method under the same loading conditions before and after damage: (a) measured displacement ILs; (b) difference between the measured displacement ILs by the traditional method; (c) metric of the damage feature by the proposed method.
Applsci 09 01805 g014
Figure 15. Comparison of the damage detection performance between the traditional method and the proposed method under different loading conditions before and after damage: (a) measured displacement ILs; (b) difference between the measured displacement ILs obtained by the traditional method; (c) metric of the damage feature obtained by the proposed method.
Applsci 09 01805 g015
Table 1. Parameters used for the finite element model of the simply supported bridge.
ItemYoung’s Modulus of C50 ConcreteBending Moment of InertiaTorsional Moment of Inertia
Value of parameter3.497 × 107 kN/m22.395 × 10−2 m44.353 × 10−2 m4
Table 2. Comparison of the metrics of the damage features of the different cases.
Damage LocationExtent of DamageMetricExtent of DamageMetricExtent of DamageMetricExtent of DamageMetric
3 m0%9.992 × 10−1615%4.306 × 10−410%2.701 × 10−45%1.275 × 10⁻⁴
6 m0%1.129 × 10−1515%4.359 × 10−410%2.751 × 10−45%1.305 × 10⁻⁴
9 m0%1.073 × 10−1515%3.333 × 10−410%2.121 × 10−45%1.015 × 10⁻⁴
12 m0%1.415 × 10−1515%4.187 × 10−410%2.664 × 10−45%1.274 × 10⁻⁴
15 m0%1.169 × 10−1515%1.494 × 10−410%9.497 × 10−55%4.538 × 10⁻⁵
18 m0%1.170 × 10−1515%4.187 × 10−410%2.664 × 10−45%1.274 × 10⁻⁴
21 m0%1.104 × 10−1515%3.333 × 10−410%2.121 × 10−45%1.015 × 10⁻⁴
24 m0%1.160 × 10−1515%4.359 × 10−410%2.751 × 10−45%1.305 × 10⁻⁴
27 m0%1.228 × 10−1515%4.306 × 10−410%2.701 × 10−45%1.275 × 10⁻⁴
Note: For the cases of 5% extent of damage, the metric values are the same for two different quasi-static loads and thus, only the results of one group (9 cases) are shown in the last one column.
Table 3. Description of all cases for the quasi-static load test of the model bridge.
Case ConditionsCase Results
Damage extent5%5%5%5%5%5%5%5%5%5%5%
Noise level1.2%1.6%2.0%2.4%2.8%3.2%3.6%4.0%4.4%4.8%5.2%
Traditional methodYesNoNoNoNoNoNoNoNoNoNo
Proposed methodYesYesYesYesYesYesYesYesYesYesNo
Extent of damage10%10%10%10%10%10%10%10%10%10%10%
Noise level2.4%3.2%4.0%4.8%5.6%6.4%7.2%8.0%8.8%9.6%10.4%
Traditional methodYesNoNoNoNoNoNoNoNoNoNo
Proposed methodYesYesYesYesYesYesYesYesYesYesNo
Extent of damage15%15%15%15%15%15%15%15%15%15%15%
Noise level3.6%4.8%6.0%7.2%8.4%9.6%10.4%12.0%13.2%14.4%15.6%
Traditional methodYesNoNoNoNoNoNoNoNoNoNo
Proposed methodYesYesYesYesYesYesYesYesYesYesNo
Table 4. Description of all cases for the quasi-static load tests on the model bridge.
Case NumberDescription of CaseCase NumberDescription of CaseCase NumberDescription of Case
Case 1Healthy bridge; 120 kg moving vehicleCase 13 ~ Case 14Remove #4 transverse connection; 120 kg moving vehicleCase 19 ~ Case 20Remove #10 transverse connection; 120 kg moving vehicle
Case 2 ~ Case 10Healthy bridge; 120 kg moving vehicleCase 15 ~ Case 16Remove #6 transverse connection; 120 kg moving vehicleCase 21 ~ Case 30Repeat cases 11-20; 100 kg moving vehicle
Case 11 ~ Case 12Remove #2 transverse connection; 120 kg moving vehicleCase 17 ~ Case 18Remove #8 transverse connection; 120 kg moving vehicleCase 31 ~ Case 32Healthy bridge; 100 kg moving vehicle

