The Size Effect on Flexural Fracture of Polyolefin Fibre-Reinforced Concrete

 ,
,  , ,
, ,  and
and
Abstract
:1. Introduction
2. Experimental Programme
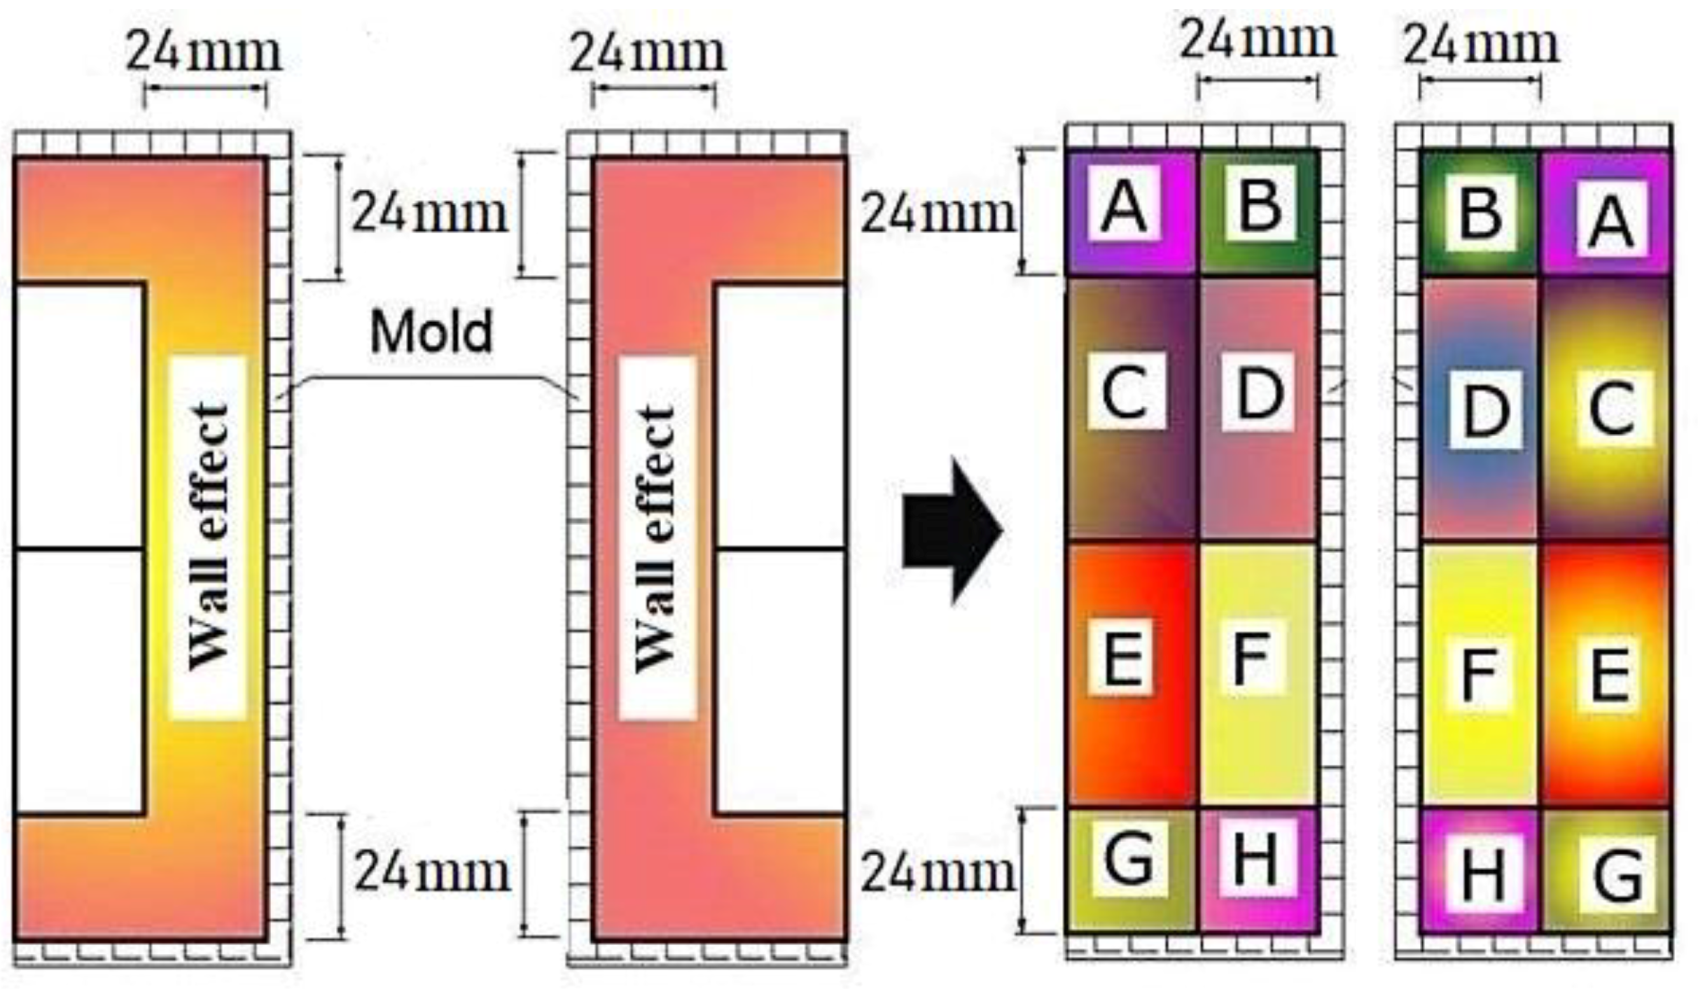
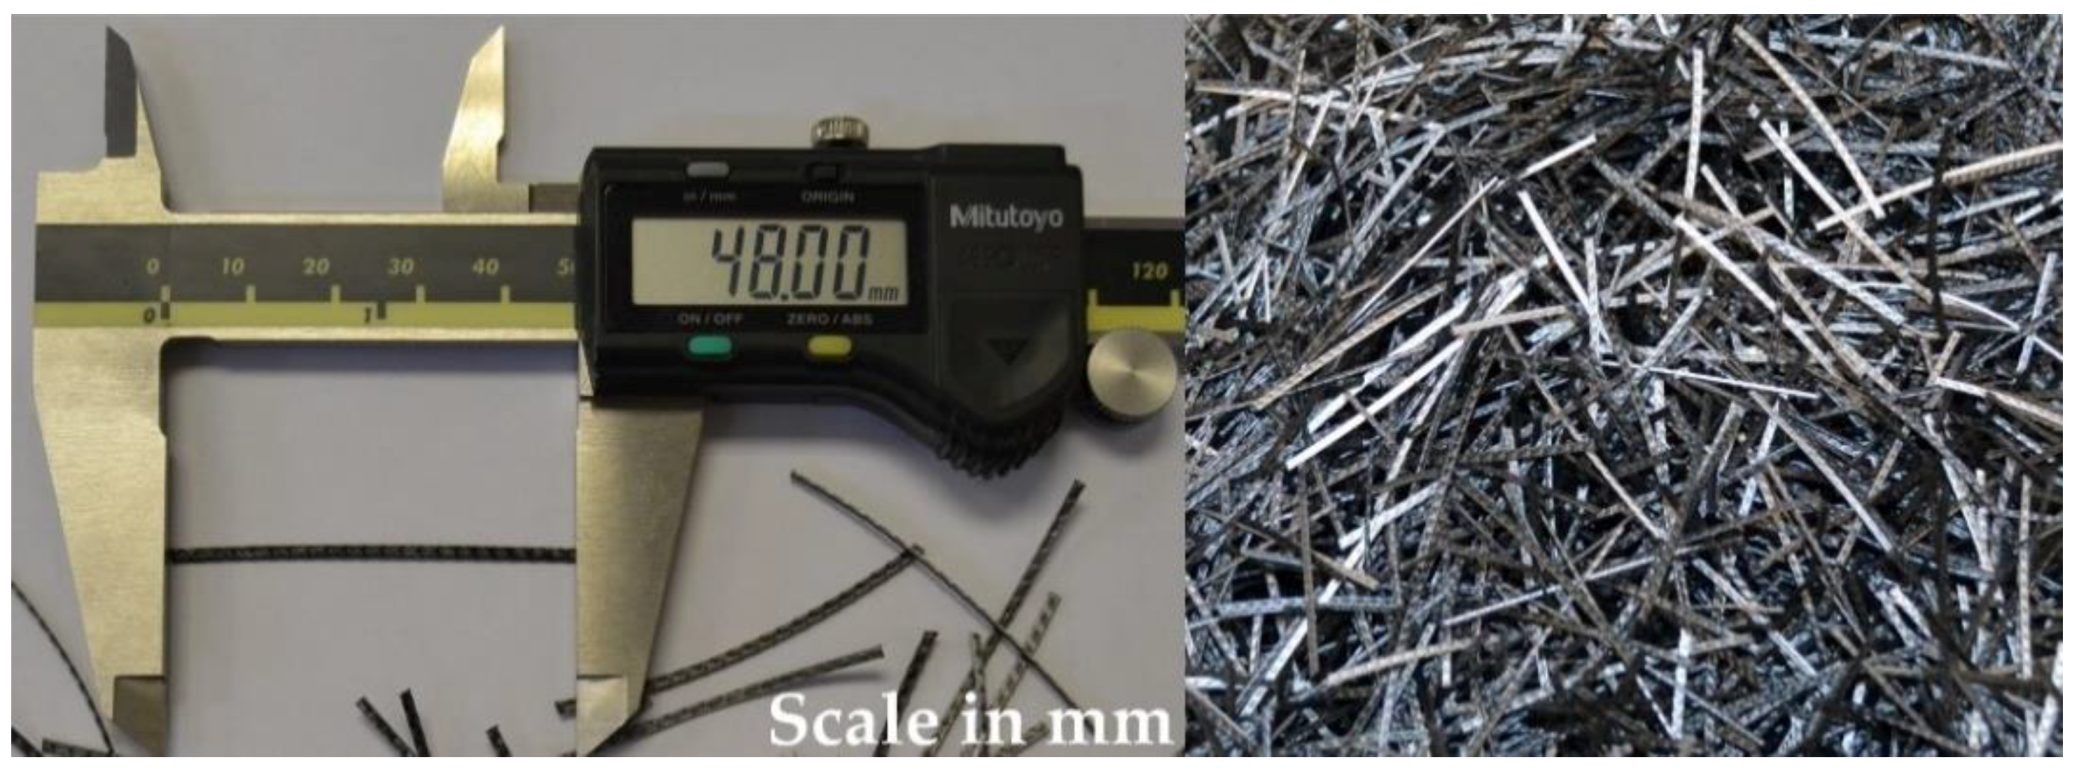
2.1. Materials and Specimen Fabrication
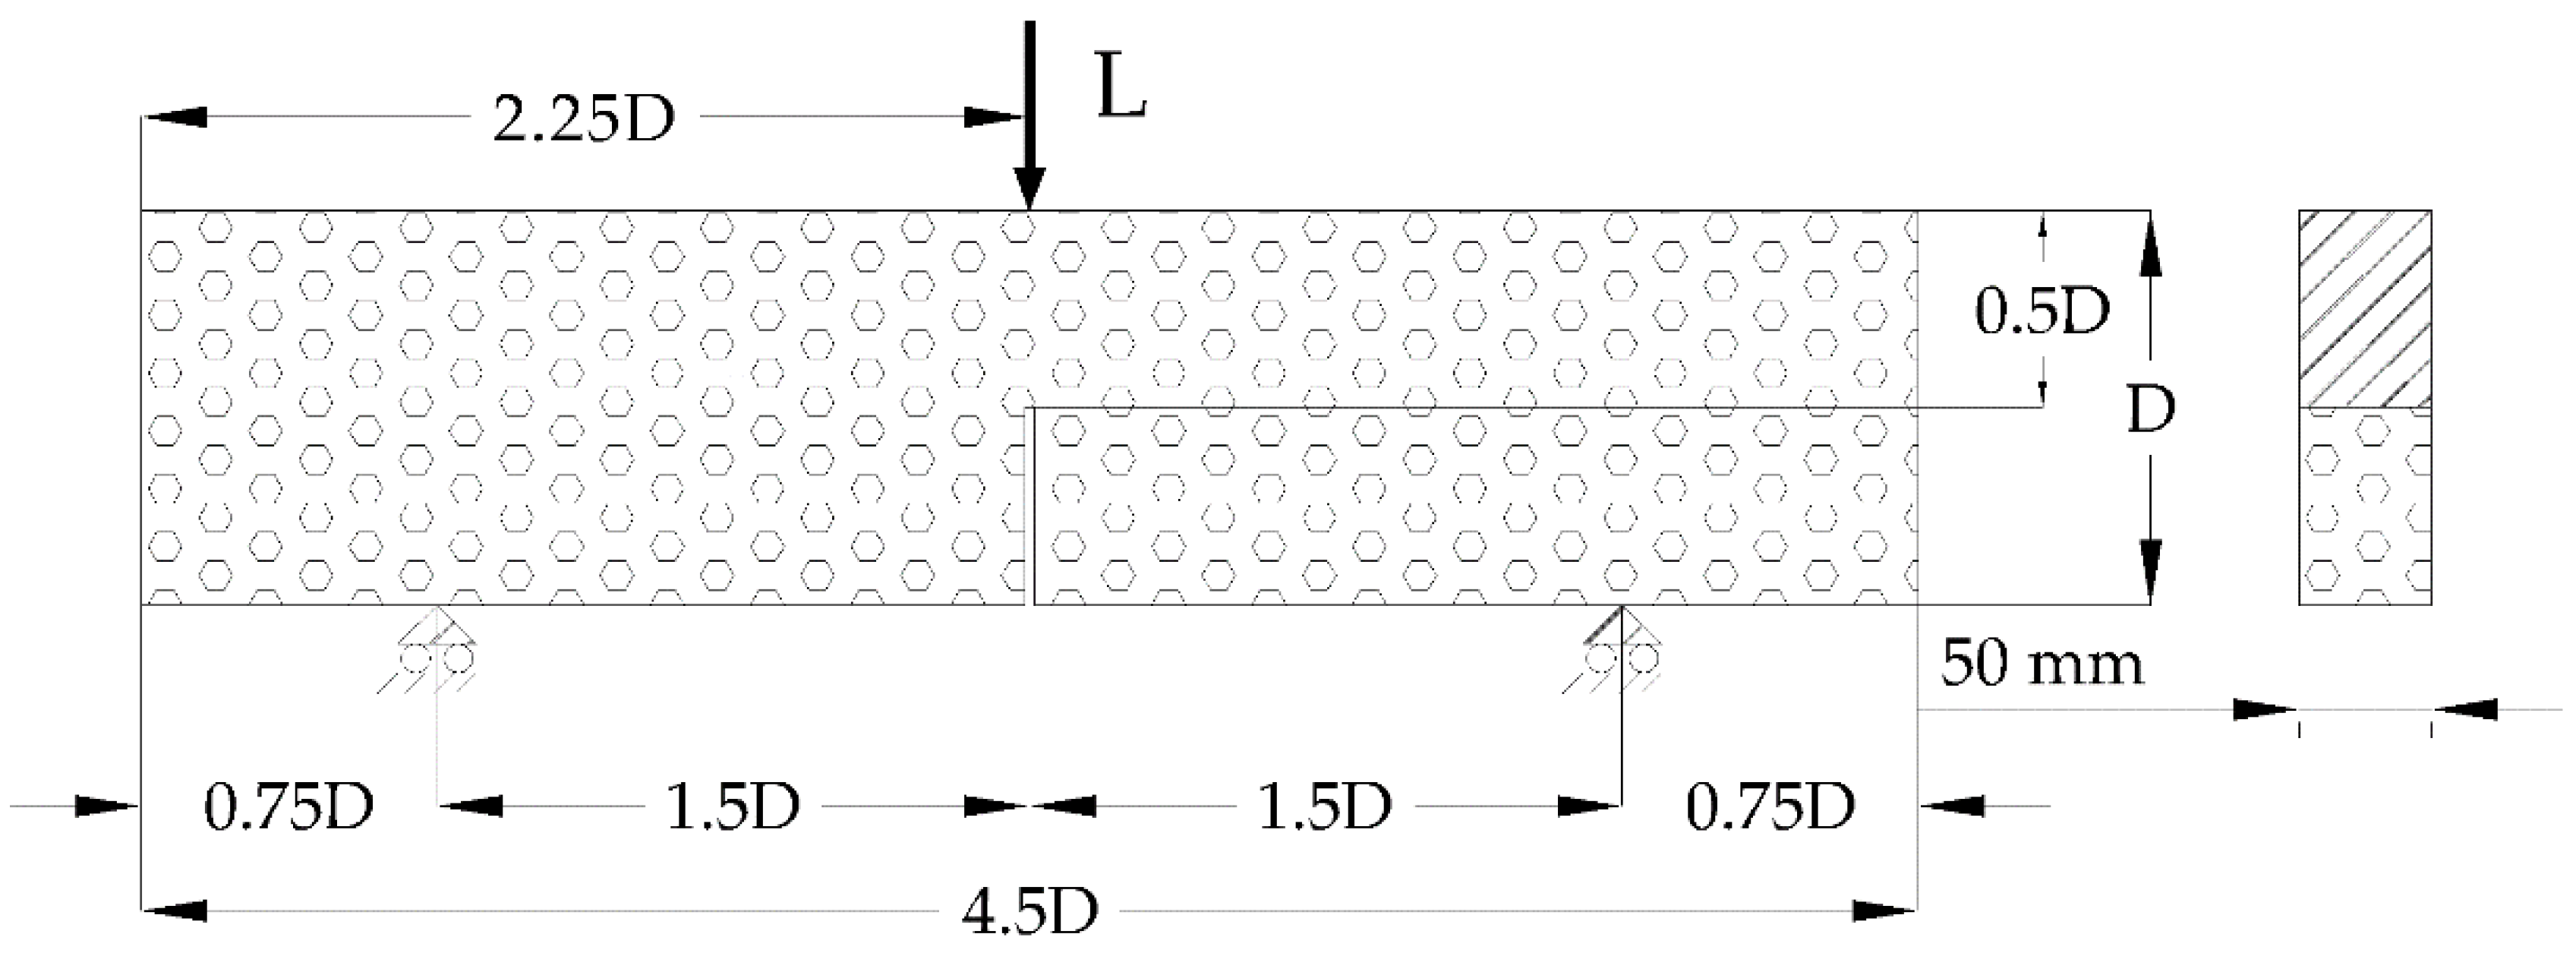
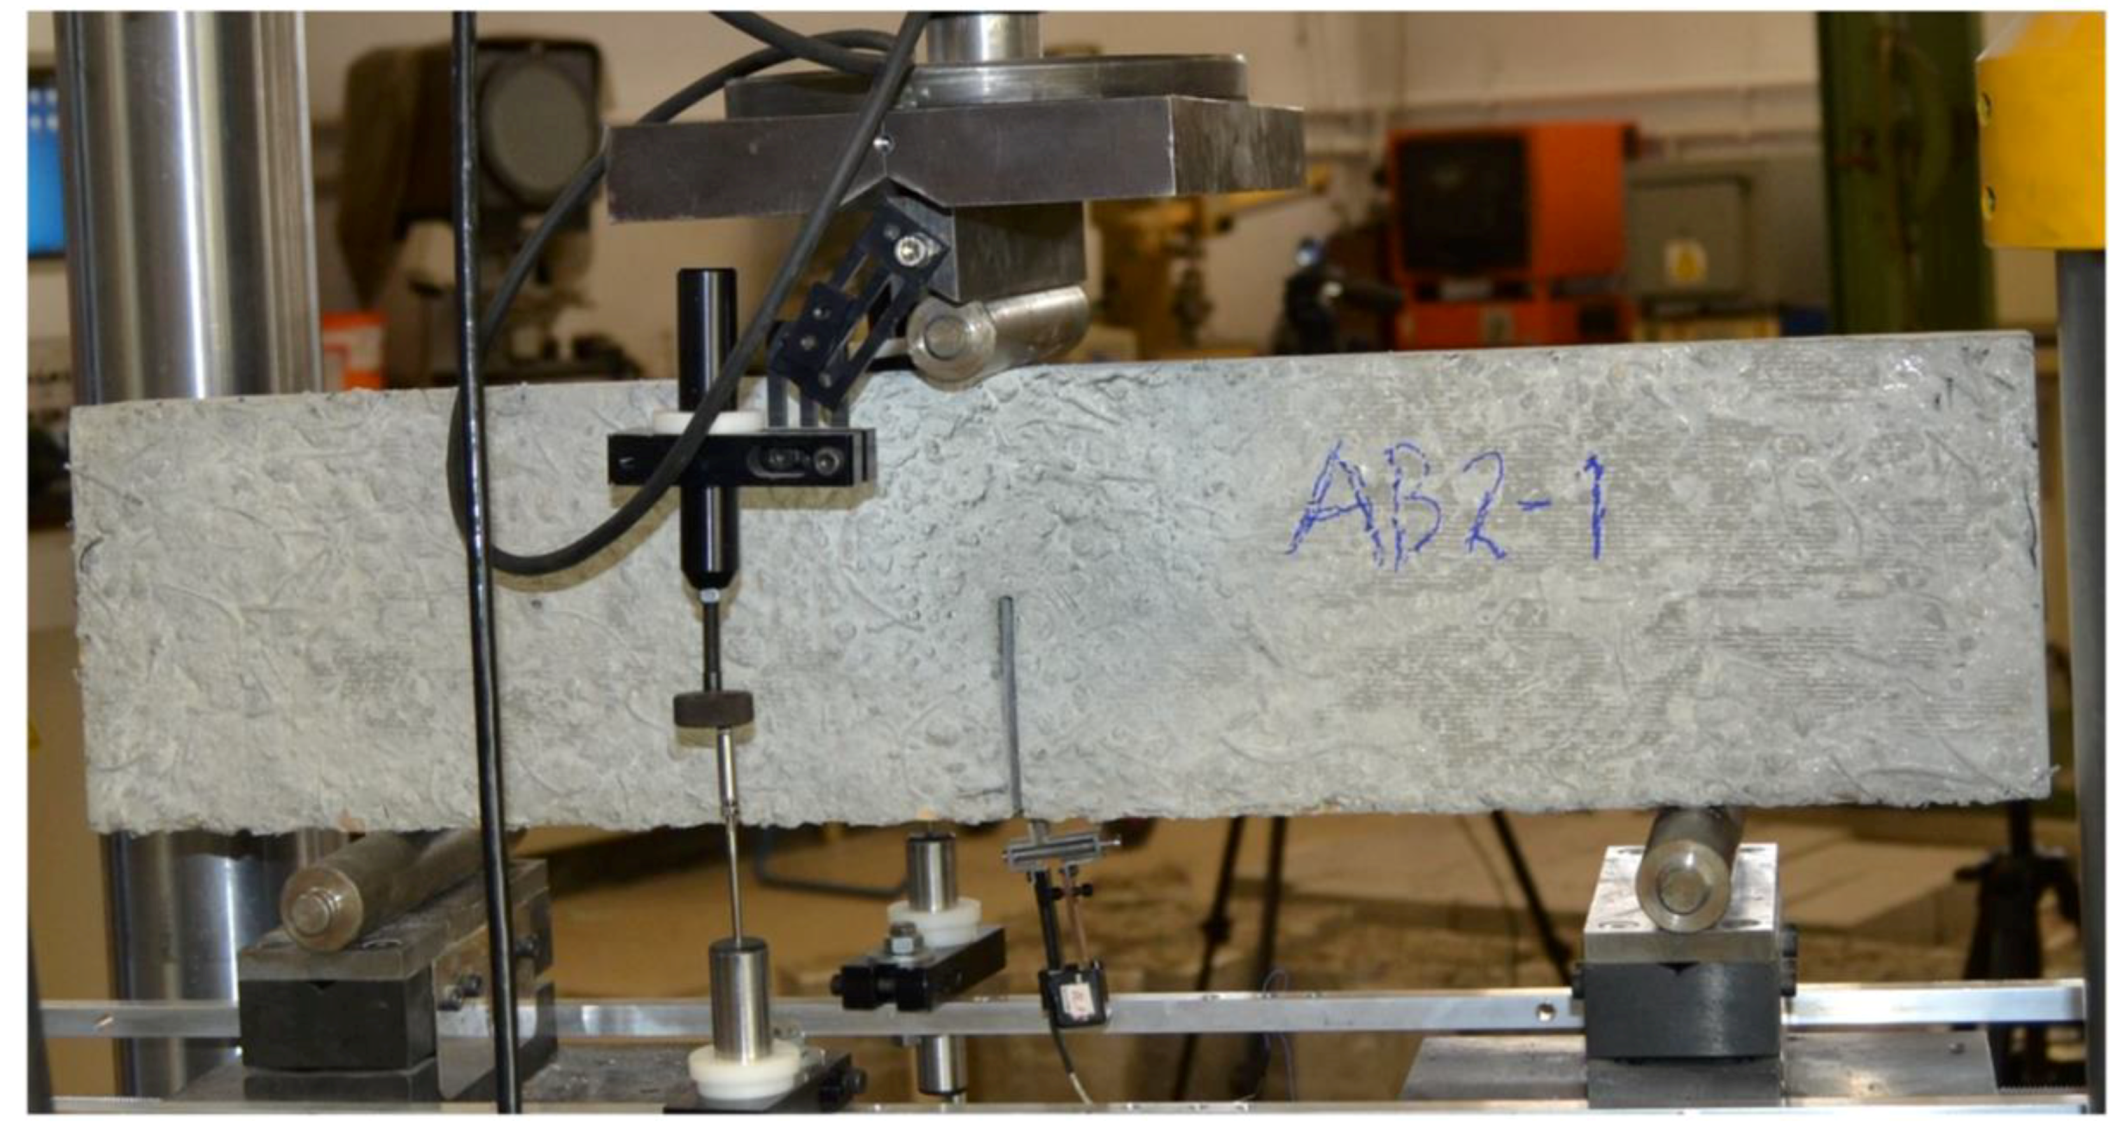
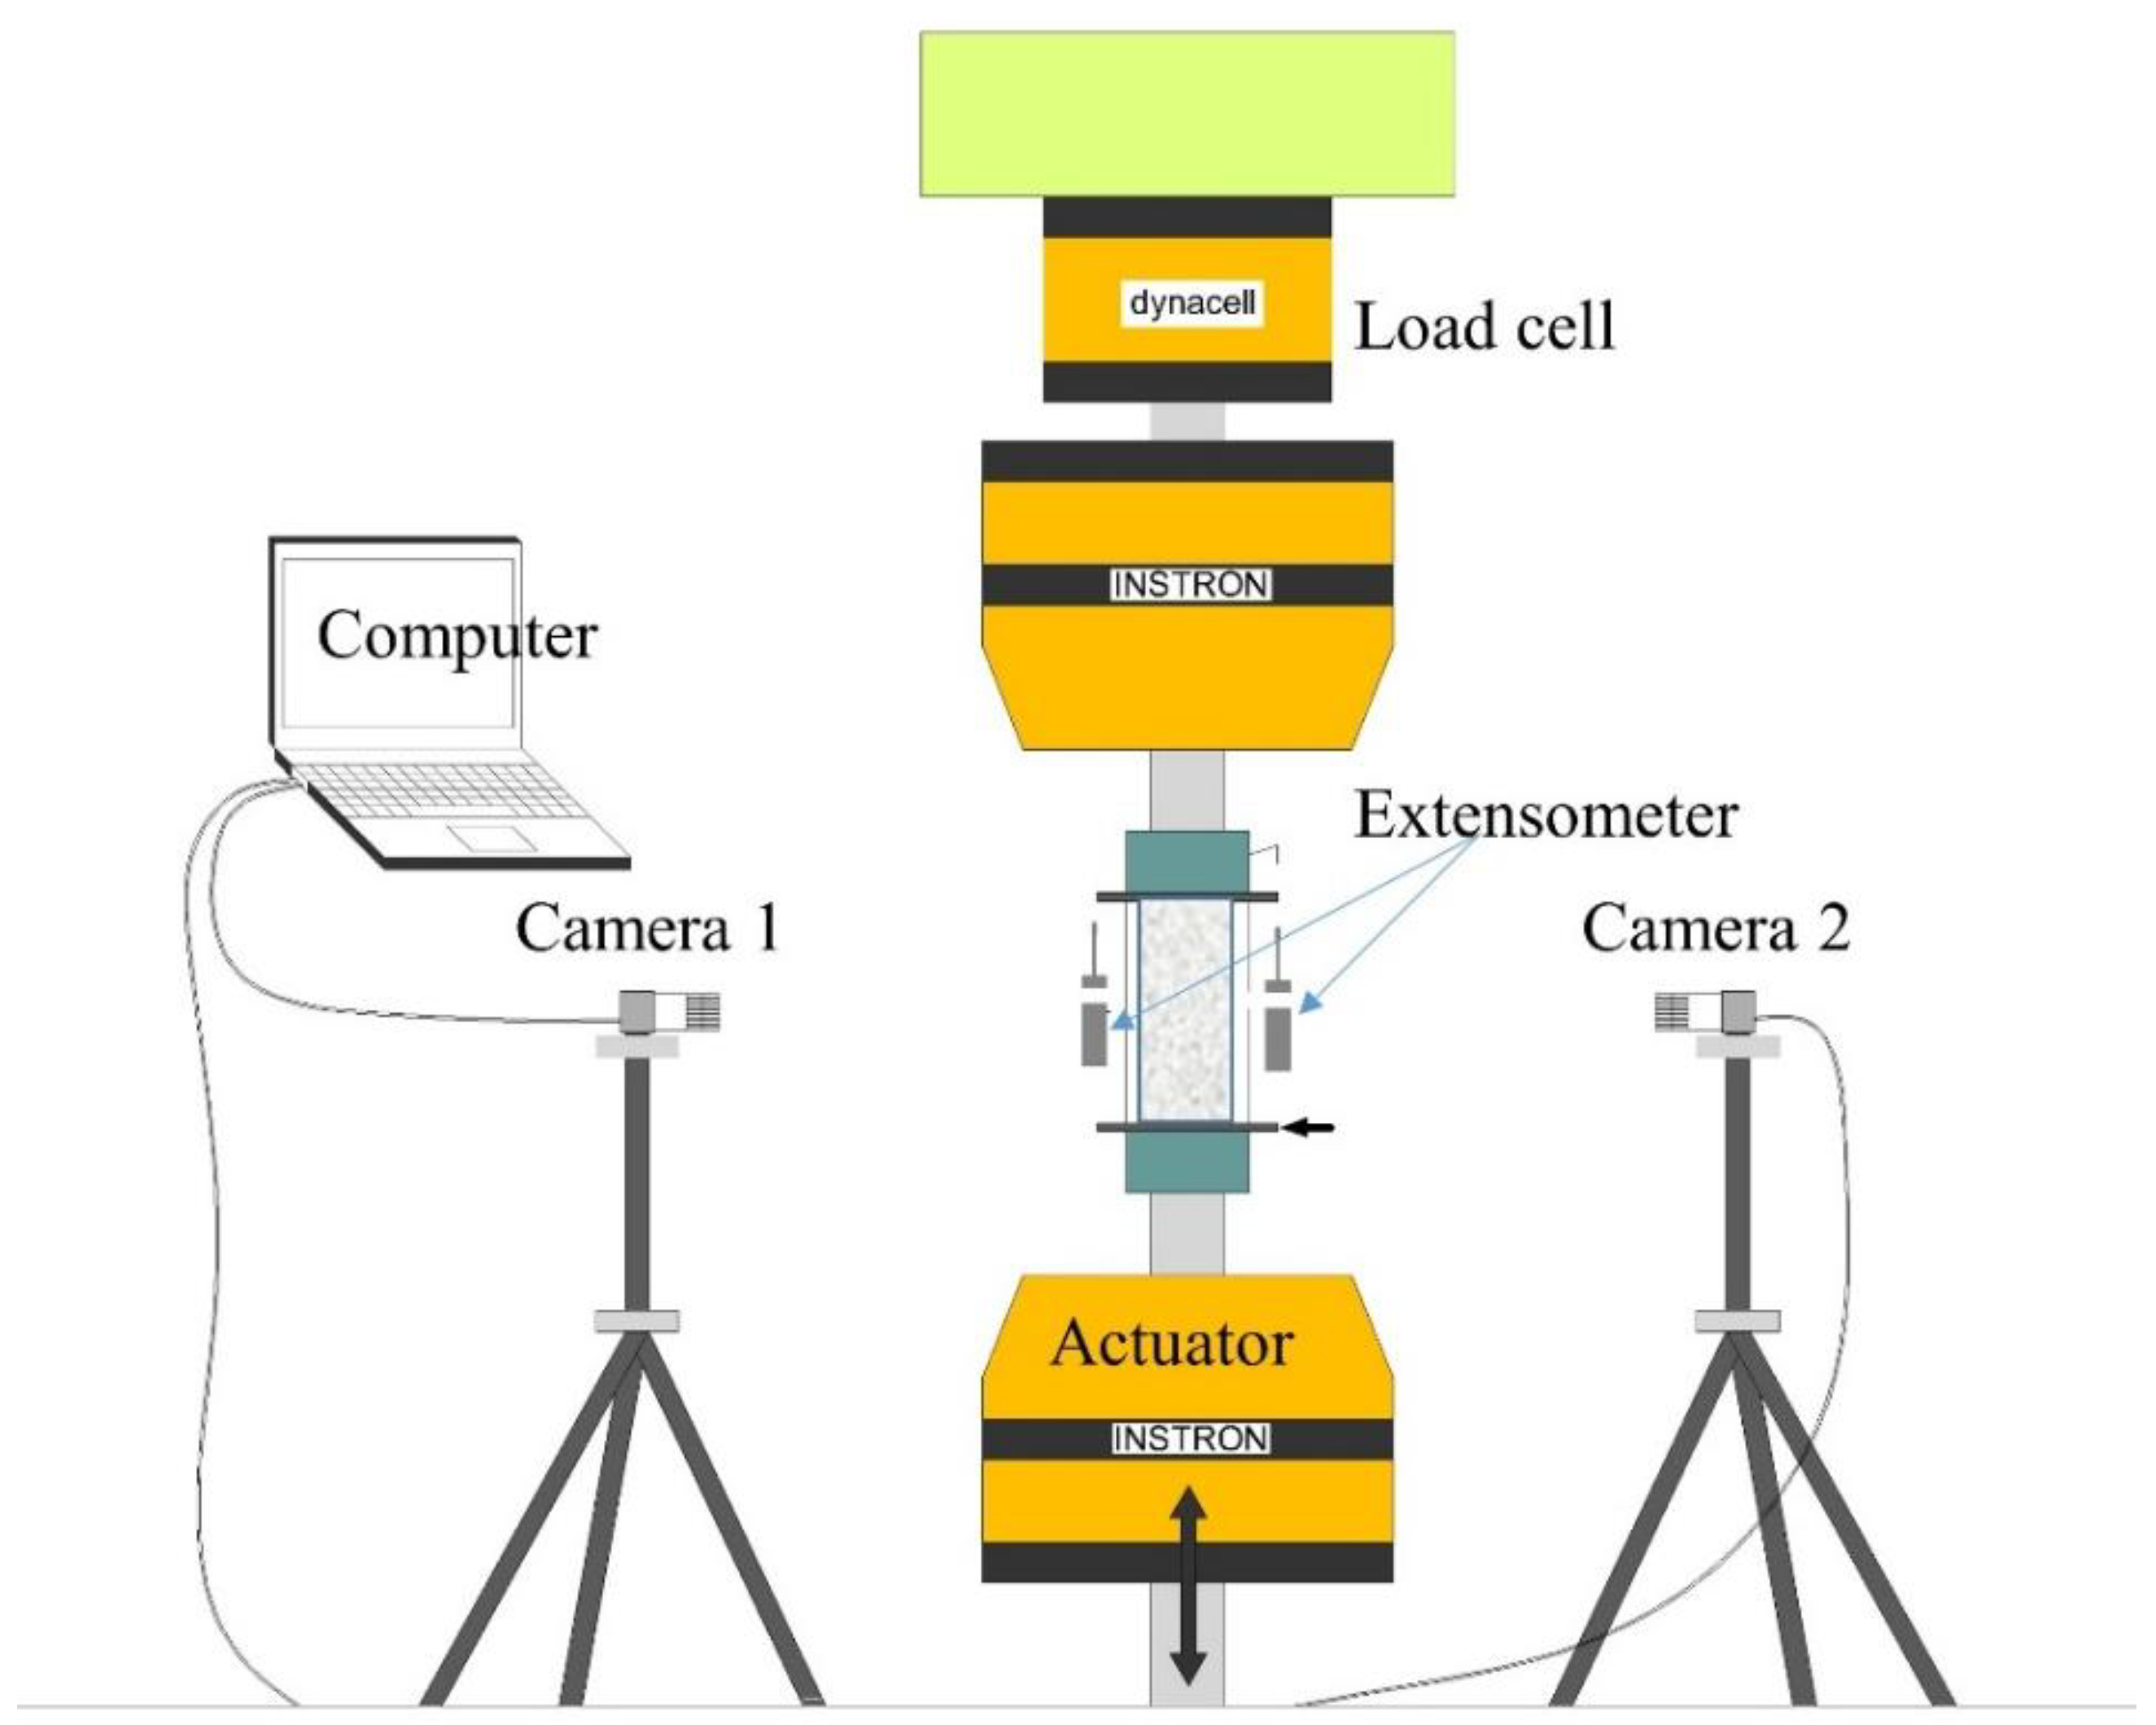
2.2. Testing Development
3. Results
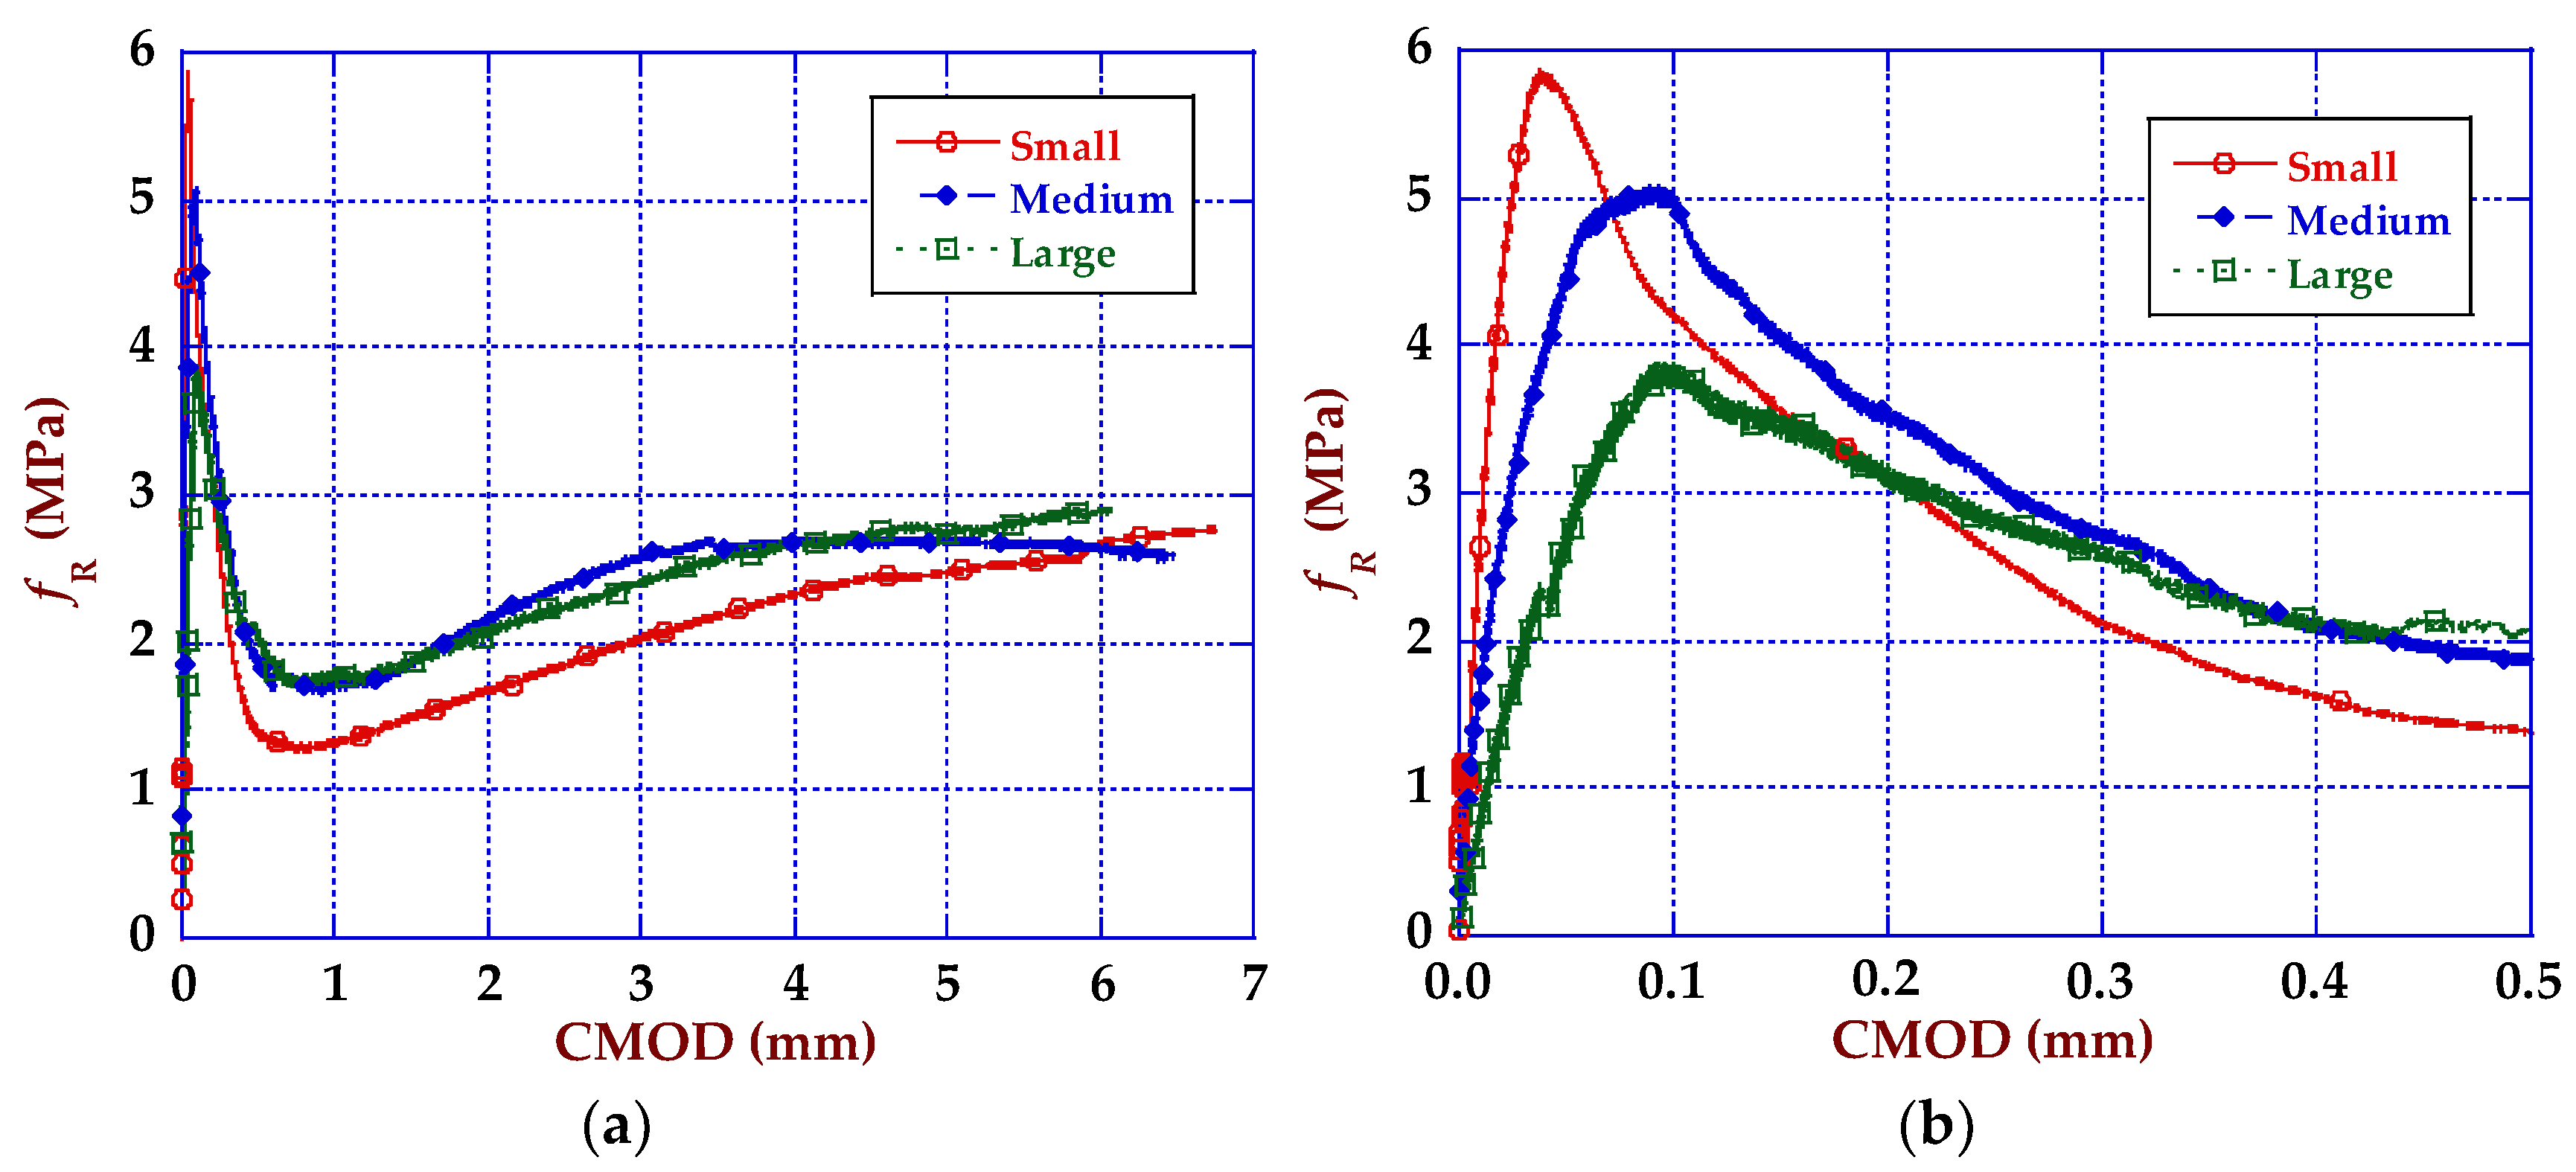
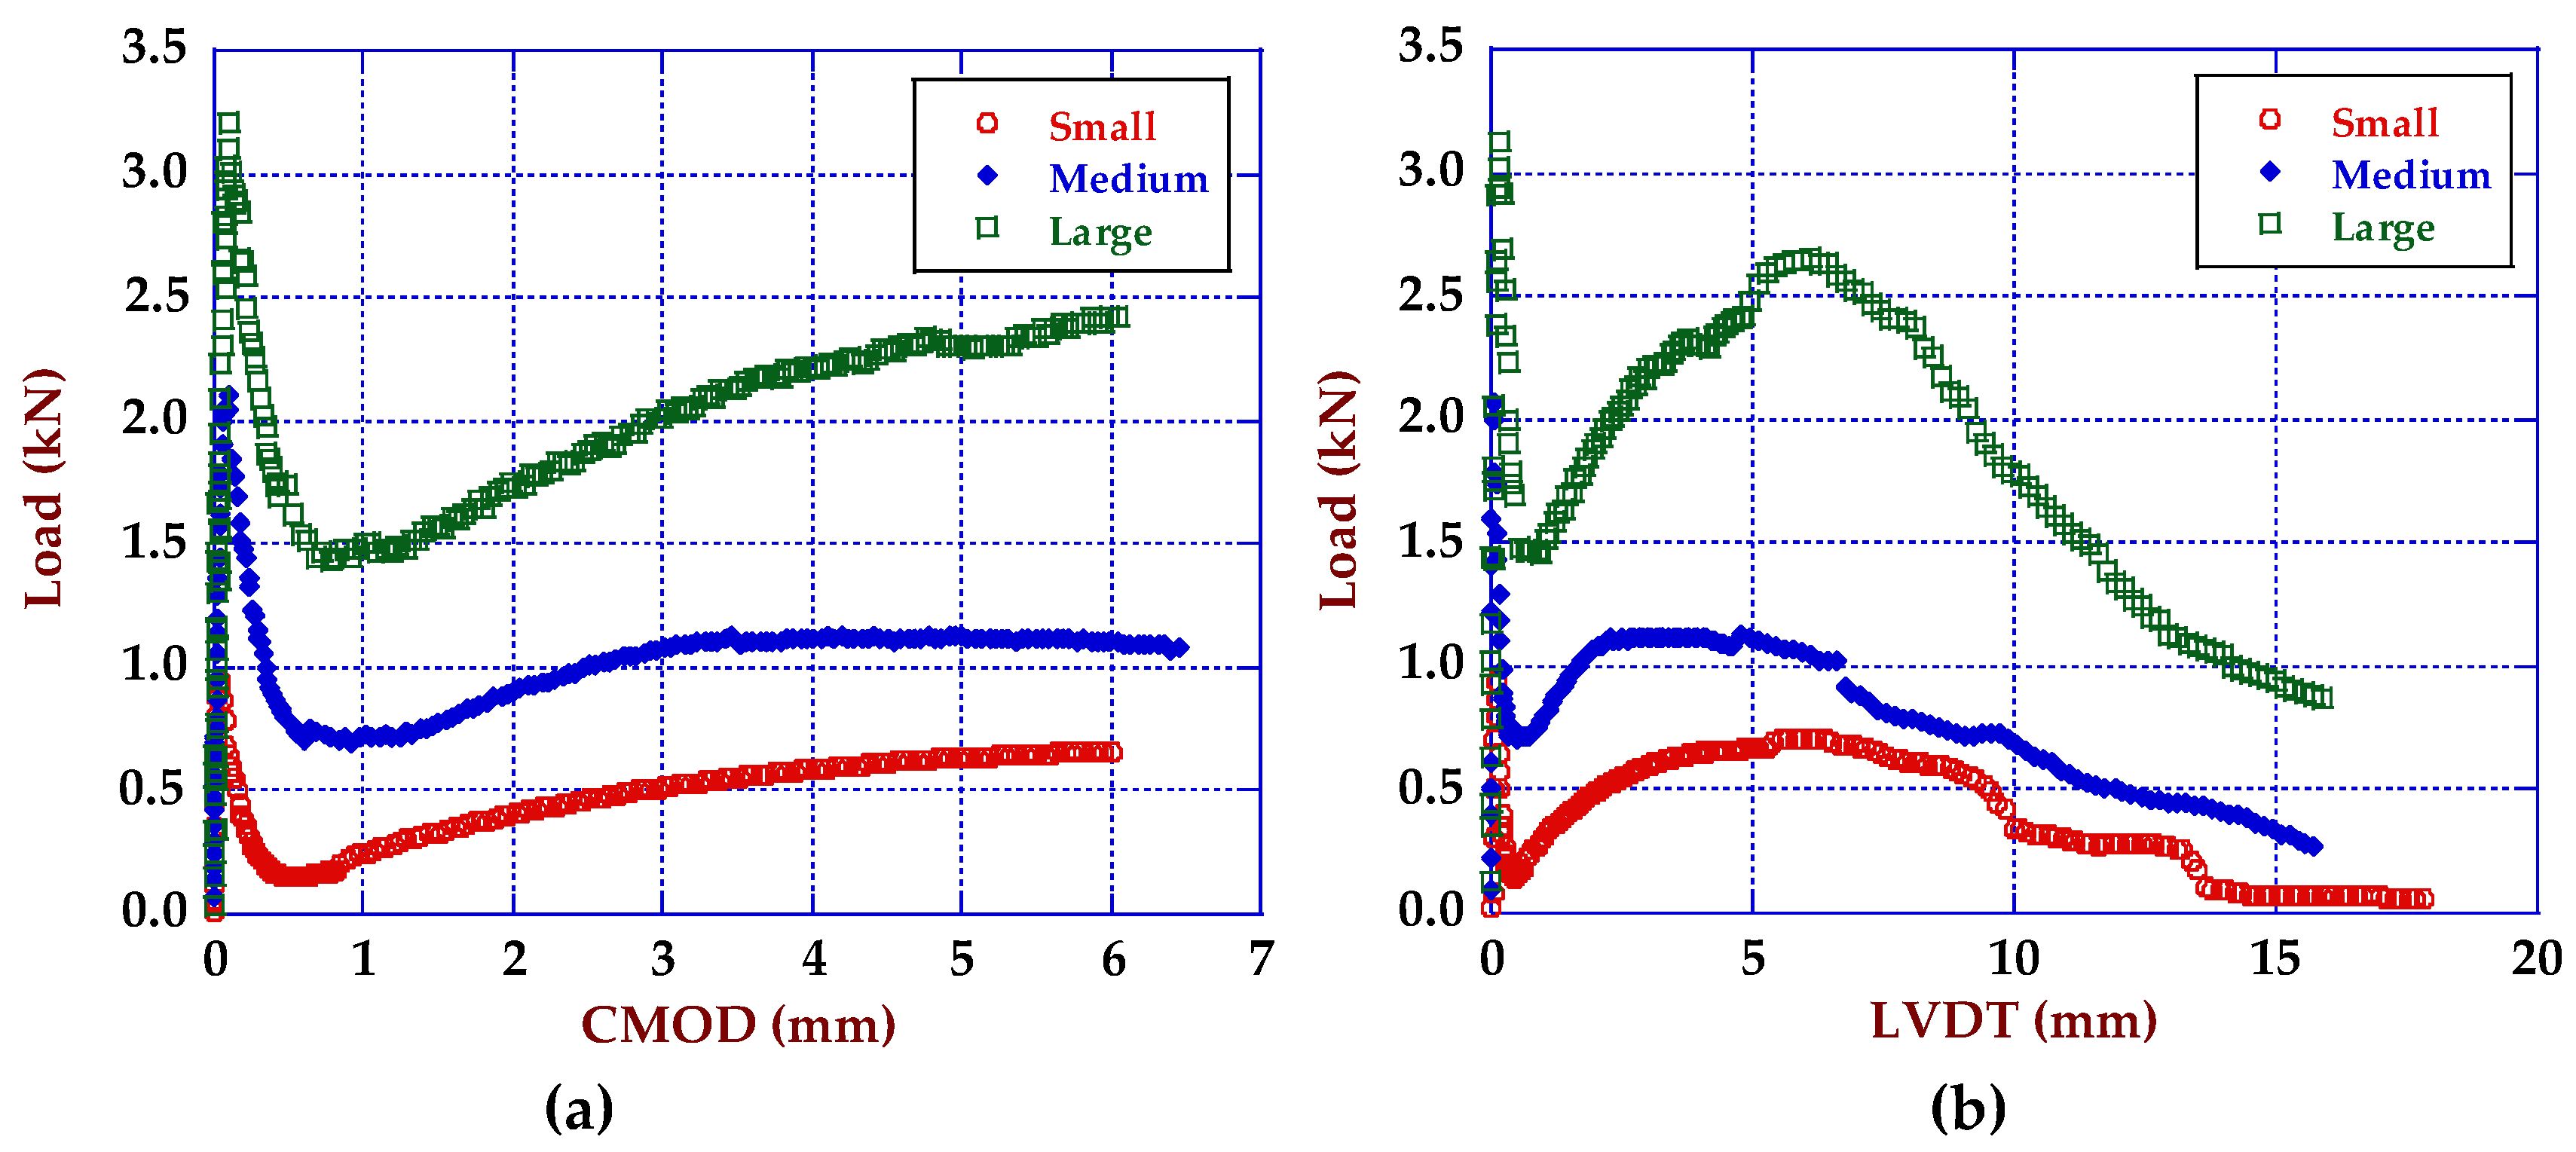
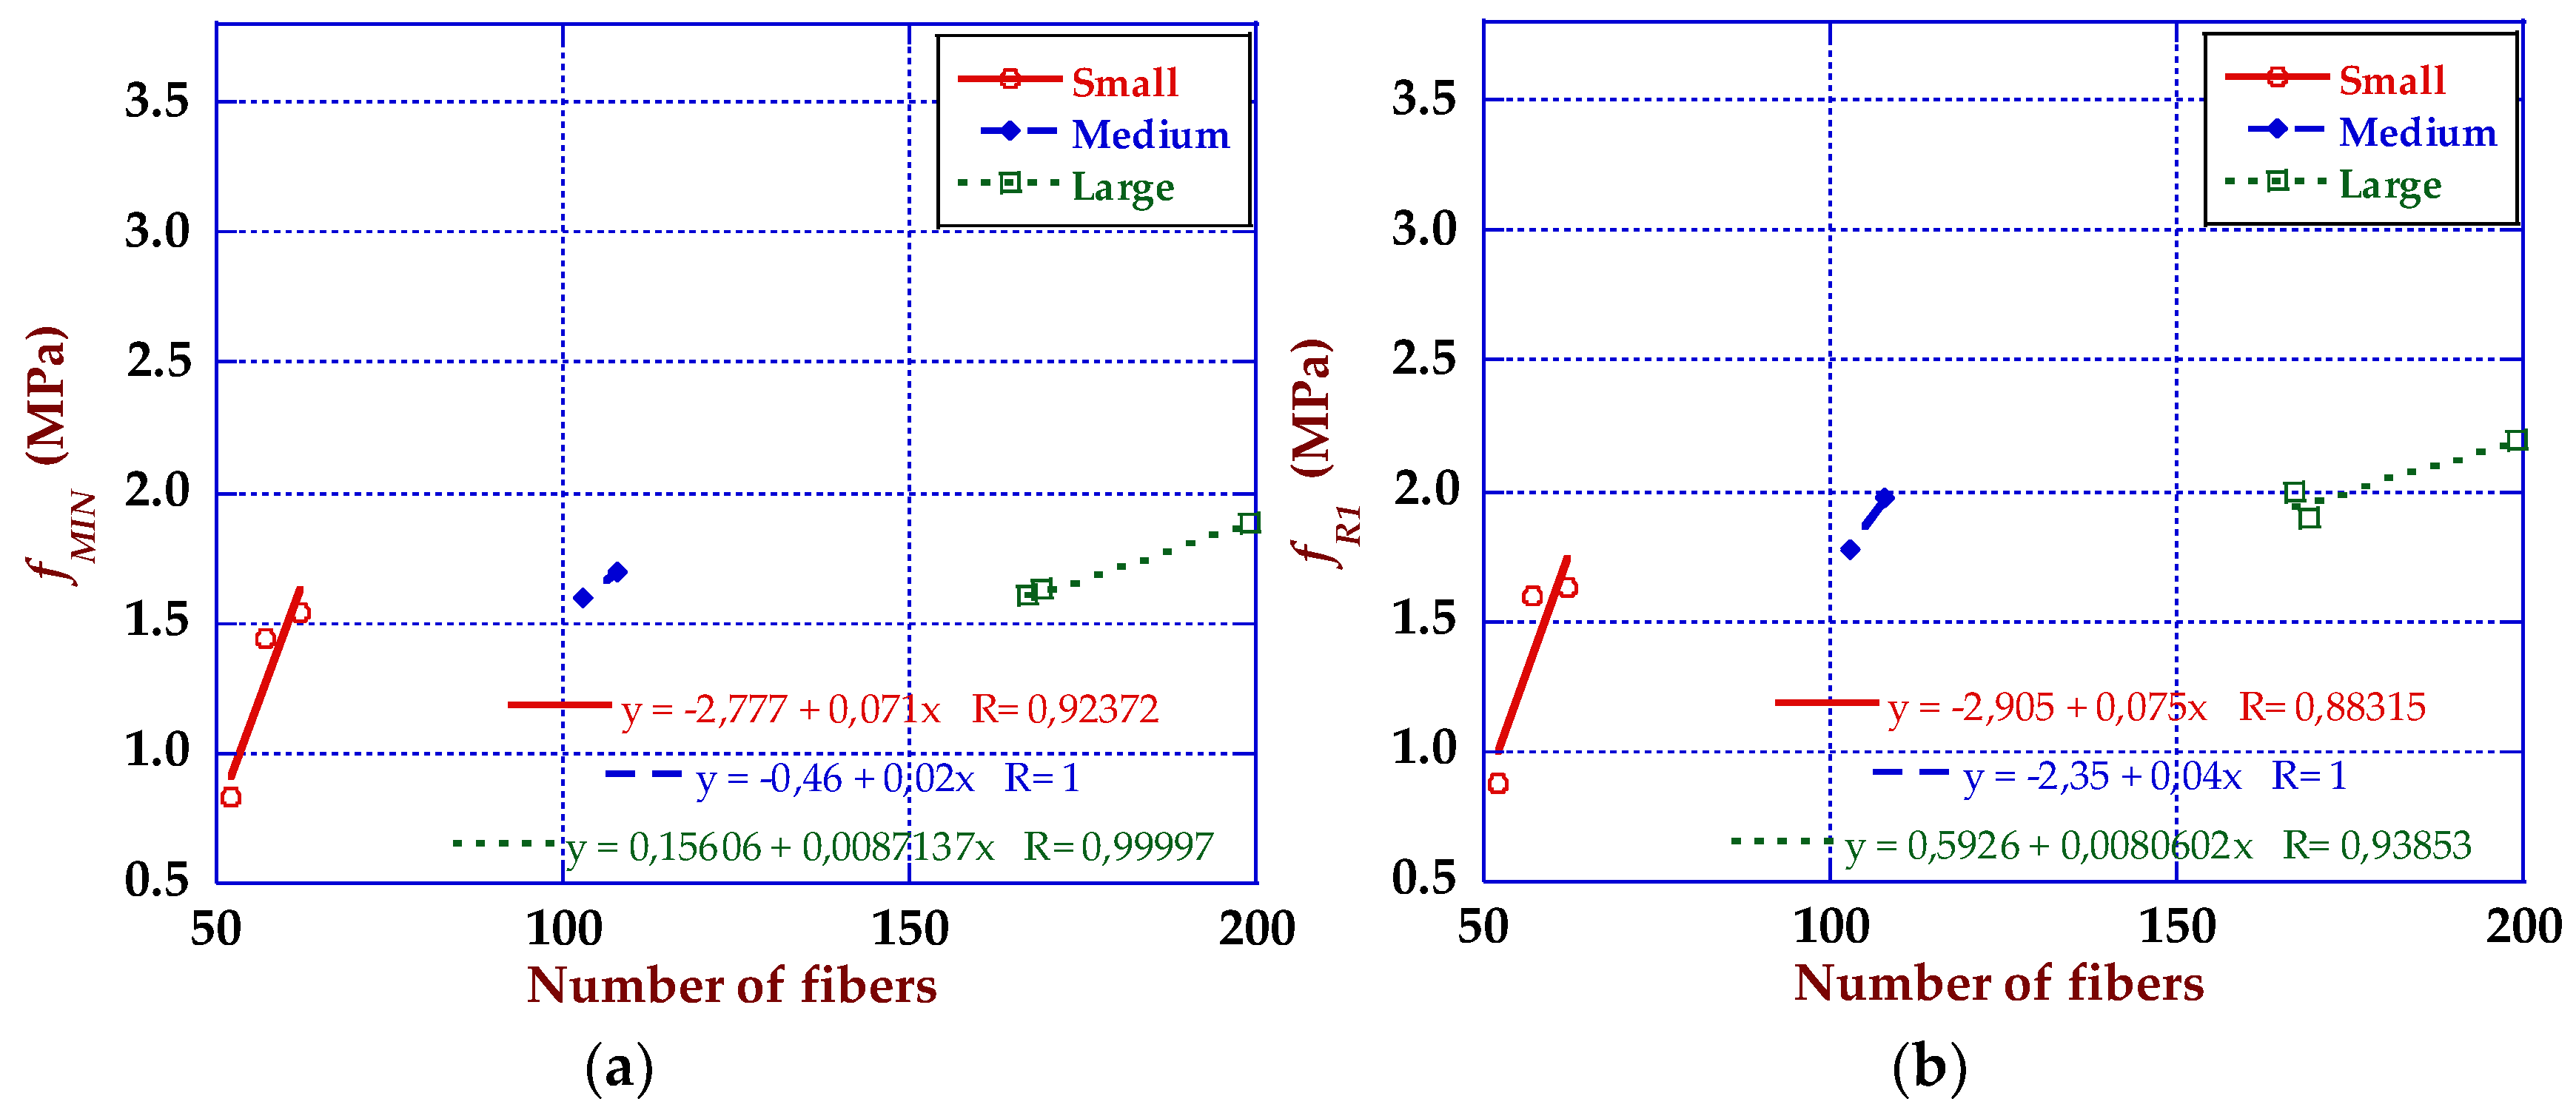
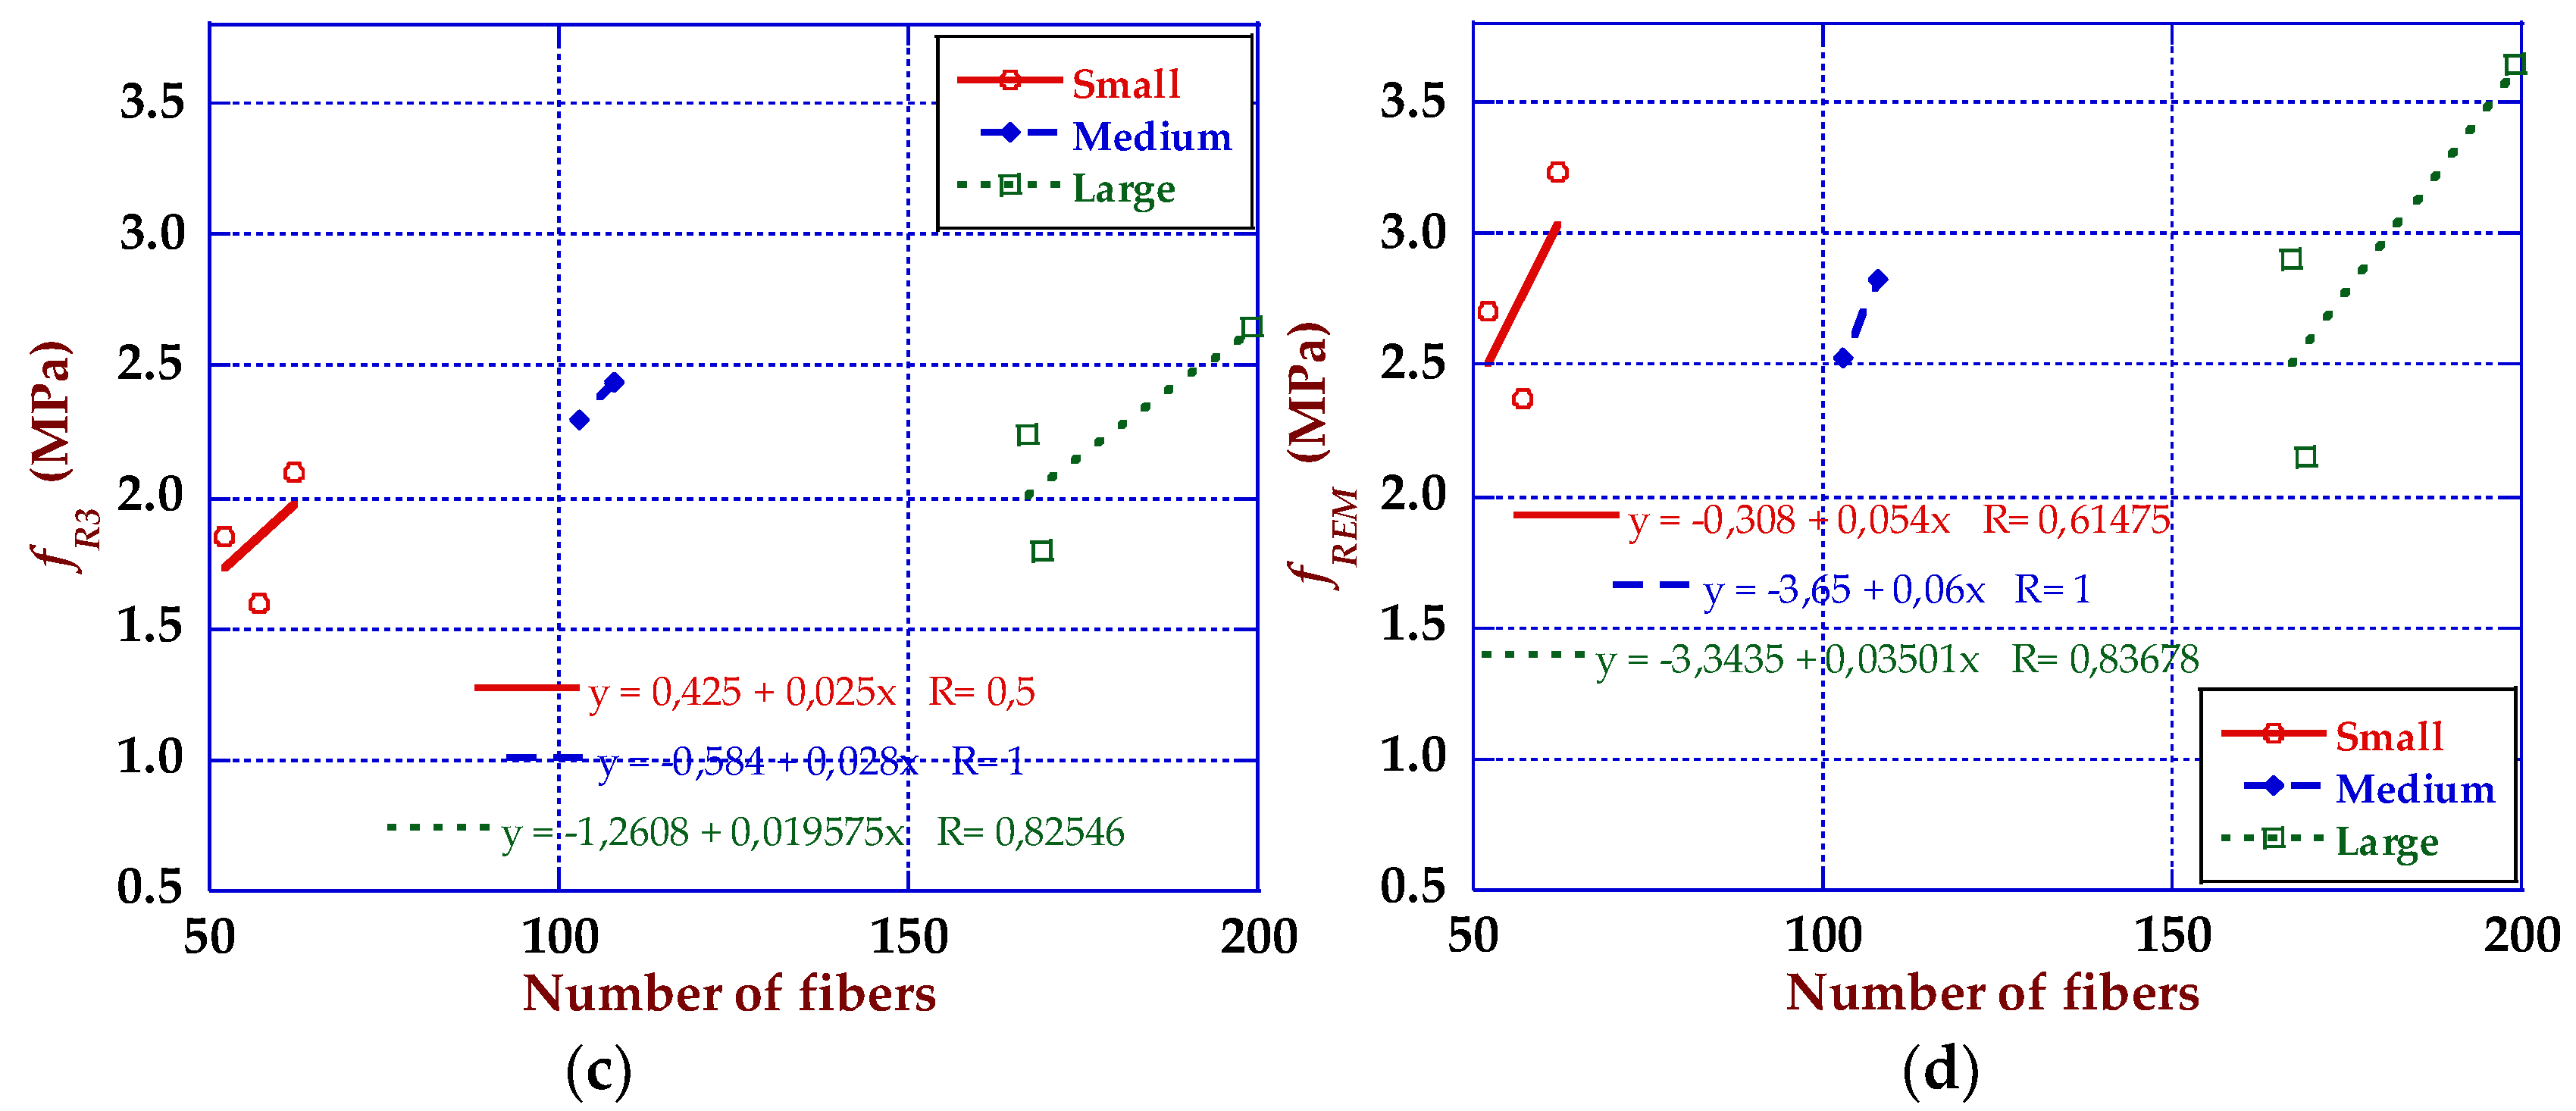
3.1. Fracture Behaviour Results
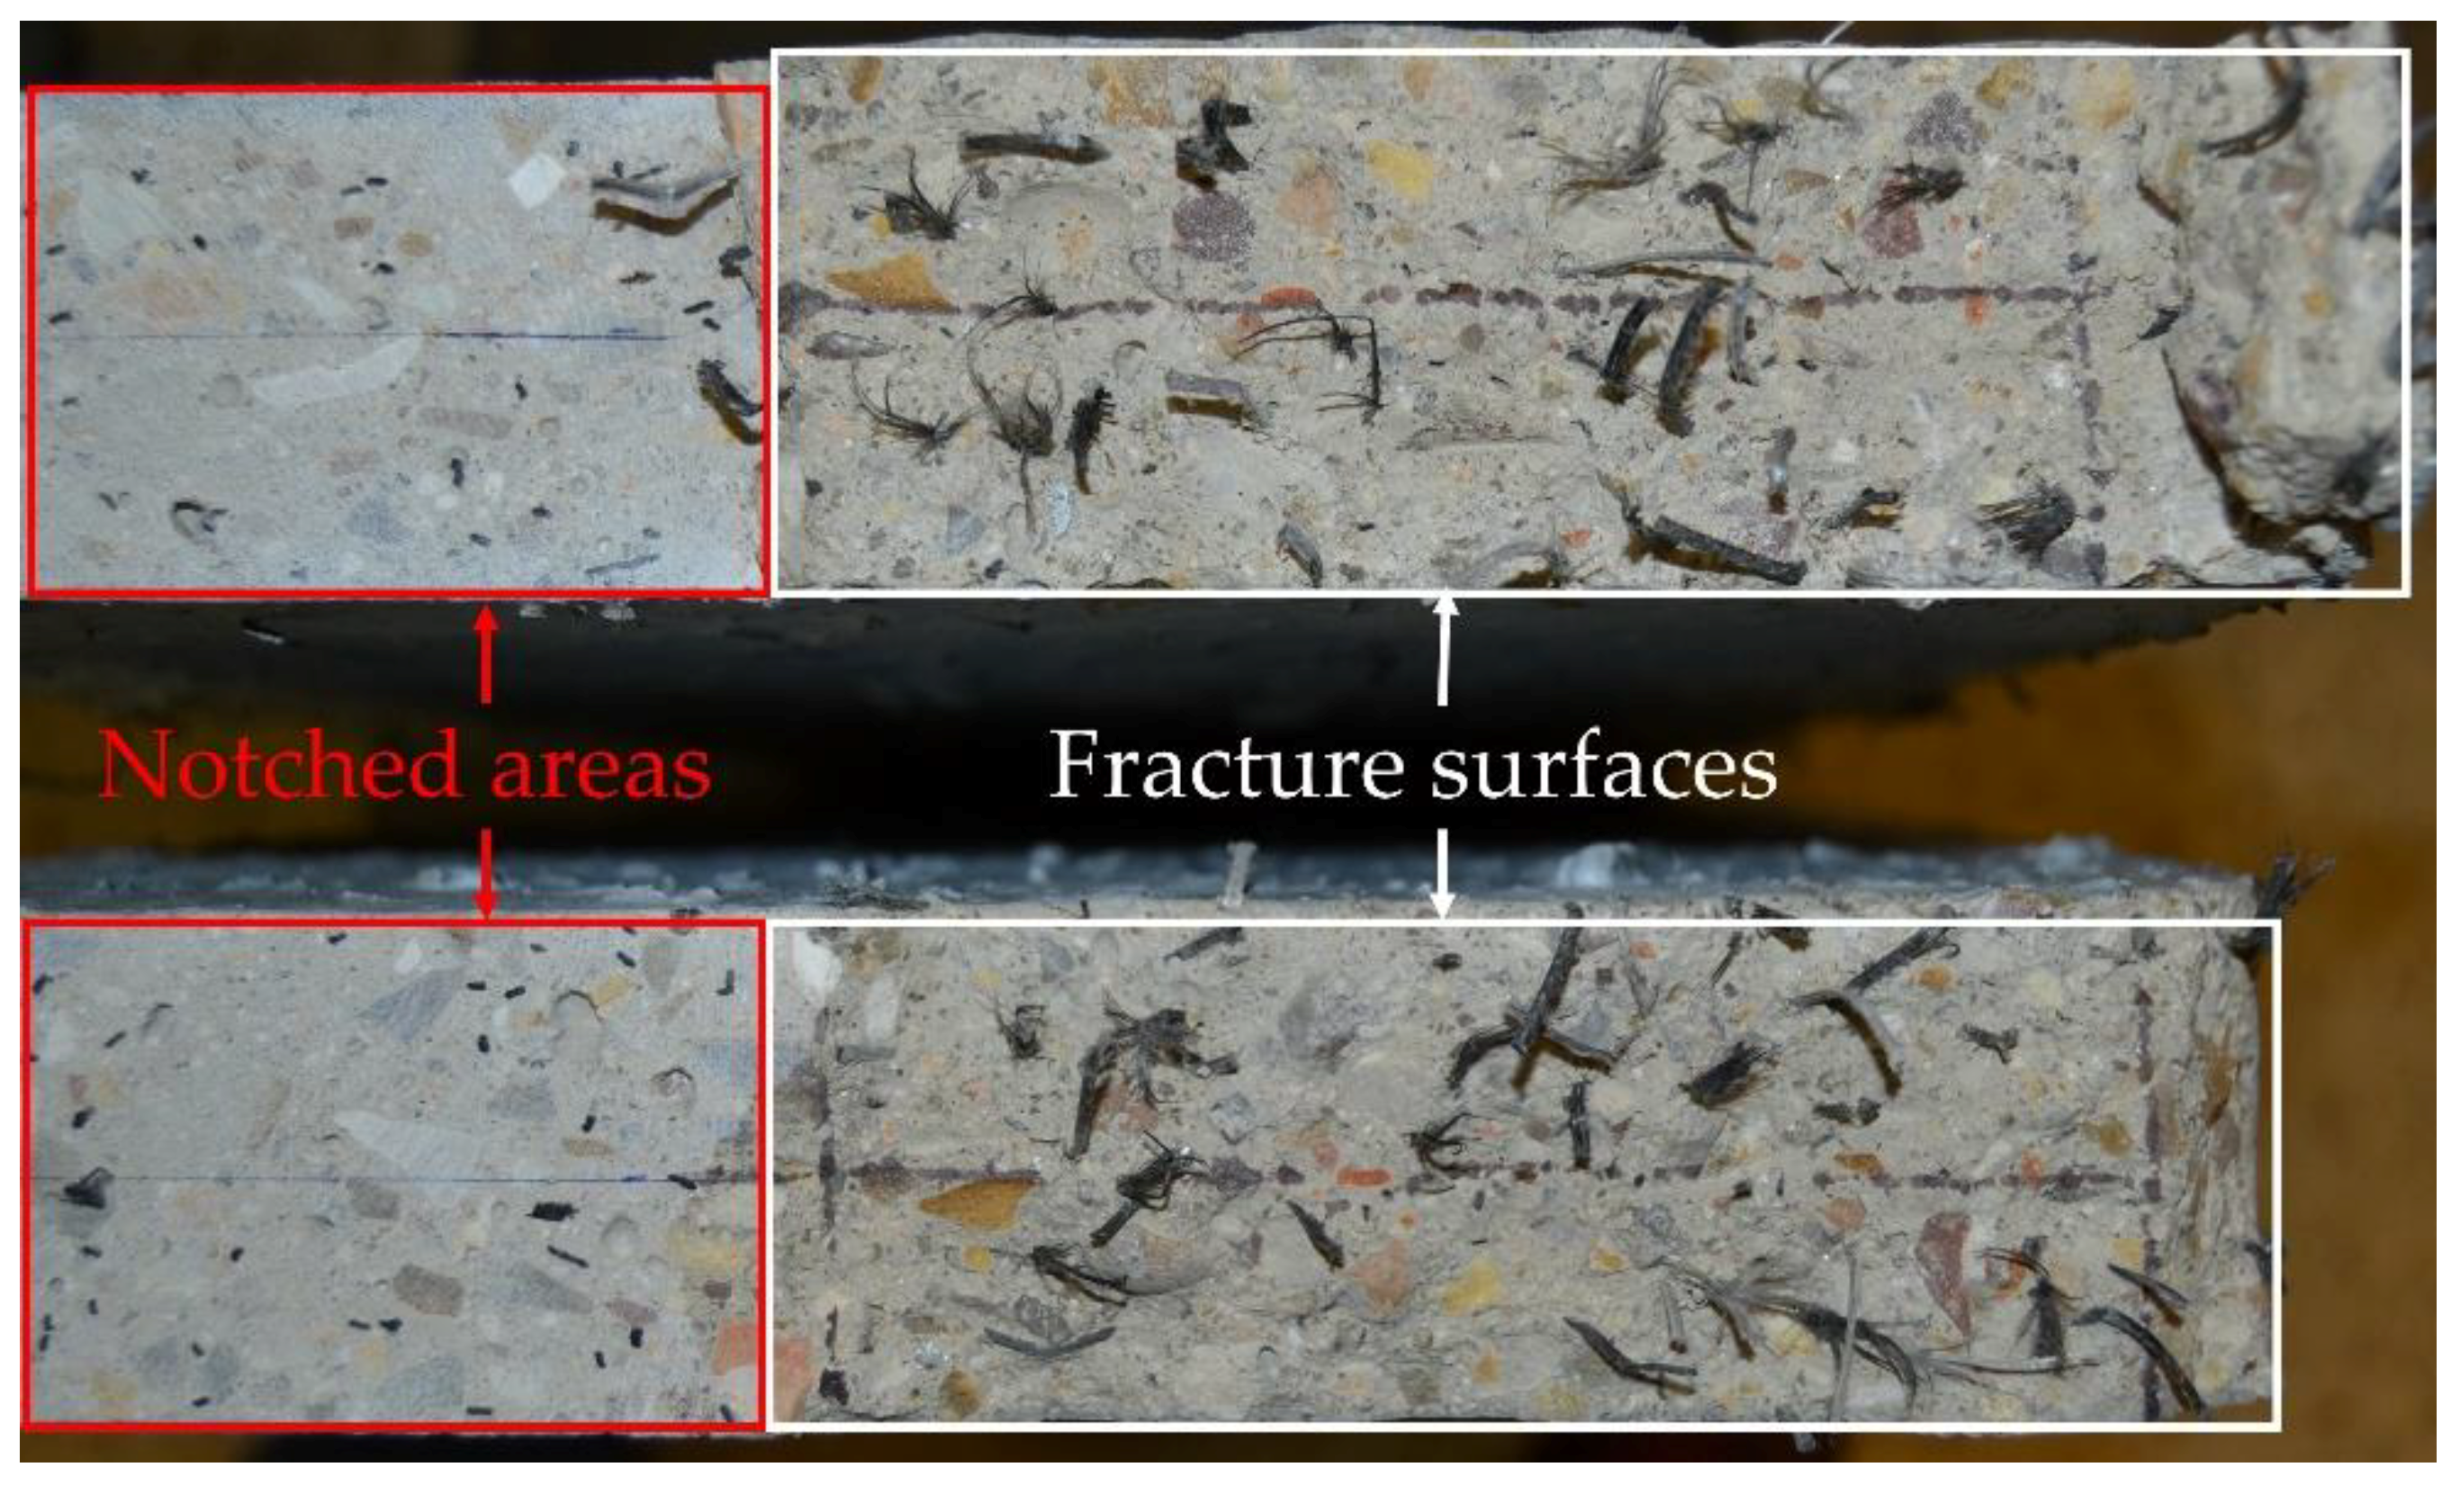
3.2. Fracture Surface Analysis
4. Discussion
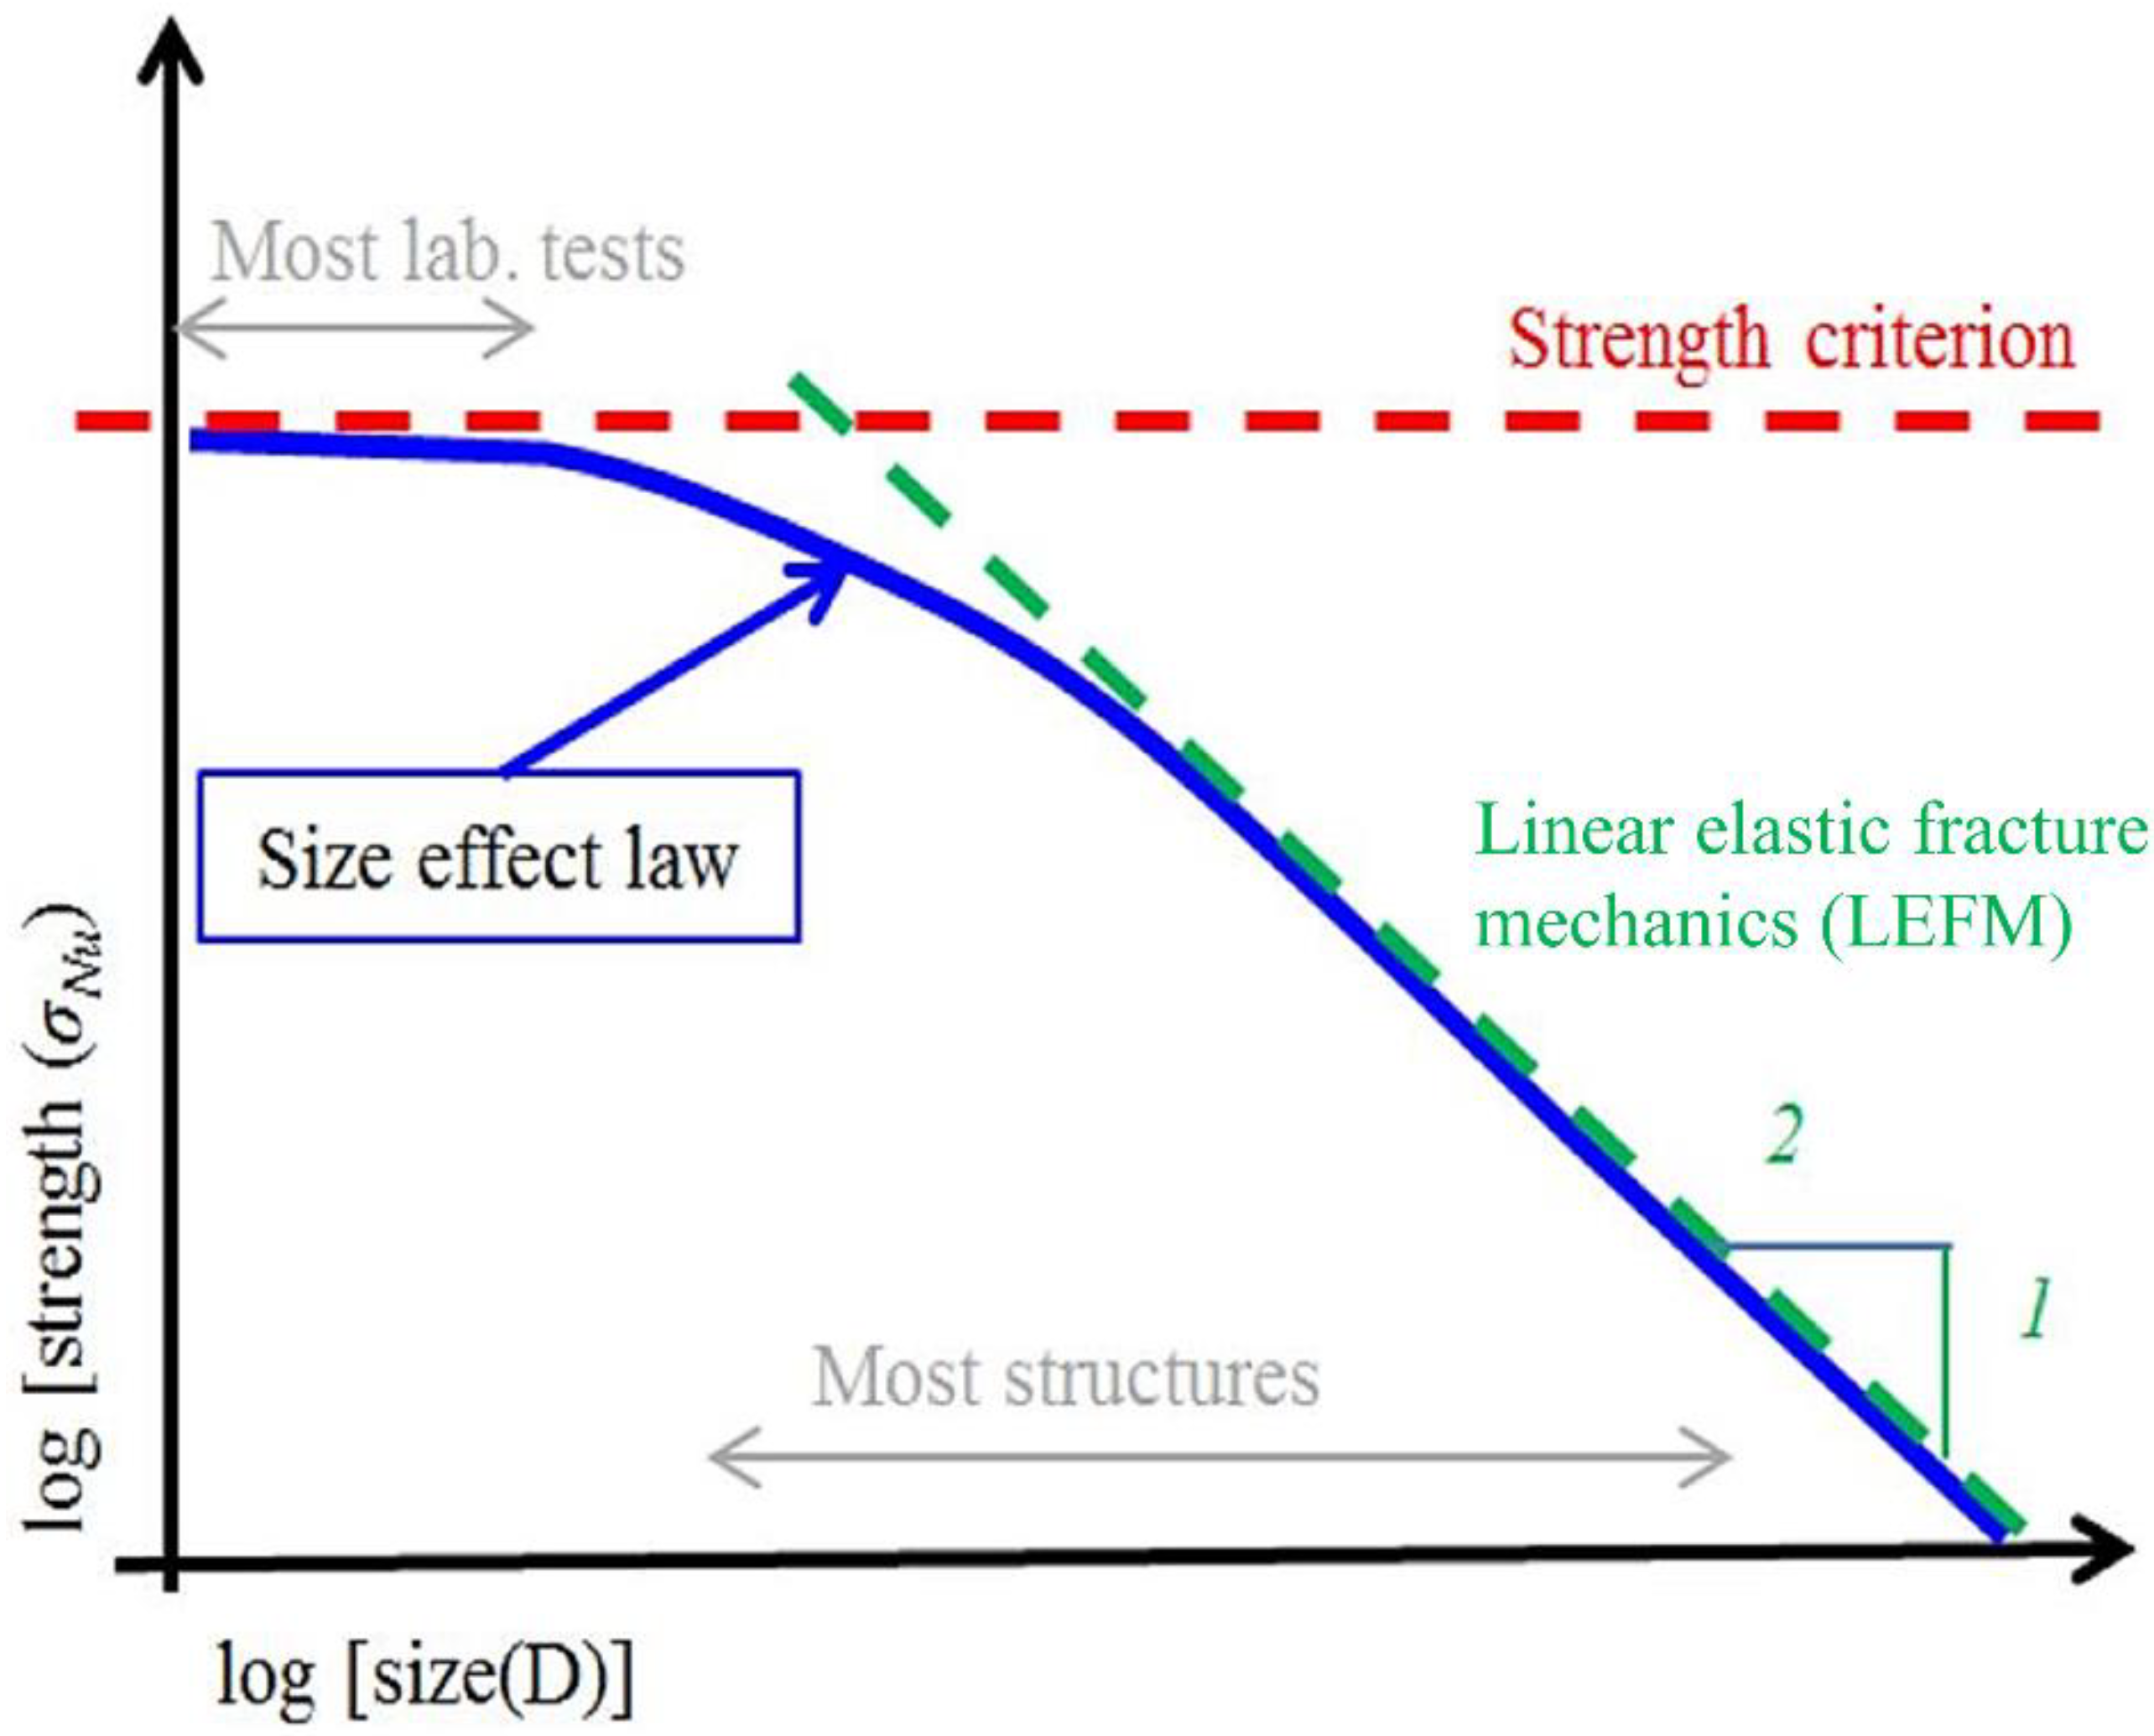
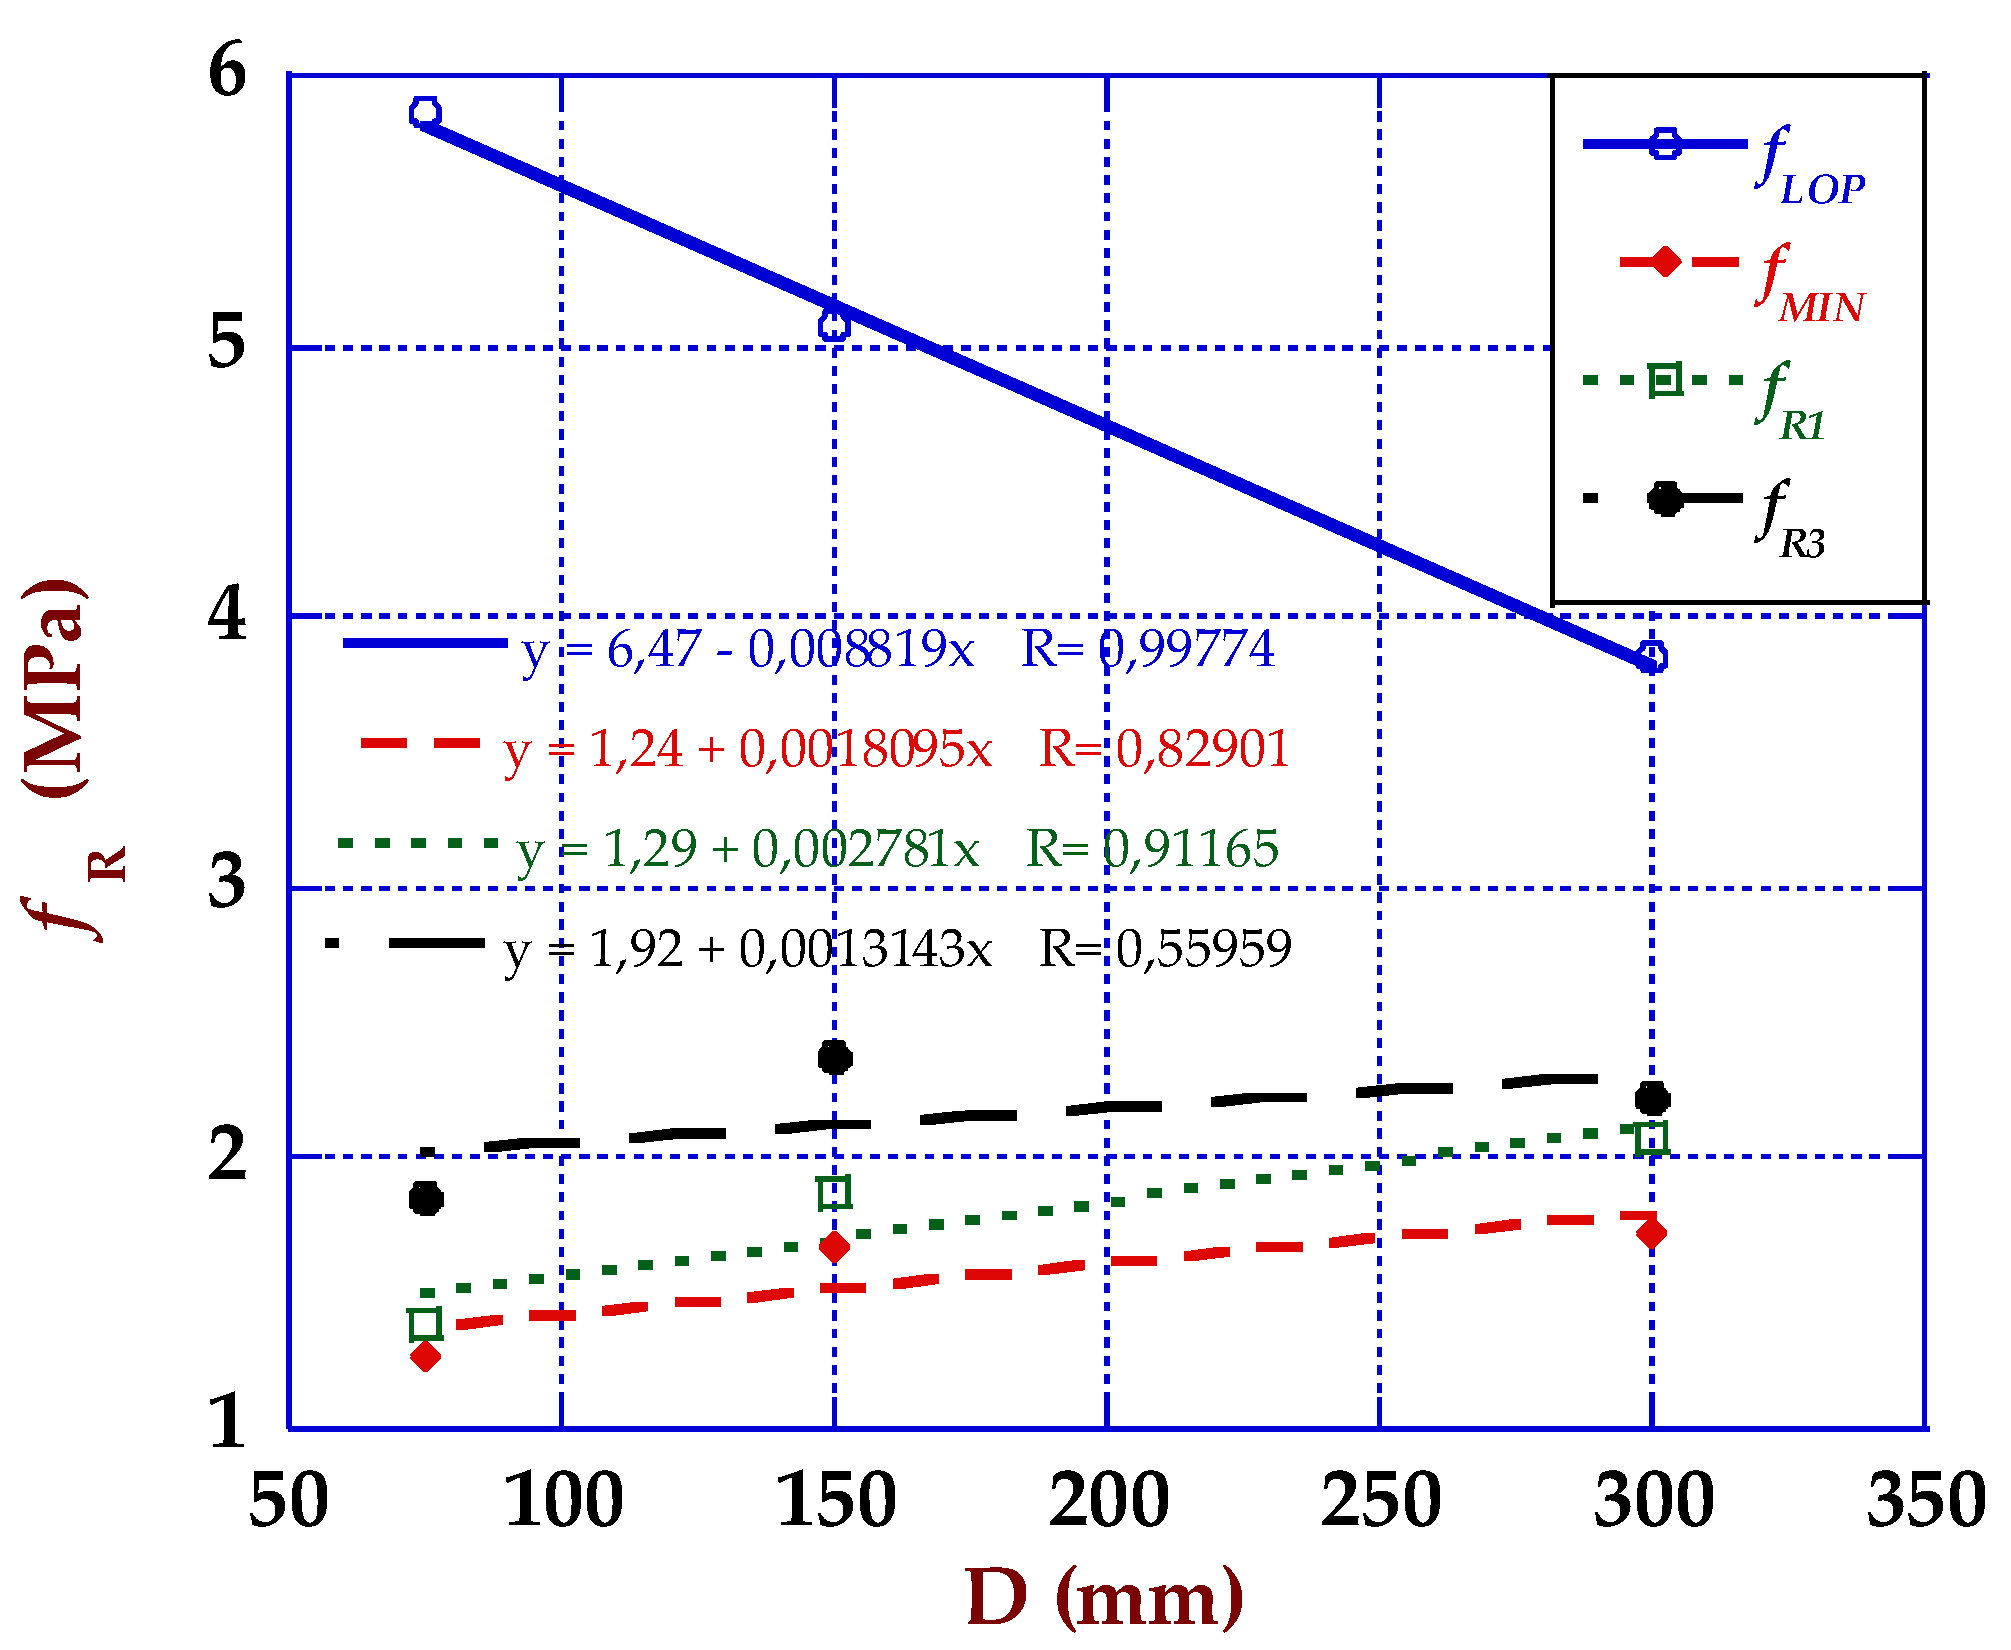
4.1. Size Effect and Strength-CMOD Curves
4.2. Fracture Energy
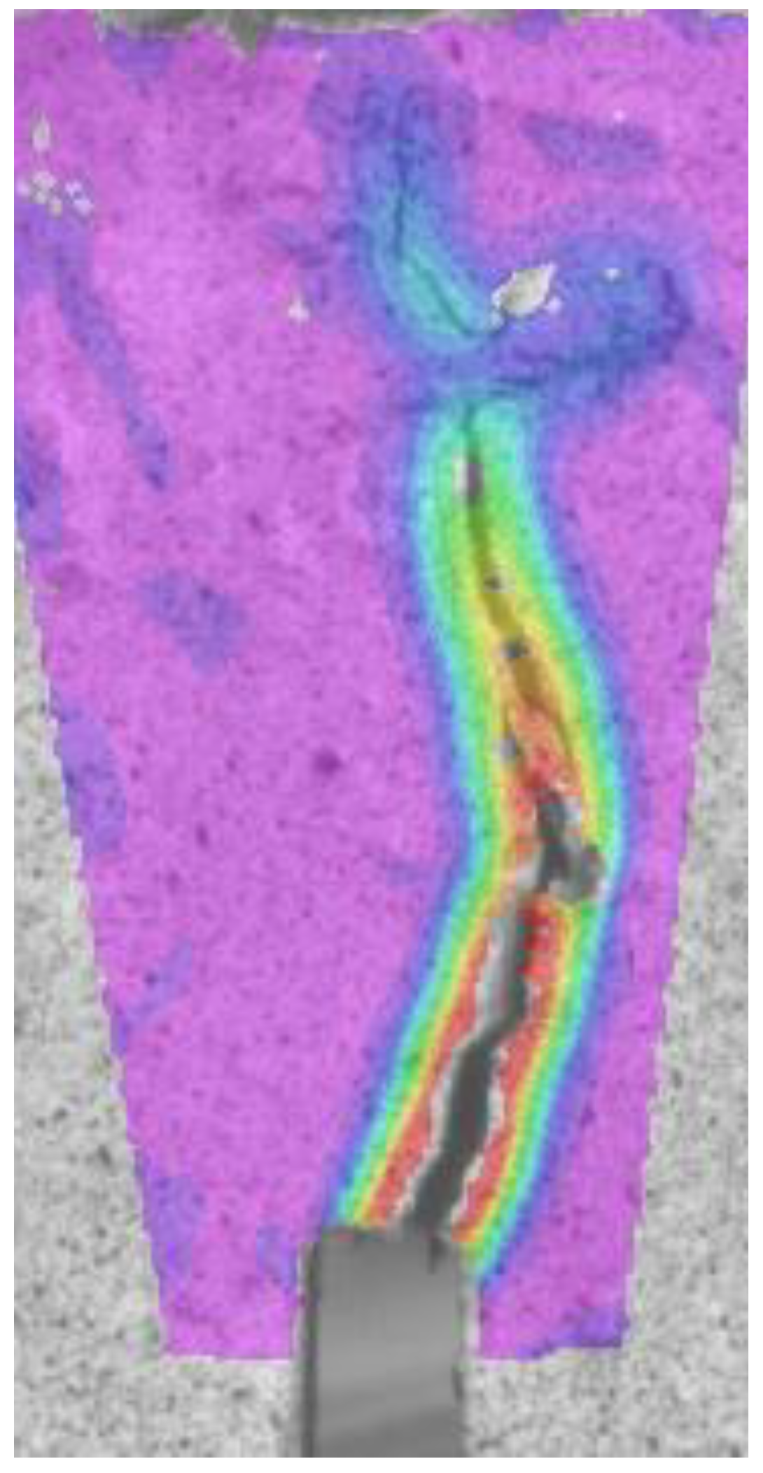
4.3. Video-Extensometry
5. Concluding Remarks
Author Contributions
Funding
Conflicts of Interest
References
- Torroja, E. Razón y ser de Los Tipos Estructurales; Editorial CSIC-CSIC Press: Madrid, Spain, 2007. [Google Scholar]
- Malatesta, S.C. Caracterización de la fractura del hormigón y de vigas de hormigón armado. Inf. de la Construcción 1997, 48, 60. [Google Scholar]
- Banthia, N.; Gupta, R. Influence of polypropylene fiber geometry on plastic shrinkage cracking in concrete. Cem. Concr. Res. 2006, 36, 1263–1267. [Google Scholar]
- Li, V.C.; Ward, R.; Hamza, A.M. Steel and Synthetic Fibers as Shear Reinforcement. ACI Mater. J. 1992, 89, 499–508. [Google Scholar]
- Voo, Y.L.; Poon, W.K.; Foster, S.J. Shear strength of steel fiber-reinforced ultrahigh-performance concrete beams without stirrups. J. Struct. Eng. 2010, 136, 1393–1400. [Google Scholar] [CrossRef]
- International Federation for Structural Concrete (fib). The Fib Model Code for Concrete Structures 2010; International Federation for Structural Concrete: Lausanne, Switzerland, 2010. [Google Scholar]
- Spanish Minister of Public Works. Spanish Structural Concrete Code EHE-08; Spanish Minister of Public Works: Madrid, Spain, 2008. [Google Scholar]
- Romualdi, J.P.; Mandel, J.A. Tensile strength of concrete affected by uniformly distributed and closely spaced short lengths of wire reinforcement. J. Proc. 1964, 61, 657–672. [Google Scholar]
- Bencardino, F. Mechanical parameters and post-cracking behaviour of HPFRC according to three-point and four-point bending test. Adv. Civ. Eng. 2013, 2013, 1–9. [Google Scholar] [CrossRef]
- Bernard, E. Durability of cracked fibre reinforced shotcrete. In Shotcrete: More Engineering Developments; CRC Press: Boca Raton, FL, USA, 2004; pp. 69–76. [Google Scholar]
- Serna, P.; López, J.Á.; Coll, H.; Camacho, E.; Navarro-Gregori, J.; Galán, F. Pasarela de hormigón de muy alto rendimiento sobre el Barranco de las Ovejas (Alicante). Hormigón Y Acero 2015, 66, 23–42. [Google Scholar] [CrossRef] [Green Version]
- Grünewald, S.; Walraven, J. High strength self-compacting fibre reinforced concrete: Behaviour in the fresh and hardened state. In Proceedings of the Sixth International Symposium on HSC/HPC, Leipzig, Germany, June 2002; Volume 2, pp. 977–989. [Google Scholar]
- Alberti, M.G.; Enfedaque, A.; Gálvez, J.C. Fracture mechanics of polyolefin fibre reinforced concrete: Study of the influence of the concrete properties, casting procedures, the fibre length and specimen size. Eng. Fract. Mech. 2016, 154, 225–244. [Google Scholar] [CrossRef]
- Bazant, Z.P.; Ožbolt, J.; Eligehausen, R. Fracture size effect: Review of evidence for concrete structures. J. Struct. Eng. 1994, 120, 2377–2398. [Google Scholar] [CrossRef]
- Carpinteri, A.; Spagnoli, A. A fractal analysis of size effect on fatigue crack growth. Int. J. Fatigue 2004, 26, 125–133. [Google Scholar] [CrossRef]
- Bazant, Z.P. Size effect in tensile and compression fracture of concrete structures: Computational modeling and design. In Fracture Mechanics of Concrete Structures; AEDIFICATIO Publishers: Freiburg, Germany, 1998; Volume 3, pp. 1905–1922. [Google Scholar]
- Bazant, Z.P.; Gambarova, P.G. Crack shear in concrete: Crack band microplane model. J. Struct. Eng. 1984, 110, 2015–2035. [Google Scholar] [CrossRef]
- Alberti, M.G. Polyolefin Fiber-Reinforced Concrete: From Material Behavior to Numerical and Design Considerations. PhD Thesis, Universidad Politécnica de Madrid, Madrid, Spain, 2 July 2015. [Google Scholar]
- Ghasemi, M.; Ghasemi, M.R.; Mousavi, S.R. Investigating the effects of maximum aggregate size on self-compacting steel fiber reinforced concrete fracture parameters. Constr. Build. Mater. 2018, 162, 674–682. [Google Scholar] [CrossRef]
- Mahmud, G.H.; Yang, Z.; Hassan, A.M. Experimental and numerical studies of size effects of Ultra High Performance Steel Fibre Reinforced Concrete (UHPFRC) beams. Constr. Build. Mater. 2013, 48, 1027–1034. [Google Scholar] [CrossRef]
- Yoo, D.-Y.; Banthia, N.; Yang, J.-M.; Yoon, Y.-S. Size effect in normal-and high-strength amorphous metallic and steel fiber reinforced concrete beams. Constr. Build. Mater. 2016, 121, 676–685. [Google Scholar] [CrossRef]
- Cifuentes, H. Análisis del Comportamiento en Fractura y del Efecto de Borde en Hormigones de Altas Prestaciones Reforzados Con Fibras de Polipropileno. PhD Thesis, Universidad de Sevilla, Sevilla, Spain, January 2010. [Google Scholar]
- Alberti, M.G.; Enfedaque, A.; Gálvez, J.C. A review on the assessment and prediction of the orientation and distribution of fibres for concrete. Compos. Part B Eng. 2018, 151, 274–290. [Google Scholar] [CrossRef]
- Alberti, M.G.; Enfedaque, A.; Gálvez, J.C.; Agrawal, V. Fibre distribution and orientation of macro-synthetic polyolefin fibre reinforced concrete elements. Constr. Build. Mater. 2016, 122, 505–517. [Google Scholar] [CrossRef]
- Alberti, M.G.; Enfedaque, A.; Gálvez, J.C. Comparison between polyolefin fibre reinforced vibrated conventional concrete and self-compacting concrete. Constr. Build. Mater. 2015, 85, 182–194. [Google Scholar] [CrossRef]
- European Committee for Standardization. Testing Fresh Concrete. Part 8: Self-Compacting Concrete. Slump-Flow Test; EN12350-8; European Committee for Standardization: Brussels, Belgium, 2010. [Google Scholar]
- European Committee for Standardization. Test Method for Metallic Fiber Concrete. Measuring the Flexural Tensile Strength (Limit of Proportionality (LOP), Residual); EN14651:2007+A1; European Committee for Standardization: Brussels, Belgium, 2007. [Google Scholar]
- Hoult, N.A.; Take, W.A.; Lee, C.; Dutton, M. Experimental accuracy of two dimensional strain measurements using digital image correlation. Eng. Struct. 2013, 46, 718–726. [Google Scholar] [CrossRef]
- Alberti, M.G.; Enfedaque, A.; Gálvez, J.C. On the prediction of the orientation factor and fibre distribution of steel and macro-synthetic fibres for fibre reinforced concrete. Cem. Concr. Compos. 2017, 77, 29–48. [Google Scholar] [CrossRef]
- Laranjeira, F.; Aguado, A.; Molins, C.; Grünewald, S.; Walraven, J.; Cavalaro, S. Framework to predict the orientation of fibers in FRC: A novel philosophy. Cem. Concr. Res. 2012, 42, 752–768. [Google Scholar] [CrossRef]
- Alberti, M.G.; Enfedaque, A.; Gálvez, J.C.; Agrawal, V. Reliability of polyolefin fibre reinforced concrete beyond laboratory sizes and construction procedures. Compos. Struct. 2016, 140, 506–524. [Google Scholar] [CrossRef]
- Bazant, Z.P.; Planas, J. Fracture and Size Effect in Concrete and Other Quasibrittle Materials; CRC Press: Boca Raton, FL, USA, 1997; Volume 16. [Google Scholar]
- Alberti, M.G.; Enfedaque, A.; Gálvez, J.C. On the mechanical properties and fracture behavior of polyolefin fiber-reinforced self-compacting concrete. Constr. Build. Mater. 2014, 55, 274–288. [Google Scholar] [CrossRef]


| Material | SCC10 | PF48 Fibre Properties | |
|---|---|---|---|
| Cement (kg/m3) | 375 | Length (mm) | 48 |
| Limestone (kg/m3) | 200 | Equivalent diameter (mm) | 0.903 |
| Water (kg/m3) | 188 | Aspect ratio | 53 |
| Water/cement | 0.5 | Tensile strength (MPa) | >400 |
| Gravel (kg/m3) | 245 | Density (g/cm3) | 0.91 |
| Grit (kg/m3) | 367 | Modulus of elasticity (GPa) | >6 |
| Sand (kg/m3) | 918 | Fibre shape | Straight |
| Superplasticizer (% cement) | 1.25 | Surface structure | Rough |
| PF48 (kg/m3) | 10 | Fibres per kg | 32,895 |
| Fibre volume fraction (%) | 1.10 | ||
| Specimen | Units | Length (mm) | Width (mm) | High (mm) |
|---|---|---|---|---|
| Large | 3 | 1350 | 50 | 300 |
| Medium | 2 | 675 | 50 | 150 |
| Small | 3 | 340 | 50 | 75 |
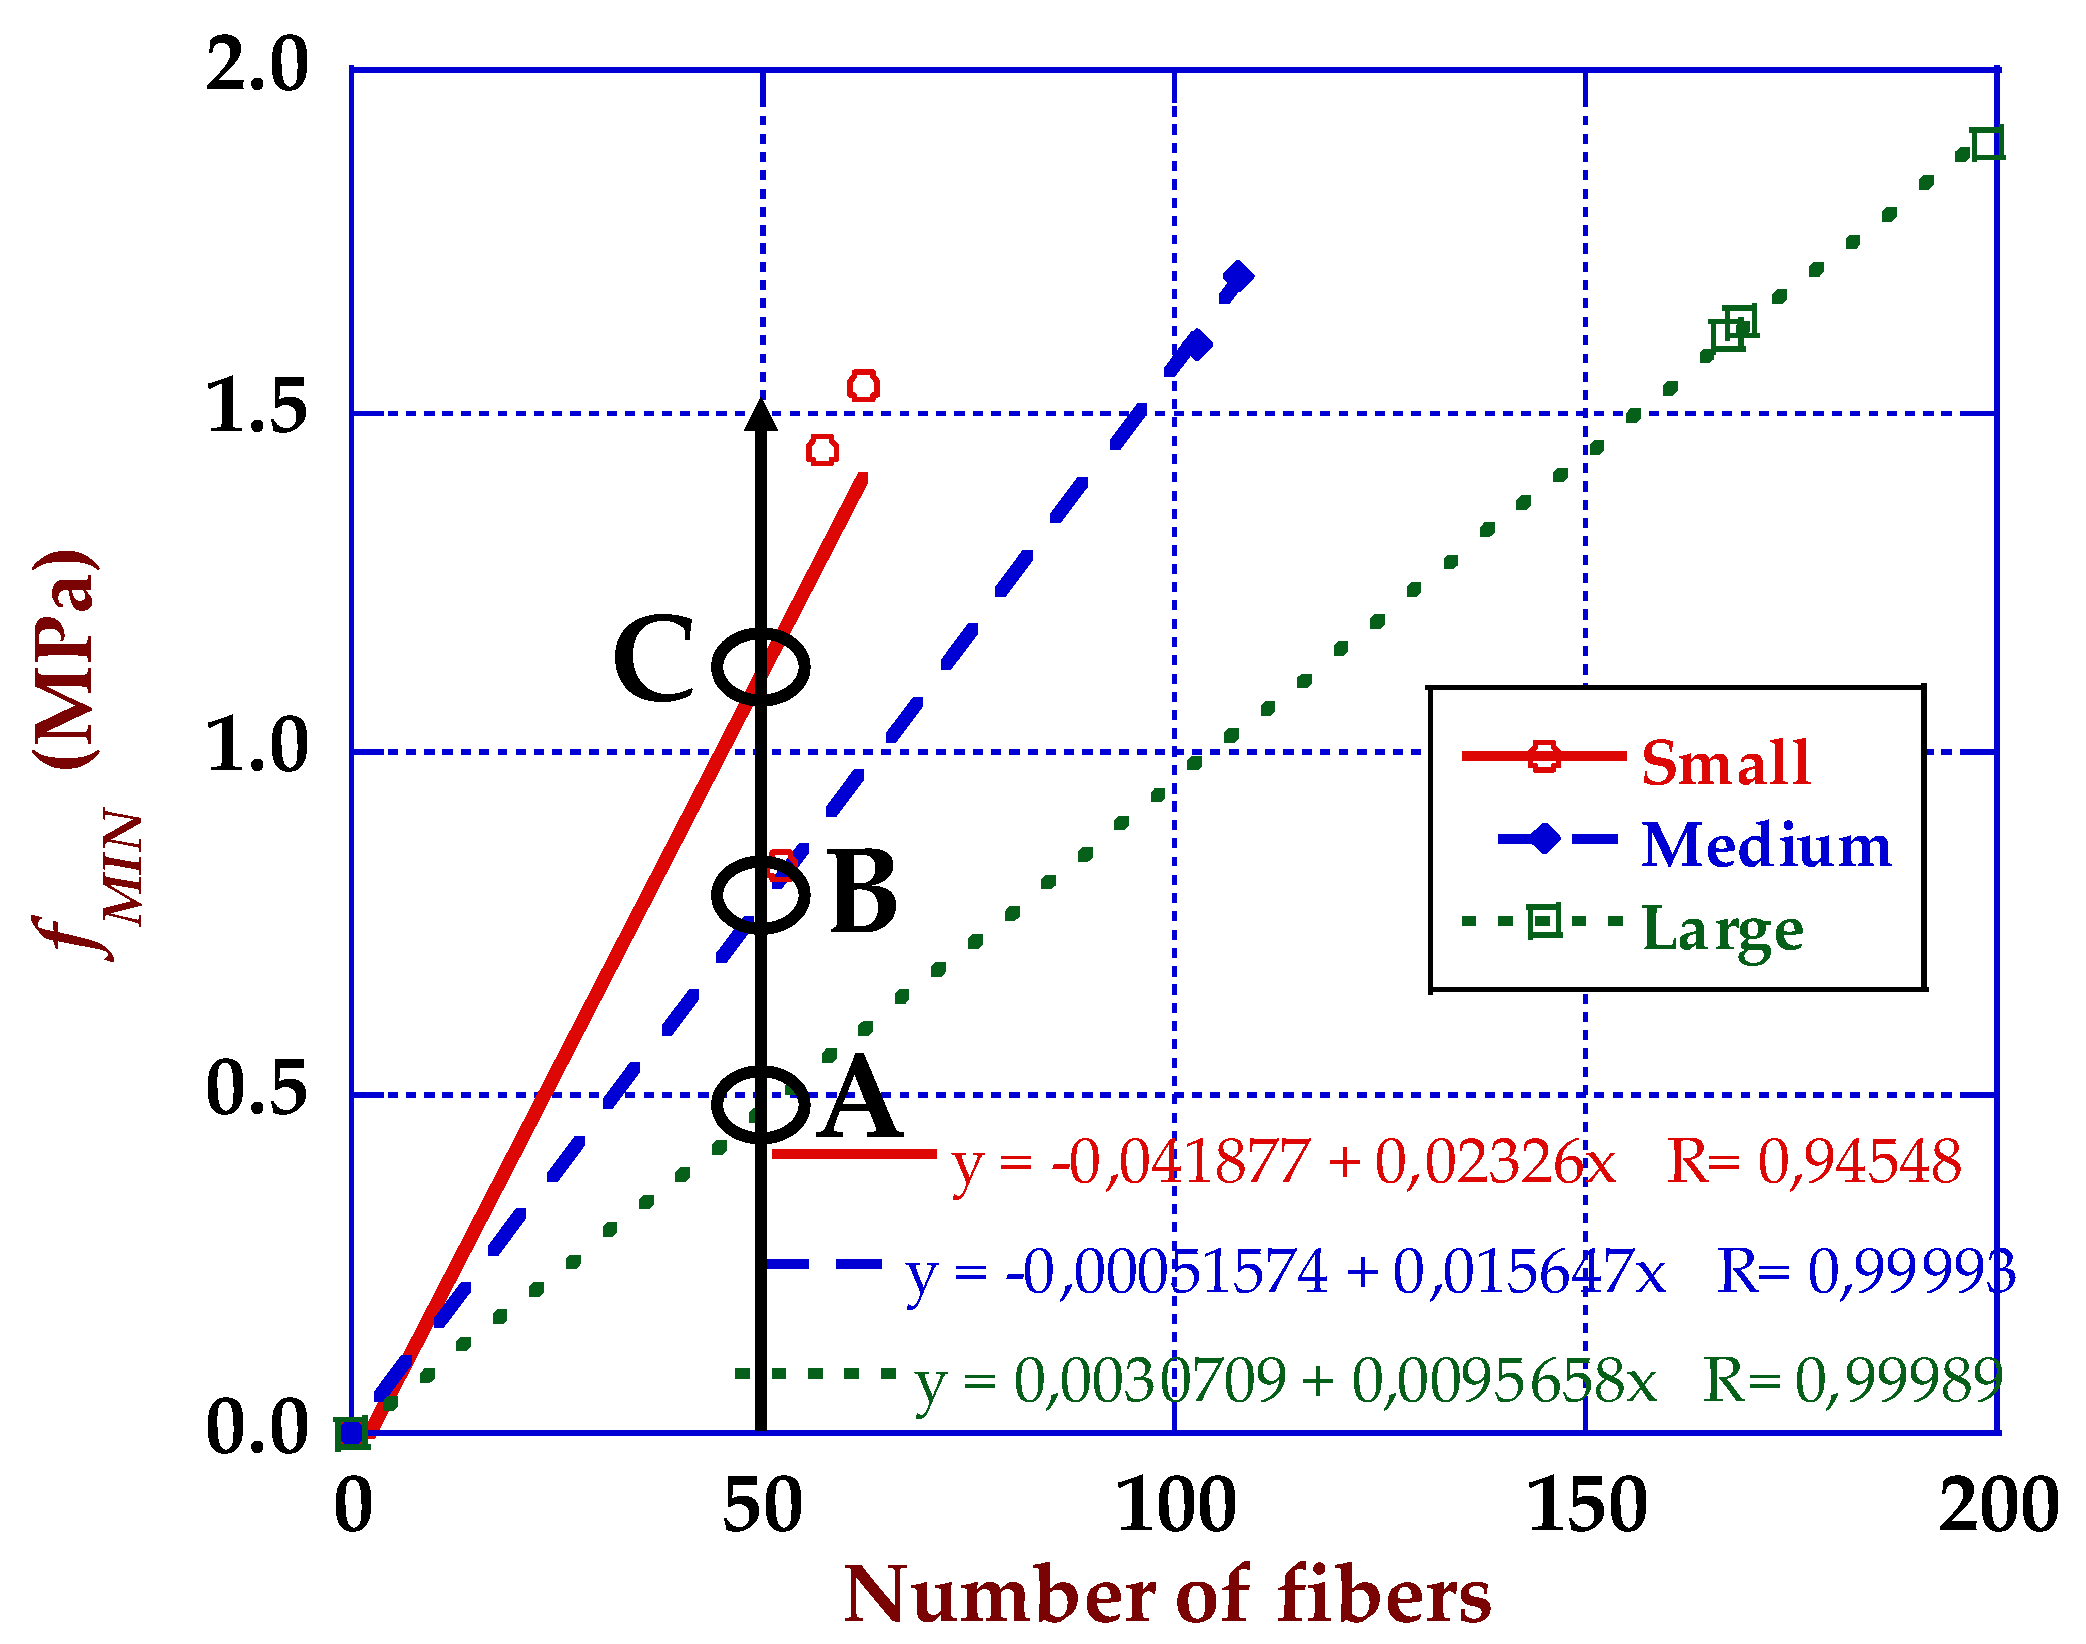
| Specimen | Fibres (c.v.) | Orientation Factor (θ) |
|---|---|---|
| Large | 178 (0.10) | 0.63 |
| Medium | 106 (0.03) | 0.62 |
| Small | 57 (0.08) | 0.72 |
| Specimen | GF (1 mm) | GF (5 mm) | GF (10 mm) | GF (15 mm) |
|---|---|---|---|---|
| Large | 249 (0.06) | 1436 (0.21) | 2979 (0.21) | 3939 (0.15) |
| Medium | 242 (0.01) | 1374 (0.01) | 2495 (0.01) | 2722 (0.05) |
| Small | 163 (0.25) | 1296 (0.18) | 2947 (0.18) | 3330 (0.17) |
© 2019 by the authors. Licensee MDPI, Basel, Switzerland. This article is an open access article distributed under the terms and conditions of the Creative Commons Attribution (CC BY) license (http://creativecommons.org/licenses/by/4.0/).
Share and Cite
Picazo, Á.; Alberti, M.G.; Gálvez, J.C.; Enfedaque, A.; Vega, A.C. The Size Effect on Flexural Fracture of Polyolefin Fibre-Reinforced Concrete. Appl. Sci. 2019, 9, 1762. https://doi.org/10.3390/app9091762
Picazo Á, Alberti MG, Gálvez JC, Enfedaque A, Vega AC. The Size Effect on Flexural Fracture of Polyolefin Fibre-Reinforced Concrete. Applied Sciences. 2019; 9(9):1762. https://doi.org/10.3390/app9091762
Chicago/Turabian StylePicazo, Álvaro, Marcos G. Alberti, Jaime C. Gálvez, Alejandro Enfedaque, and Abner C. Vega. 2019. "The Size Effect on Flexural Fracture of Polyolefin Fibre-Reinforced Concrete" Applied Sciences 9, no. 9: 1762. https://doi.org/10.3390/app9091762
APA StylePicazo, Á., Alberti, M. G., Gálvez, J. C., Enfedaque, A., & Vega, A. C. (2019). The Size Effect on Flexural Fracture of Polyolefin Fibre-Reinforced Concrete. Applied Sciences, 9(9), 1762. https://doi.org/10.3390/app9091762