Abstract
Thermal fatigue generally occurs in ultrasonically bonded copper joints in electronic devices as the bonding substrate is composed of plural materials, leading to differences in the coefficient of thermal expansion. In this study, we found that the thermal fatigue resistance of the ultrasonically bonded copper joints was influenced by the grain size and hardness of the bonding substrate through the evaluation of the thermal fatigue properties. Copper alloys C1020 and C1940 were used as substrate materials to investigate the influence of the initial properties of the bonding material on the thermal fatigue resistance. We evaluated the crack propagation due to thermal fatigue via thermal cycle tests. Microstructural observations of the region fractured because of thermal fatigue revealed that cracks resulting from thermal fatigue did not progress in the fine grain region formed at the bonded interface. It was inferred that grain boundaries were an obstacle to crack propagation. C1940 has higher hardness and finer grains than C1020, and showed a lower decreasing rate of the peel strength and bonding area after the thermal cycling test than C1020 joints. Thus, a hard copper material with fine grains is effective in suppressing thermal fatigue fracture of ultrasonically bonded copper joints.
1. Introduction
The electronics industry continuously demands miniaturization combined with high integration in electronic devices, e.g., power modules and printed circuit boards [1,2,3]. Meeting these demands can lead to an increase in the current density of devices [4,5]. This miniaturization and the increase in current density are likely to increase heat generation and result in temperature rise [1,6]. Therefore, using soldering for bonding in such high-temperature environments would lead to risks involving the melting of the solder and the formation of Kirkendall voids owing to diffusion.
Ultrasonic bonding is one of the solid-state bonding methods, and forms strong joints at relatively low temperatures in a short time and limits these risks [7]. Copper is a valuable material for application in electronic packaging because of its better electrical and mechanical properties than Al, and studies on the ultrasonic bonding of copper in electronic devices have recently been conducted [8]. For example, the copper/copper joints in electronic devices are composed of a copper substrate and wiring material such as a terminal copper wire. Further, the substrate is sometimes composed of plural materials. In this case, the coefficient of thermal expansion (CTE) of the substrate can be expressed using Equation (1):
where CTEmat-i is the CTE of material i, Emat-i is its Young’s modulus, and Vmat-i is its volume ratio [9]. Thus, problems in electronic devices pertain not only to high-temperature environments but also to thermal fatigue caused by the thermal stress occurring in copper/copper joints, i.e., the Cu substrate and Cu terminals. Although several studies involving thermal cycling tests of ultrasonically bonded copper joints have been conducted, no study discusses the decrease in the strength of the copper/copper joint before and after the thermal stability test [10,11]. This is because a sound joint was formed via ultrasonic bonding using high input energy in conventional studies, which has complicated the evaluation and understanding of the mechanism of thermal fatigue failure in ultrasonically bonded joints.
Therefore, in the present study, we investigated the thermal fatigue properties of ultrasonically bonded copper joints. In order to clearly understand the thermal fatigue behavior, the energy input during ultrasonic bonding was low compared to that used in conventional studies. Further, two copper alloys with different hardness and grain sizes (C1020 and C1940) were used to evaluate the improvement in the thermal fatigue resistance of the ultrasonically bonded copper joint.
2. Materials and Methods
2.1. Materials and Procedure
A copper terminal was bonded onto a copper substrate via ultrasonic bonding. As shown in Figure 1a, the short-side direction of the copper terminal was parallel to the ultrasonic vibration. The energy, frequency, load and amplitude applied to the bonding material during ultrasonic bonding were 700 J, 21 kHz, 800 N and 33.2 µm, respectively. As the ultrasonic bonding was finished when the energy reached 700 J, this bonding time was not uniform, ranging from 620 to 788 ms. The copper alloy used for the copper terminal was C1020, and the copper terminal had a thickness of 1.5 mm and an area of 5 × 6 mm. The copper alloys used for the copper substrate were C1020 and C1940. Table 1 provides the chemical composition and physical properties of C1020 and C1940. C1020, an oxygen-free copper alloy, is commonly used in electronic parts. C1940 is a copper alloy used for producing electronic parts with better mechanical properties than C1020. C1940 has higher hardness and a finer grain size than C1020. Figure 2 shows the grain orientation maps of the C1020 and C1940 substrates. The following types of joints were fabricated using these copper alloys: C1020 joints composed of a terminal and substrate made of C1020, and C1940 joints composed of a C1020 terminal and C1940 substrate.
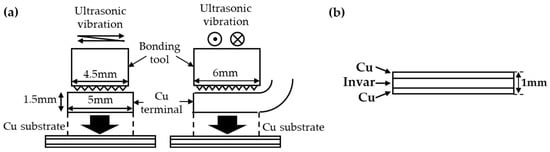
Figure 1.
Schematic illustration of the specimen used for the ultrasonic bonding process. (a) The size of the bonding tool and copper terminal. (b) A clad material composed of copper/invar/copper used for the bonding substrate.

Table 1.
Chemical composition and physical property values of the copper alloys used in this study.
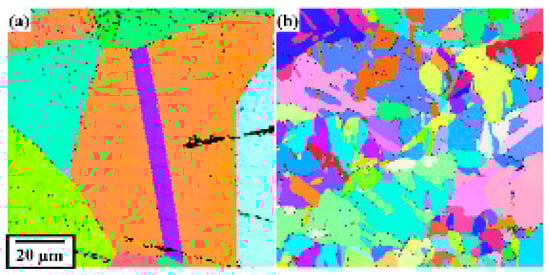
Figure 2.
Orientation maps of (a) C1020 and (b) C1940 substrates.
To evaluate the thermal fatigue properties of ultrasonically bonded copper joints, it is necessary to induce thermal stress at the interface based on the difference in the CTE. Hence, a clad material composed of copper/invar/copper with a thickness of 1 mm (Figure 1b) was prepared. As invar, a nickel-iron alloy, has a low CTE, inserting invar between the copper terminal and copper substrate can lower the CTE at the interface [12], causing a difference in the CTE between the substrate and terminal. The apparent linear expansion coefficient of the entire copper substrate calculated using the compound law was 4.4 ppm/K for both the C1020 and C1940 substrates. Table 2 summarizes the apparent CTE and average grain size of the copper substrates.
Table 2.
Properties of copper substrates.
2.2. Thermal Cycling Test
It is necessary to cause thermal fatigue fracture in both C1020 and C1940 joints to evaluate their thermal fatigue properties. The thermal cycling tests were conducted for 2192 cycles, which is a sufficient number of cycles to cause such a fracture. Each cycle had a period of 30 min, and the temperature range was −55 °C to 175 °C. For each joint before and after the thermal cycling test, peel tests and measurements of the bonding area were performed. The ductile fracture area observed in SEM images of the fracture surface was determined to be the bonding area.
2.3. Observation of Microstructure
The effect of the microstructure of ultrasonically bonded copper joints on their thermal fatigue properties was analyzed. Figure 3 shows the typical fracture surface of the C1020 joint. The copper-colored parts indicate the bonding interface; many bonding interfaces with needle-like structures are formed parallel to the direction of ultrasonic vibration. It is possible to observe each joint by cutting a cross-section perpendicular to the ultrasonic vibration. Microstructural analyses were performed using an optical microscope (OM) and scanning electron microscopy (SEM; JEOL Ltd., JSM-6500F, Tokyo, Japan and Hitachi High-Technologies Co., S-3000H, Tokyo, Japan) equipped with electron backscatter diffraction (EBSD). As for the EBSD analysis, image quality (IQ) and inverse pole figure (IPF) maps, which represented the information of the diffraction intensity and the crystal orientation, were obtained near the bonding interface.
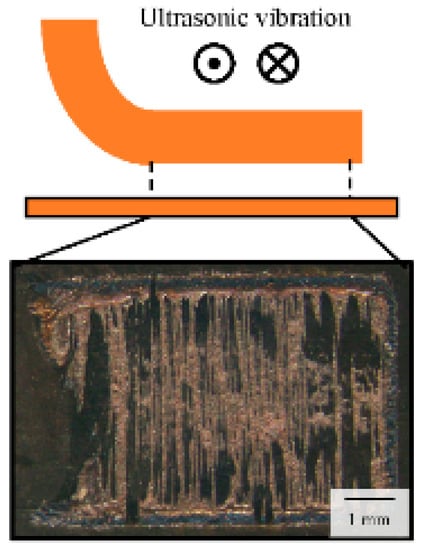
Figure 3.
Stereomicroscope image of fracture surface of the C1020 joint.
3. Results and Discussion
3.1. Effect of Thermal Fatigue Fracture on Mechanical Properties
Figure 4a shows the results of the peel strength test and the value of the bonding area of the C1020 joints before and after the thermal cycling test. The bonding area was obtained from the results of the fracture tests, as shown in Figure 4b. The strength after the thermal cycling test was 240 N, while the peel strength before the thermal cycling test was 409.5 N (Figure 4a). The bonding area changed from 12.6 mm2 to 3.69 mm2 after the thermal cycling test. Figure 4b shows the stereomicroscope images of the fractured surface obtained after the peel strength test. There were bright or dark regions on the fracture surface; the bright regions were present as stripes, and the number decreased after the thermal cycle tests. Figure 4c shows the SEM image of the boundary of a stripe. We observed dimples indicating ductile fracture inside the stripe, while the surface of the dark region was smooth. Hence, the bright and dark regions corresponded originally to the bonded and unbonded regions, respectively. To define the bonding area after the thermal cycling test, the sample was dipped into a dye penetrant before starting the thermal cycling test, which could show either the initial unbonded region or that produced during the thermal fatigue test based on the difference in oxidation behavior. For example, Figure 4d shows the representative backscattered electron (BSE) image of the fractured surface after the thermal cycling test; the stripes corresponding to the initial bonded region are shown in dark color. Although the center of the fracture surface exhibits a bright oval region, the surrounding region is dark, indicating that the surrounding region was oxidized during the thermal cycling test. In this case, the bonded area can be estimated as the area of the stripes inside the bright oval region. Thus, the bonded area should decrease after the thermal cycling test. From these results, we inferred that the decrease in the peel strength could be attributed to the reduced bonding area due to the thermal fatigue generated during the thermal cycling test.
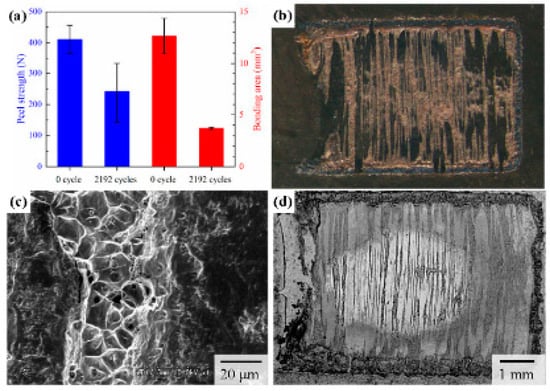
Figure 4.
Measurement results of the peel strength and bonding area of the C1020 joints before and after the thermal cycling test. (a) Results of peel strength and bonding area. (b) Representative stereomicroscope image of the fractured surface. (c) SEM image of the boundary of a stripe. (d) Representative backscattered electron (BSE) image of the fractured surface after thermal cycling tests.
3.2. Crack Propagation Behavior during Thermal Fatigue Fracture
Figure 5 shows the cross-sectional OM and SEM images of the C1020 joints obtained perpendicular to the ultrasonic vibration before and after the thermal cycling test. In Figure 5a, the black line at the joint interface corresponds to the unbonded region, which became enlarged after the thermal cycling test. As shown in Figure 5b, narrow cracks were present near the bonded region, which propagated from the thick unbonded region after the thermal cycling test, although the width of the unbonded region was nearly the same as that before the thermal cycling test. This result revealed that the initial unbonded region was enlarged by the thermal stress produced during the thermal cycling test, and the cracks were initiated and propagated to the bonded regions. It should be noted that the narrow cracks propagated diagonally near the bonded region. To investigate crack propagation during the thermal fatigue test, EBSD was performed for the C1020 joints.
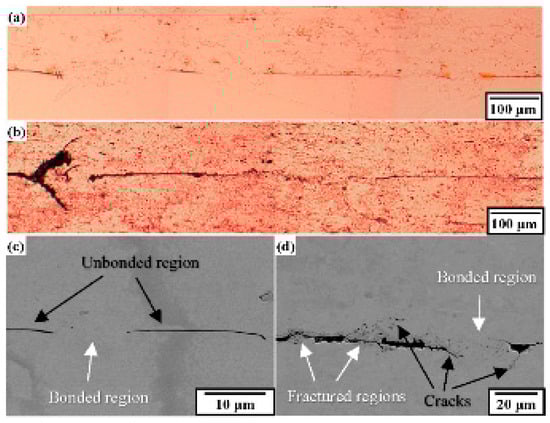
Figure 5.
Cross-sectional images of the heel region in C1020 joints before (a,c) and after (b,d) thermal cycling test. (a,b) optical microscope (OM) images of the joint. (c,d) SEM images of the bonded region.
Figure 6 shows SEM and EBSD images of the cross-section of the C1020 joints. Figure 6a,b respectively show the SEM image and IQ + IPF map before the thermal cycling test. The black region at the edge of the bonded region corresponds to the unbonded region. Crystal grains were refined in the bonded region approximately 20 μm above and below the bonding interface. The grain size at the bonded region was reduced to 2.5 μm (bonded region at the left) or 12.1 μm (bonded region at the center) from 46.2 μm on the C1020 substrate or 16.5 μm at the C1020 terminal. These results revealed that ultrasonic bonding induced grain refinement at the interface rather than in the base material. Figure 6c,d show the SEM image and IQ + IPF map after the thermal cycling test. EBSD analysis was performed on not the completely fractured region but the same region during fracturing to evaluate the crack propagation behavior. The cracks were present at the edge of the bonded region. We confirmed that these cracks, initiated from the unbonded region as shown in Figure 5, propagated around the fine grains of the bonded region. On the other hand, cracks propagating in the refined region on the right side corresponded to the initially bonded region. It has been reported that the grain boundary can be an obstacle to crack propagation [13,14]. Therefore, we inferred that the cracks did not propagate into the refined region that had many obstacles and that cracks propagated along a route with few grain boundaries around the fine grain region. When the refined region is narrow, there are few obstacles, and these cannot inhibit crack propagation. This finding suggests that increasing the grain boundary could be effective in suppressing crack propagation caused by thermal fatigue.
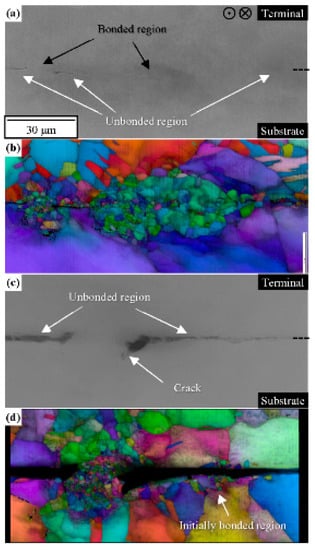
Figure 6.
Electron backscatter diffraction (EBSD) results of the cross-section of C1020 joints perpendicular to the ultrasonic vibration. (a,c) SEM images and (b,d) image quality (IQ) + inverse pole figure (IPF) maps of the joints before and after thermal cycling tests, respectively.
3.3. Suppression of Thermal Fatigue Fracture in C1940 Joints
To suppress the thermal fatigue fracture of the ultrasonically bonded copper joints, C1940 was prepared as the bonding substrate, as C1940 has finer grains than C1020. In order to clarify the influence of grain size on the thermal fatigue properties of the ultrasonically bonded joint, the same bonding conditions and the same number of thermal cycles were applied to the C1020 and C1940 joints. Thermal cycling tests were also performed for the C1940 joints. Figure 7 shows the peel strength and bonding area of the C1940 joints before and after the thermal cycling test; the values of the peel strength and bonding area of the C1020 joint are also presented for comparison. The blue and red bars correspond to the C1020 and C1940 joints, respectively. Figure 7a shows the peel strengths of the C1020 and C1940 joints. The peel strength decreased by 41% after the thermal cycling test for the C1020 joints. On the other hand, that of the C1940 joints decreased by 25% after the thermal cycling test. Figure 7b shows the bonding area of the C1020 joint and C1940 joints. The bonding area decreased by 70% and 7% after the thermal cycling test for the C1020 and C1940 joints, respectively. These results revealed the low decrease rate of the bonding area after the thermal cycling test led to the suppression of the decrease rate of the peel strength for the C1940 joints. Thus, it was found that thermal fatigue fracture could be suppressed by using C1940 as the substrate material.
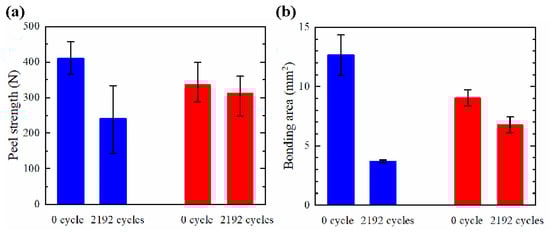
Figure 7.
Results of (a) peel strength and (b) bonding area of the C1020 joints and the C1940 joints before and after the thermal cycling test.
Figure 8 shows cross-sectional SEM and EBSD images of the C1940 joints. Figure 8a,b show the SEM image and IQ + IPF map, respectively, before the thermal cycling test. As with the C1020 joint, the crystal grains were refined in the bonded region. However, in stark contrast with the EBSD image of the C1020 joint, the grain size of the substrate was finer. Nonetheless, the microstructures of the two joints were not considerably different. Figure 8c,d show the SEM image and IQ + IPF map, respectively, after the thermal cycling test. Figure 8 shows that the cracks progressed very little, thus, the difference in the composition of the alloy can be excluded as the main factor influencing the suppression of thermal fatigue failure. If the difference in the alloy was the main factor in suppressing thermal fatigue, the fracture should have progressed on the C1020 terminal side. In the next section, we focus on particle size, which is the reason why C1940 was prepared as the substrate, and discuss each factor that suppressed thermal fatigue fracture in the C1940 joint.
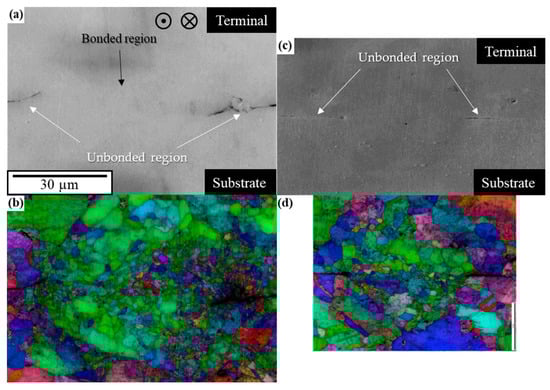
Figure 8.
EBSD results of the cross-section of C1940 joints perpendicular to the ultrasonic vibration. (a,c) SEM images and (b,d) IQ + IPF maps of the joints before and after thermal cycling tests, respectively.
3.4. Discussion on the Suppression of Thermal Fatigue Fracture in C1940 Joints
In this section, we discuss the reason why thermal fatigue fracture was suppressed in C1940 joints and not in C1020 joints. Figure 9 shows the average grain size in the vicinity of the bonding interface of both the C1020 and C1940 joints, where the blue and red bars respectively correspond to the C1020 and C1940 joints. The average grain size was estimated as the average value of grain sizes within a region of height 10 μm and the width of the bonded interface. The left axis is the distance from the bonding interface to the center of the region. The direction from the bonding interface toward the Cu terminal is the positive direction.
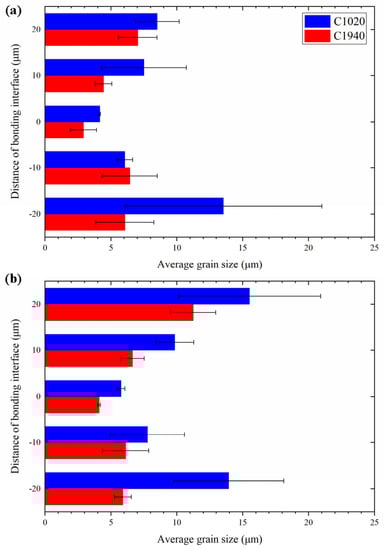
Figure 9.
Average grain size of C1020 joints and C1940 joints (a) before and (b) after the thermal cycling test.
As shown in Figure 9a, the grain size in C1940 joints was smaller than that of the C1020 joints at both the substrate and terminal sides before the thermal cycling test. Grain refinement on the substrate side for C1940 joints was attributed to the use of a substrate already having a small crystal grain size. In contrast, as C1020 was used in the terminal of both C1020 and C1940 joints, it was supposed that the difference in the grain size of the terminal originated from the ultrasonic bonding process. Although the mechanism of the bonding process in ultrasonic bonding is not completely understood [15], it is roughly understood to consist of two processes. (1) The surface layer such as an oxide film is broken by the sliding friction between the bonding materials. (2) The exposed clean surfaces adhere to each other owing to plastic deformation [15,16]. As the C1940 substrate is harder than the C1020 substrate, the time required for these two processes after the onset of ultrasonic bonding increases. It has been reported that the grain size of copper subjected to sliding friction becomes finer [17]. Grain sizes in the terminal of C1940 joints were thought to be finer owing to an increase in the time for which they were subjected to sliding friction. This behavior also explains why the peel strength and bonding area of C1940 joints before the thermal cycle test were lower than those of the C1020 joints. Because the sliding friction time was longer on the C1940 joint, less time was spent on bonding than on the C1020 joint, so the peel strength and the bonding area were considered to be reduced. Figure 9b shows the average grain size of C1020 and C1940 joints after the thermal cycling test. The grain size of C1940 joints was finer than that of C1020 joints on both the substrate and terminal sides even after the thermal cycling test. Thus, during the thermal cycling test, in the C1940 joint, where the vicinity of the bonding interface was constituted by finer grains, it was found that crack propagation was suppressed because of many grain boundaries and the thermal fatigue resistance was better than the C1020 joint.
Therefore, to effectively suppress thermal fatigue fracture in ultrasonically bonded copper joints, it is recommended to use a hard substrate with fine grains that can form fine grains around the bonding interface.
4. Conclusions
In summary, the influence of the microstructure of ultrasonically bonded copper joints on thermal fatigue properties was evaluated. We achieved an improvement of the thermal fatigue resistance property of joints based on designing the bonding substrate. The main conclusions are as follows:
- Microstructural observations of the C1020 joints confirmed that the bonding interface was formed by fine grains. As the grain boundary can be an obstacle to crack propagation, the cracks caused by thermal fatigue did not progress to the fine grain region and propagated by avoiding that region.
- C1940 joints with a harder substrate and finer grain size than C1020 joints resisted thermal fatigue fracture during thermal cycling tests. As the vicinity of the bonding interface was constituted by finer grains in the C1940 joint, crack propagation in the bonding interface of C1940 joints was suppressed because of the presence of more grain boundaries.
- Grain refinement was also confirmed at the terminal of the C1940 joint containing the same material as that used in the terminal of the C1020 joint. It was considered that the time for which the terminal was subjected to sliding friction increased owing to hardening of the substrate, and the grains of the terminal that were subjected to longer processing times were finer.
Author Contributions
Conceptualization, T.Y. and A.H.; experiments and data analyses, T.F., Y.T. and T.M.; discussion, all authors; writing, T.F. and T.M.
Funding
This research received no external funding.
Conflicts of Interest
The authors declare no conflicts of interest.
References
- Kim, J.; Jung, K.-H.; Kim, J.-H.; Lee, C.-J.; Jung, S.-B. Electromigration behaviors of Sn58%Bi solder containing Ag-coated MWCNTs with OSP surface finished PCB. J. Alloys Compd. 2019, 775, 581–588. [Google Scholar] [CrossRef]
- Chan, Y.C.; Yang, D. Failure mechanisms of solder interconnects under current stressing in advanced electronic packages. Prog. Mater. Sci. 2010, 55, 428–475. [Google Scholar] [CrossRef]
- Kim, J.-H.; Lee, Y.-C.; Lee, S.-M.; Jung, S.-B. Effect of surface finishes on electromigration reliability in eutectic Sn–58Bi solder joints. Microelectron. Eng. 2014, 120, 77–84. [Google Scholar] [CrossRef]
- Bashir, M.N.; Haseeb, A.S.; Rahman, A.Z.; Fazal, M.A.; Kao, C.R. Reduction of electromigration damage in SAC305 solder joints by adding Ni nanoparticles through flux doping. J. Mater. Sci. 2015, 50, 6748–6756. [Google Scholar] [CrossRef]
- Lu, Y.-D.; He, X.-Q.; En, Y.-F.; Wang, X.; Zhuang, Z.-Q. Polarity effect of electromigration on intermetallic compound formation in SnPb solder joints. Acta Mater. 2009, 57, 2560–2566. [Google Scholar] [CrossRef]
- Tang, H.; Tang, Y.; Wan, Z.; Li, J.; Yuan, W.; Lu, L.; Li, Y.; Tang, K. Review of applications and developments of ultra-thin micro heat pipes for electronic cooling. Appl. Energy 2018, 223, 383–400. [Google Scholar] [CrossRef]
- Tanaka, Y.; Fujiwara, S.; Ogura, T.; Sano, T.; Hirose, A. Interfacial microstructure evolution and thermal reliability of copper/nickel joints formed by ultrasonic bonding. Q. J. Jpn. Weld. Soc. 2013, 31, 192–196. [Google Scholar] [CrossRef]
- Maeda, M.; Sato, T.; Inoue, N.; Yagi, D.; Takahashi, Y. Anomalous microstructure formed at the interface between copper ribbon and tin-deposited copper plate by ultrasonic bonding. Microelectron. Reliab. 2011, 51, 130–136. [Google Scholar] [CrossRef]
- Yamanaka, K.; Kobayashi, K.; Hayashi, K.; Fukui, M. Advanced Surface Laminar Circuit Packaging with low Coefficient of Thermal Expansion and high wiring density. In Proceedings of the 2009 59th Electronic Components and Technology Conference, San Diego, CA, USA, 26–29 May 2009; pp. 325–332. [Google Scholar]
- Arjmand, E.; Agyakwa, P.A.; Corfield, M.R.; Li, J.; Mouawad, B.; Johnson, C.M. A thermal cycling reliability study of ultrasonically bonded copper wires. Microelectron. Reliab. 2016, 59, 126–133. [Google Scholar] [CrossRef]
- Myung, W.-R.; Kim, K.-Y.; Kim, Y.; Jung, S.-B. The reliability of ultrasonic bonded Cu to Cu electrode for 3D TSV stacking. J. Mater. Sci. Mater. Electron. 2017, 28, 16467–16475. [Google Scholar] [CrossRef]
- Tanimoto, S.; Tanisawa, H.; Watanabe, K.; Matsui, K.; Sato, S. Power Module Package Structure Capable of Surviving Greater ΔTj Thermal Cycles. Mater. Sci. Forum 2013, 740–742, 1040–1043. [Google Scholar] [CrossRef]
- Lu, W.; Chakravarthula, S.S.; Chen, J.; Qiao, Y. Propagation of a cleavage crack front across a field of persistent grain boundaries. Int. J. Solids Struct. 2012, 49, 584–589. [Google Scholar] [CrossRef]
- Kanninen, M.F.; Popelar, C.H. Advanced Fracture Mechanics; Oxford University Press: Oxford, UK, 1985. [Google Scholar]
- Zhang, C.; Li, L. A Coupled Thermal-Mechanical Analysis of Ultrasonic Bonding Mechanism. Metall. Mater. Trans. B Process Metall. Mater. Process. Sci. 2007, 40, 196–207. [Google Scholar] [CrossRef]
- Daniels, H.P.C. Ultrasonic welding. Ultrasonics 1965, 3, 190–196. [Google Scholar] [CrossRef]
- Deng, S.Q.; Godfrey, A.; Liu, W.; Zhang, C.L. Microstructural evolution of pure copper subjected to friction sliding deformation at room temperature. Mater. Sci. Eng. A 2015, 639, 448–455. [Google Scholar] [CrossRef]
© 2019 by the authors. Licensee MDPI, Basel, Switzerland. This article is an open access article distributed under the terms and conditions of the Creative Commons Attribution (CC BY) license (http://creativecommons.org/licenses/by/4.0/).