Hydrothermal Conversion of Red Mud into Magnetic Adsorbent for Effective Adsorption of Zn(II) in Water

Abstract
Featured Application
Abstract

1. Introduction
2. Materials and Methods
2.1. Red Mud
2.2. Synthesis of Magnetic Adsorbent
2.3. Adsorption Experiment
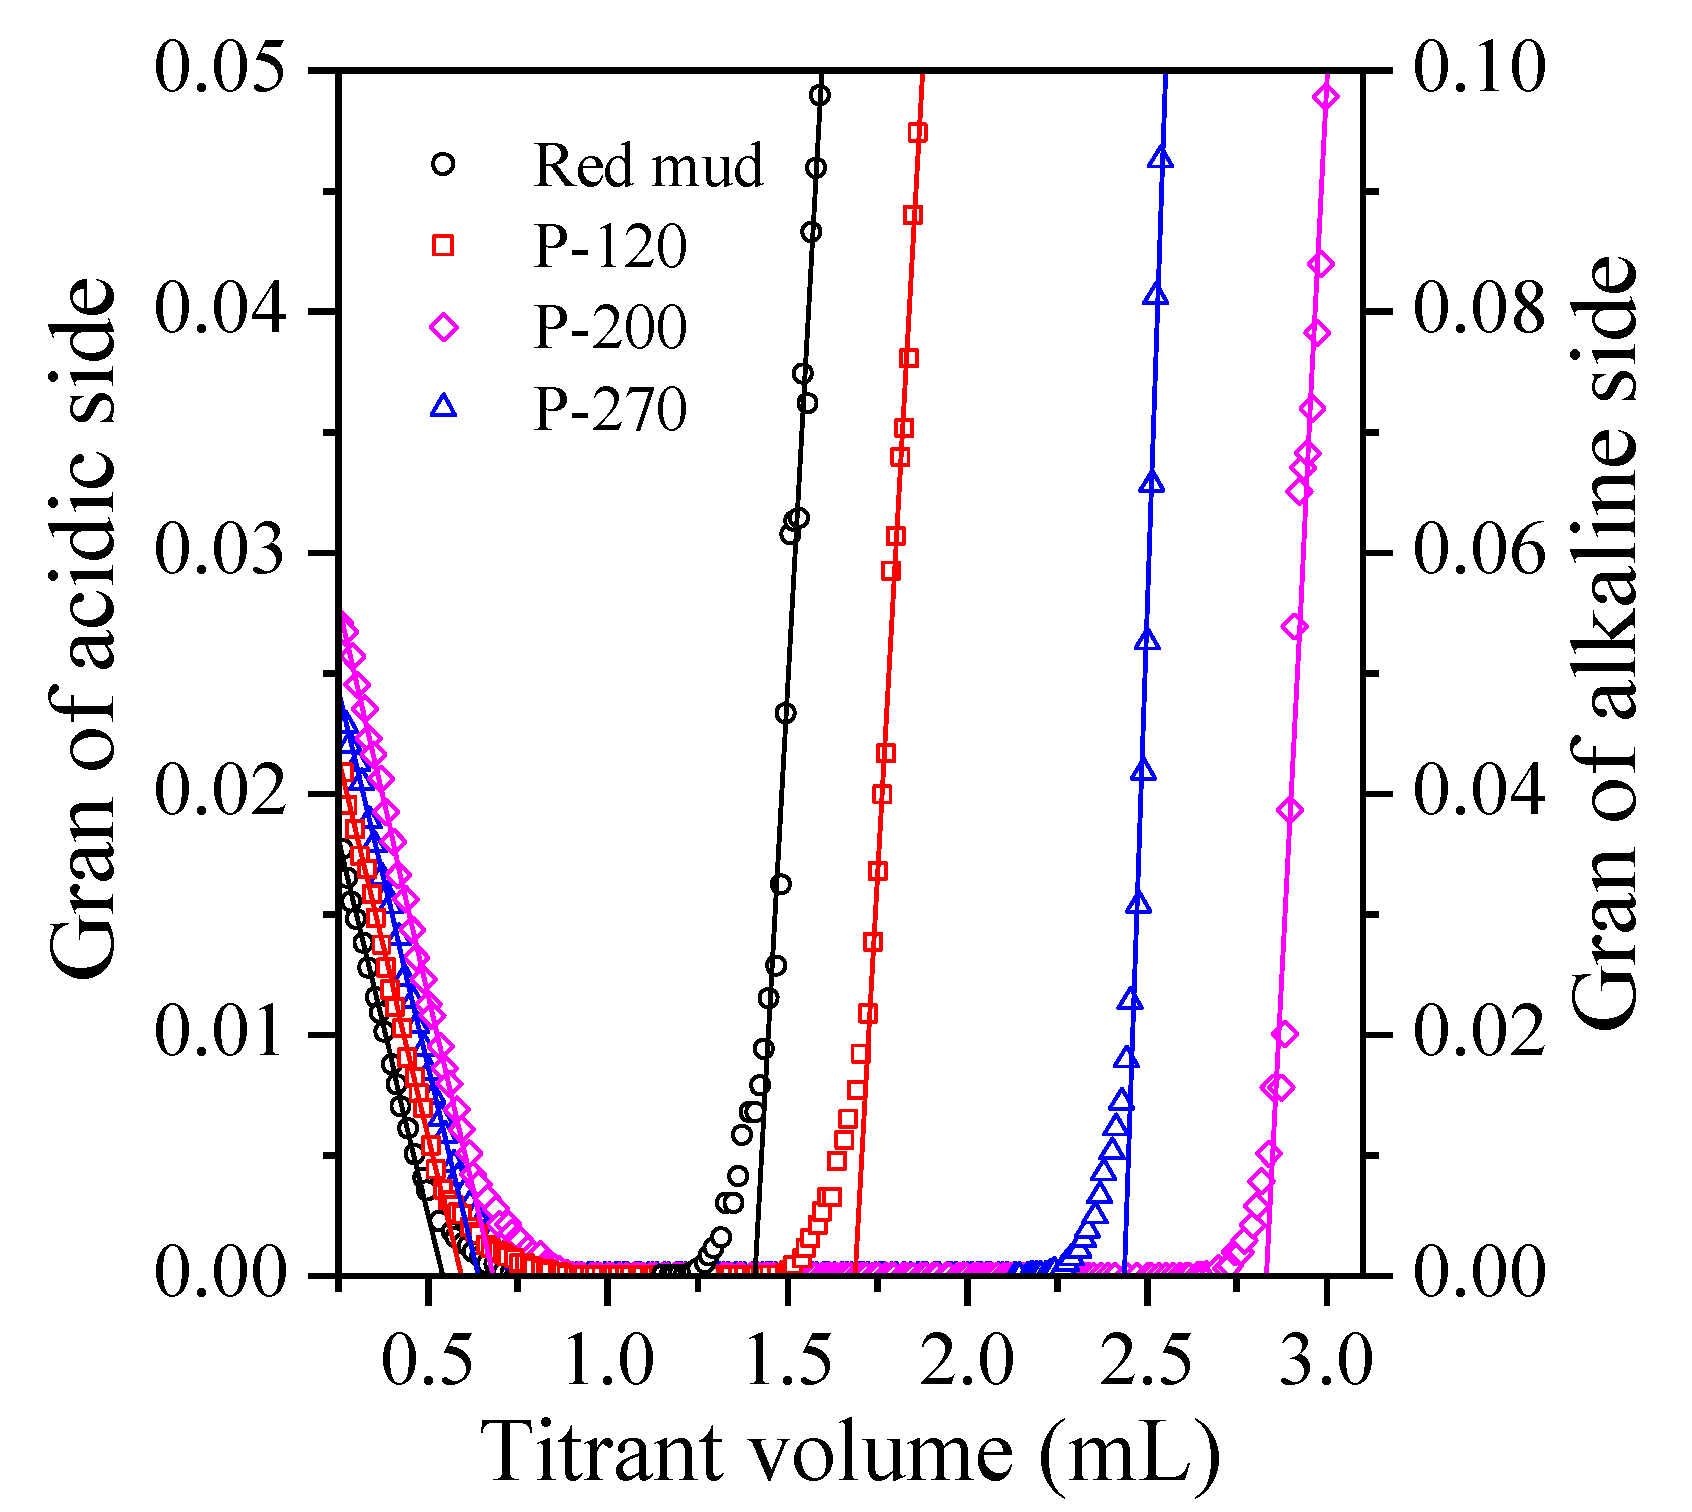
2.4. Surface Site Concentration
2.5. Characteristics
3. Results and Discussion
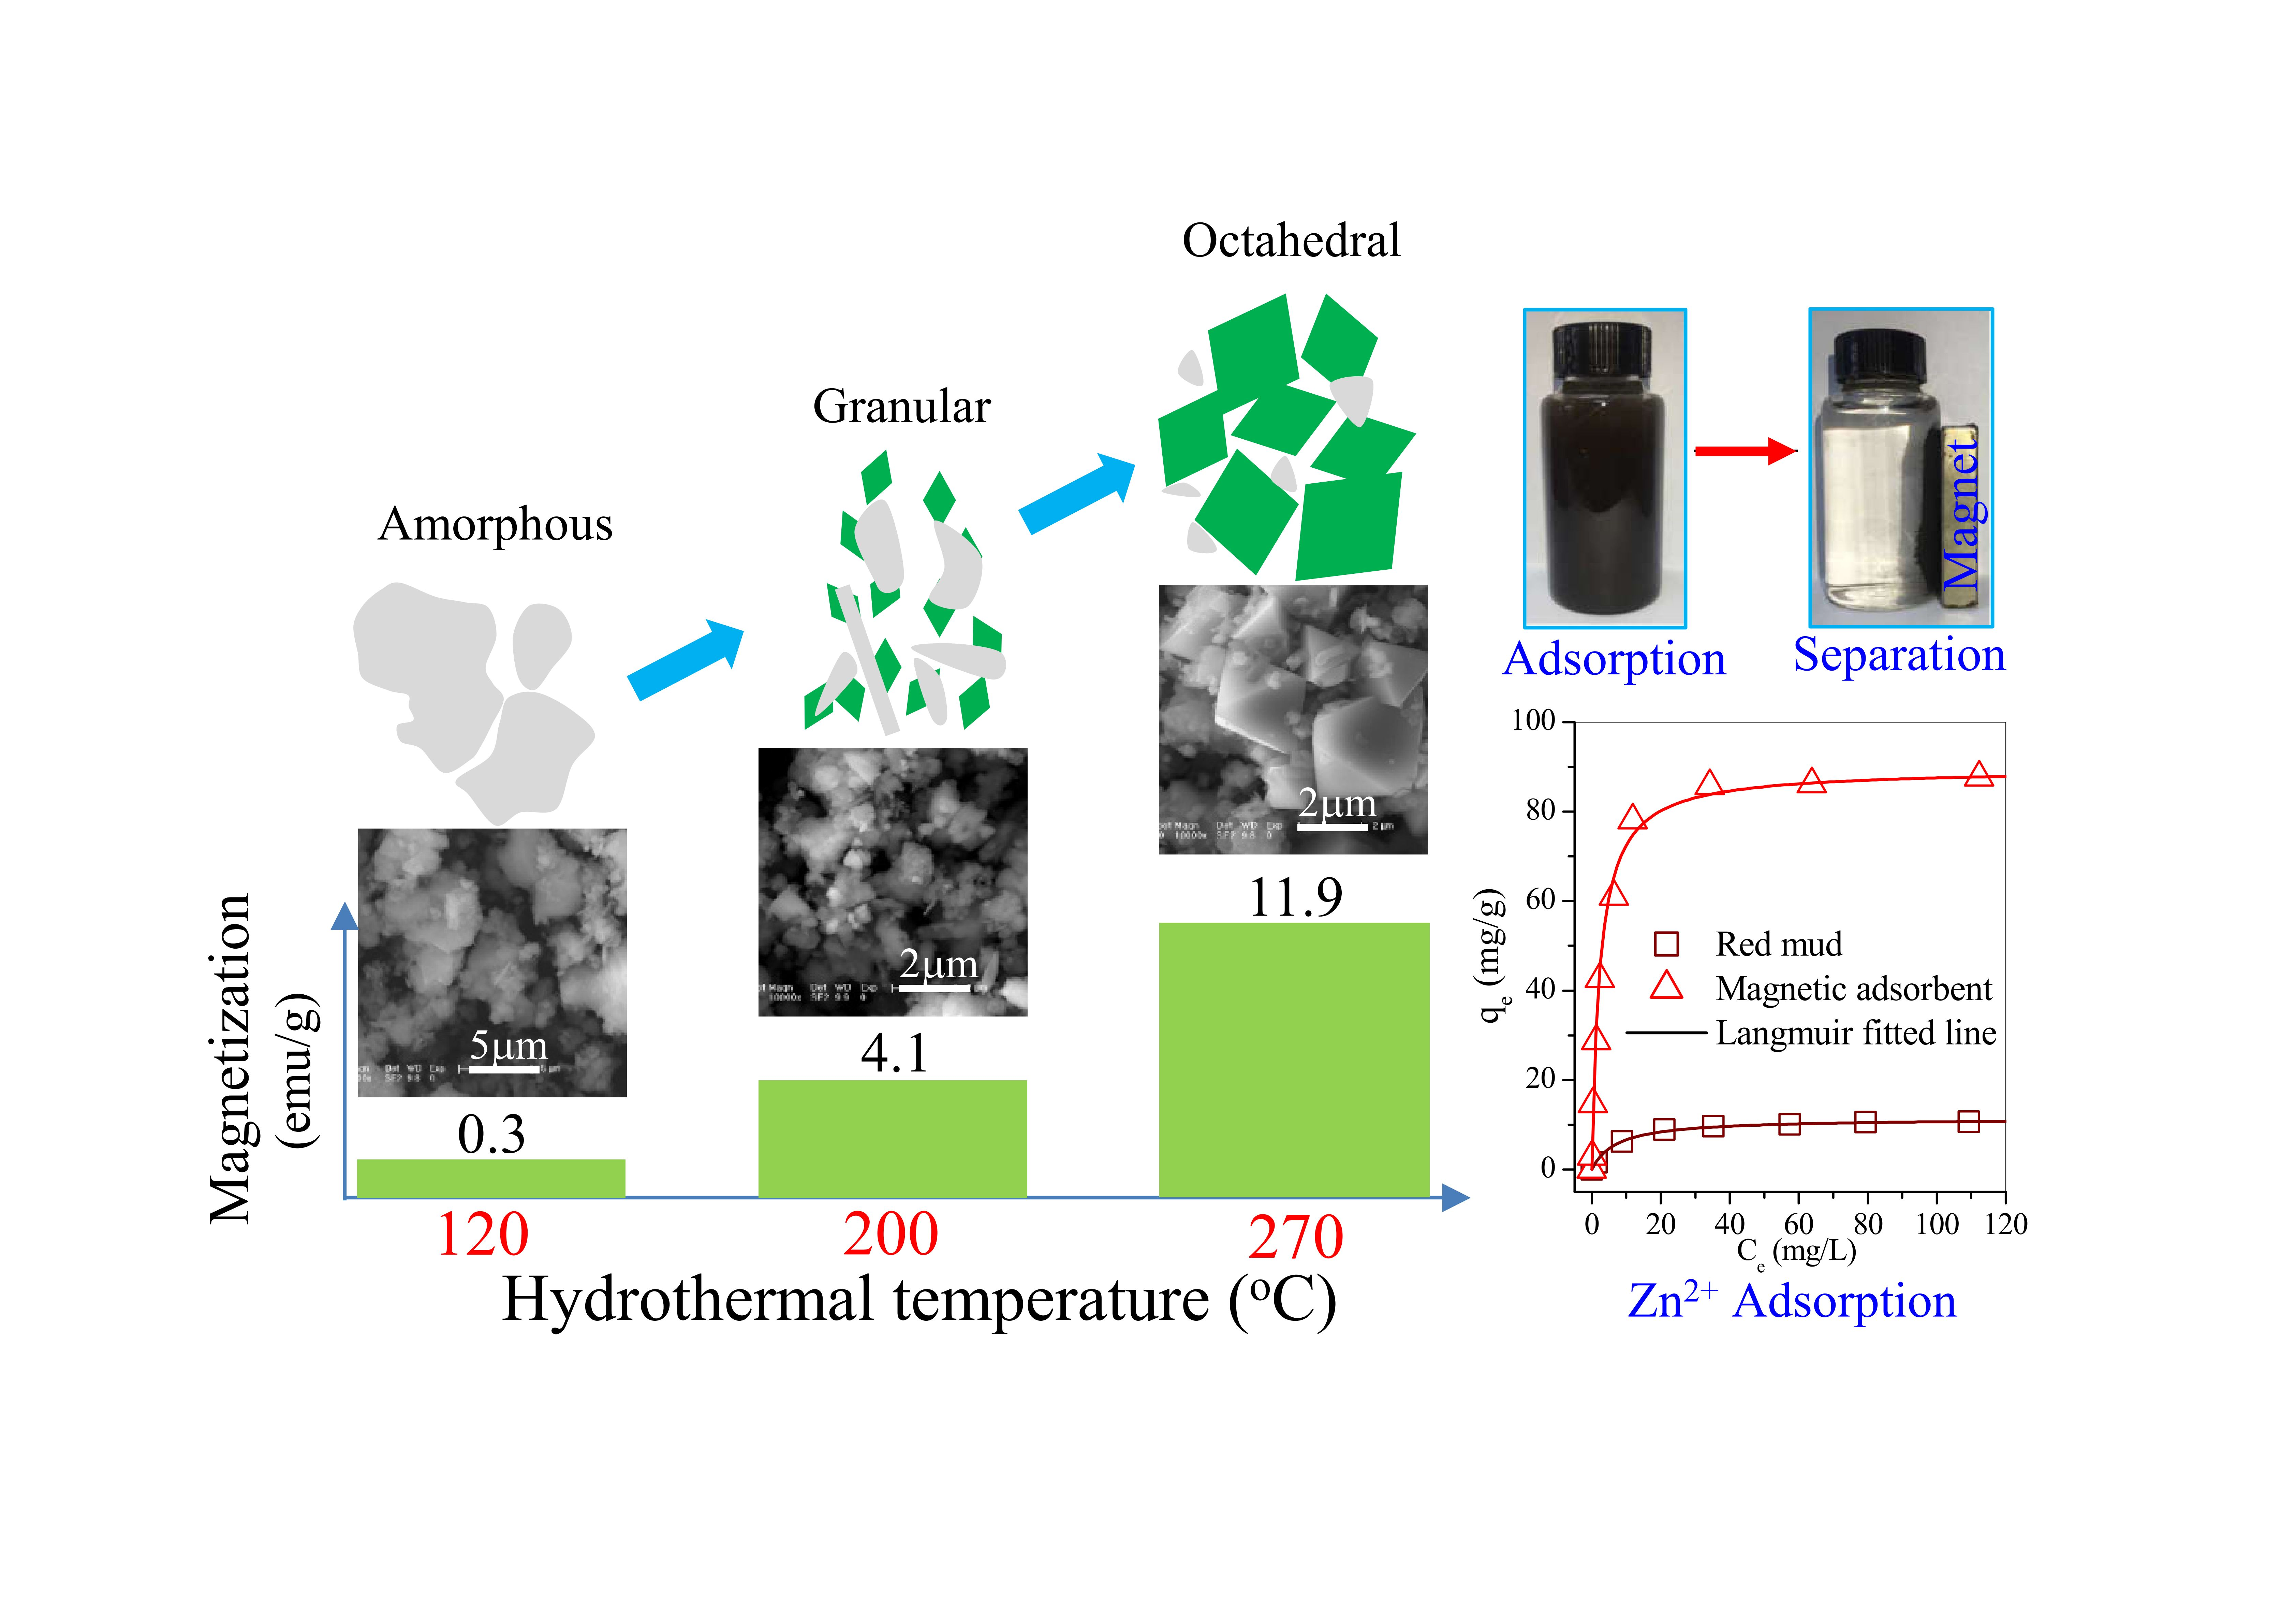
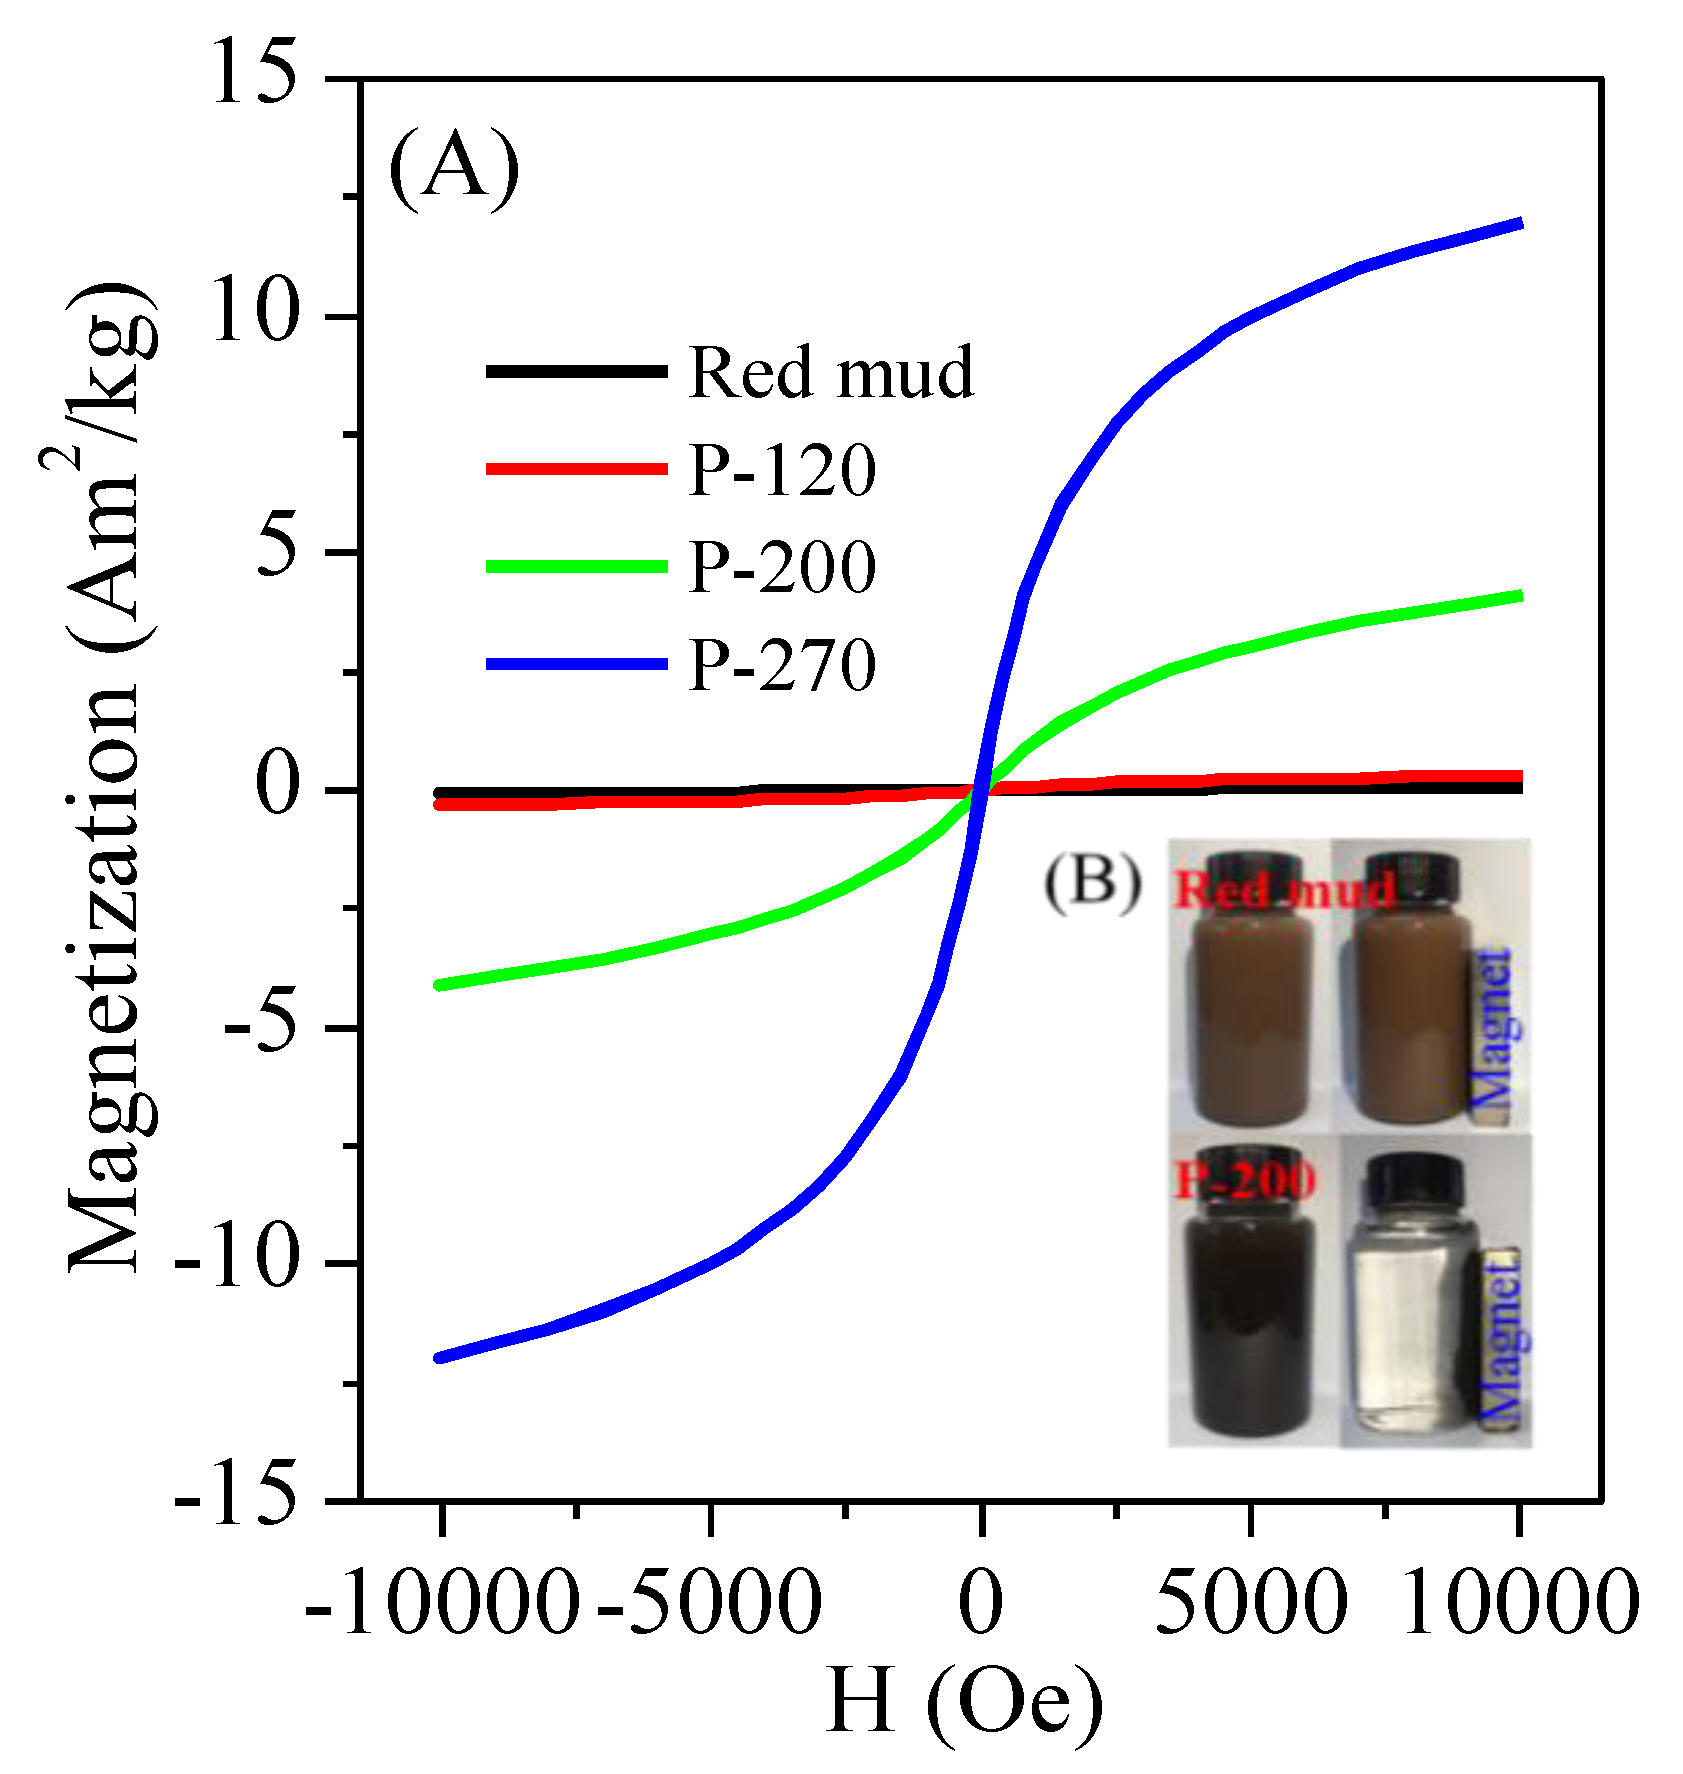
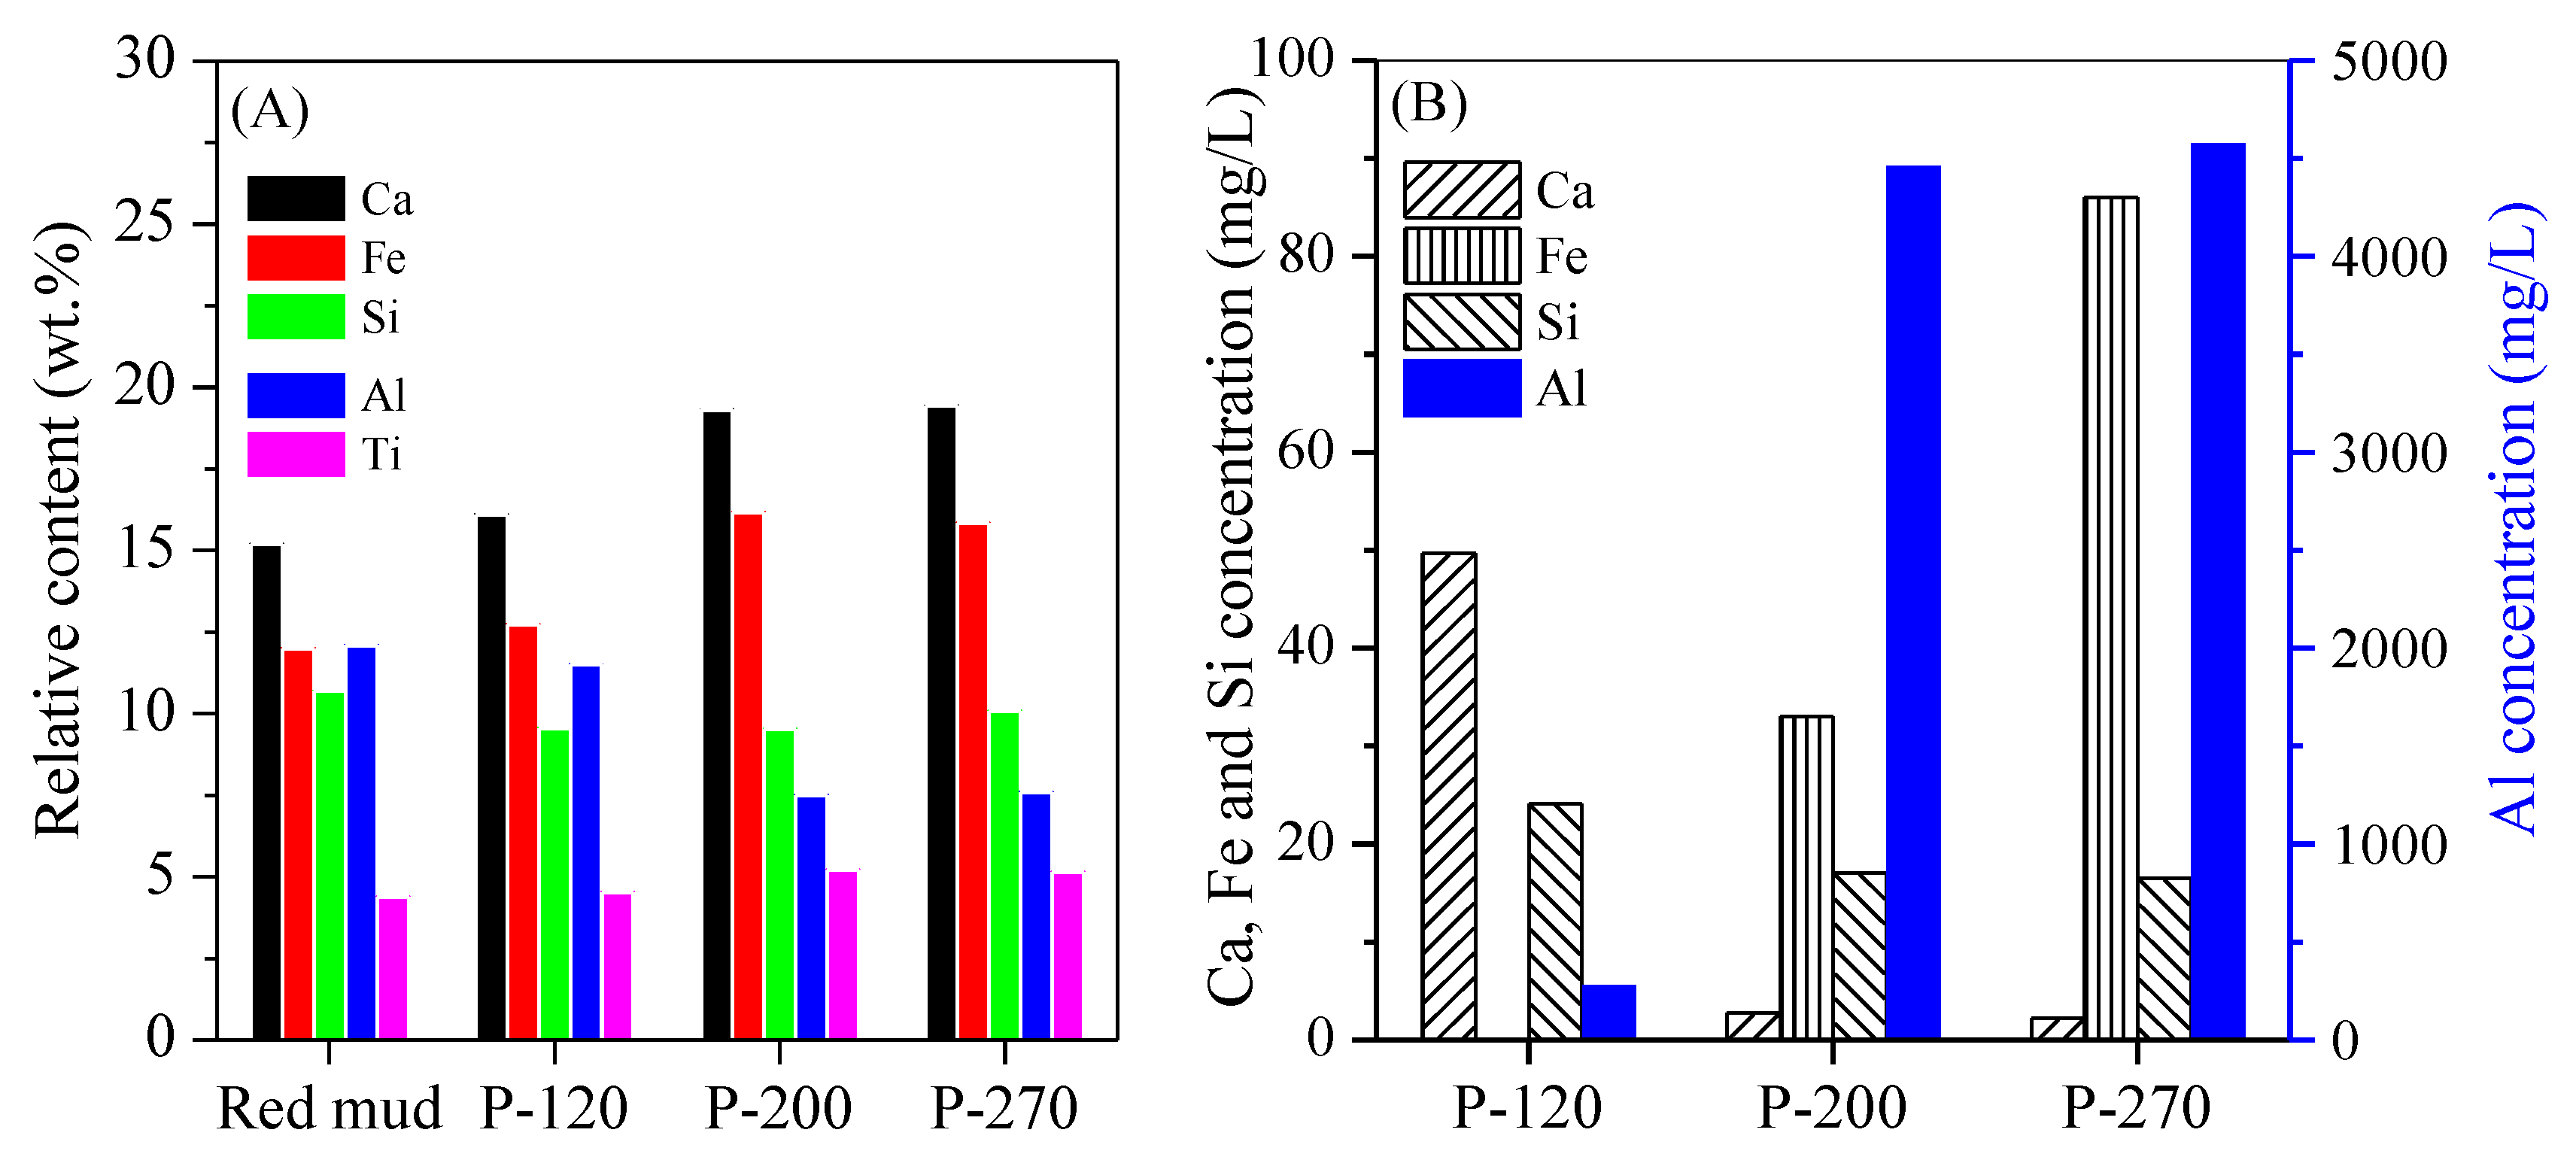
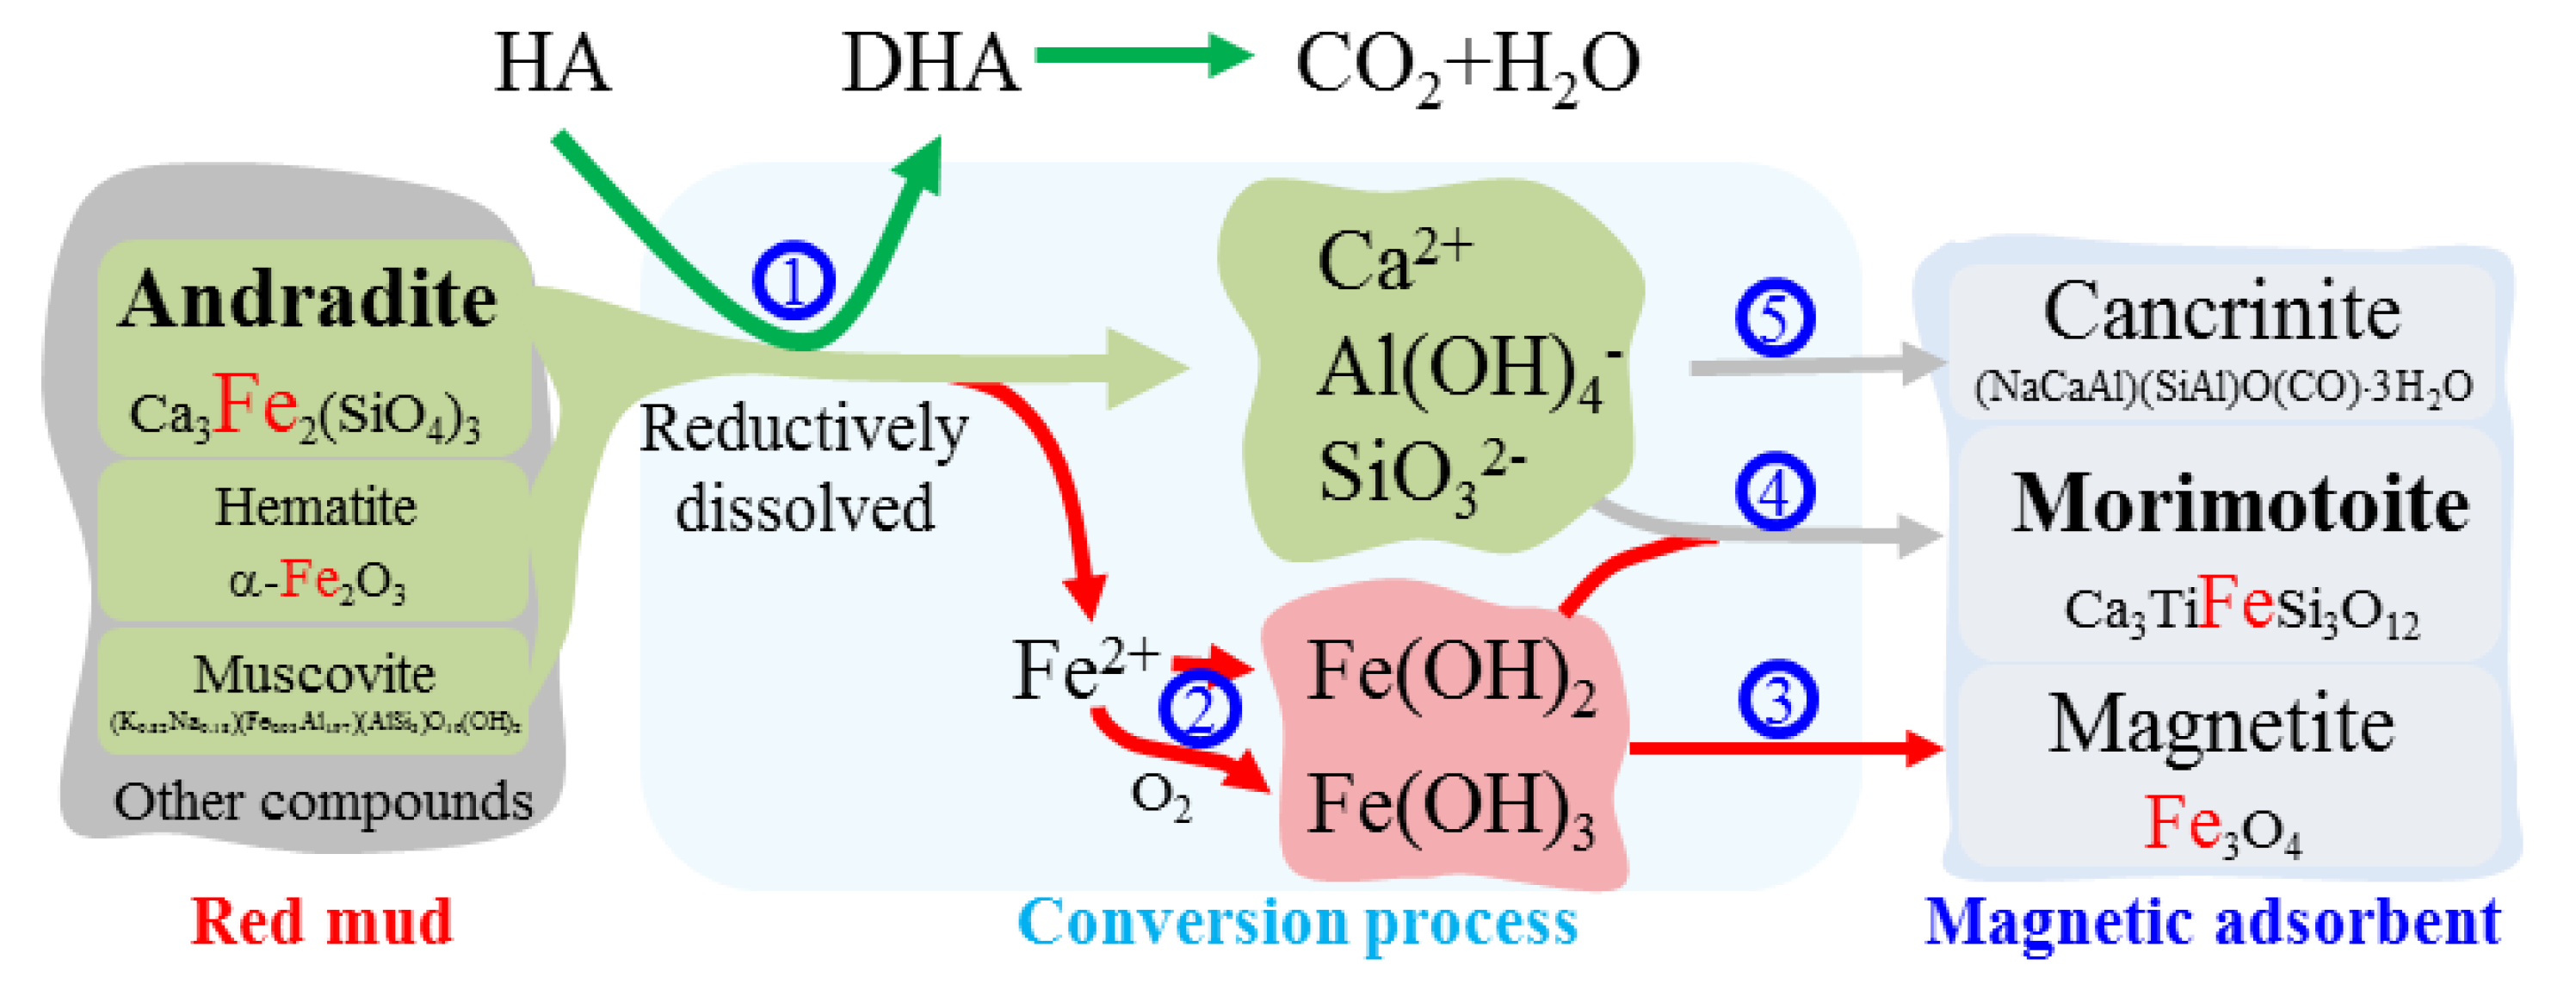
3.1. Conversion of Red Mud into Magnetic Adsorbent
3.2. Morphology
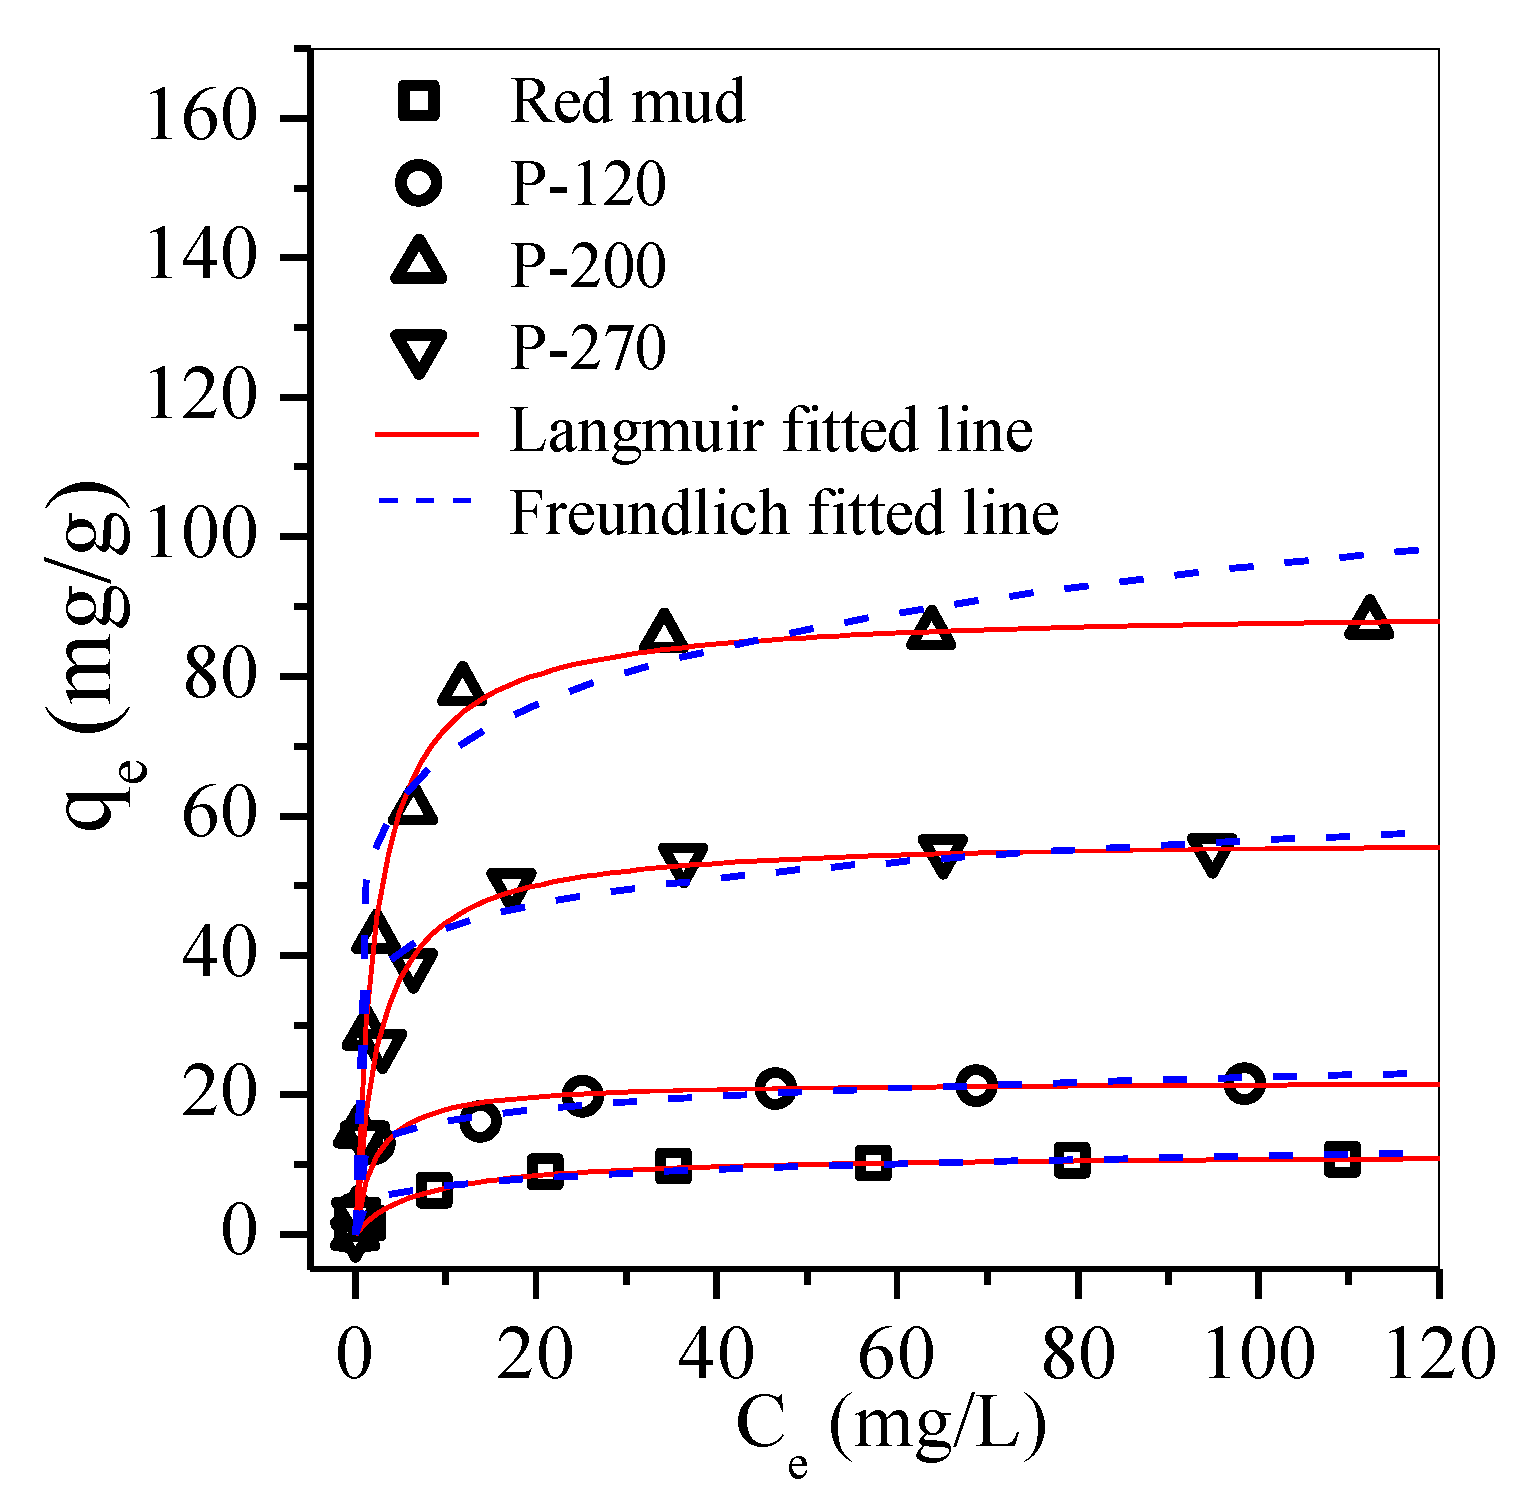
3.3. Adsorption
4. Conclusions
Author Contributions
Funding
Conflicts of Interest
References
- Klauber, C.; Gräfe, M.; Power, G. Bauxite residue issues: II. options for residue utilization. Hydrometallurgy 2011, 108, 11–32. [Google Scholar] [CrossRef]
- Ye, N.; Yang, J.; Liang, S.; Hu, Y.; Hu, J.; Xiao, B.; Huang, Q. Synthesis and strength optimization of one-part geopolymer based on red mud. Constr. Build. Mater. 2016, 111, 317–325. [Google Scholar] [CrossRef]
- Jian, H.; Jie, Y.; Zhang, J.; Yu, Y.; Zhang, G. Synthesis and characterization of red mud and rice husk ash-based geopolymer composites. Cement Concr. Compos. 2013, 37, 108–118. [Google Scholar]
- Davris, P.; Balomenos, E.; Panias, D.; Paspaliaris, I. Selective leaching of rare earth elements from bauxite residue (red mud), using a functionalized hydrophobic ionic liquid. Hydrometallurgy 2016, 164, 125–135. [Google Scholar] [CrossRef]
- Sushil, S.; Batra, V.S. Catalytic applications of red mud, an aluminium industry waste: A review. Appl. Catal. B Environ. 2008, 81, 64–77. [Google Scholar] [CrossRef]
- Paramgura, R.K.; Rath, P.C.; Misra, V.N. Trends in red mud utilization—A review. Miner. Process. Extr. Metall. Rev. 2004, 26, 1–29. [Google Scholar] [CrossRef]
- Wang, S.; Ang, H.M.; Tadé, M.O. Novel applications of red mud as coagulant, adsorbent and catalyst for environmentally benign processes. Chemosphere 2008, 72, 1621–1635. [Google Scholar] [CrossRef] [PubMed]
- Zhang, Y.; Wang, Y.; Meng, X.; Zheng, L.; Gao, J. The Suppression Characteristics of NH4H2PO4/Red Mud Composite Powders on Methane Explosion. Appl. Sci. 2018, 8, 1433. [Google Scholar] [CrossRef]
- Sahu, R.C.; Patel, R.; Ray, B.C. Adsorption of Zn(II) on activated red mud: Neutralized by CO2. Desalination 2011, 266, 93–97. [Google Scholar] [CrossRef]
- Wang, Y.; Yu, Y.; Li, H.; Shen, C. Comparison study of phosphorus adsorption on different waste solids: Fly ash, red mud and ferric-alum water treatment residues. J. Environ. Sci. China 2016, 50, 79–86. [Google Scholar] [CrossRef] [PubMed]
- Busto, R.V.; Gonã§Alves, M.; Coelho, L.H. Assessment of the use of red mud as a catalyst for photodegradation of bisphenol A in wastewater treatment. Water Sci. Technol. 2016, 74, 1283–1295. [Google Scholar] [CrossRef] [PubMed][Green Version]
- Liu, Y.; Zhao, B.; Yang, T.; Wan, P.; Chen, Y.; Lv, Z. Recycling of iron from red mud by magnetic separation after co-roasting with pyrite. Thermochim. Acta 2014, 588, 11–15. [Google Scholar] [CrossRef]
- Yang, H.; Jing, L.; Zhang, B. Recovery of iron from vanadium tailings with coal-based direct reduction followed by magnetic separation. J. Hazard. Mater. 2011, 185, 1405–1411. [Google Scholar] [CrossRef]
- Samouhos, M.; Taxiarchou, M.; Pilatos, G.; Tsakiridis, P.; Devlin, E.; Pissas, M. Controlled reduction of red mud by H2 followed by magnetic separation. Miner. Eng. 2017, 105, 36–43. [Google Scholar] [CrossRef]
- Sushil, S.; Alabdulrahman, A.M.; Balakrishnan, M.; Batra, V.; Blackley, R.; Clapp, J.; Hargreaves, J.; Monaghan, A.; Pulford, I.; Rico, J.; et al. Carbon deposition and phase transformations in red mud on exposure to methane. J. Hazard. Mater. 2010, 180, 409–418. [Google Scholar] [CrossRef]
- Jianmin, Z. Ferrihydrite: Surface Structure and its Effects on Phase Transformation. Clays Clay Miner. 1994, 42, 737–746. [Google Scholar] [CrossRef]
- Zhu, S.; Fang, S.; Huo, M.; Yu, Y.; Chen, Y.; Yang, X.; Geng, Z.; Wang, Y.; Bian, D.; Huo, H. A novel conversion of the groundwater treatment sludge to magnetic particles for the adsorption of methylene blue. J. Hazard. Mater. 2015, 292, 173–179. [Google Scholar] [CrossRef]
- Li, X.; Liu, N.; Qi, T.; Wang, Y.; Zhou, Q.; Peng, Z.; Liu, G. Conversion of ferric oxide to magnetite by hydrothermal reduction in Bayer digestion process. Trans. Nonferr. Metals Soc. China 2015, 25, 3467–3474. [Google Scholar] [CrossRef]
- Liu, J.; Yu, Y.; Zhu, S.; Yang, J.; Song, J.; Fan, W.; Yu, H.; Bian, D.; Huo, M. Synthesis and characterization of a magnetic adsorbent from negatively-valued iron mud for methylene blue adsorption. PLoS ONE 2018, 13, e0191229. [Google Scholar] [CrossRef]
- Echigo, T.; Aruguete, D.M.; Murayama, M.; Hochella, M. Influence of size, morphology, surface structure, and aggregation state on reductive dissolution of hematite nanoparticles with ascorbic acid. Geochim. Cosmochim. Acta 2012, 90, 149–162. [Google Scholar] [CrossRef]
- Hou, X.; Huang, X.; Ai, Z.; Zhao, J.; Zhang, L. Ascorbic acid/Fe@Fe2O3: A highly efficient combined Fenton reagent to remove organic contaminants. J. Hazard. Mater. 2016, 310, 170–178. [Google Scholar] [CrossRef] [PubMed]
- Xin, N.; Shen, L.; Gu, H.; Jiang, S.; Xiao, J. Characteristics of hematite and fly ash during chemical looping combustion of sewage sludge. Chem. Eng. J. 2015, 268, 236–244. [Google Scholar]
- Zhu, S.; Lin, X.; Dong, G.; Yu, Y.; Yu, H.; Bian, D.; Zhang, L.; Yang, J.; Wang, X.; Huo, M. Valorization of manganese-containing groundwater treatment sludge by preparing magnetic adsorbent for Cu(II) adsorption. J. Environ. Manag. 2019, 236, 446–454. [Google Scholar] [CrossRef] [PubMed]
- Lammers, K.; Smith, M.M.; Carroll, S.A. Muscovite dissolution kinetics as a function of pH at elevated temperature. Chem. Geol. 2017, 466, 149–158. [Google Scholar] [CrossRef]
- Cao, S.; Ma, H.; Zhang, Y.; Chen, X.; Zhang, Y.; Zhang, Y. The phase transition in Bayer red mud from China in high caustic sodium aluminate solutions. Hydrometallurgy 2013, 140, 111–119. [Google Scholar] [CrossRef]
- Zhang, R.; Zheng, S.; Ma, S.; Zhang, Y. Recovery of alumina and alkali in Bayer red mud by the formation of andradite-grossular hydrogarnet in hydrothermal process. J. Hazard. Mater. 2011, 189, 827–835. [Google Scholar] [CrossRef] [PubMed]
- Edgar, J.; Bell, R.G.; Dirk, W.; Hubert, K. Anion-promoted cation motion and conduction in zeolites. J. Am. Chem. Soc. 2006, 128, 558–567. [Google Scholar]
- Park, M.; Choi, C.L.; Lim, W.T.; Kim, M.C.; Choi, J.; Heo, N.H. Molten-salt method for the synthesis of zeolitic materials: I. Zeolite formation in alkaline molten-salt system. Microporous Mesoporous Mater. 2000, 37, 81–89. [Google Scholar] [CrossRef]
- Zeng, L.; Li, Z. Dissolution Behavior of Aluminum, Silicon, and Iron of Diaspore Concentrate in NaOH–NaAl(OH)4 Solutions at Elevated Temperature. Ind. Eng. Chem. Res. 2013, 52, 18429–18439. [Google Scholar] [CrossRef]
- Zong, Y.; Xin, H.; Zhang, J.; Li, X.; Feng, J.; Deng, X.; Sun, Y.; Zheng, X. One-pot, template- and surfactant-free solvothermal synthesis of high-crystalline Fe3O4 nanostructures with adjustable morphologies and high magnetization. J. Magn Magn. Mater. 2016, 423, 321–326. [Google Scholar] [CrossRef]
- Wang, W.; Howe, J.Y.; Gu, B. Structure and Morphology Evolution of Hematite (α-Fe2O3) Nanoparticles in Forced Hydrolysis of Ferric Chloride. J. Phys. Chem. C 2008, 112, 9203–9208. [Google Scholar] [CrossRef]
- Belviso, C.; Agostinelli, E.; Belviso, S.; Cavalcante, F.; Pascucci, S.; Peddis, D.; Varvaro, G.; Fiore, S. Synthesis of magnetic zeolite at low temperature using a waste material mixture: Fly ash and red mud. Microporous Mesoporous Mater. 2015, 202, 208–216. [Google Scholar] [CrossRef]
- Peng, D.; Beysen, S.; Li, Q.; Jian, J.; Sun, Y.; Jiwuer, J. Hydrothermal growth of octahedral Fe3O4 crystals. Particuology 2009, 7, 35–38. [Google Scholar] [CrossRef]
- Rouquerol, J.; Llewellyn, P.; Rouquerol, F. Is the BET equation applicable to microporous adsorbents. Stud. Surf. Sci. Catal. 2007, 160, 49–56. [Google Scholar]
- Yang, Q.; Yang, G.; Peng, W.; Song, S. Adsorption of Zn(II) on graphene oxide prepared from low-purity of amorphous graphite. Surf. Interface Anal. 2017, 49, 398–404. [Google Scholar] [CrossRef]
- Mokadem, Z.; Mekki, S.; Saïdi-Besbes, S.; Agusti, G.; Elaissari, A.; Derdour, A. Triazole containing magnetic core-silica shell nanoparticles for Pb2+, Cu2+ and Zn2+ removal. Arab. J. Chem. 2017, 10, 1039–1051. [Google Scholar] [CrossRef]
- Ferreira, L.S.; Rodrigues, M.S.; de Carvalho, J.C.M.; Finocchio, E.; Lodi, A.; Perego, P.; Converti, A. Adsorption of Ni2+, Zn2+ and Pb2+ onto dry biomass of Arthrospira (Spirulina) platensis and Chlorella vulgaris. I. Single metal systems. Chem. Eng. J. 2011, 173, 326–333. [Google Scholar] [CrossRef]
- Vikrant, K.; Kim, K.-H. Nanomaterials for the adsorptive treatment of Hg(II) ions from water. Chem. Eng. J. 2019, 358, 264–282. [Google Scholar] [CrossRef]
- Na, C.-J.; Yoo, M.-J.; Tsang, D.C.W.; Kim, H.W.; Kim, K.H. High-performance materials for effective sorptive removal of formaldehyde in air. J. Hazard. Mater. 2019, 366, 452–465. [Google Scholar] [CrossRef]
- Deng, Y.; Vellingiri, K.; Kim, K.-H.; Boukhvalov, D.W.; Philip, L. Activation strategies of metal-organic frameworks for the sorption of reduced sulfur compounds. Chem. Eng. J. 2018, 350, 747–756. [Google Scholar] [CrossRef]
- Eloussaief, M.; Hamza, W.; Kallel, N.; Benzina, M. Wastewaters decontamination: Mechanisms of Pb(II), Zn(II), and Cd(II) competitive adsorption on tunisian smectite in single and multi-solute systems. Environ. Prog. Sustain. 2013, 32, 229–238. [Google Scholar] [CrossRef]
- Fan, L.; Luo, C.; Lv, Z.; Lu, F.G.; Qiu, H.M. Preparation of magnetic modified chitosan and adsorption of Zn2+ from aqueous solutions. Colloids Surf. B Biointerf. 2011, 88, 574–581. [Google Scholar] [CrossRef]
- Lu, S.G.; Xu, Q.F. Competitive adsorption of Cd, Cu, Pb and Zn by different soils of Eastern China. Environ. Geol. 2009, 57, 685–693. [Google Scholar] [CrossRef]
- Vellingiri, K.; Kim, K.-H.; Kwon, E.E.; Deep, A.; Jo, S.H.; Szulejko, J.E. Insights into the adsorption capacity and breakthrough properties of a synthetic zeolite against a mixture of various sulfur species at low ppb levels. J. Environ. Manag. 2016, 166, 484–492. [Google Scholar] [CrossRef]
- Biesinger, M.C.; Lau, L.W.M.; Gerson, A.R.; Smart, R.S.C. Resolving surface chemical states in XPS analysis of first row transition metals, oxides and hydroxides: Sc, Ti, V, Cu and Zn. Appl. Surf. Sci. 2010, 257, 887–898. [Google Scholar] [CrossRef]
- Top, A.; Ülkü, S. Silver, zinc, and copper exchange in a Na-clinoptilolite and resulting effect on antibacterial activity. Appl. Clay Sci. 2004, 27, 13–19. [Google Scholar] [CrossRef]
- Phan, T.N.T.; Louvard, N.; Bachiri, S.A.; Persello, J.; Foissy, A. Adsorption of zinc on colloidal silica, triple layer modelization and aggregation data. Colloid Surf. A 2004, 244, 131–140. [Google Scholar] [CrossRef]
- Kumar, S.; Kumar, R.; Bandopadhyay, A. Innovative methodologies for the utilisation of wastes from metallurgical and allied industries. Resour. Conserv. Recycl. 2006, 48, 301–314. [Google Scholar] [CrossRef]
- Sutar, H.; Mishra, S.C.; Sahoo, S.K.; Chakraverty, A.P.; Maharana, H. Progress of red mud utilization: An overview. Am. Chem. Sci. J. 2014, 4, 255–279. [Google Scholar] [CrossRef]
- Lu, C.; Liu, C.; Rao, G.P. Comparisons of sorbent cost for the removal of Ni2+ from aqueous solution by carbon nanotubes and granular activated carbon. J. Hazard. Mater. 2008, 151, 239–246. [Google Scholar] [CrossRef]
- Li, S.; Wang, W.; Liu, Y.; Zhang, W. Zero-valent iron nanoparticles (nZVI) for the treatment of smelting wastewater: A pilot-scale demonstration. Chem. Eng. J. 2014, 254, 115–123. [Google Scholar] [CrossRef]


| Adsorbent | Langmuir | Freundlich | Hs | ||||
|---|---|---|---|---|---|---|---|
| qm/(mg/g) | KL/(L/mg) | R2 | KF/(mg/g) | 1/n | R2 | mmol/g | |
| Red mud | 11.43 | 0.14 | 0.998 | 4.36 | 0.2 | 0.846 | 0.51 |
| P-120 | 21.91 | 0.37 | 0.998 | 11.57 | 0.15 | 0.941 | 1.19 |
| P-200 | 89.61 | 0.44 | 0.998 | 49.26 | 0.11 | 0.715 | 4.35 |
| P-270 | 56.79 | 0.42 | 0.997 | 33.98 | 0.12 | 0.762 | 3.29 |
| Adsorbent | Initial pH | Dosage (g/L) | Initial Concentration (mg/L) | Equilibrium Adsorption Capacity (mg/g) | Distribution Coefficient (L/g) | Maximum Adsorption Capacity (mg/g) | Reference |
|---|---|---|---|---|---|---|---|
| Red mud | 4 | 1 | 15 | 6.22 | 0.71 | 11.43 | This study |
| 45 | 9.68 | 0.27 | |||||
| 120 | 10.64 | 0.1 | |||||
| P-120 | 4 | 1 | 15 | 12.85 | 5.98 | 21.91 | |
| 45 | 19.76 | 0.78 | |||||
| 120 | 21.52 | 0.22 | |||||
| P-200 | 4 | 1 | 15 | 14.65 | 42.3 | 89.61 | |
| 45 | 42.62 | 17.92 | |||||
| 120 | 85.78 | 2.51 | |||||
| P-270 | 4 | 1 | 15 | 13.9 | 12.64 | 56.79 | |
| 45 | 38.55 | 5.98 | |||||
| 120 | 54.95 | 0.84 | |||||
| Graphene oxide | 7 | 0.65 | 10 | 14.24 | 14.29 | 73 | [35] |
| 20 | 24.48 | 7.06 | |||||
| 50 | 53.86 | 3.3 | |||||
| Triazole containing magnetic core-silica shell nanoparticles | 5.5 | 1 | 60 | 32.09 | 1.24 | 51.2 | [36] |
| 90 | 39.11 | 0.74 | |||||
| 170 | 44.93 | 0.36 | |||||
| 300 | 49.34 | 0.18 | |||||
| Dry mass of A. platensis | 5.0–5.5 | 2 | 32.71 | 10.99 | 1.03 | 39.5 | [37] |
| 65.41 | 18.64 | 0.66 | |||||
| 130.82 | 25.12 | 0.31 | |||||
| Dry mass of C. vulgaris | 5.0–5.5 | 2 | 32.71 | 11.9 | 1.33 | 60 | |
| 65.41 | 21.19 | 0.92 | |||||
| 130.82 | 35.91 | 0.61 | |||||
| Magnetic modified chitosan | 5 | 0.3 | 150 | 17.02 | 0.11 | 32.16 | [42] |
| 300 | 22.44 | 0.07 | |||||
| 400 | 25.34 | 0.06 | |||||
| Tunisian smectite | 5.5 | 8 | 65 | 7 | 0.75 | 28 | [41] |
| 90 | 9.25 | 0.69 | |||||
| 120 | 12.12 | 0.63 | |||||
| 300 | 25.57 | 0.28 | |||||
| Red mud after CO2 neutralization | 6 | 2 | 12 | 4.34 | 1.43 | 14.9 | [9] |
| 20 | 6.83 | 1.23 | |||||
| 25 | 8.05 | 0.88 |
© 2019 by the authors. Licensee MDPI, Basel, Switzerland. This article is an open access article distributed under the terms and conditions of the Creative Commons Attribution (CC BY) license (http://creativecommons.org/licenses/by/4.0/).
Share and Cite
Dong, W.; Liang, K.; Qin, Y.; Ma, H.; Zhao, X.; Zhang, L.; Zhu, S.; Yu, Y.; Bian, D.; Yang, J. Hydrothermal Conversion of Red Mud into Magnetic Adsorbent for Effective Adsorption of Zn(II) in Water. Appl. Sci. 2019, 9, 1519. https://doi.org/10.3390/app9081519
Dong W, Liang K, Qin Y, Ma H, Zhao X, Zhang L, Zhu S, Yu Y, Bian D, Yang J. Hydrothermal Conversion of Red Mud into Magnetic Adsorbent for Effective Adsorption of Zn(II) in Water. Applied Sciences. 2019; 9(8):1519. https://doi.org/10.3390/app9081519
Chicago/Turabian StyleDong, Wenqing, Kun Liang, Yanyi Qin, Huijia Ma, Xuan Zhao, Leilei Zhang, Suiyi Zhu, Yang Yu, Dejun Bian, and Jiakuan Yang. 2019. "Hydrothermal Conversion of Red Mud into Magnetic Adsorbent for Effective Adsorption of Zn(II) in Water" Applied Sciences 9, no. 8: 1519. https://doi.org/10.3390/app9081519
APA StyleDong, W., Liang, K., Qin, Y., Ma, H., Zhao, X., Zhang, L., Zhu, S., Yu, Y., Bian, D., & Yang, J. (2019). Hydrothermal Conversion of Red Mud into Magnetic Adsorbent for Effective Adsorption of Zn(II) in Water. Applied Sciences, 9(8), 1519. https://doi.org/10.3390/app9081519