Simulation Research on the Time-Varying Meshing Stiffness and Vibration Response of Micro-Cracks in Gears under Variable Tooth Shape Parameters


Abstract
:1. Introduction
2. Meshing Stiffness and Vibration Response for Cracked Gears in Different Shape Parameters
2.1. Meshing Stiffness Calculation under a Universal Equation of Gear Profile
2.1.1. Shear Stiffness
2.1.2. Bending and Compressive Stiffness
2.1.3. Meshing Stiffness of a Gear Pair
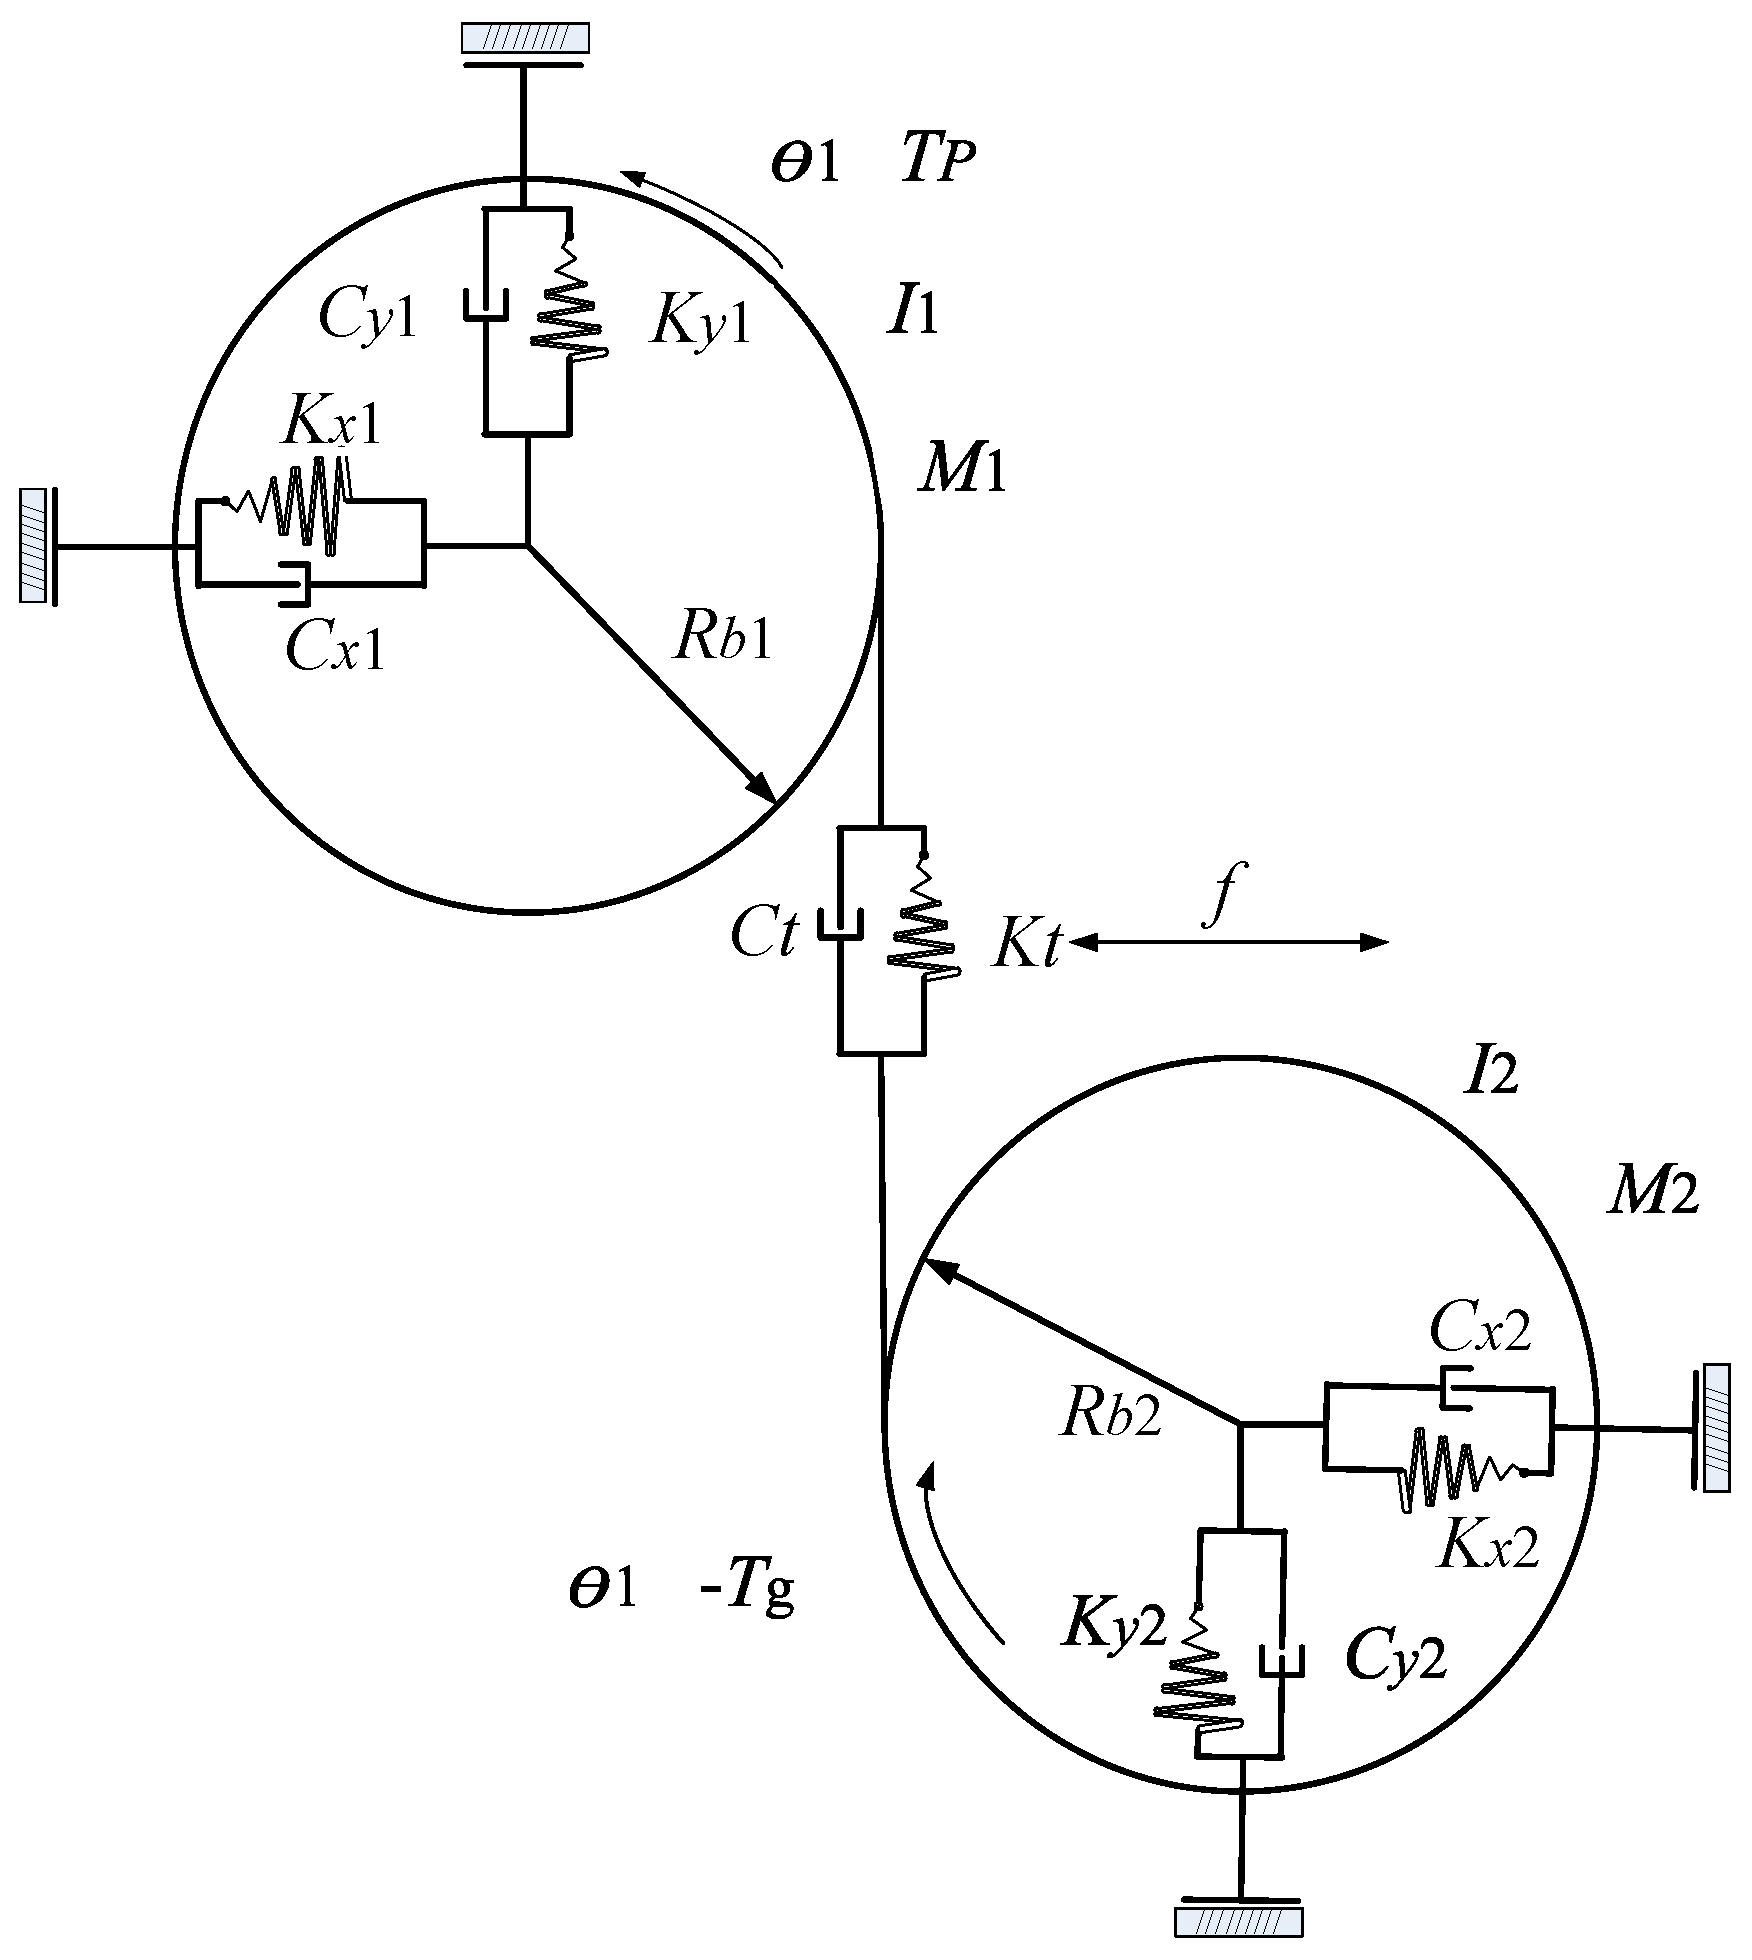
2.2. The Construction of the Dynamic Model
3. Meshing Stiffness and Vibration Response for Cracked Gears in Different Gear Shape Parameters
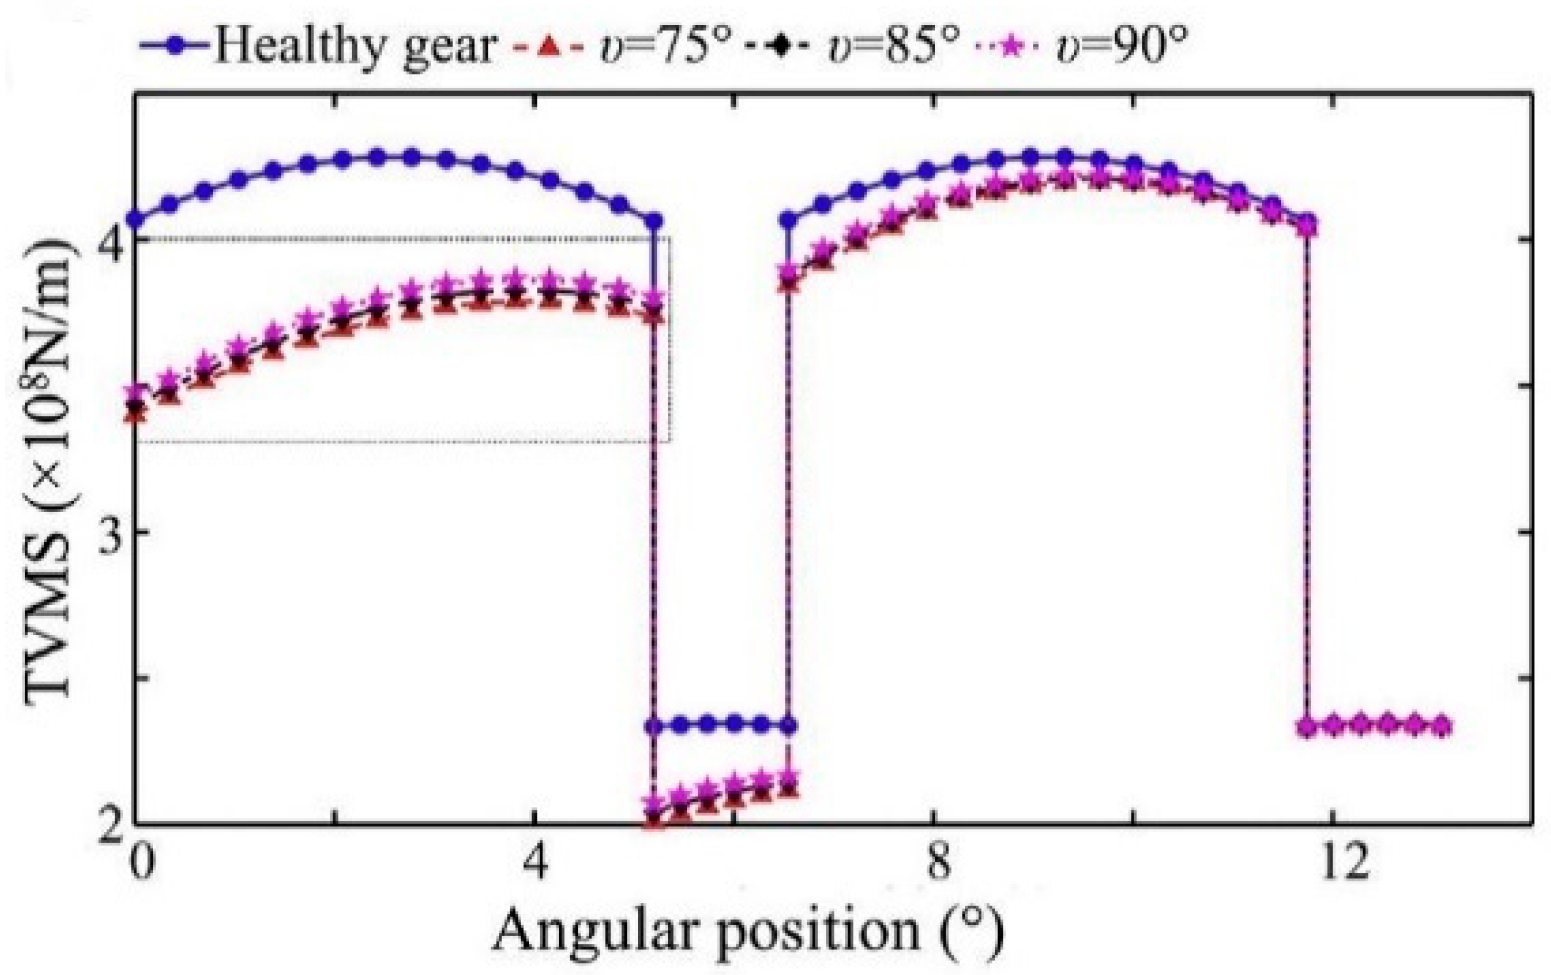
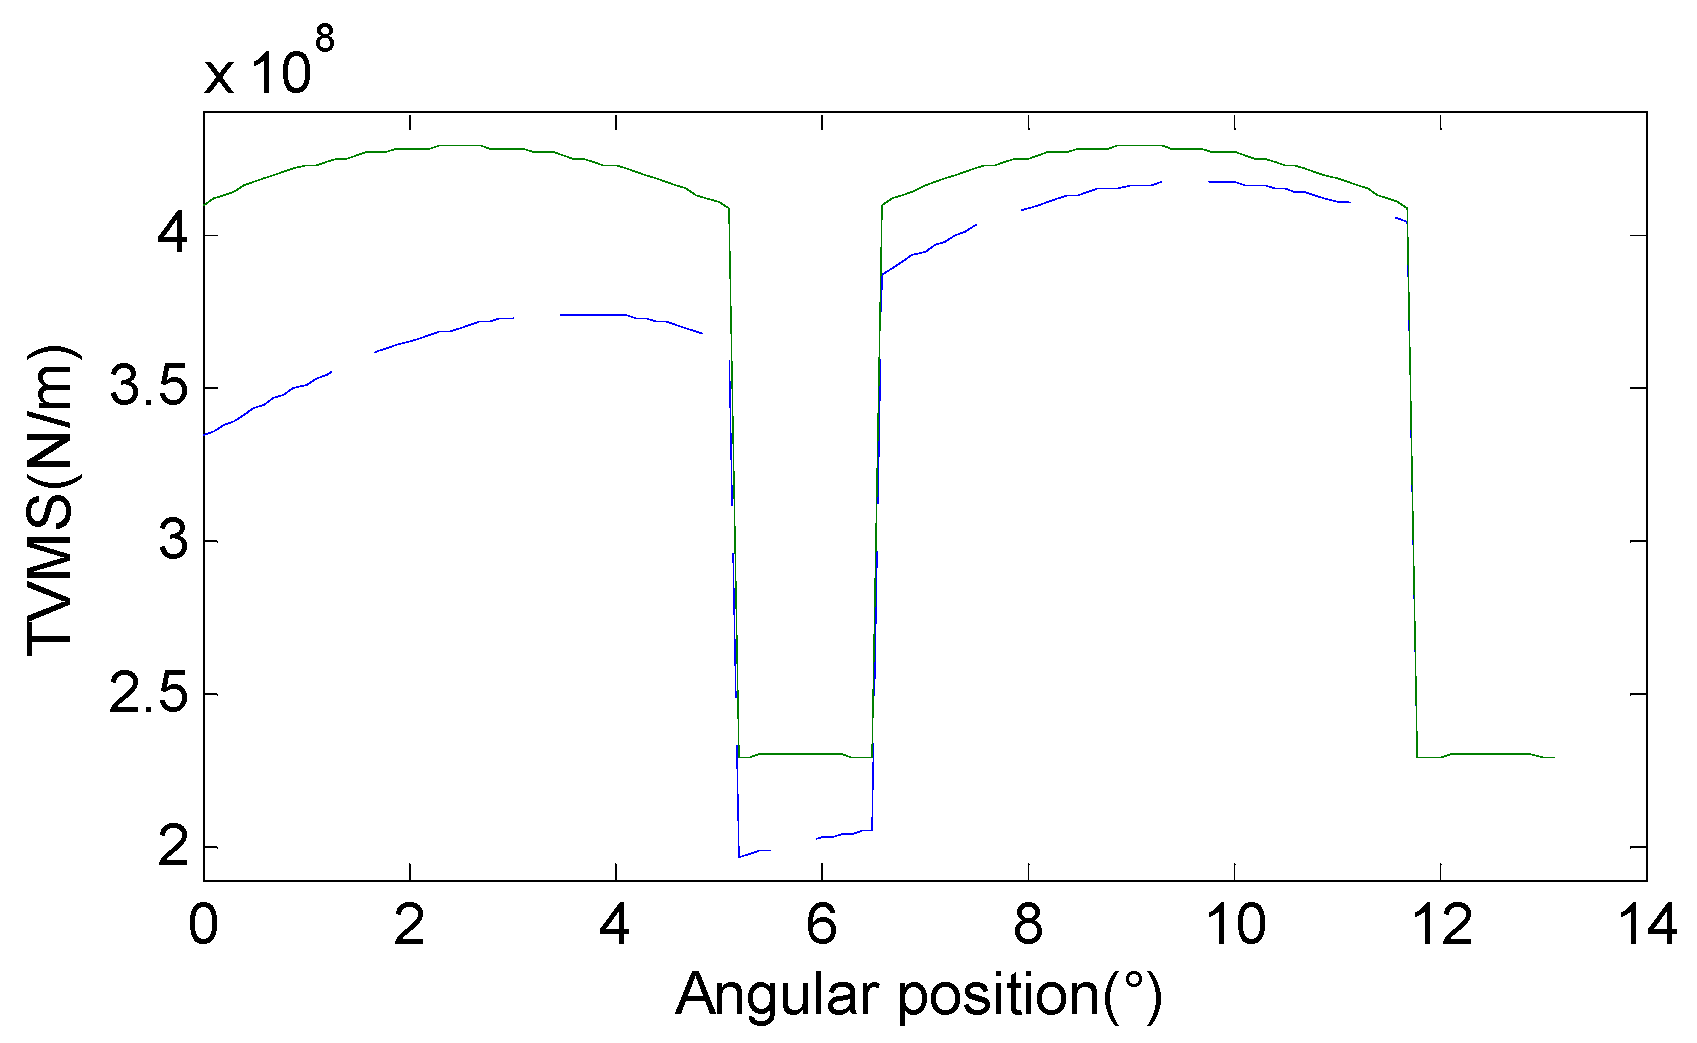
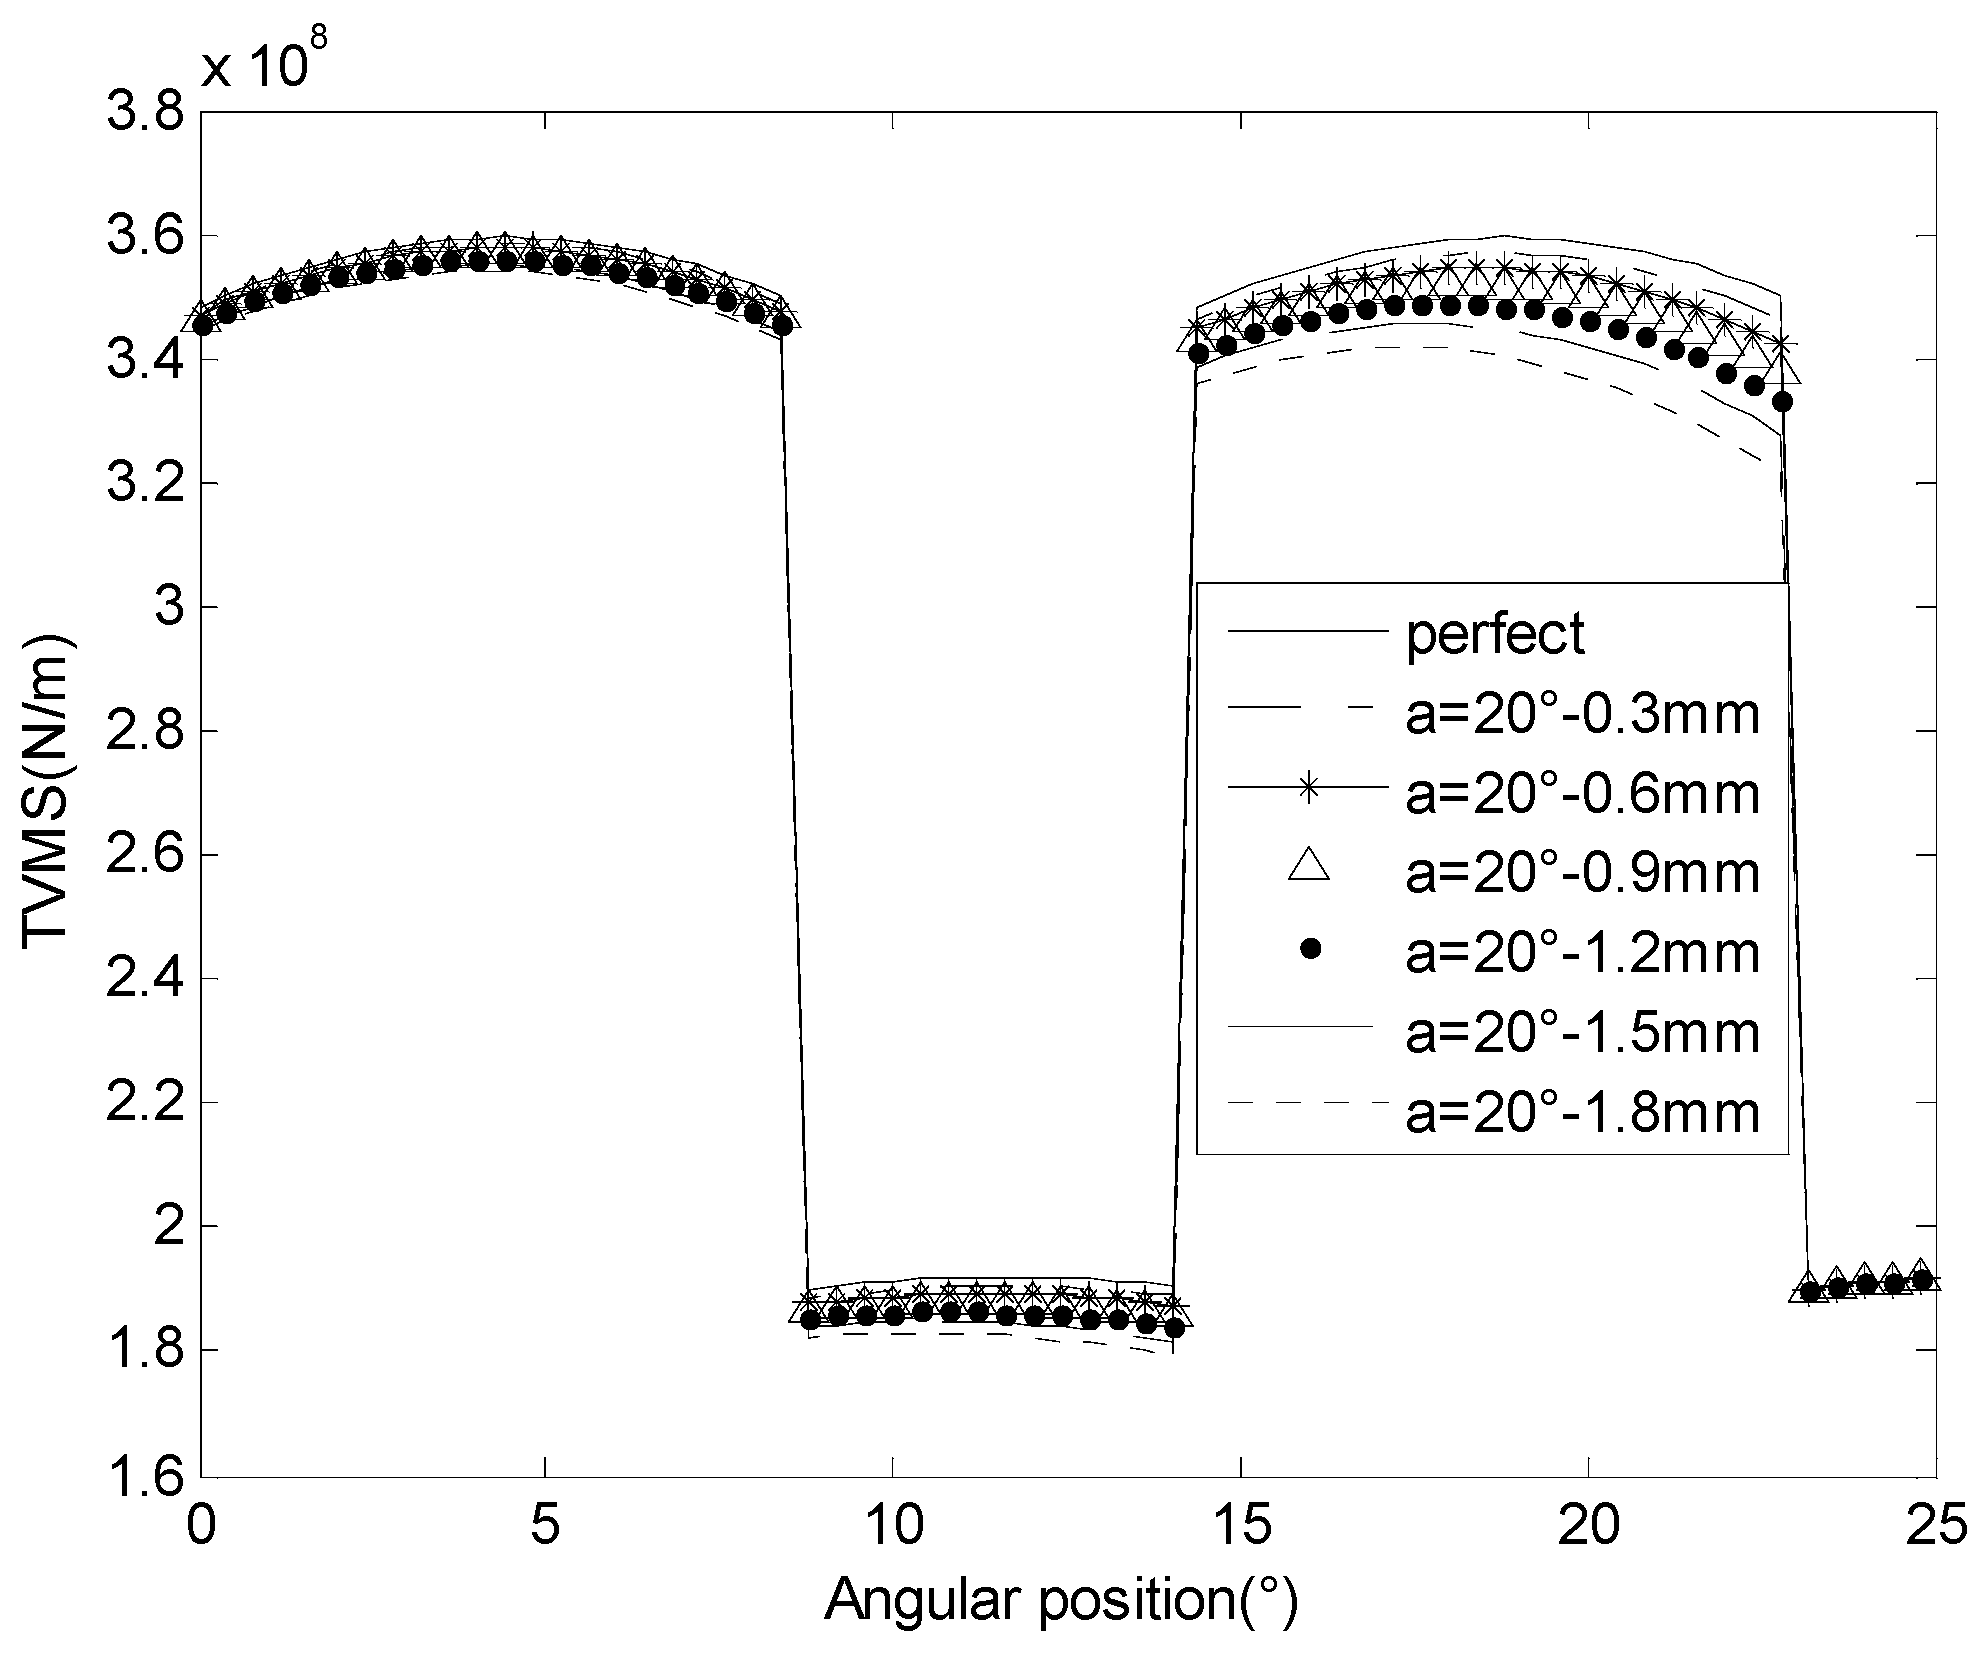
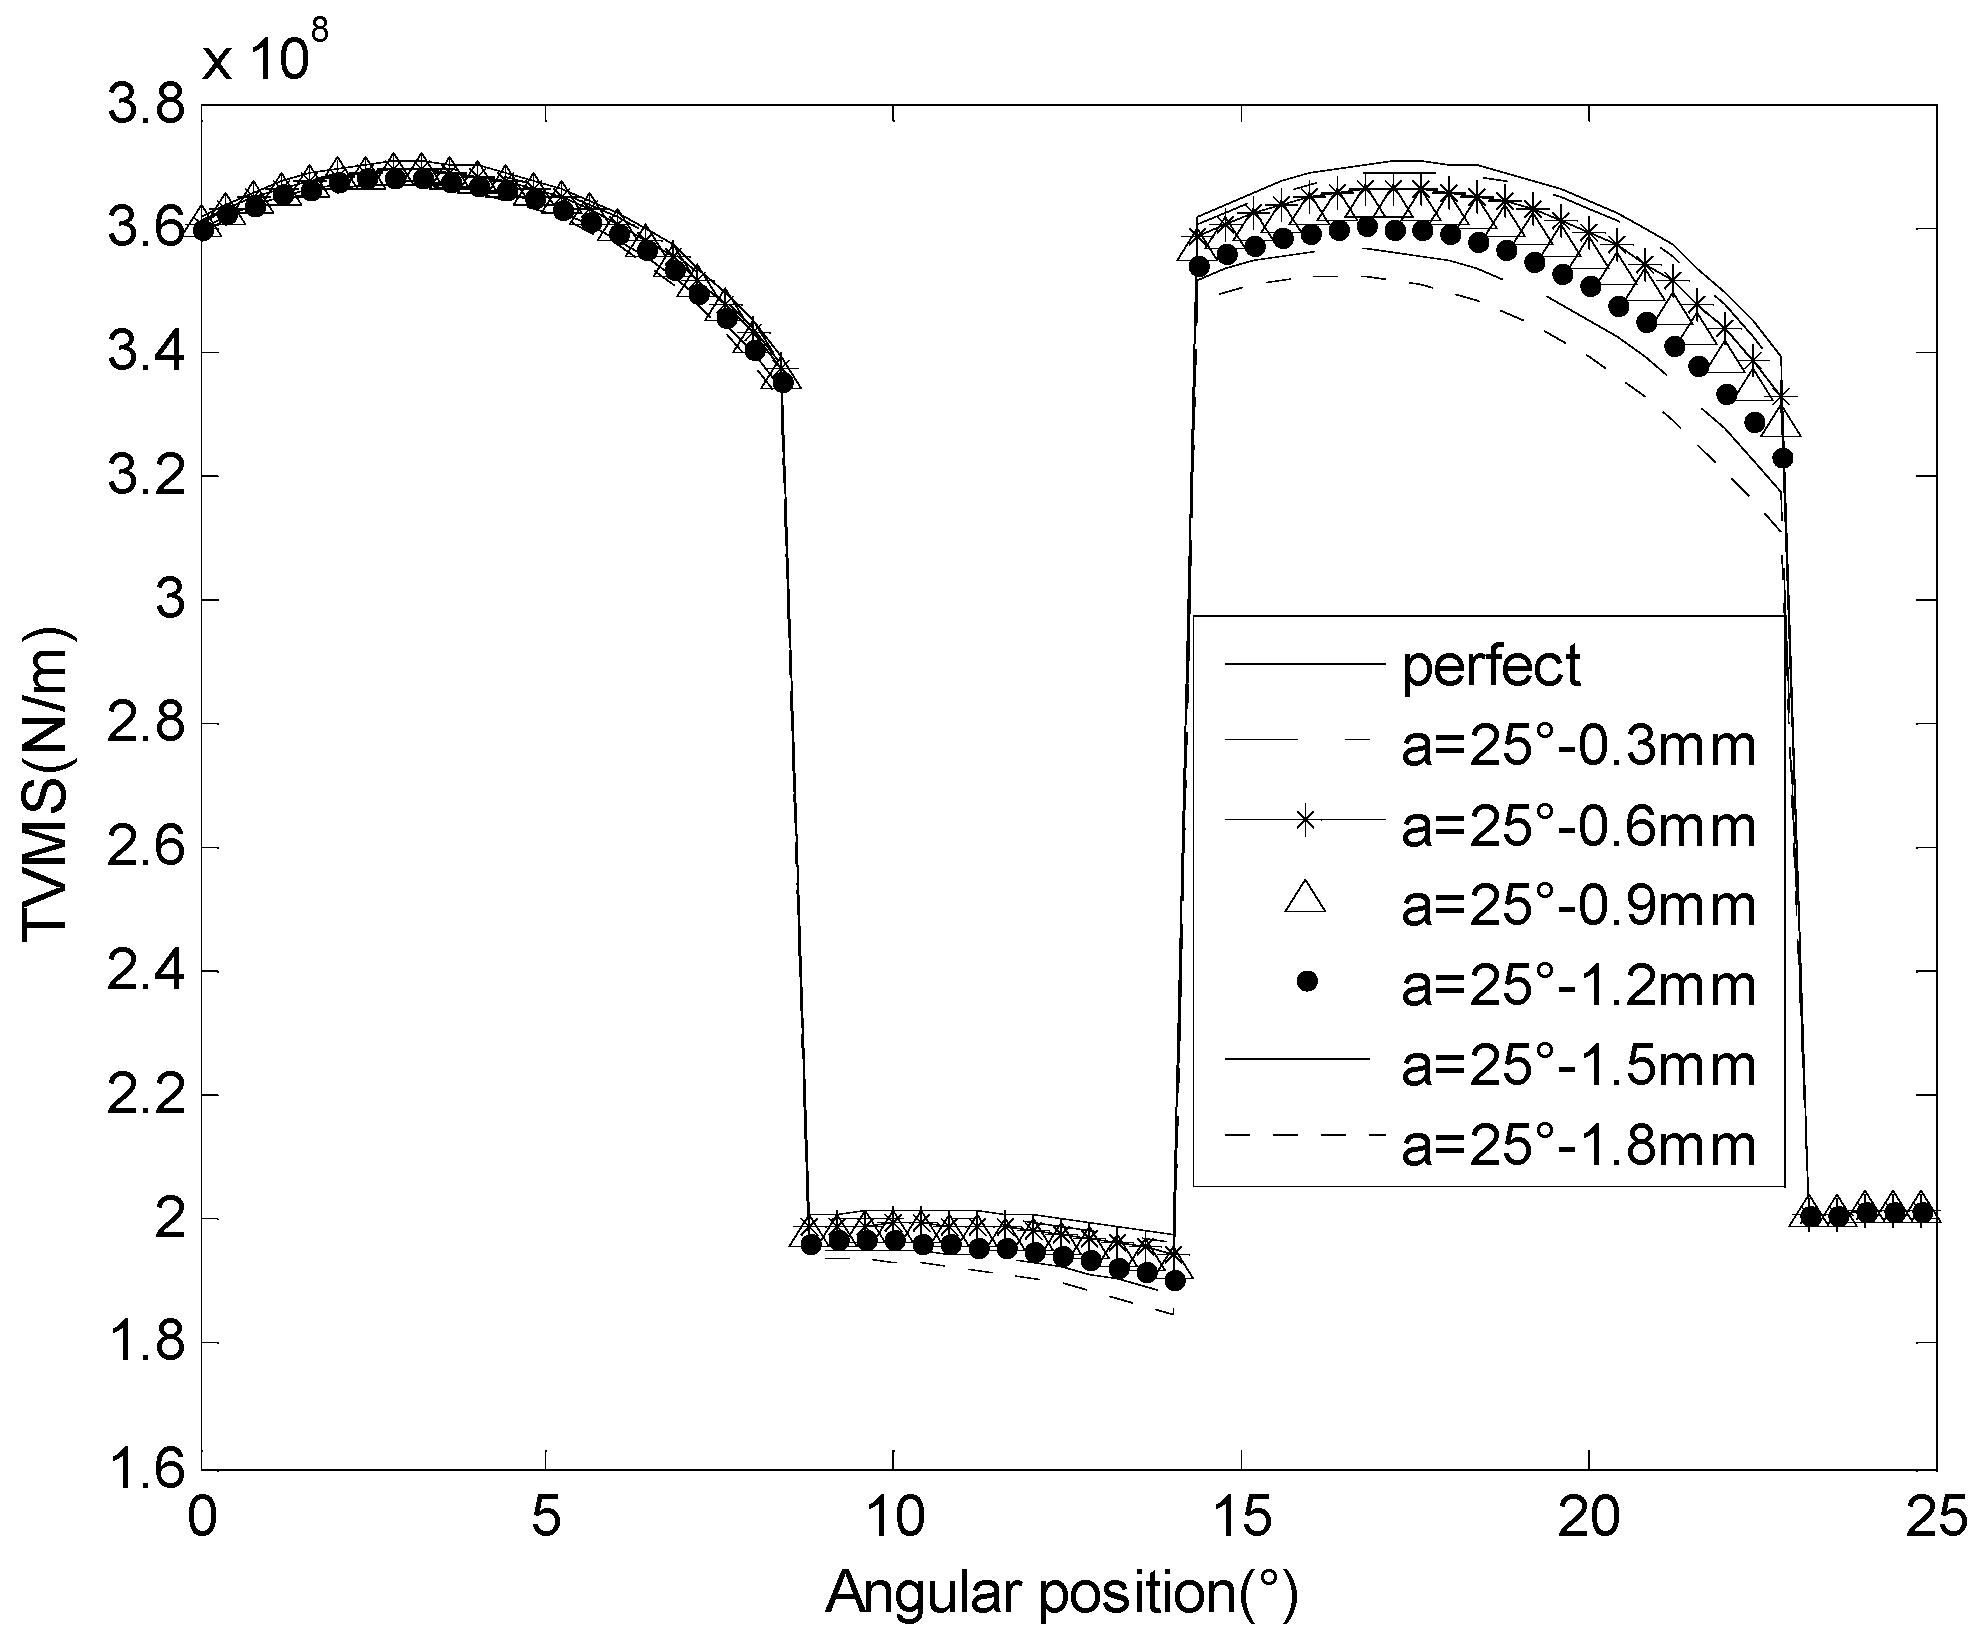
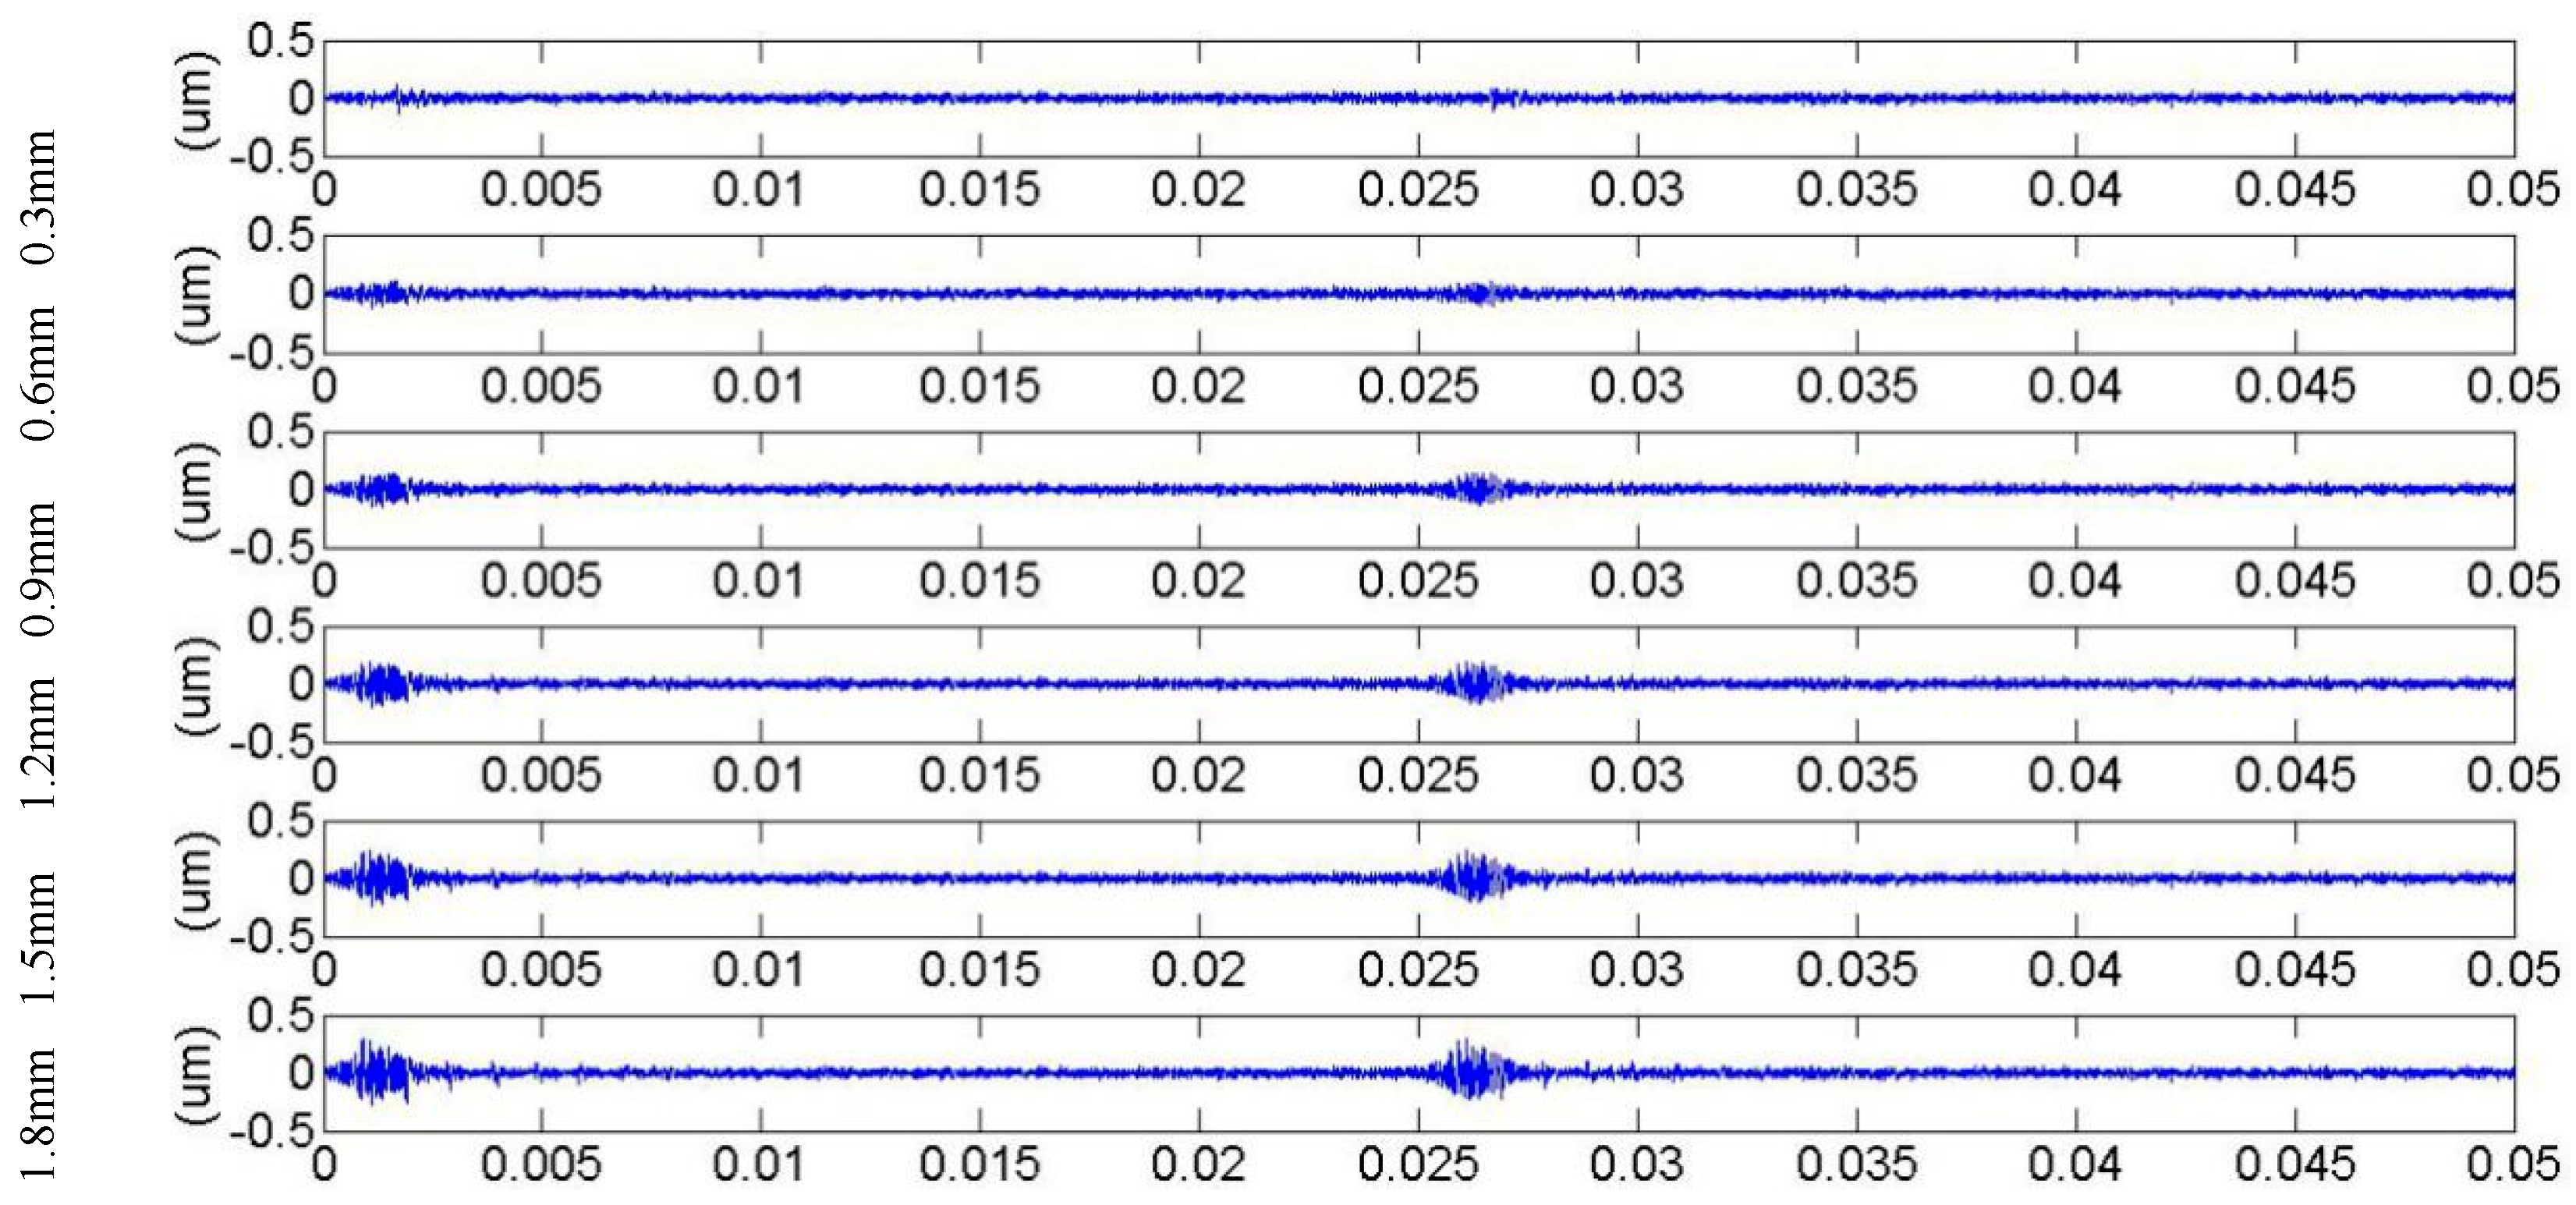
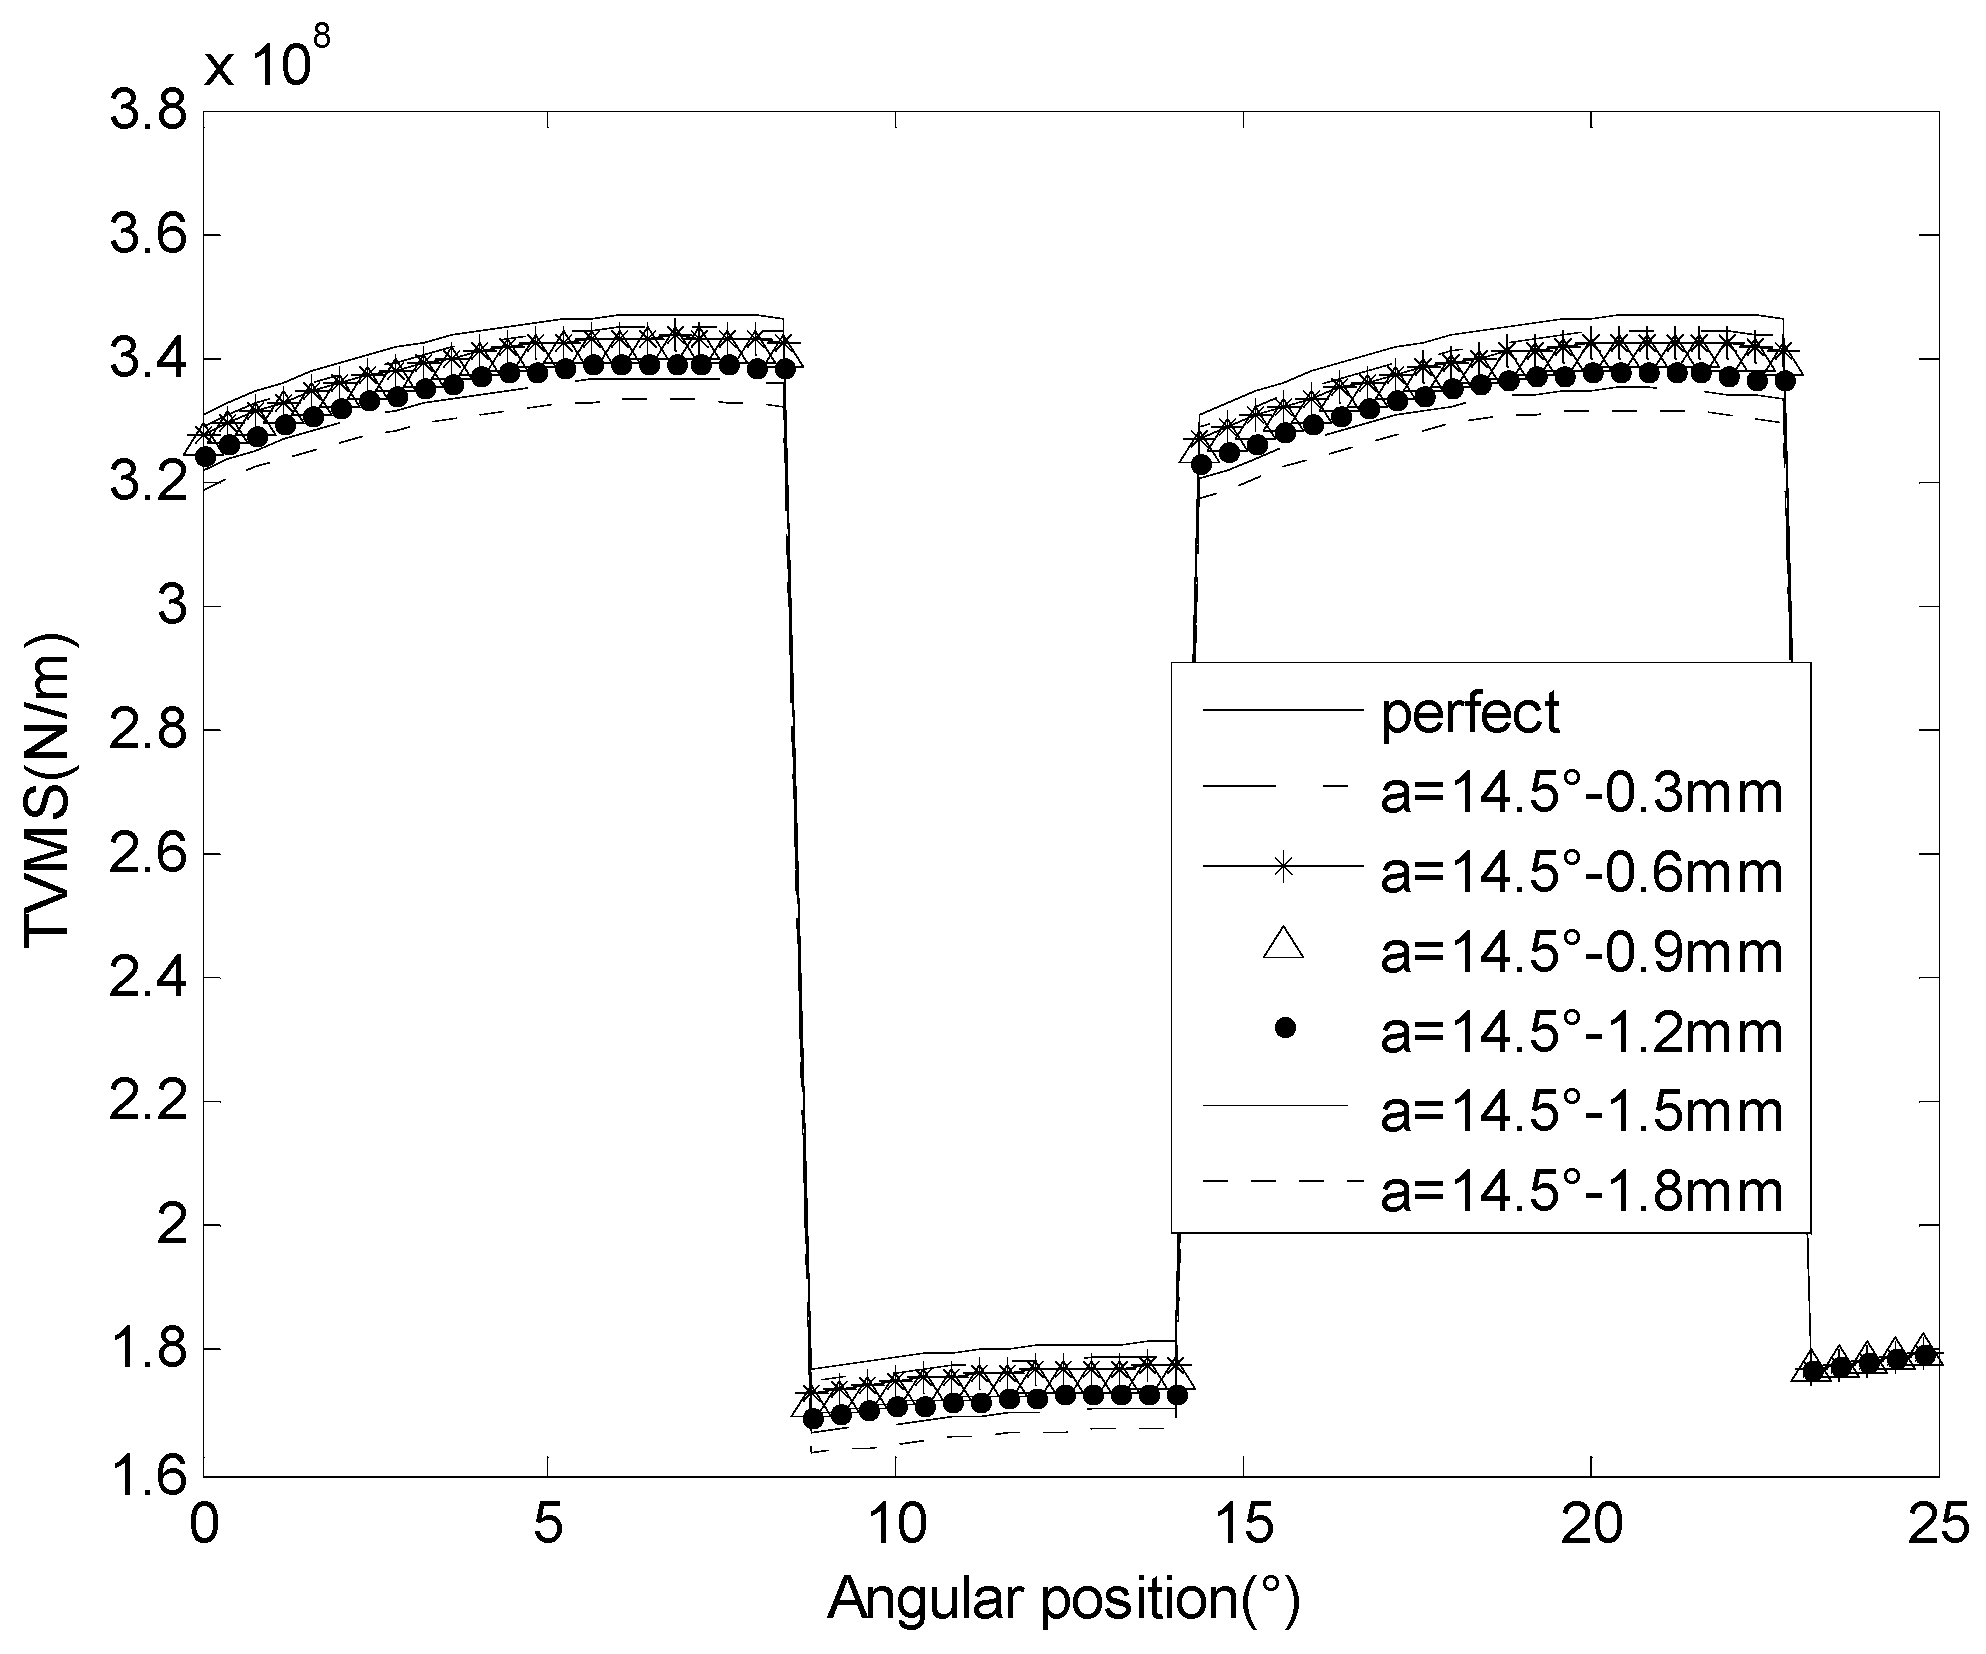
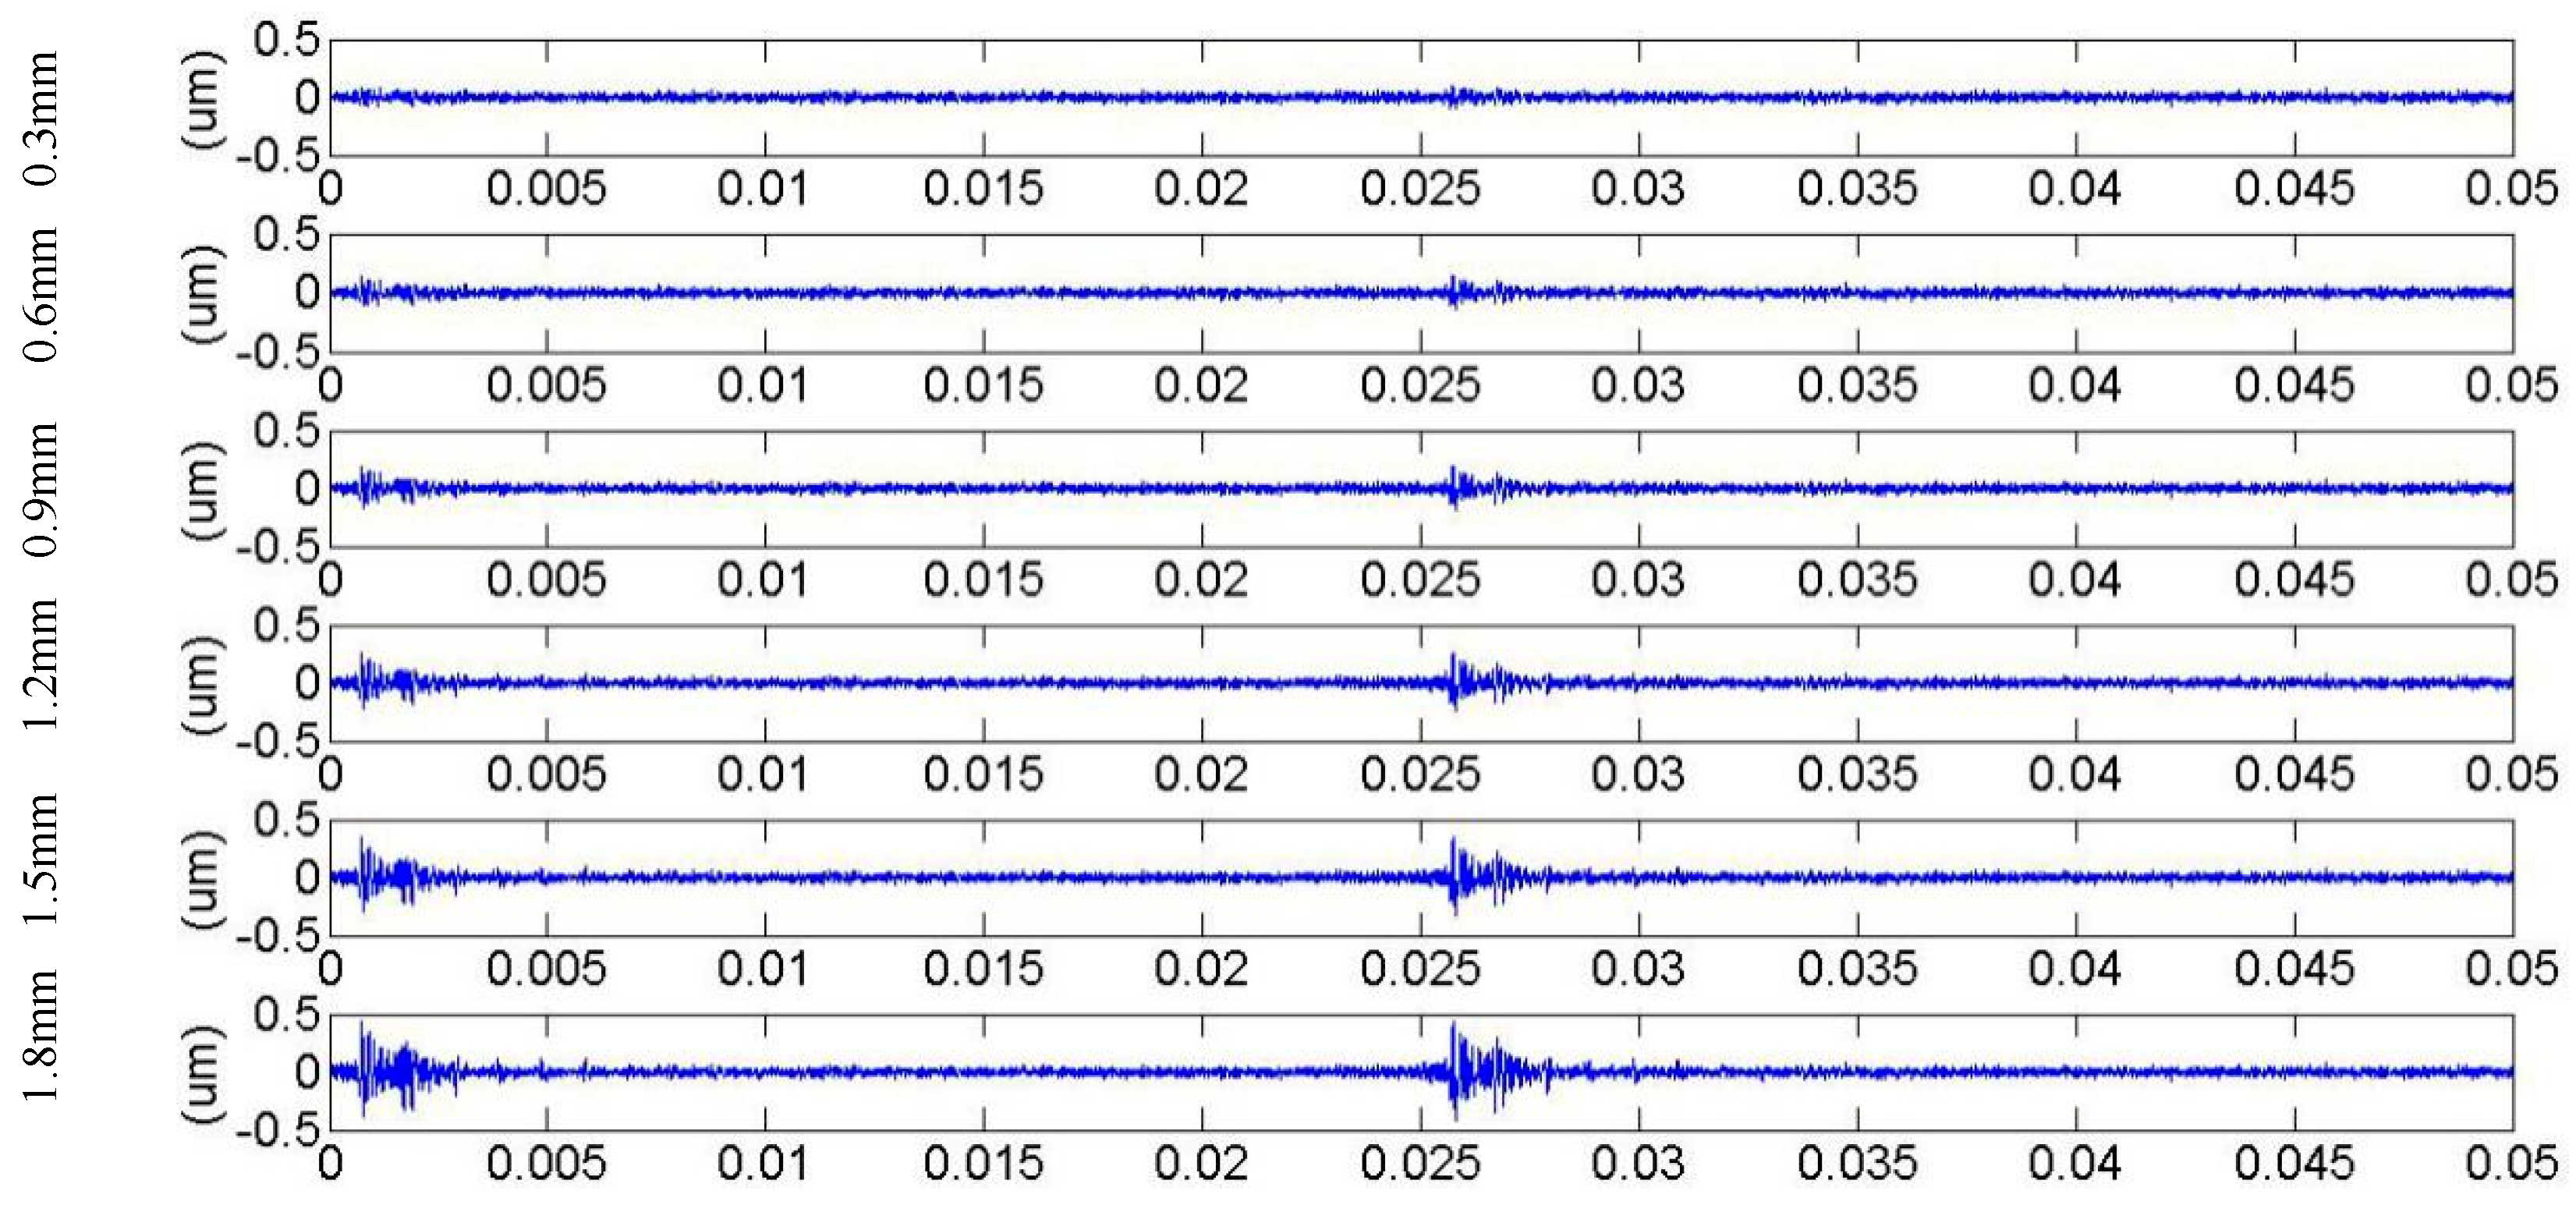
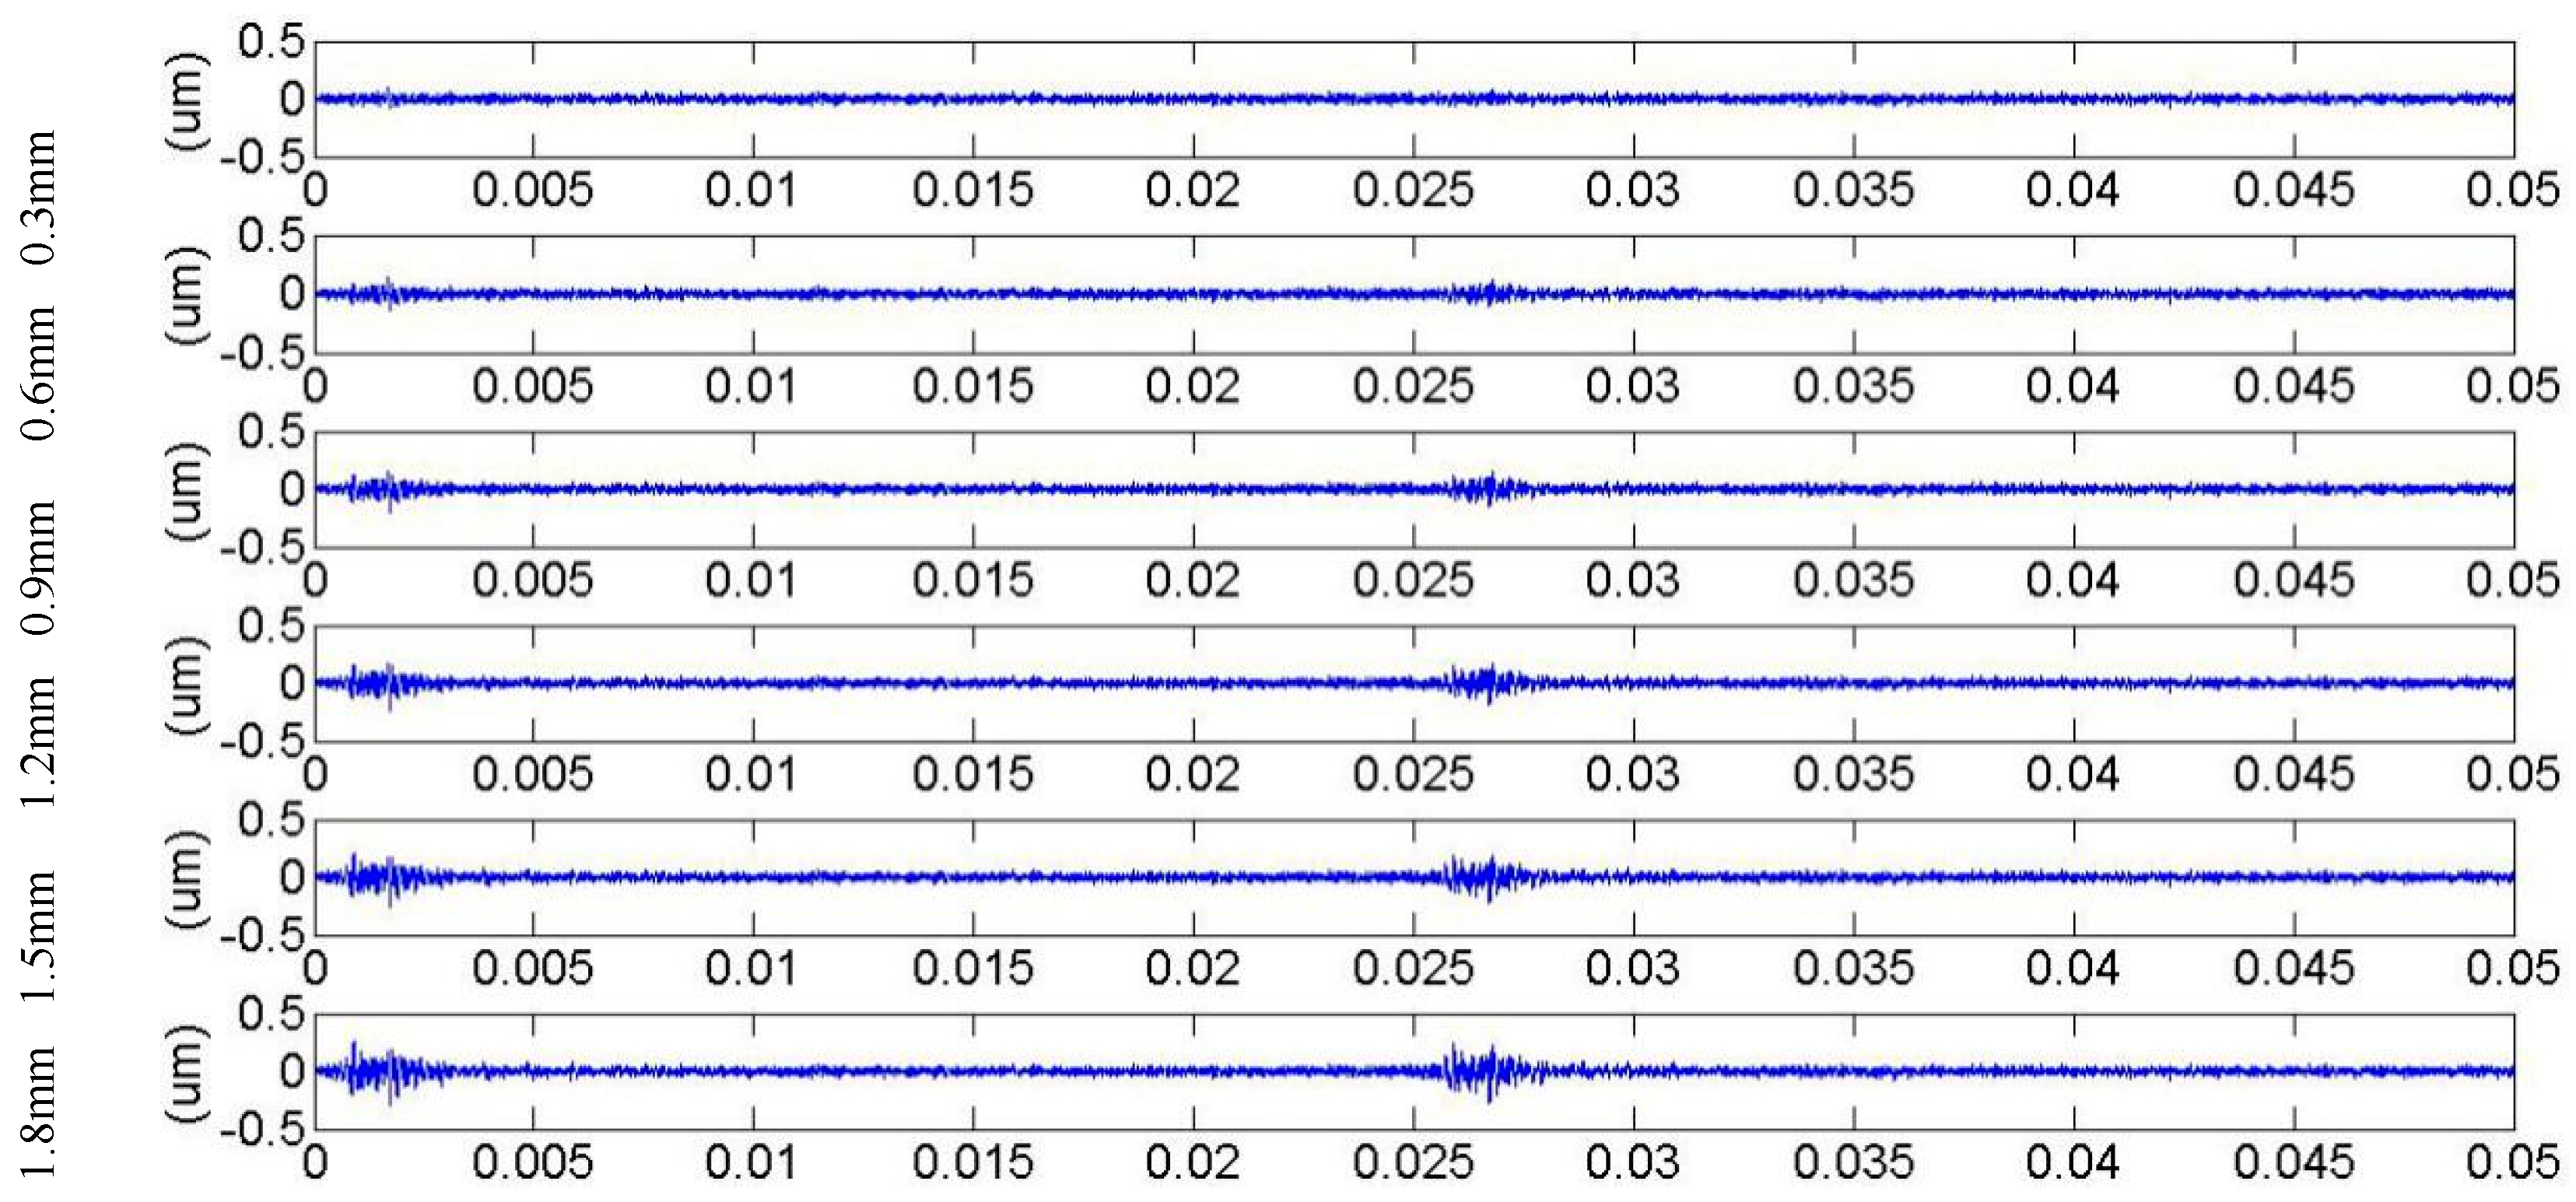
3.1. Meshing Stiffness and Vibration Response for Cracked Gears in Different Pressure Angles
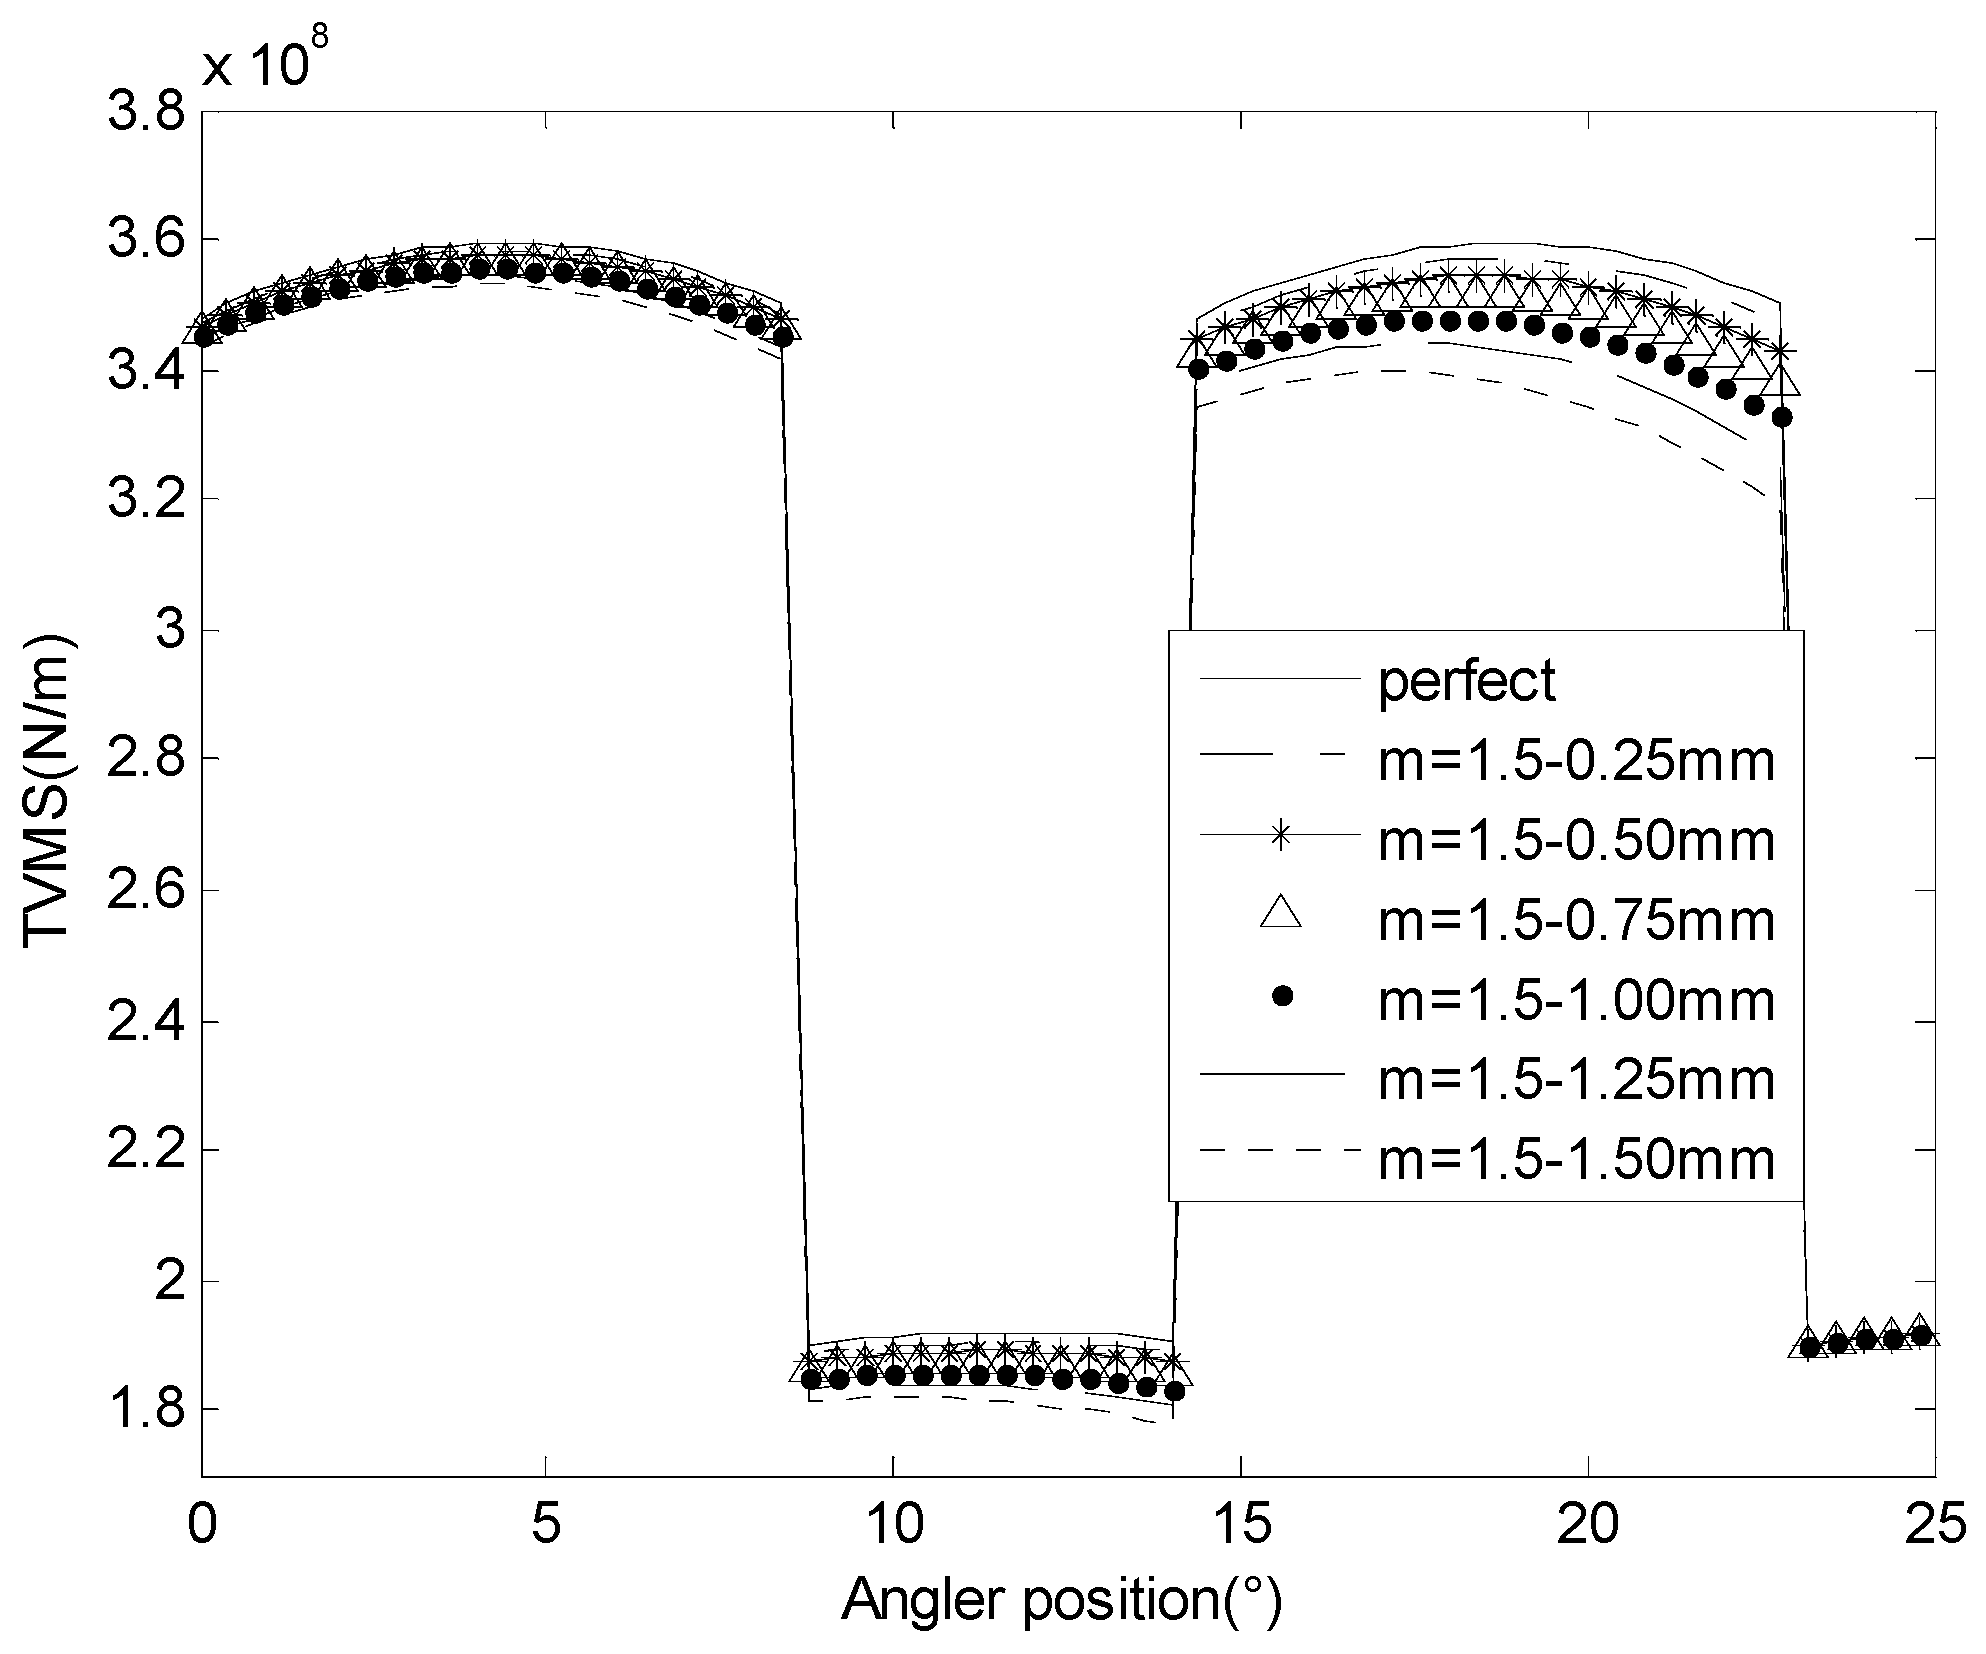
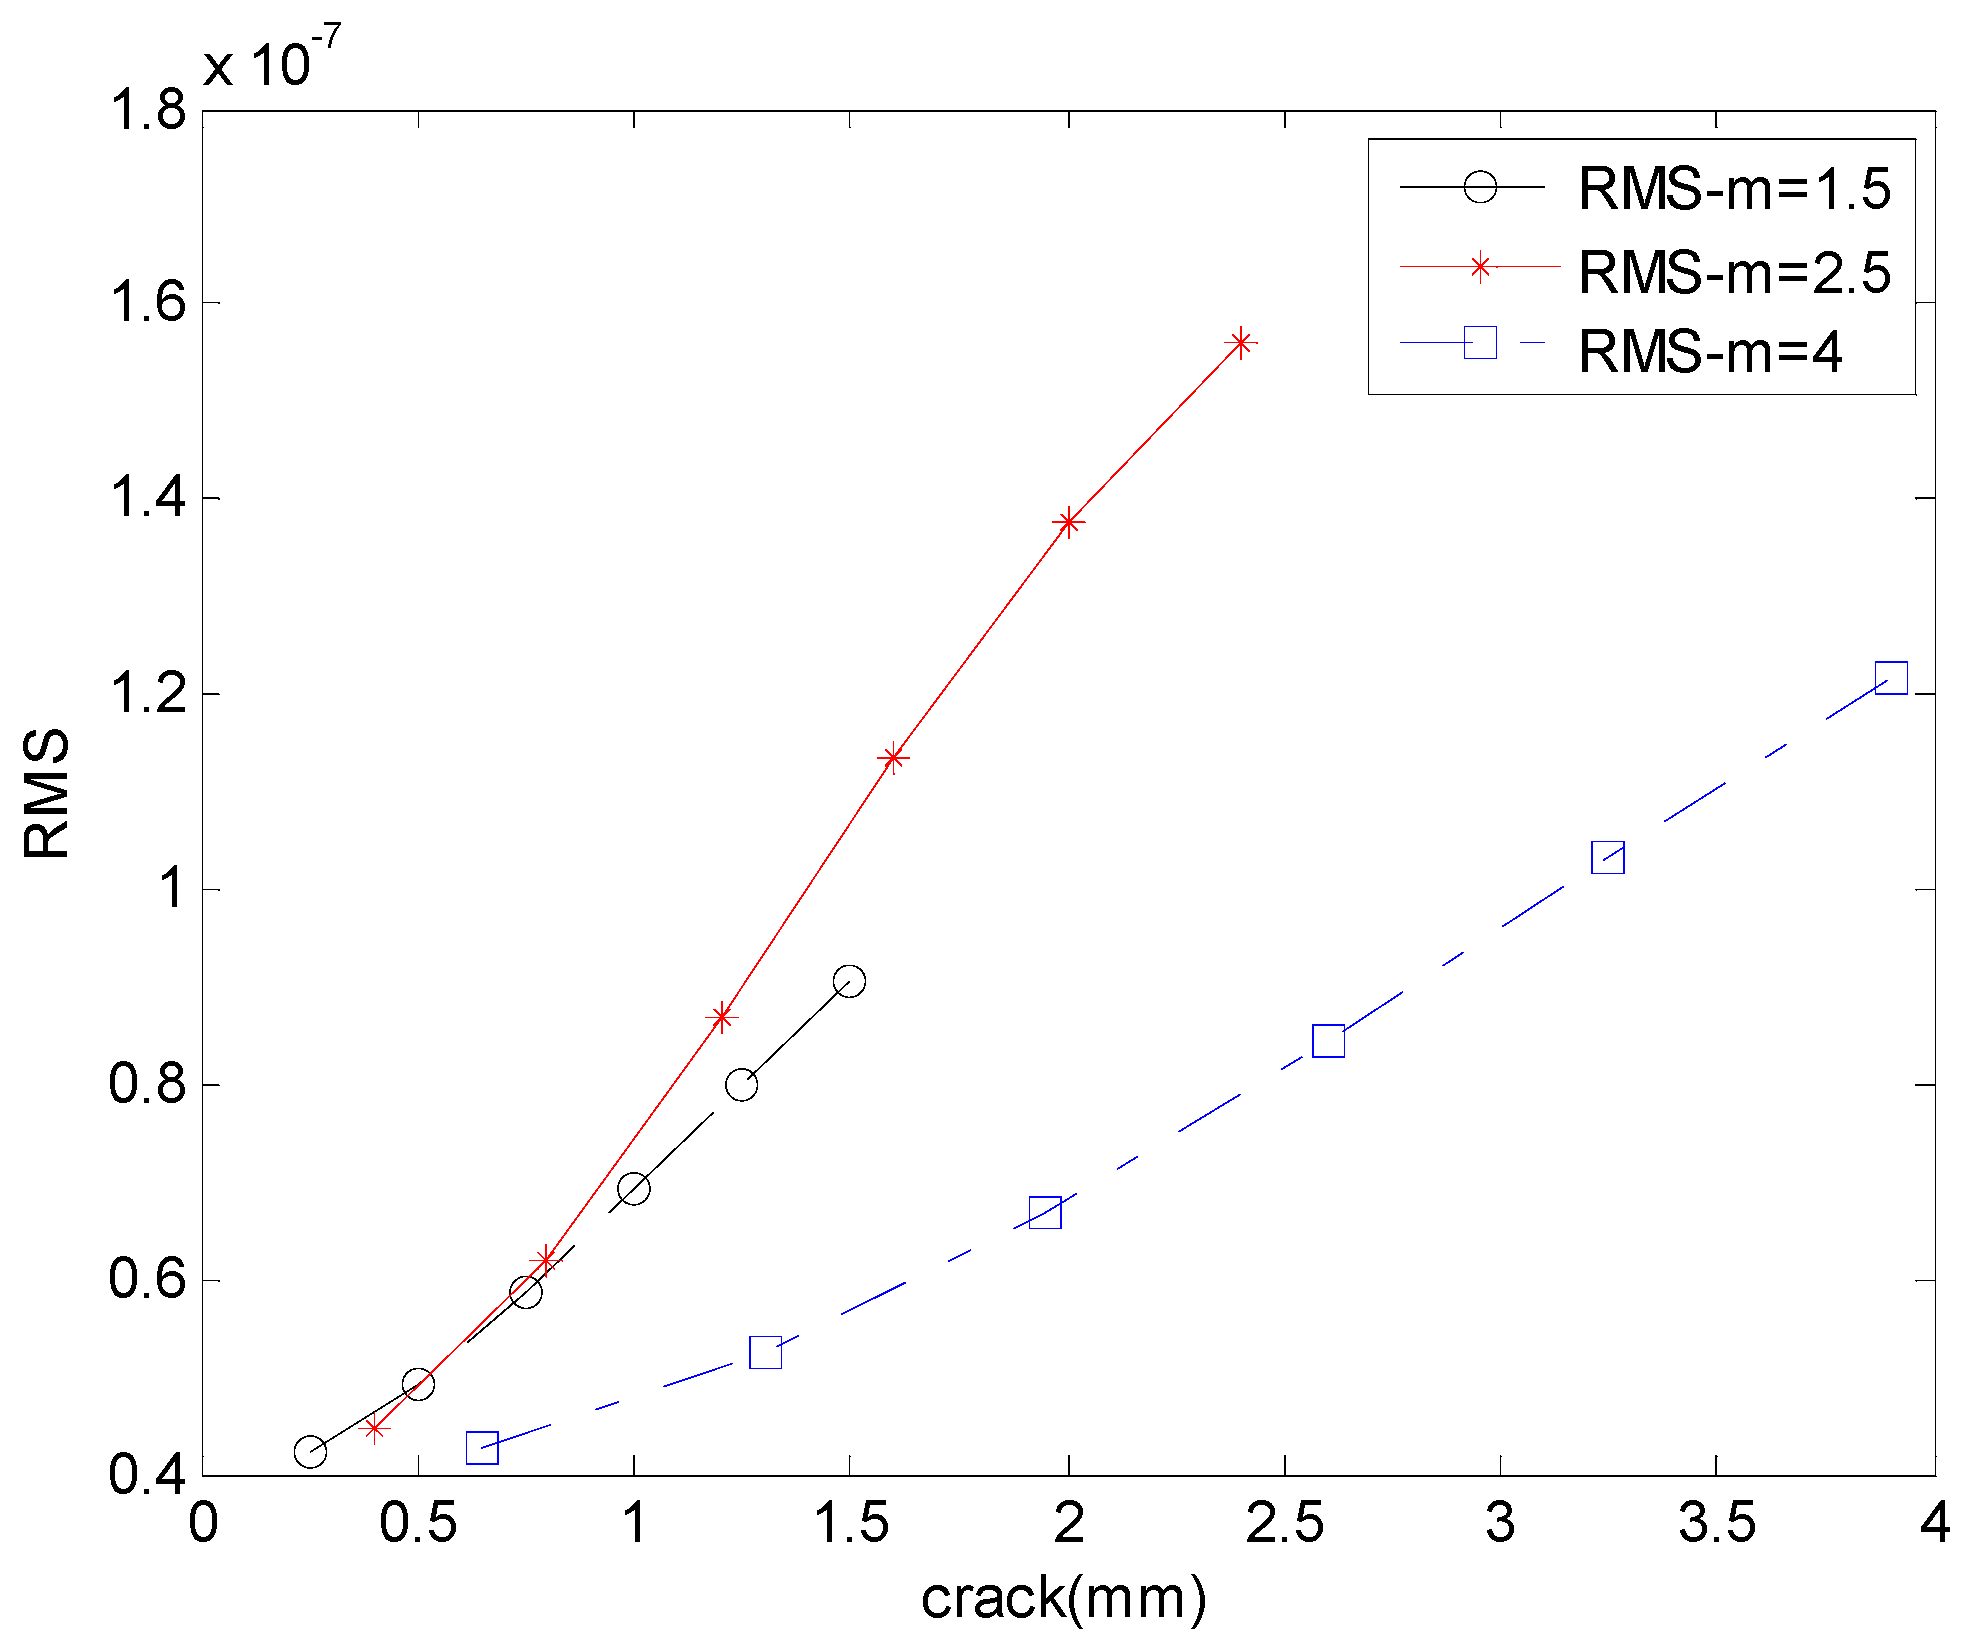
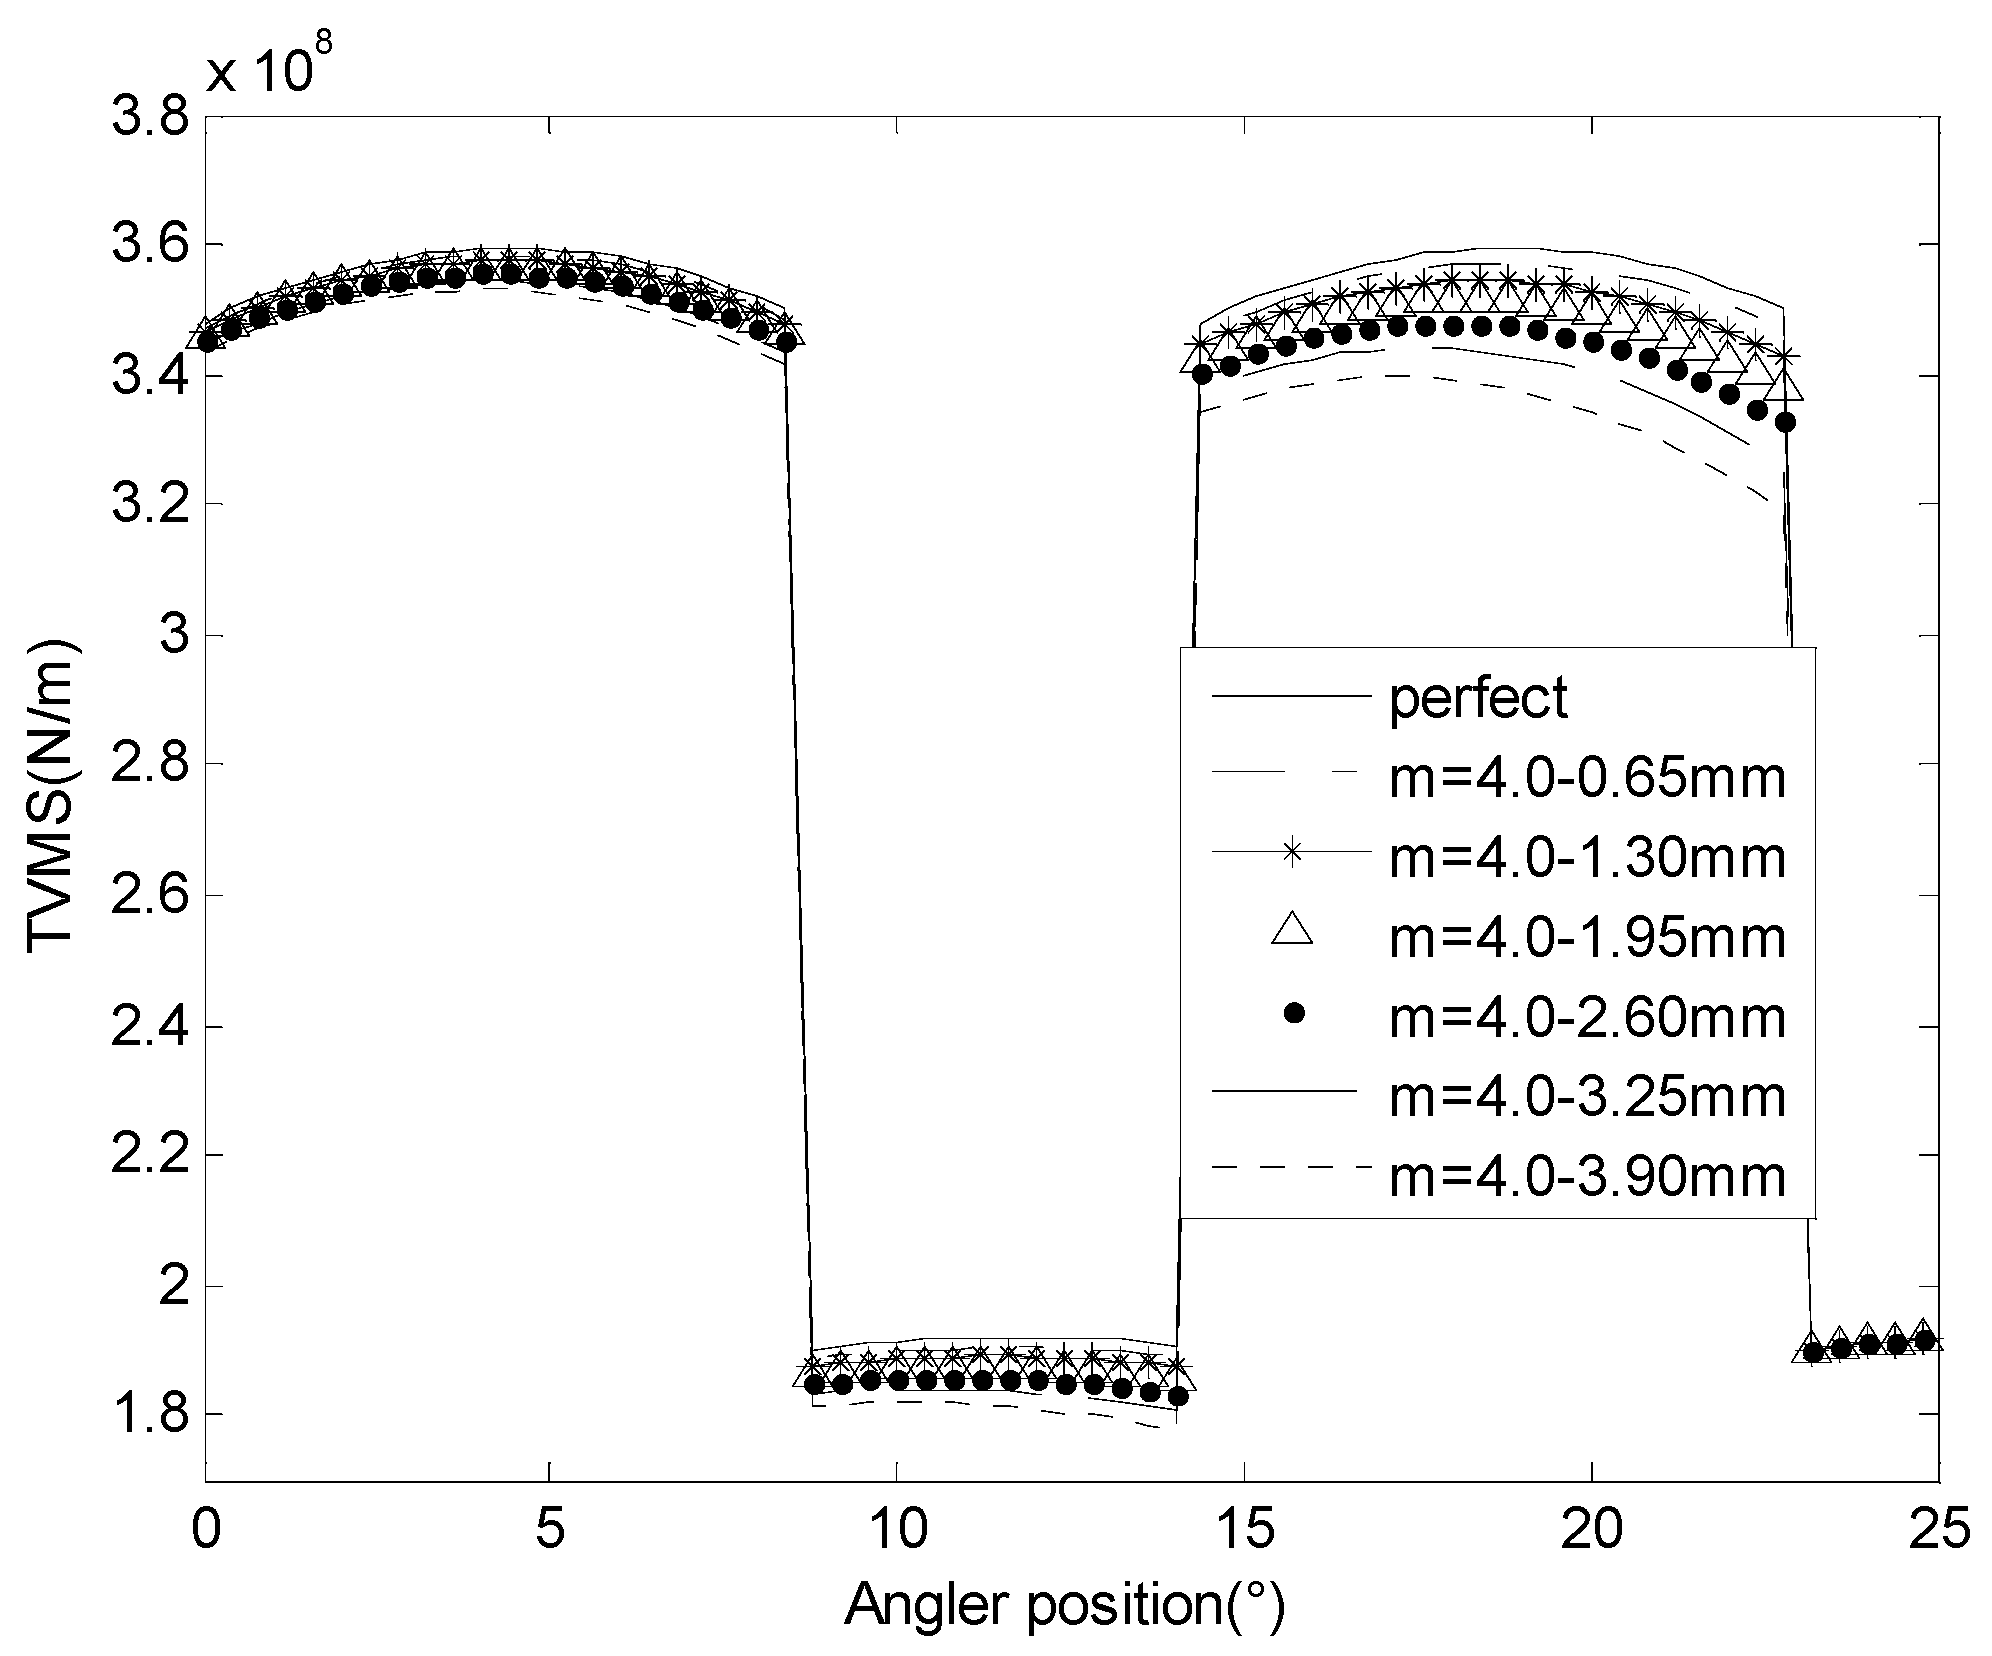
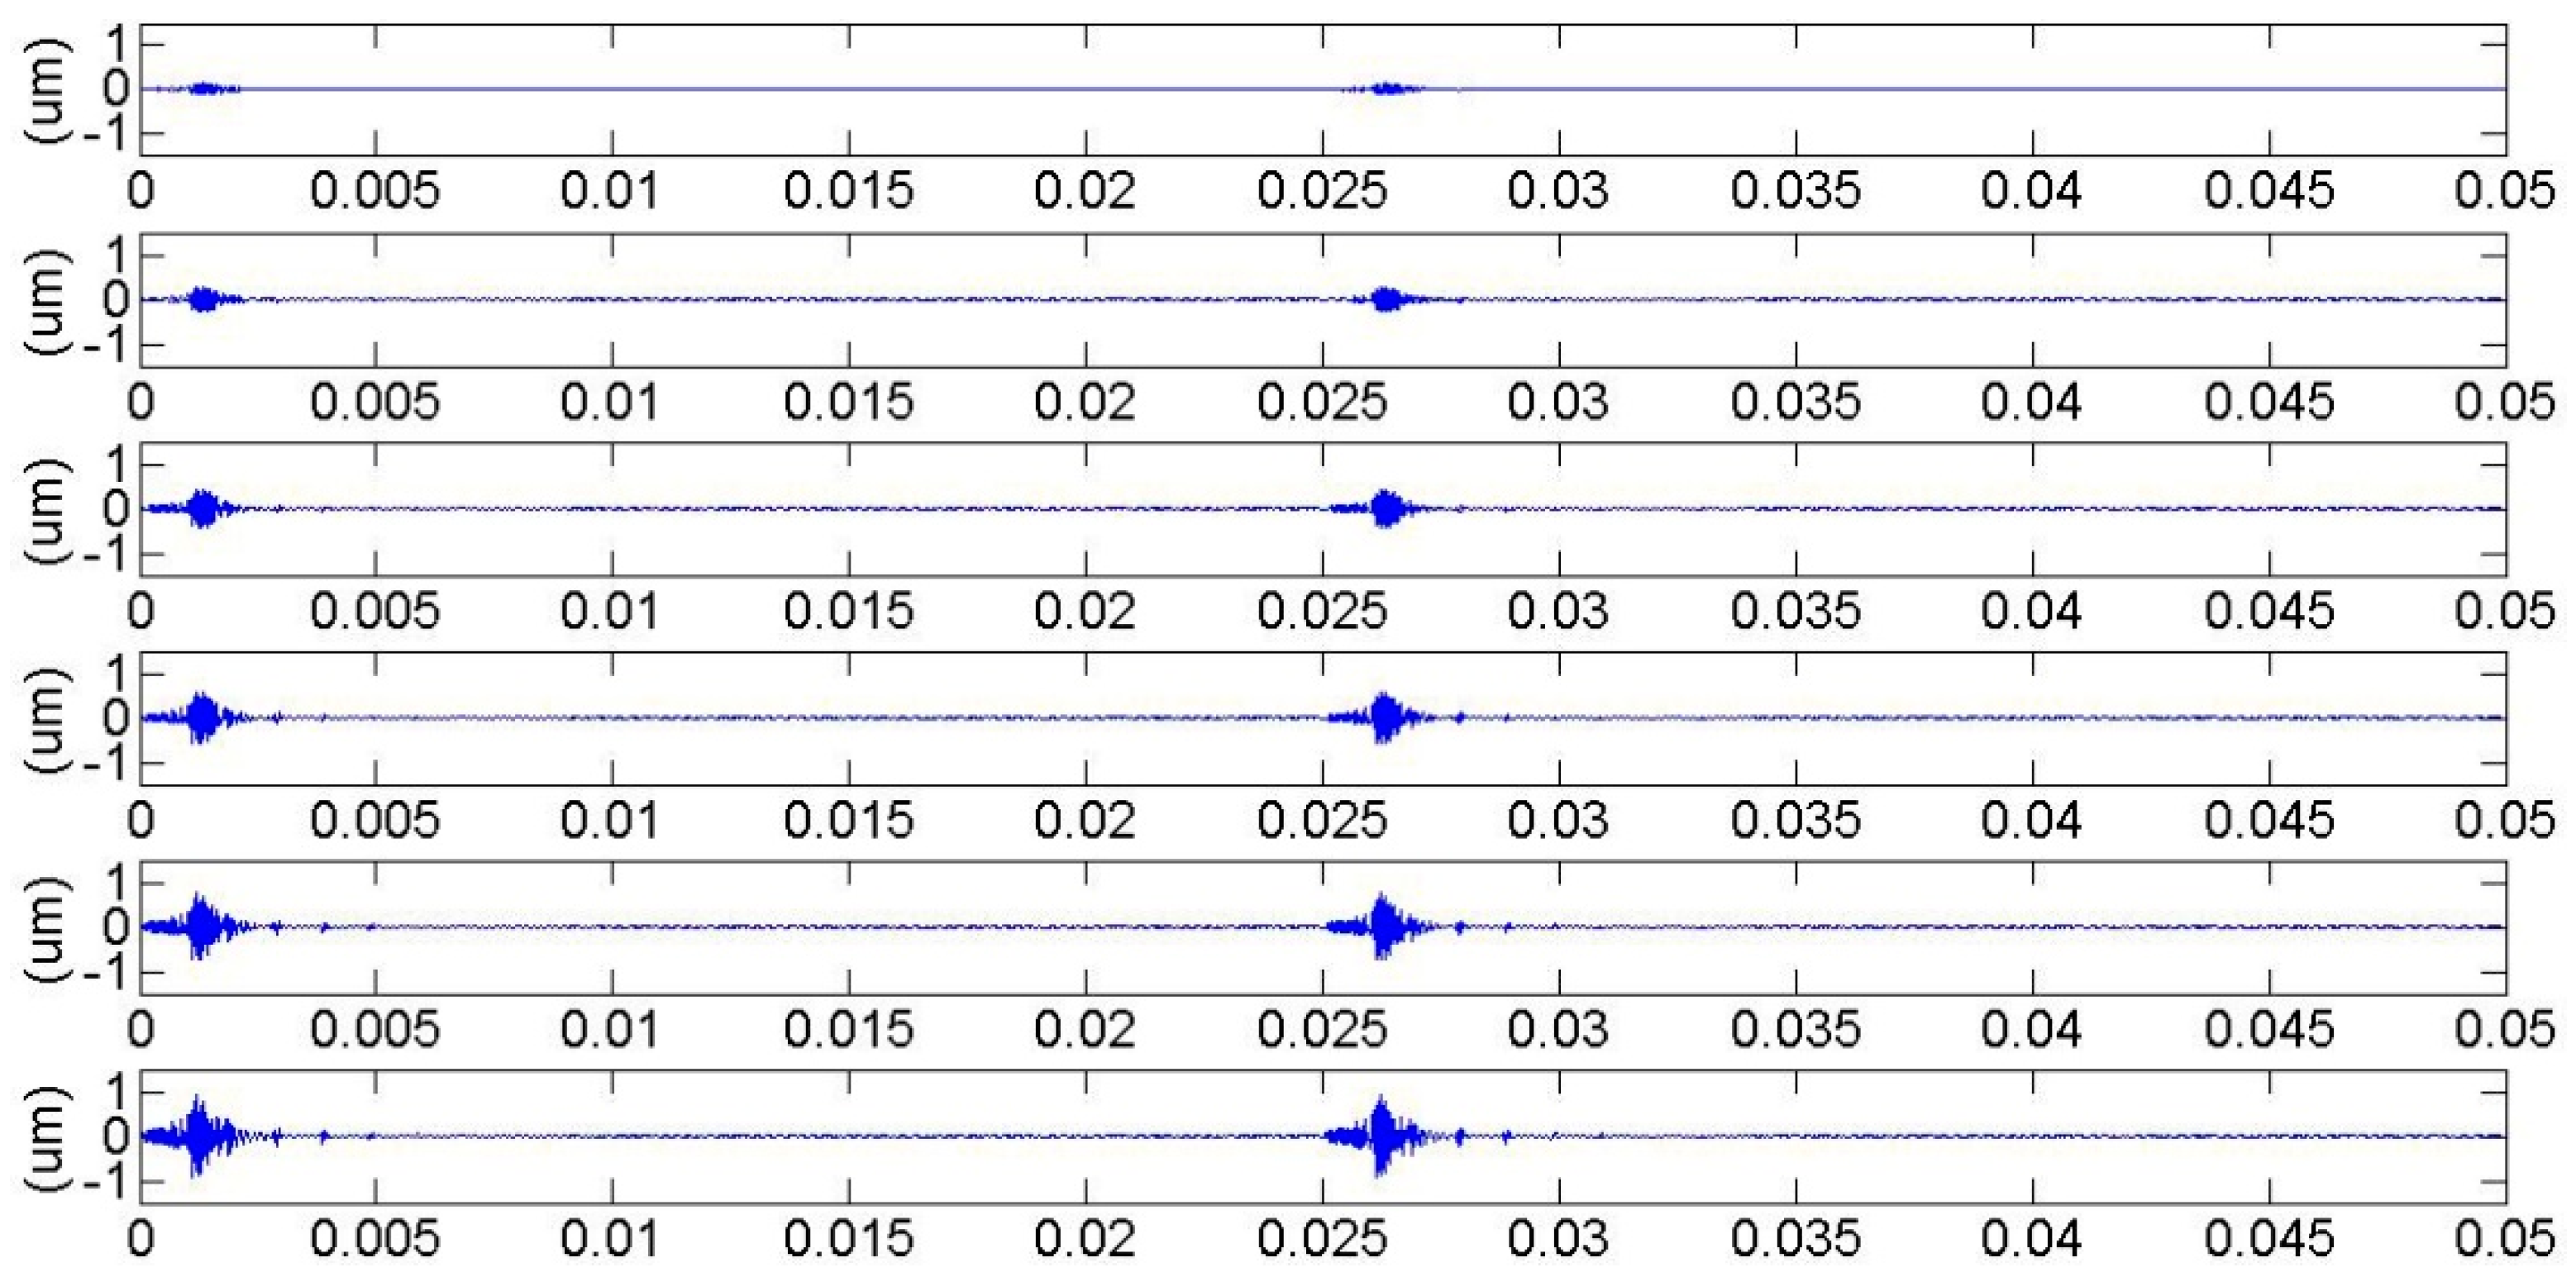
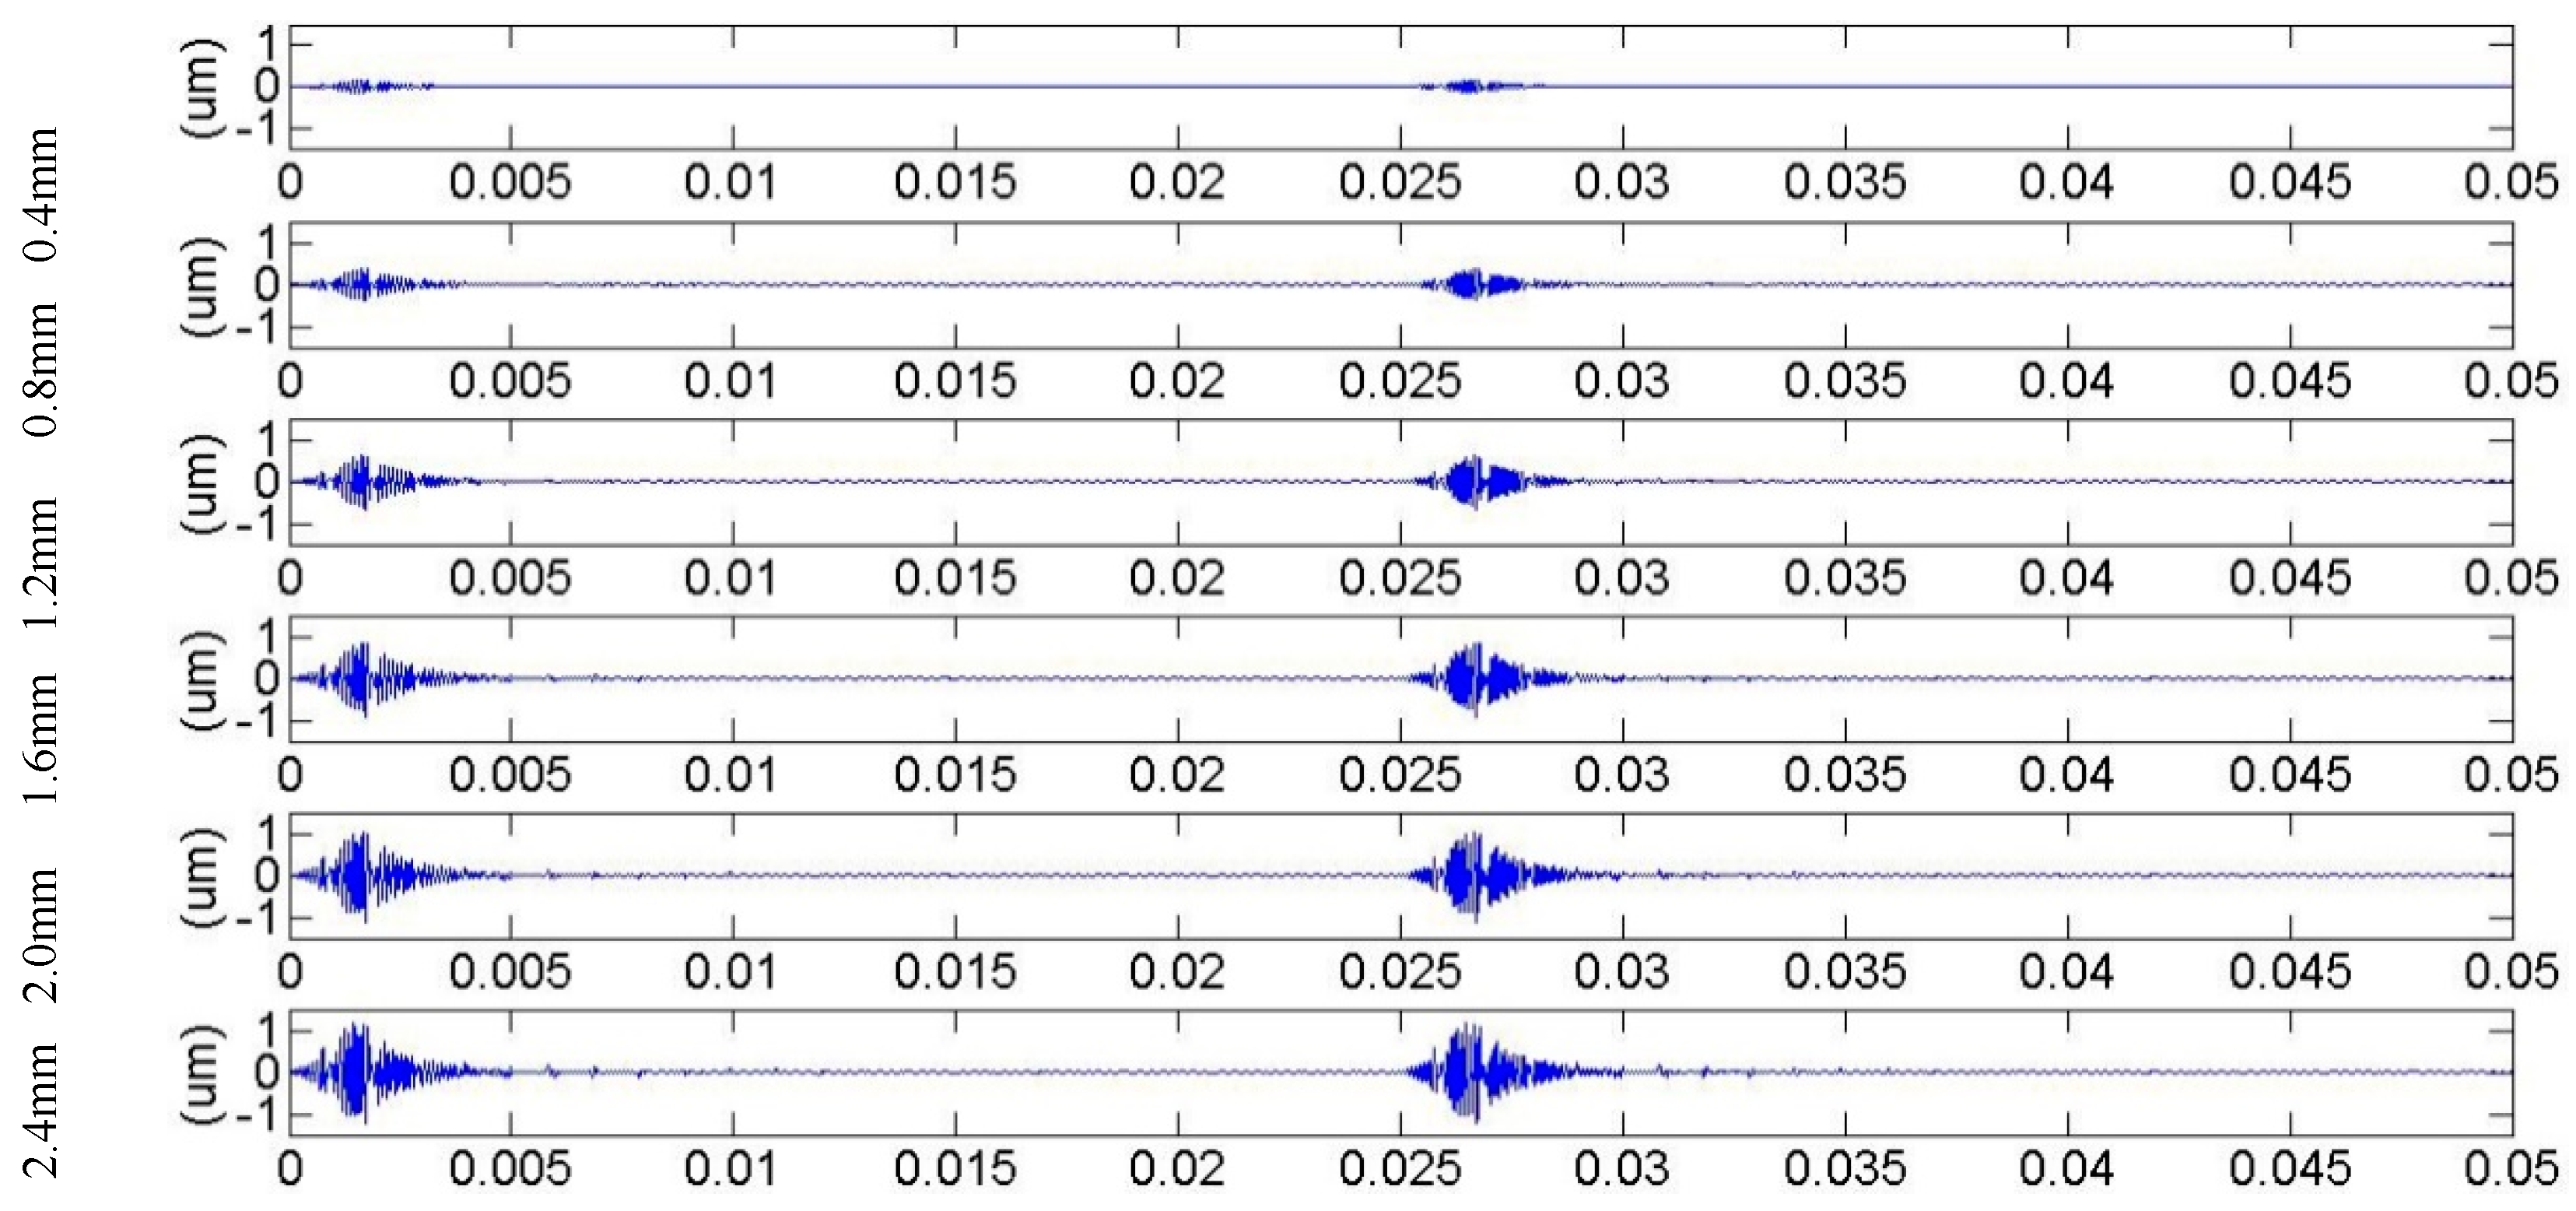
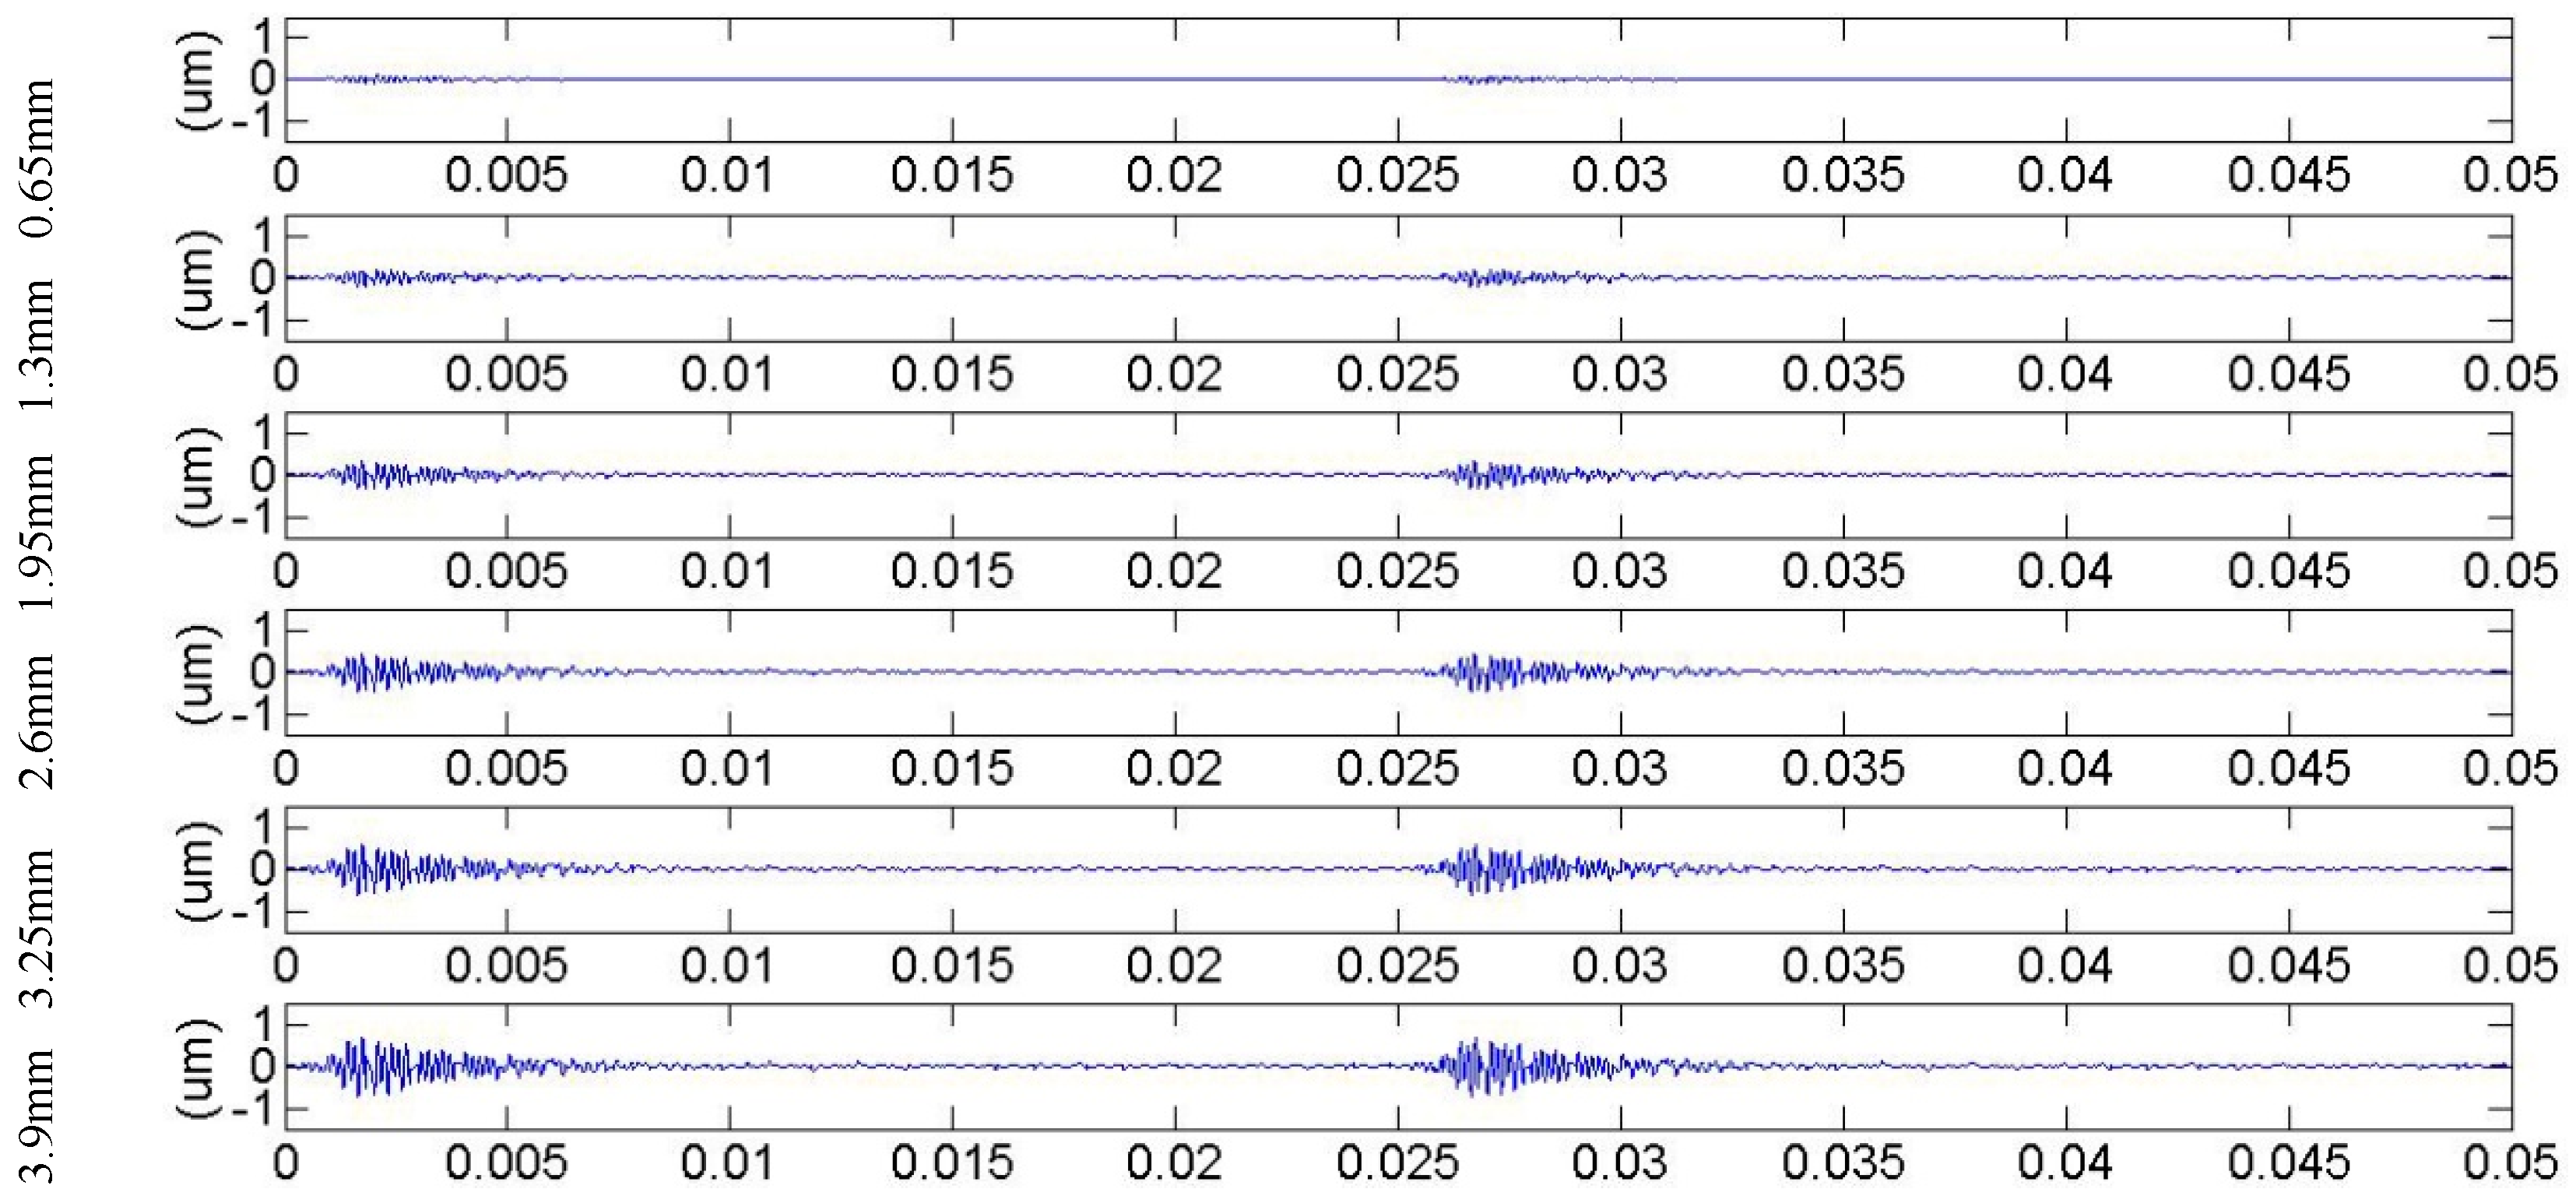
3.2. Meshing Stiffness and Vibration Response for Cracked Gears in Different Modulus
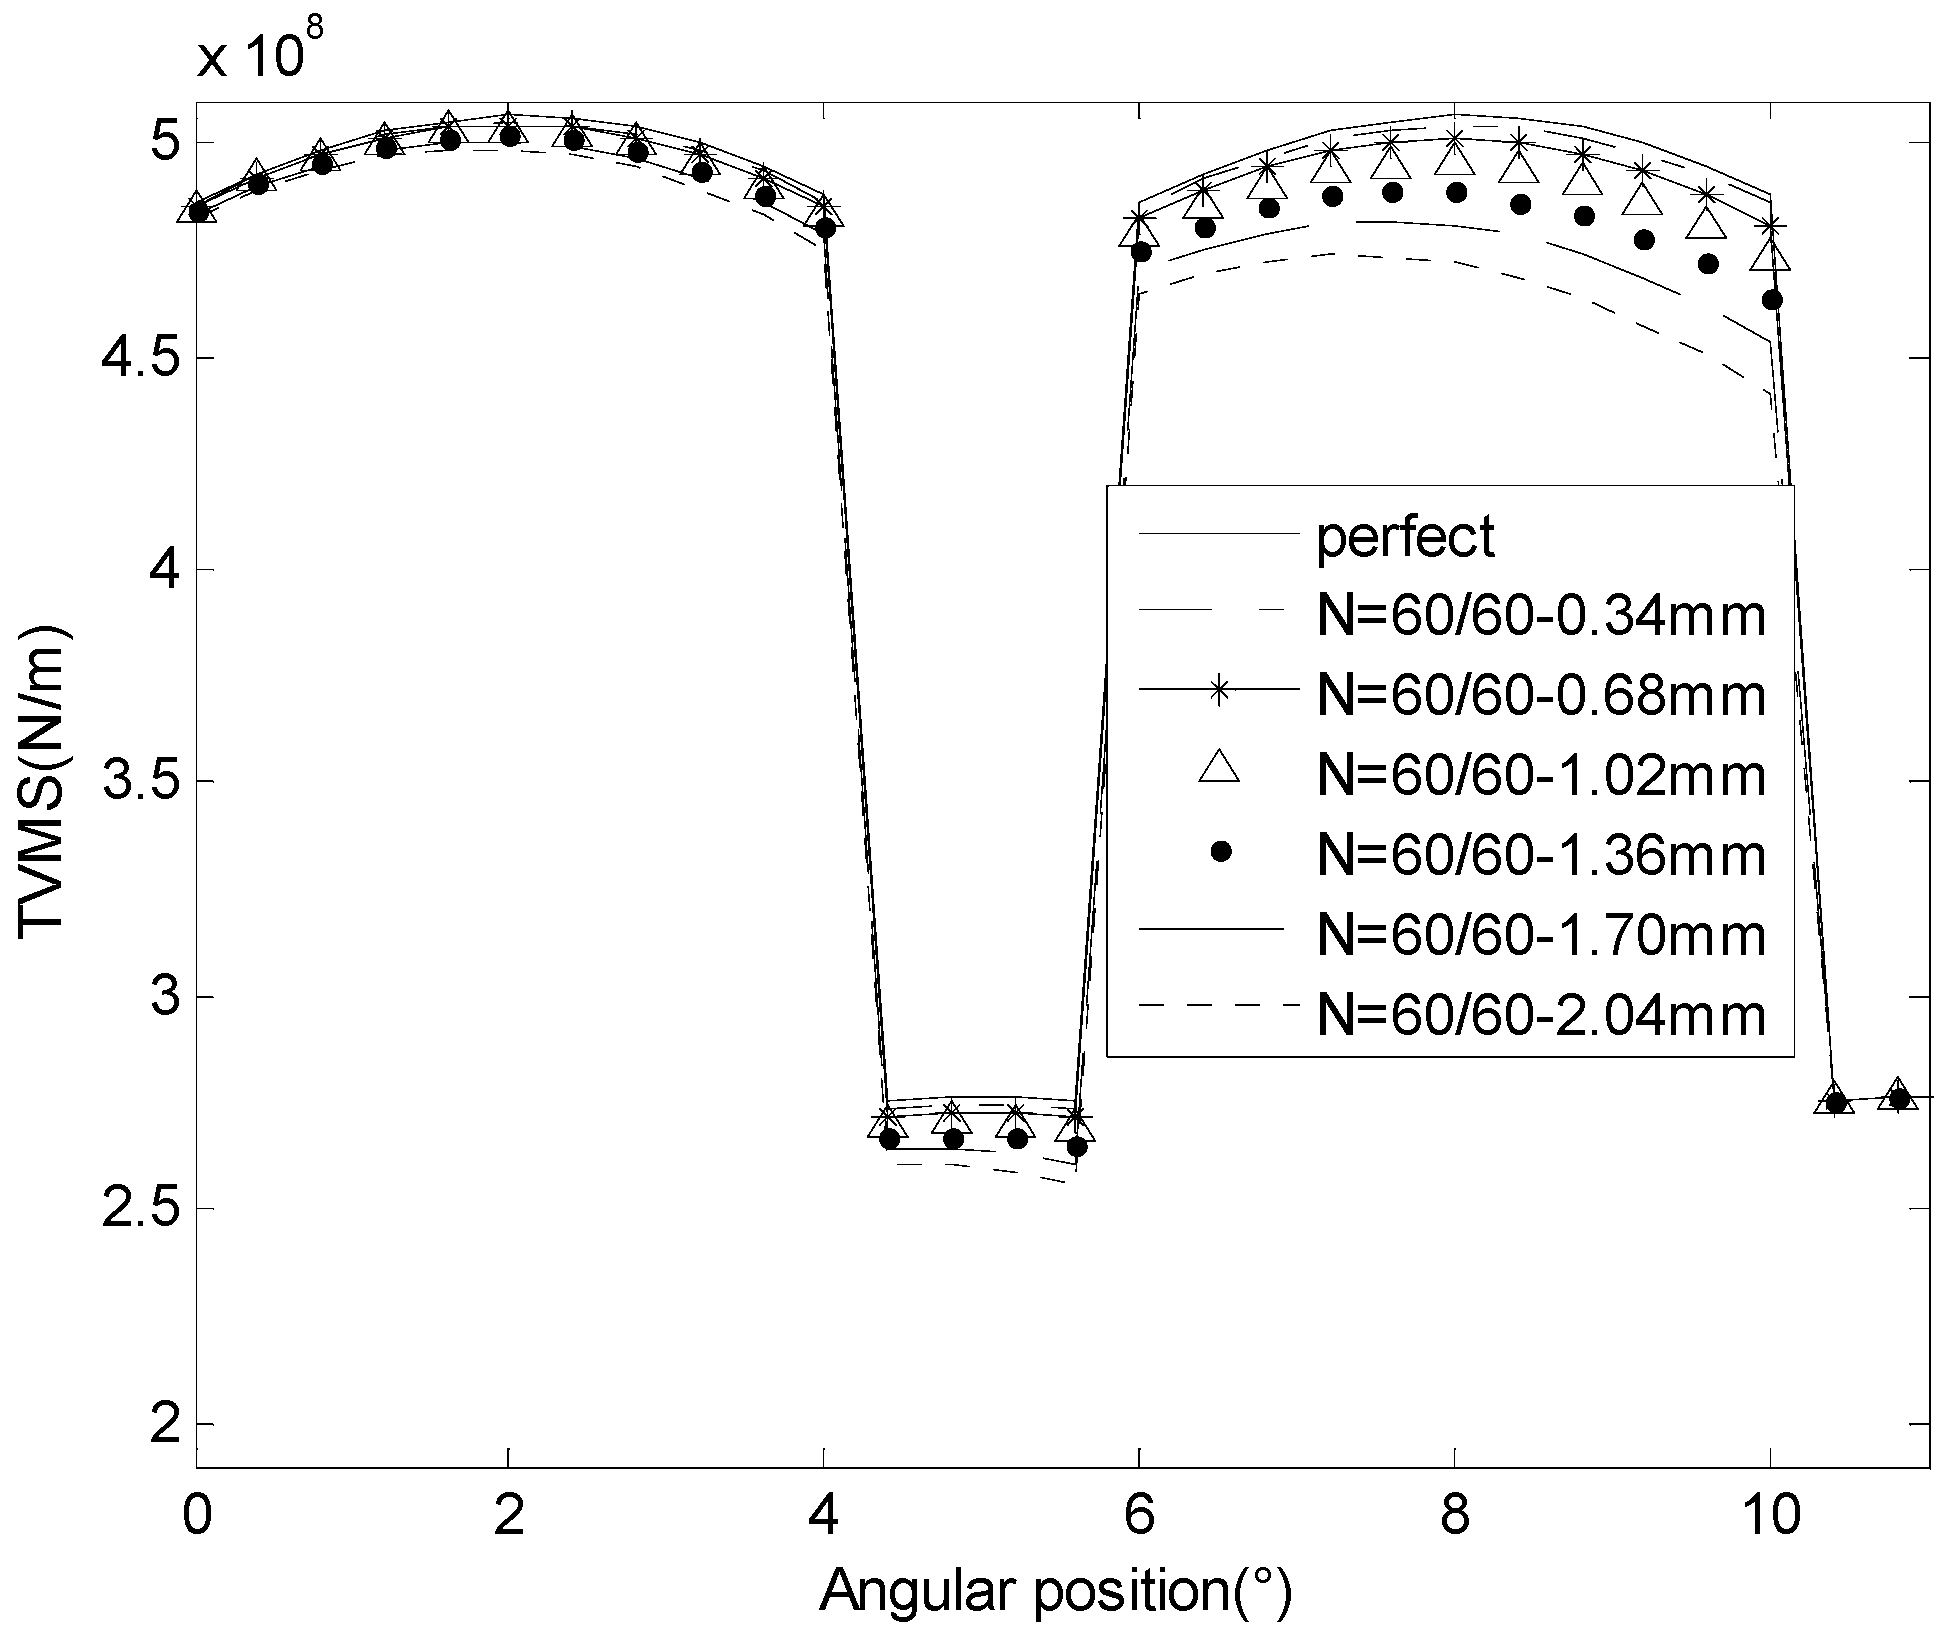
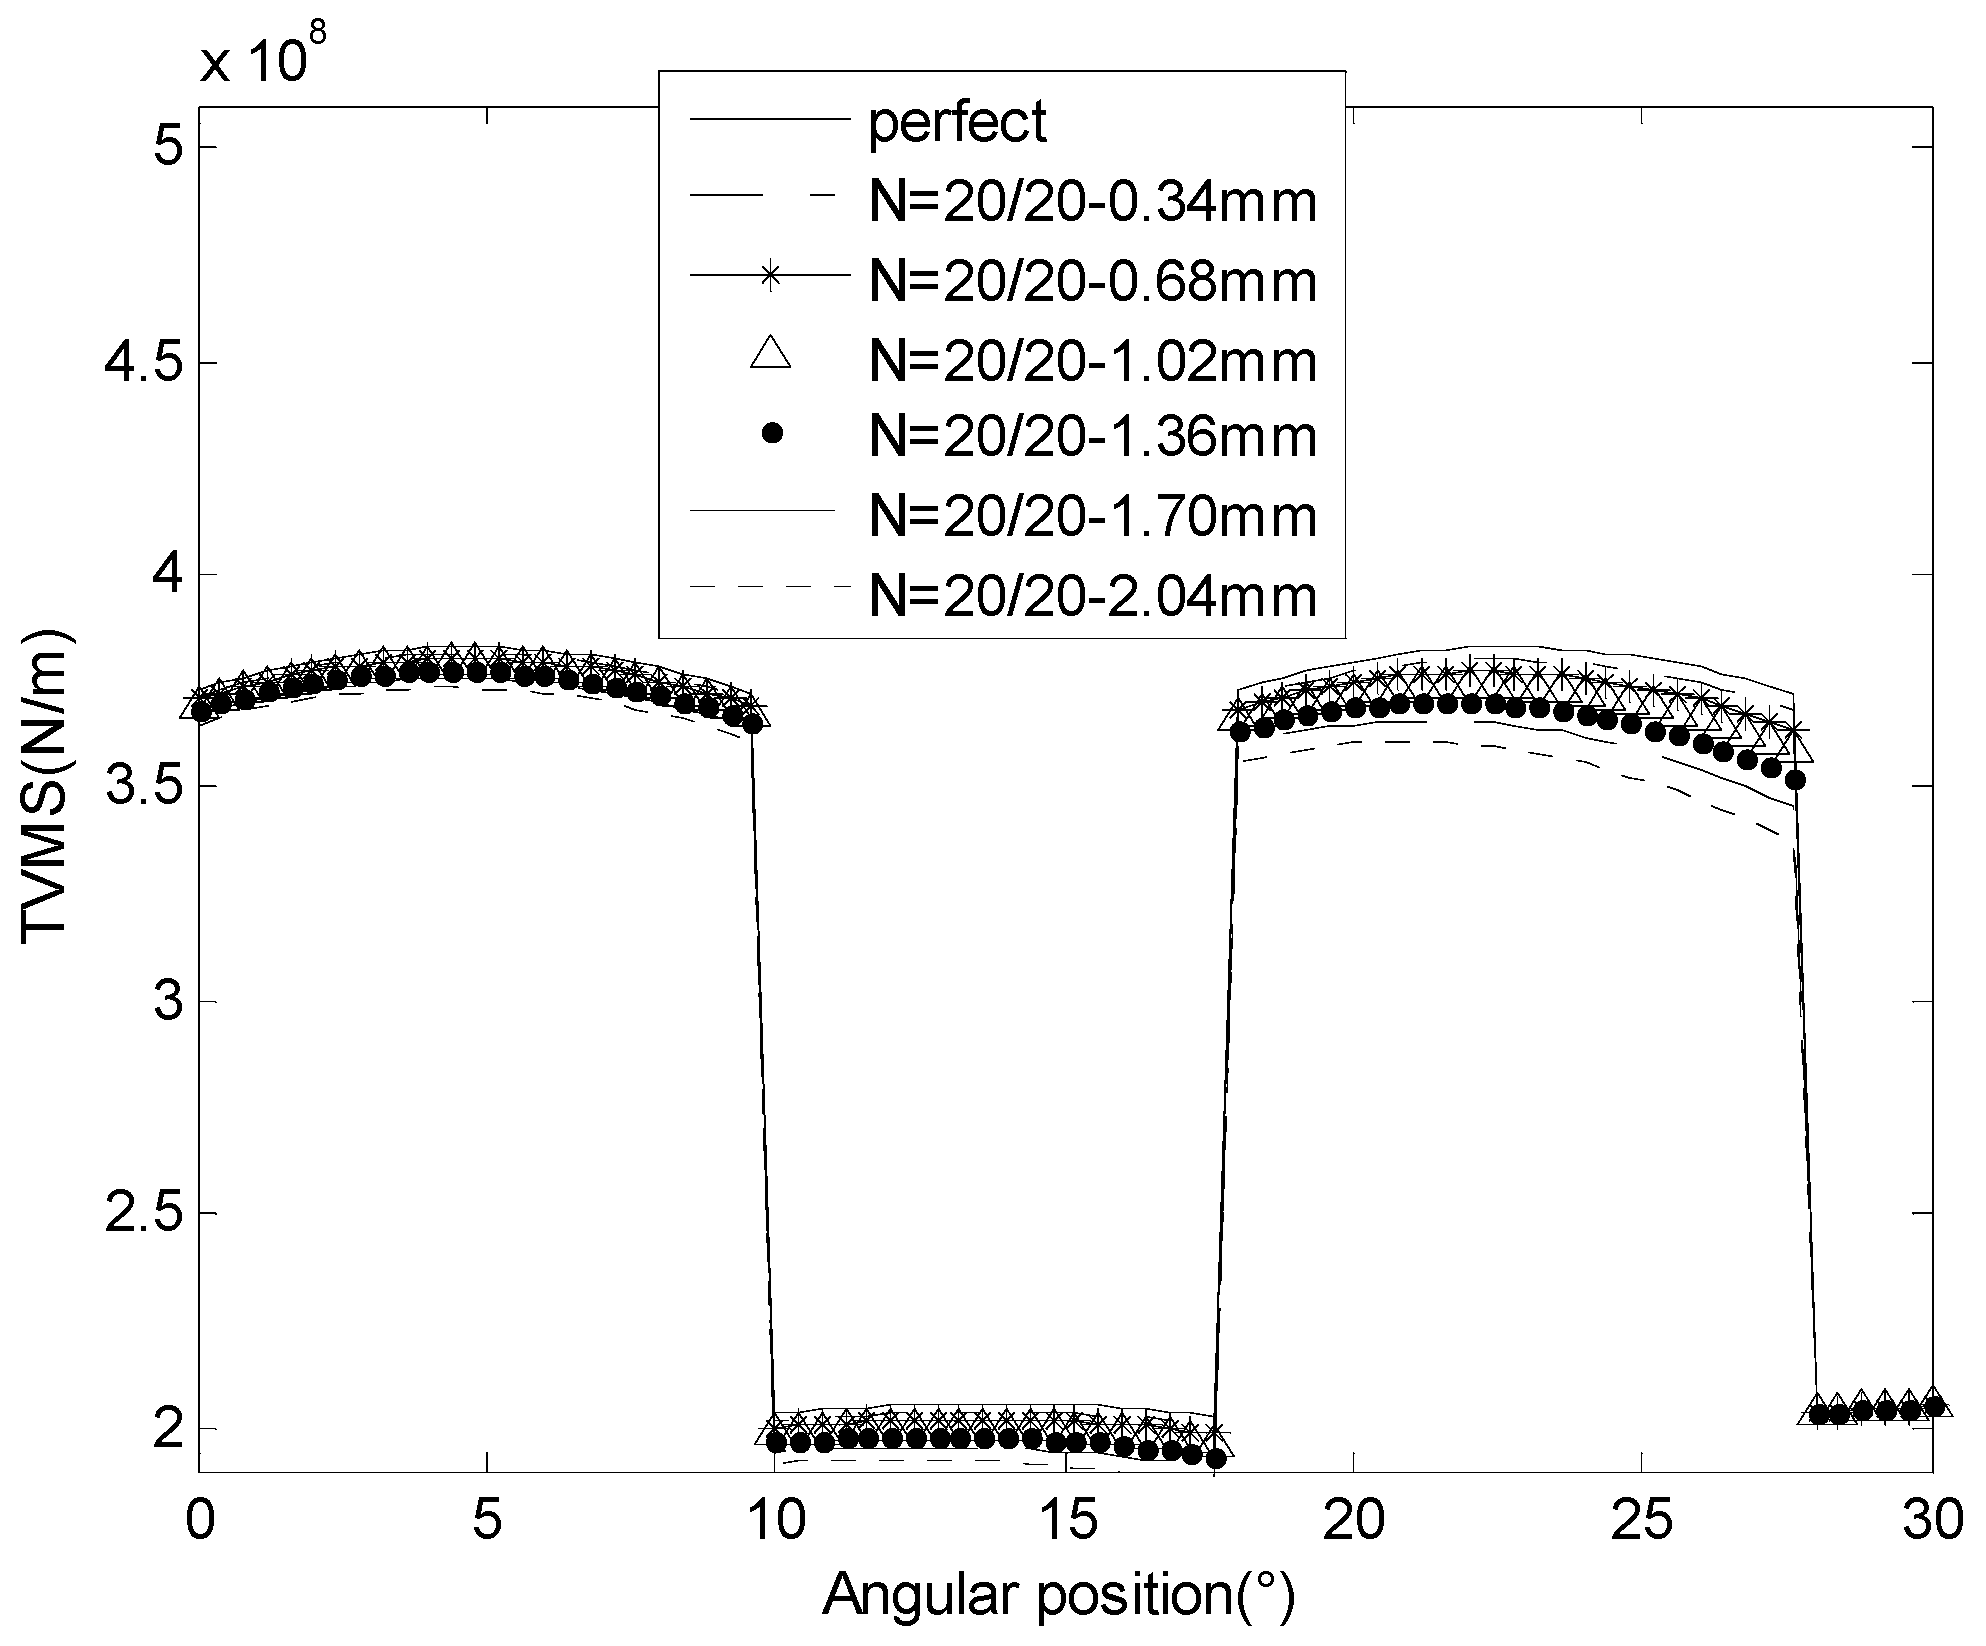
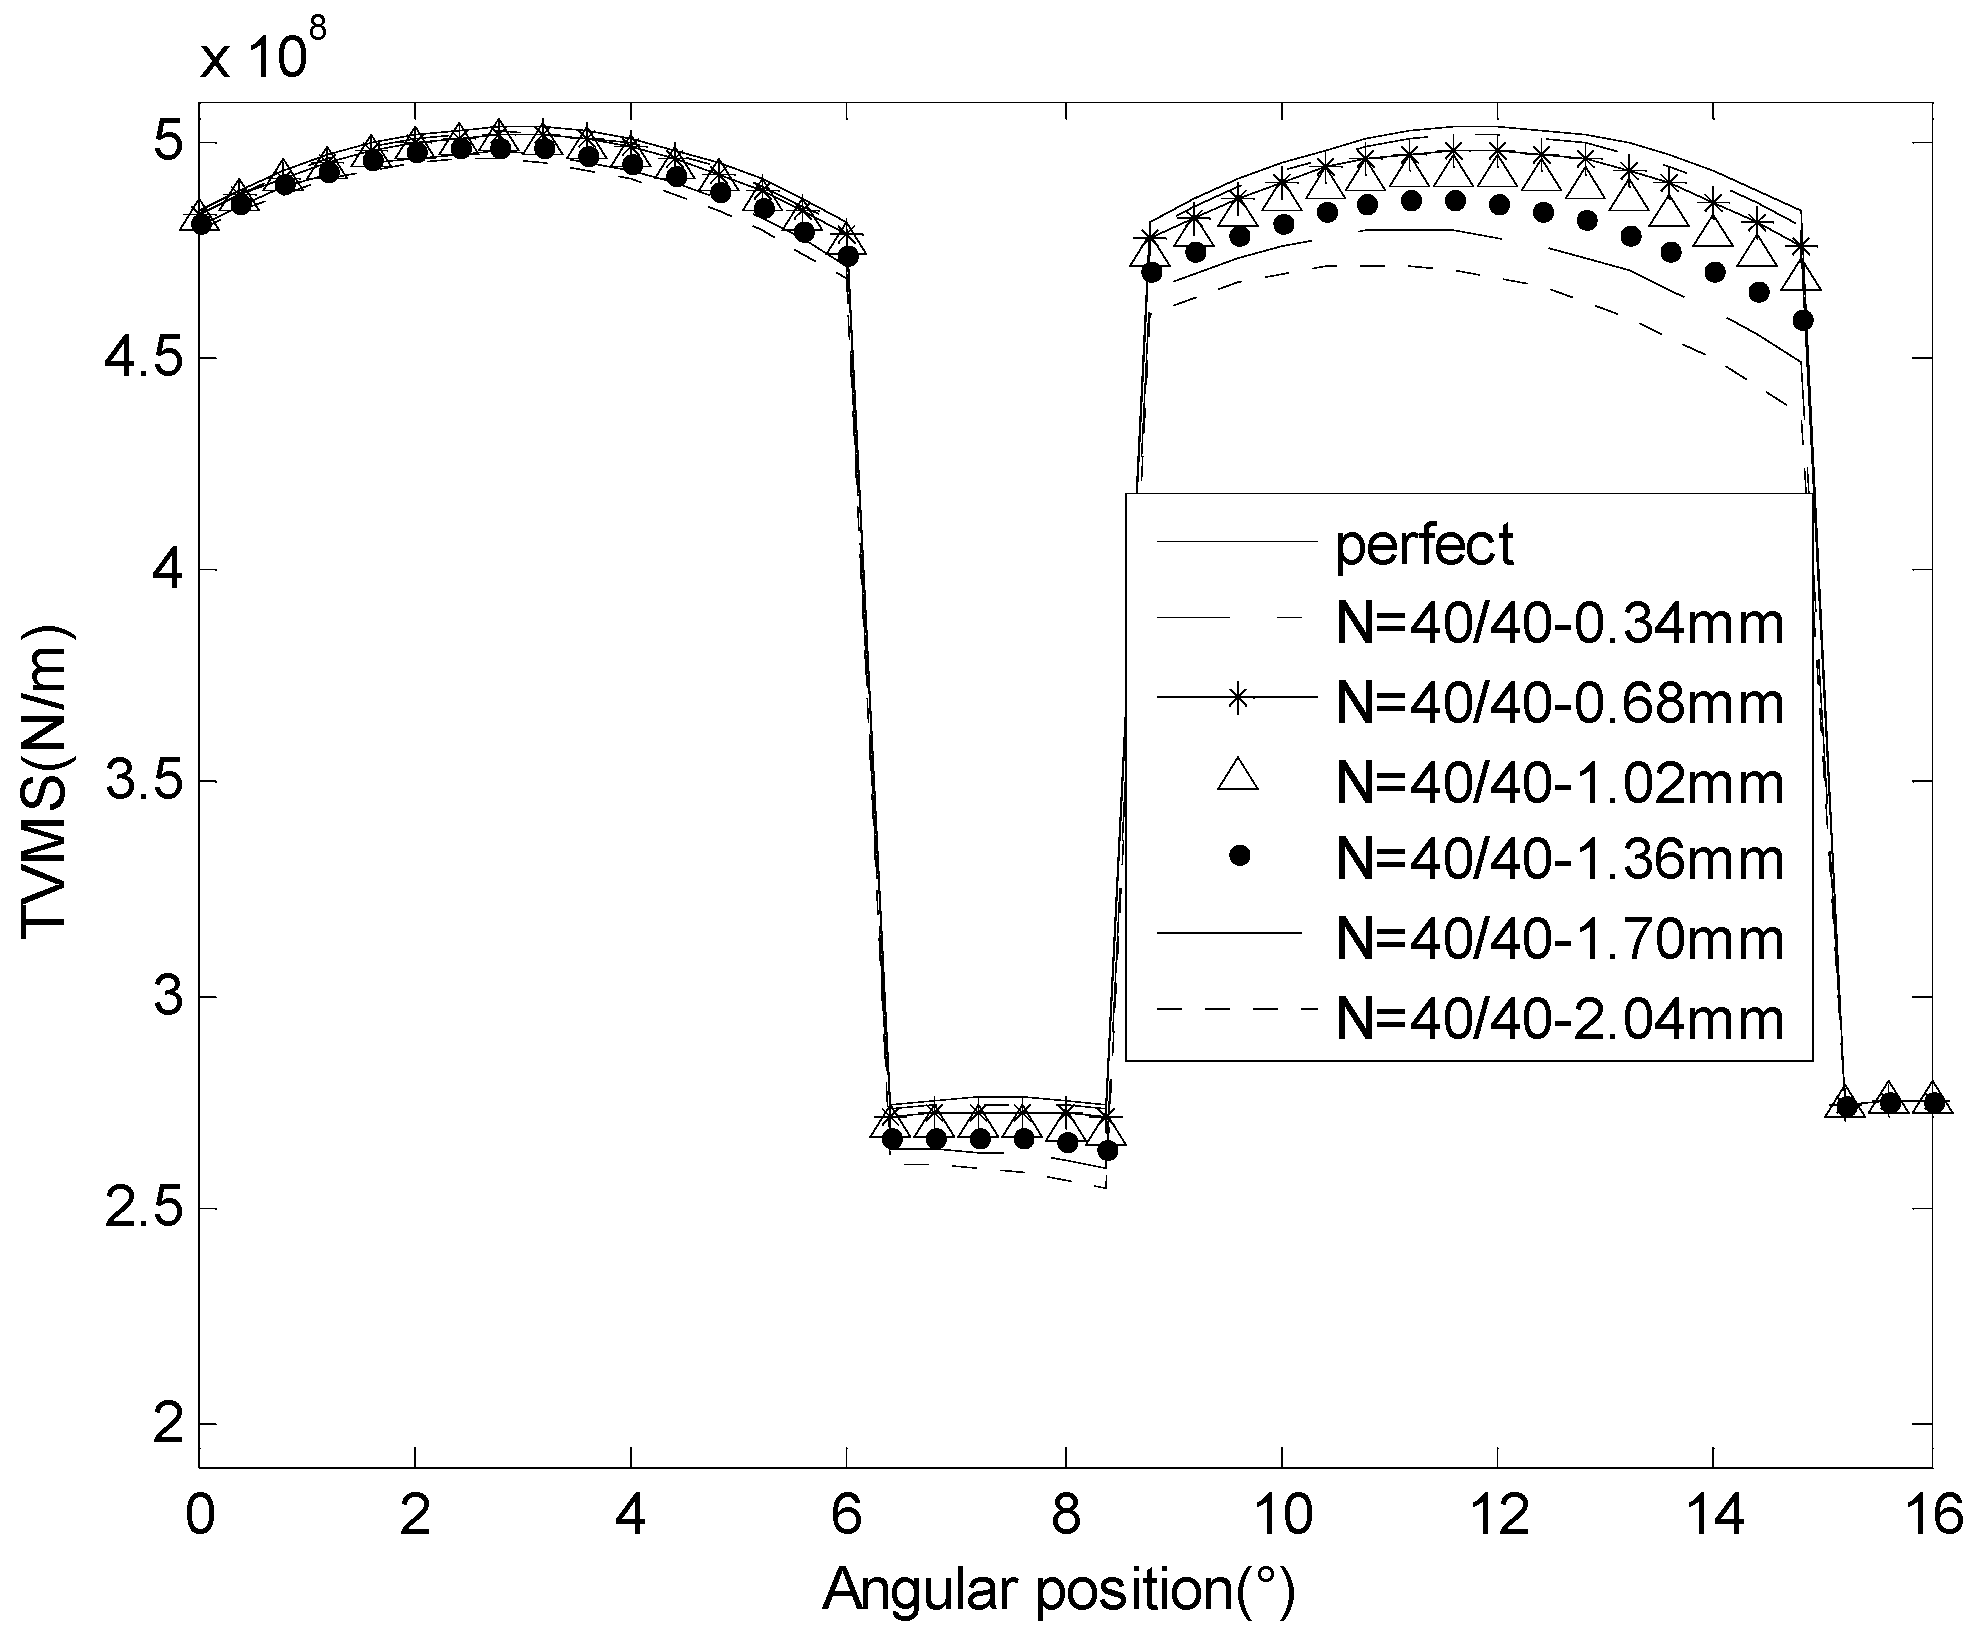
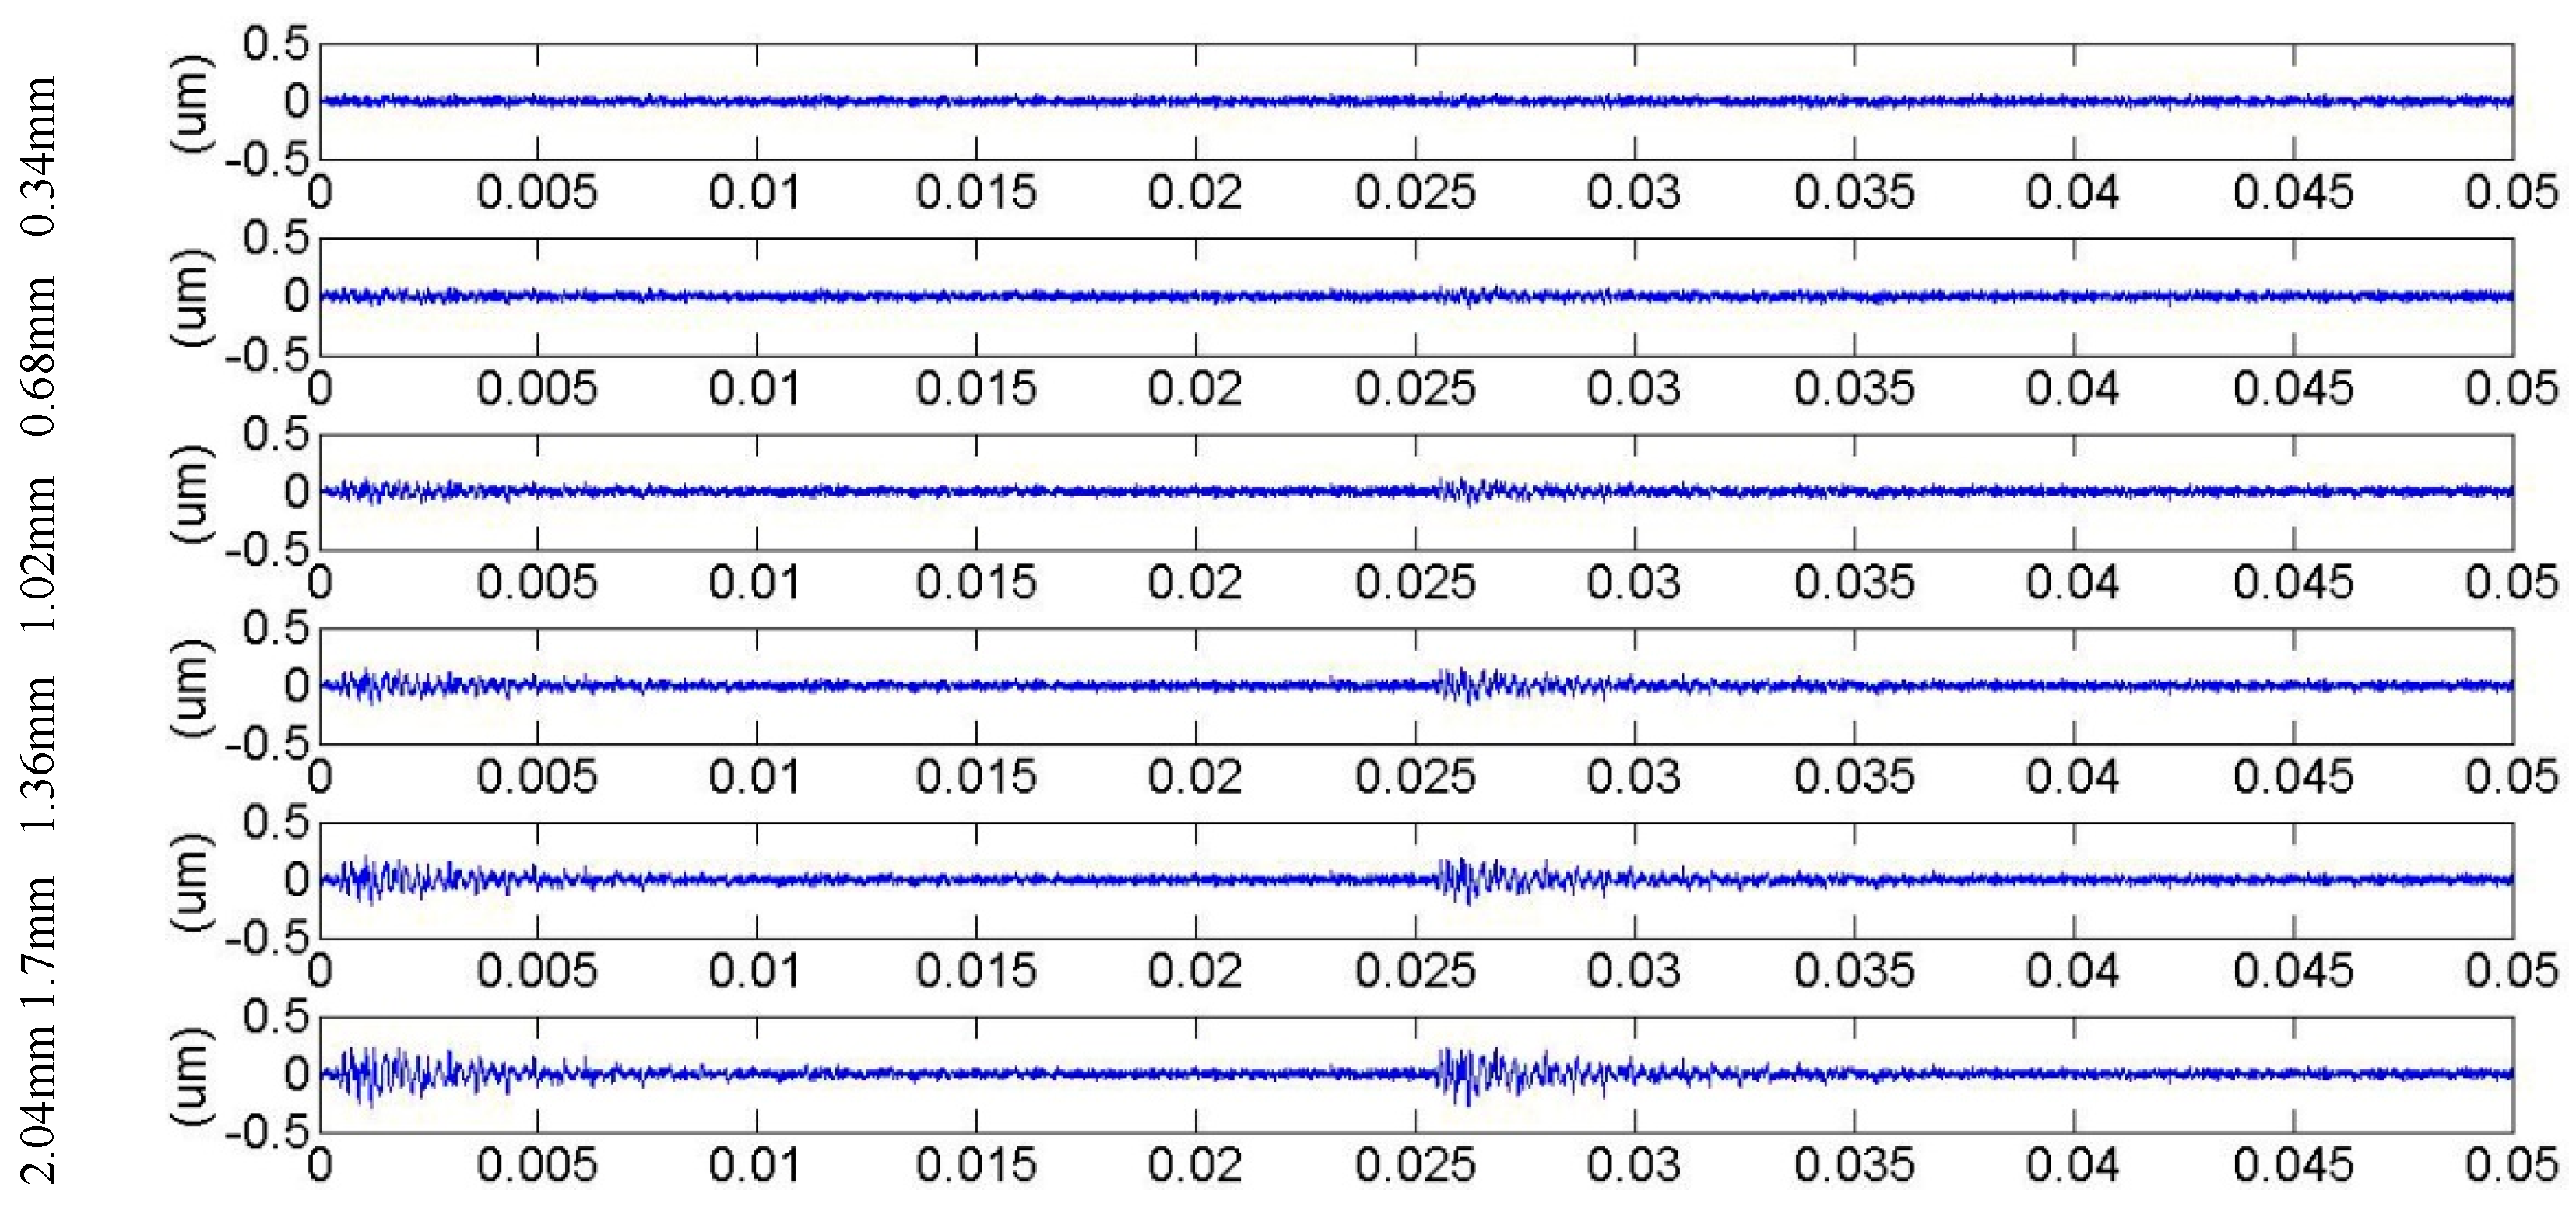
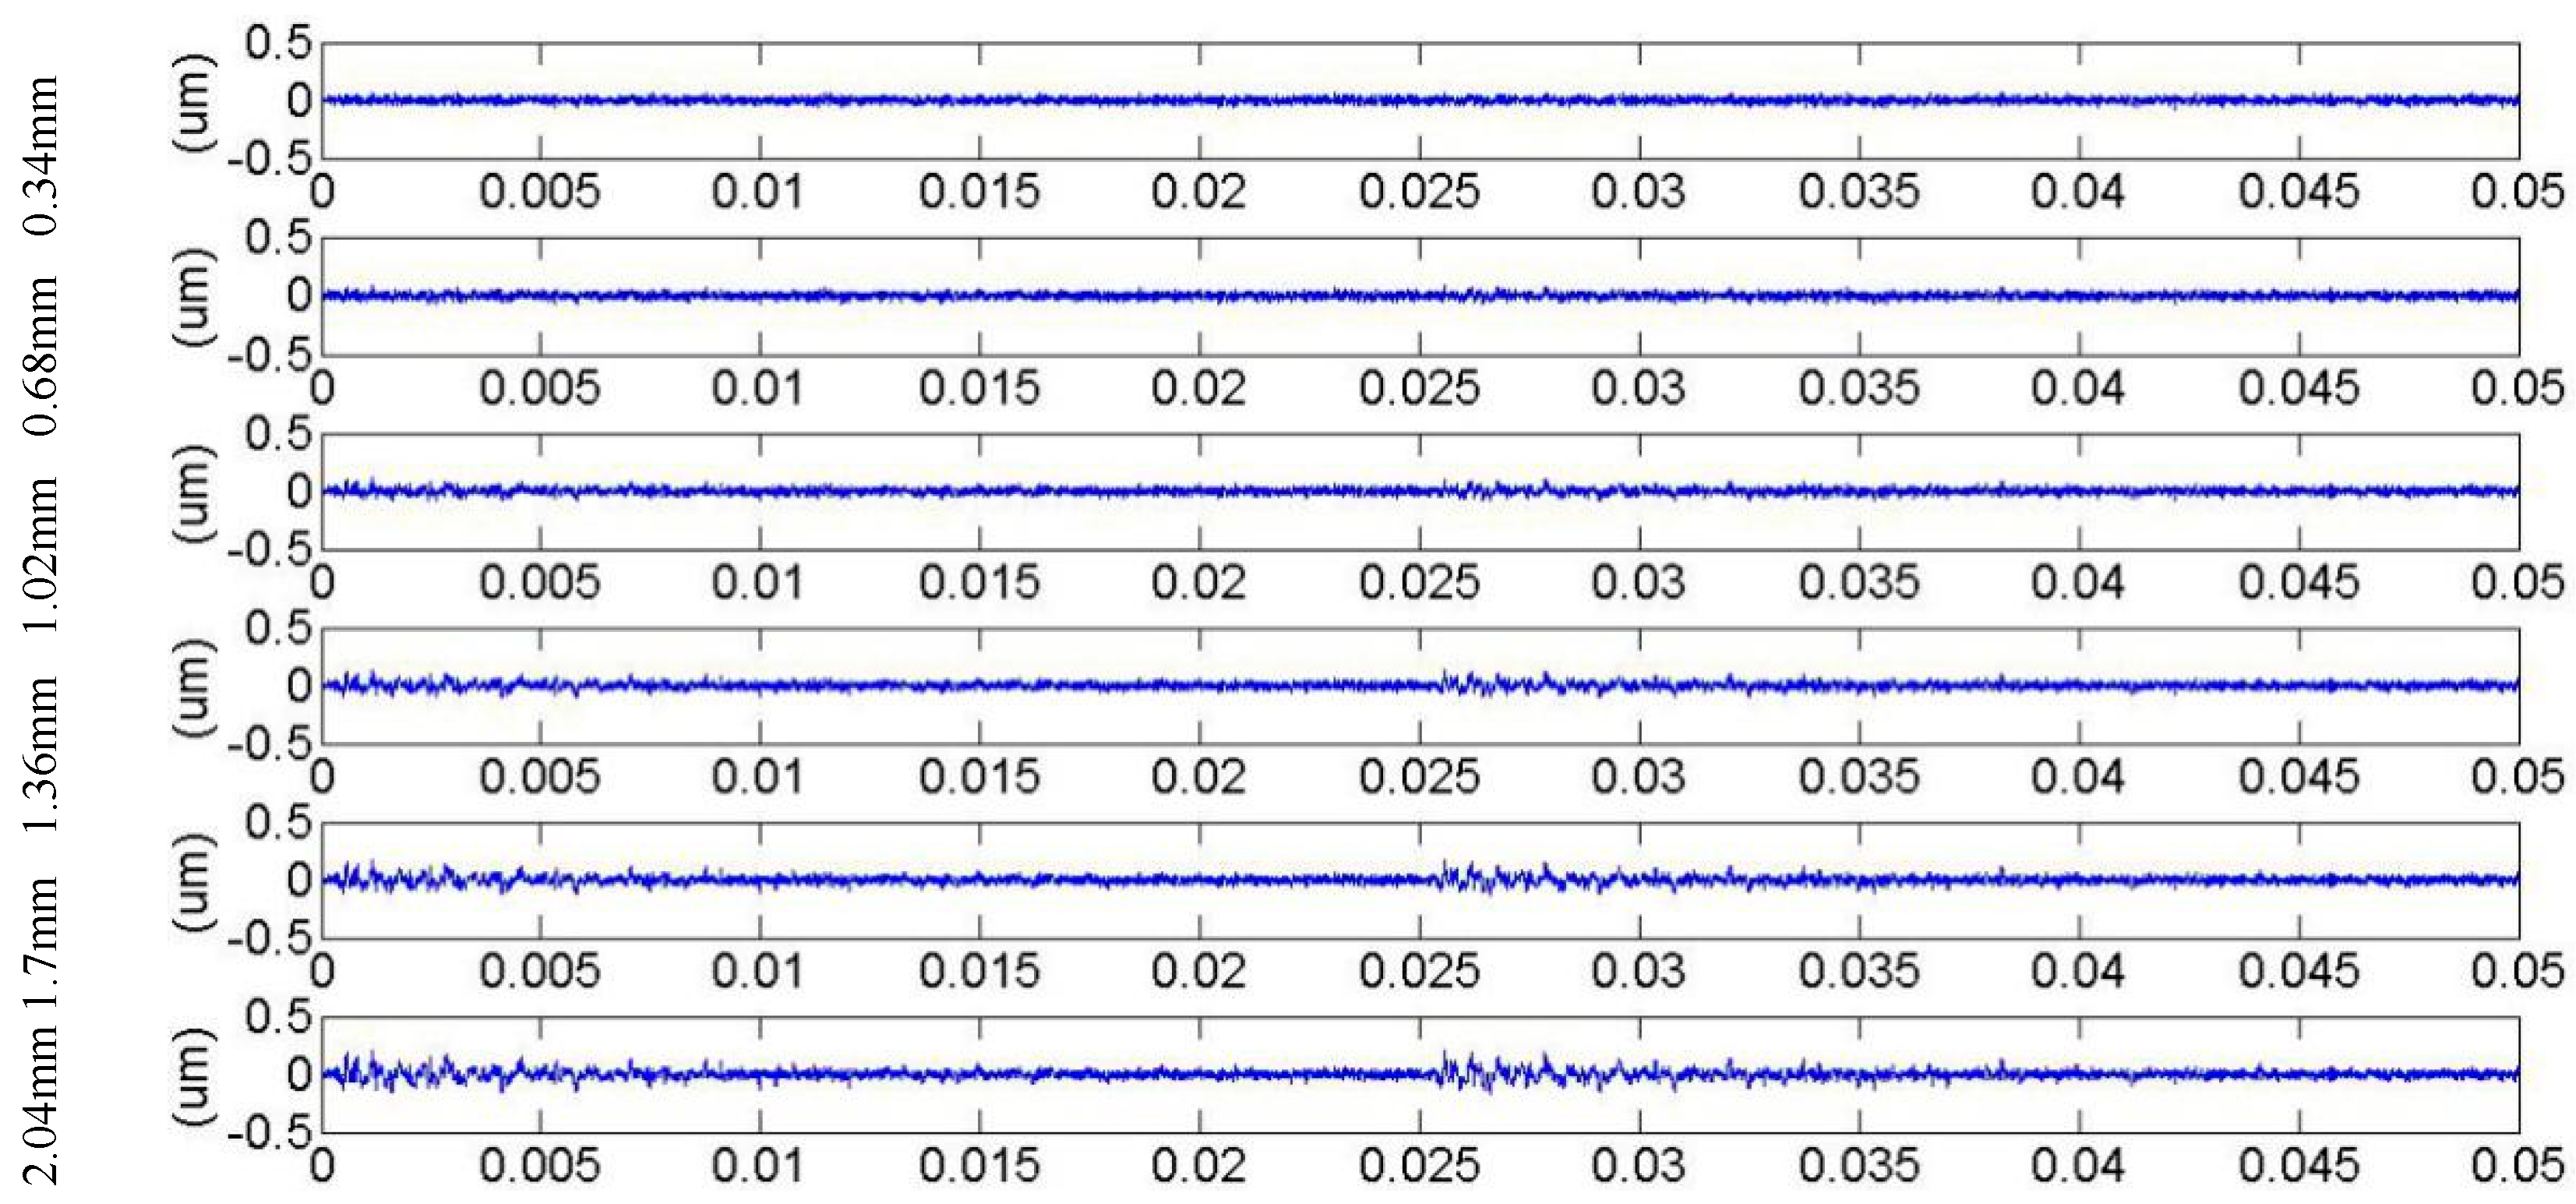
3.3. Meshing Stiffness and Vibration Response for Cracked Gears in Different Tooth Numbers
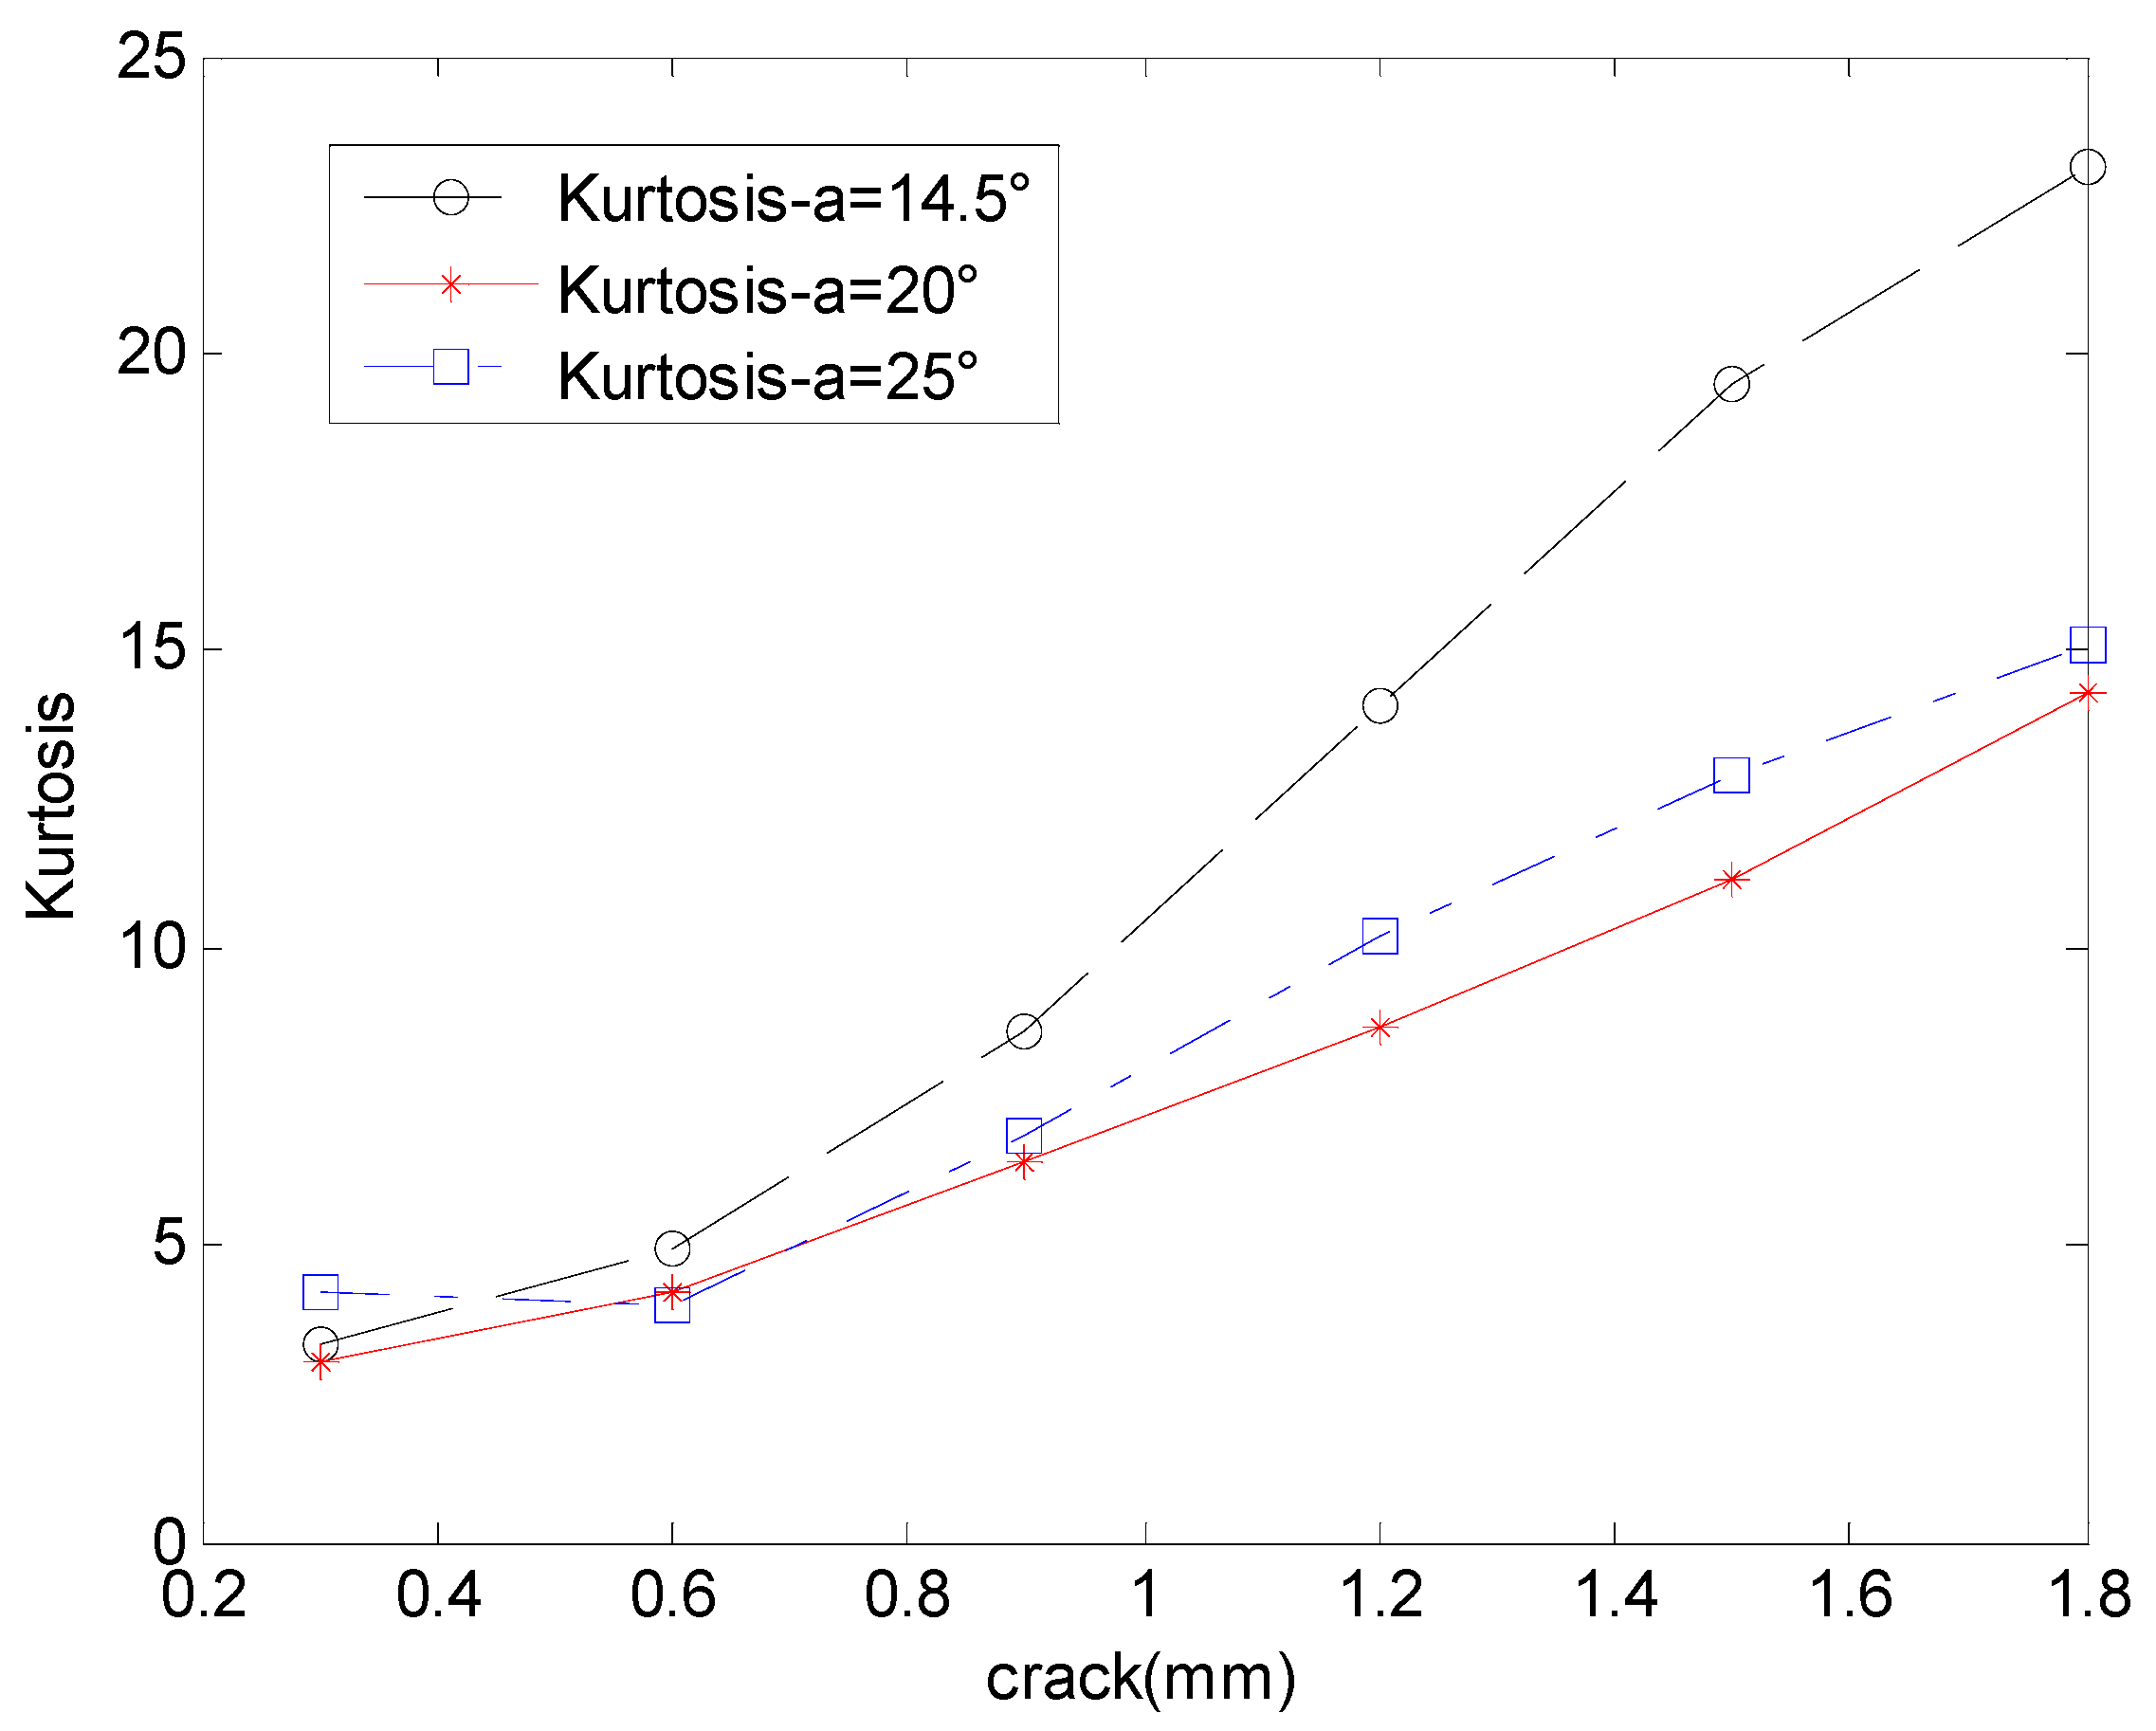
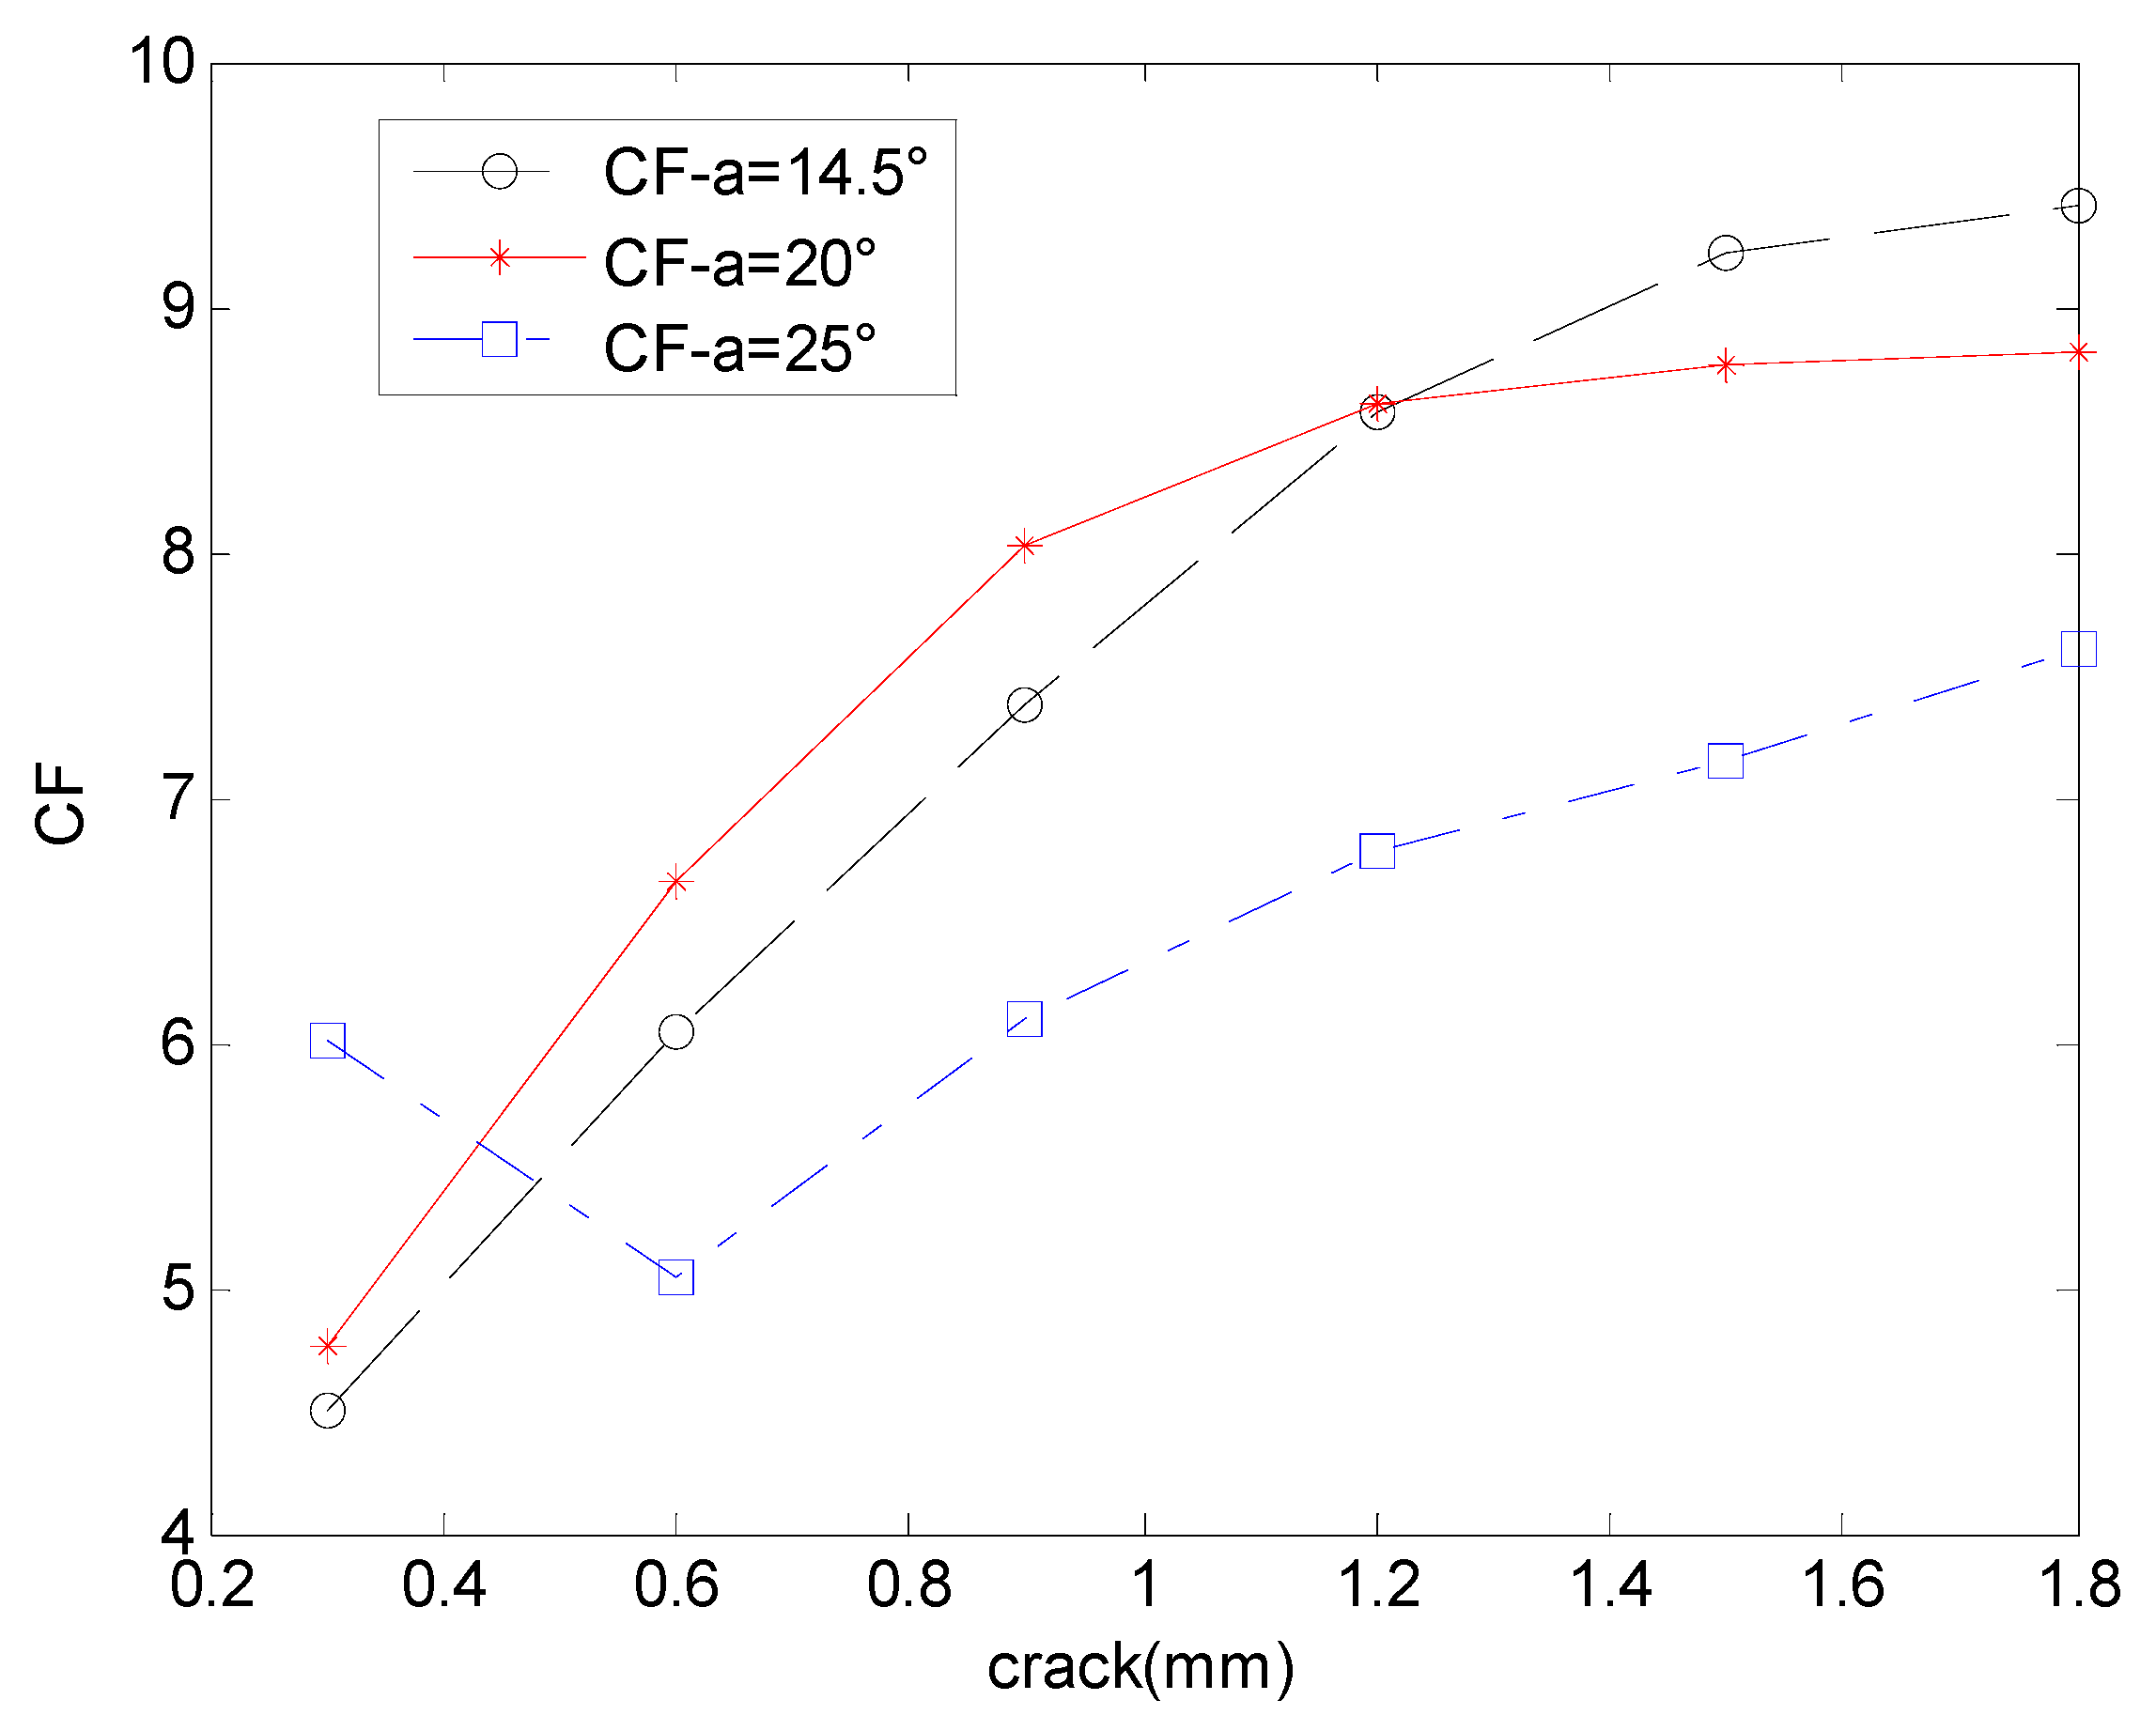
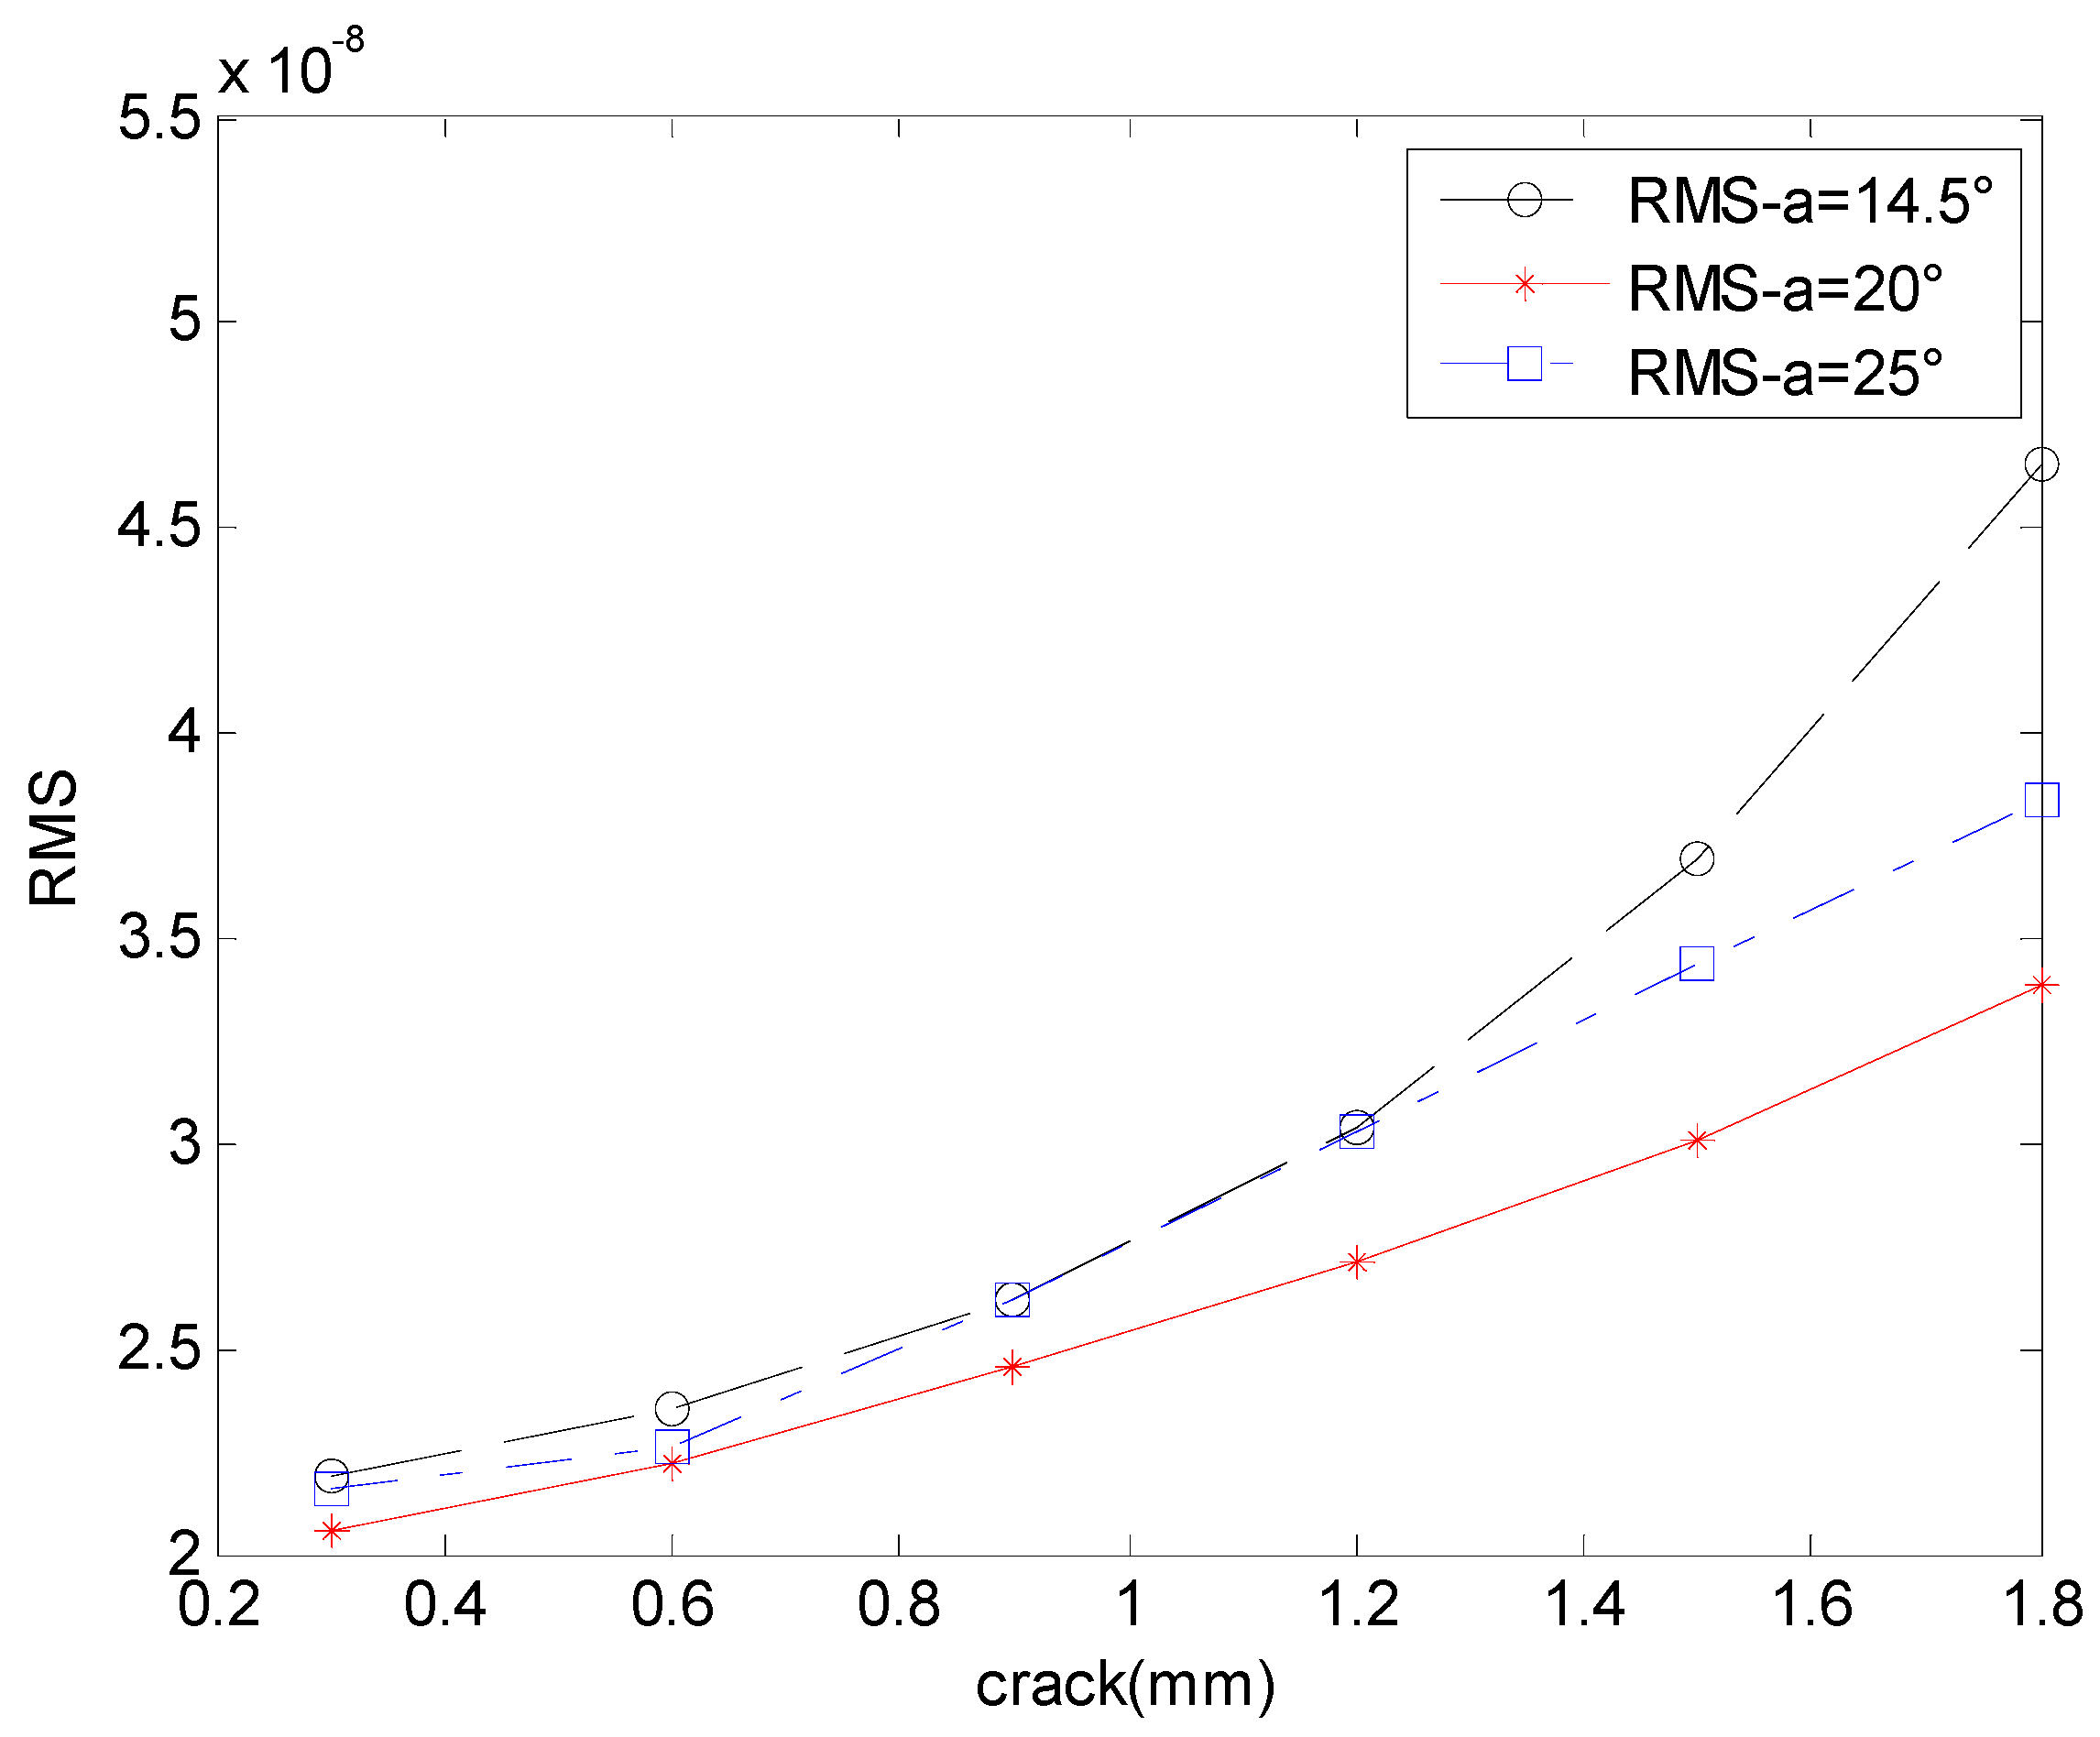
4. Discussion
5. Conclusions
Author Contributions
Funding
Acknowledgments
Conflicts of Interest
References
- Song, L.; Wang, H.; Chen, P. Vibration-Based Intelligent Fault Diagnosis for Roller Bearings in Low-Speed Rotating Machinery. IEEE Trans. Instrum. Meas. 2018, 67, 1887–1899. [Google Scholar] [CrossRef]
- Li, K.; Su, L.; Wu, J.J.; Wang, H.Q. A rolling bearing fault diagnosis method based on variational mode decomposition and an improved kernel extreme learning machine. Appl. Sci. 2017, 7, 1004. [Google Scholar] [CrossRef]
- Wang, H.Q.; Li, S.; Song, L.Y.; Cui, L. A novel convolutional neural network based fault recognition method via image fusion of multi-vibration-signals. Comput. Ind. 2019, 105, 182–190. [Google Scholar] [CrossRef]
- Cui, L.; Wang, X.; Wang, H.; Wu, N. Improved Fault Size Estimation Method for Rolling Element Bearings Based on Concatenation Dictionary. IEEE Access 2019, 7, 22710–22718. [Google Scholar] [CrossRef]
- Wang, H.Q.; Ren, B.Y.; Song, L.Y. A Novel Weighted Sparse Representation Classification Strategy based on Dictionary Learning for Rotating Machinery. IEEE Trans. Instrum. Meas. 2019. [Google Scholar] [CrossRef]
- Cui, L.L.; Wang, J.; Lee, S. Matching Pursuit of an Adaptive Impulse Dictionary for Bearing Fault Diagnosis. J. Sound Vib. 2014, 333, 2840–2862. [Google Scholar] [CrossRef]
- Zhang, J.; Esat, I.; Shi, Y. Load analysis with varying mesh stiffness. Comput. Struct. 1999, 70, 273–280. [Google Scholar] [CrossRef]
- Howard, I.; Jia, S.; Wang, J. The dynamic modelling of a Spur GEAR in mesh including friction and a crack. Mech. Syst. Signal Process. 2001, 15, 831–853. [Google Scholar] [CrossRef]
- Mohammed, O.D.; Rantatalo, M.; Aidanpää, J.-O. Improving mesh stiffness calculation of cracked gears for the purpose of vibration-based fault analysis. Eng. Fail. Anal. 2013, 34, 235–251. [Google Scholar] [CrossRef]
- Pandya, Y.; Parey, A. Experimental investigation of spur gear tooth mesh stiffness in the presence of crack using photoelasticity technique. Eng. Fail. Anal. 2013, 34, 488–500. [Google Scholar] [CrossRef]
- Chaari, F.; Baccar, W.; Abbes, M.S.; Haddar, M. Effect of spalling or tooth breakage on gearmesh stiffness and dynamic response of a one-stage spur gear transmission. Eur. J. Mech. A/Solids 2008, 27, 691–705. [Google Scholar] [CrossRef]
- Cui, L.; Wang, X.; Xu, Y.; Jiang, H.; Zhou, J. A novel Switching Unscented Kalman Filter method for remaining useful life prediction of rolling bearing. Measurement 2019, 135, 678–684. [Google Scholar] [CrossRef]
- Japanese Society of Mechanical Engineers. Gear Strength Design Data; China Machine Press: Beijing, China, 1984. [Google Scholar]
- Yang, D.C.H.; Lin, J.Y. Hertzian Damping, Tooth Friction and Bending Elasticity in Gear Impact Dynamics. J. Mech. Transm. Autom. Des. 1987, 109, 189–196. [Google Scholar] [CrossRef]
- Tian, X. Dynamic Simulation for System Response of Gearbox Including Localized Gear Faults. Master’s Thesis, University of Alberta, Edmonton, AB, Canada, 2004. [Google Scholar]
- Sainsot, P.; Velex, P.; Duverger, O. Contribution of Gear Body to Tooth Deflections—A New Bidimensional Analytical Formula. J. Mech. Des. 2004, 126, 748–752. [Google Scholar] [CrossRef]
- Chen, Z.; Shao, Y. Dynamic simulation of spur gear with tooth root crack propagating along tooth width and crack depth. Eng. Fail. Anal. 2011, 18, 2149–2164. [Google Scholar] [CrossRef]
- Cui, L.; Li, B.; Ma, J.; Jin, Z. Quantitative trend fault diagnosis of a rolling bearing based on Sparsogram and Lempel-Ziv. Measurement 2018, 128, 410–418. [Google Scholar] [CrossRef]
- Wan, Z.; Cao, H.; Zi, Y.; He, W.; He, Z. An improved time-varying mesh stiffness algorithm and dynamic modeling of gear-rotor system with tooth root crack. Eng. Fail. Anal. 2014, 42, 157–177. [Google Scholar] [CrossRef]
- Song, L.; Wang, H.; Chen, P. Step-by-Step Fuzzy Diagnosis Method for Equipment Based on Symptom Extraction and Trivalent Logic Fuzzy Diagnosis Theory. IEEE Trans. Syst. 2018, 26, 3467–3478. [Google Scholar] [CrossRef]
- Ma, H.; Song, R.; Pang, X.; Wen, B. Fault Feature Analysis of a Cracked Gear Coupled Rotor System. Math. Probl. Eng. 2014, 2014, 1–22. [Google Scholar] [CrossRef]
- Ma, H.; Song, R.; Pang, X.; Wen, B. Time-varying mesh stiffness calculation of cracked spur gears. Eng. Fail. Anal. 2014, 44, 179–194. [Google Scholar] [CrossRef]
- Cui, L.L.; Huang, J.F.; Zhang, F.B. HVSRMS localization formula and localization law: Localization diagnosis of a ball bearing outer ring fault. Mech. Syst. Signal Process. 2019, 120, 608–629. [Google Scholar] [CrossRef]
- Cui, L.L.; Yao, T.C.; Zhang, Y. Application of pattern recognition in gear faults based on the matching pursuit of a characteristic waveform. Measurement 2017, 104, 212–222. [Google Scholar] [CrossRef]
- Compea’n, F.I.; Olvera, D.; Campa, F.J. Characterization and stability analysis of a multivariable milling tool by theenhanced multistage homotopy perturbation method. Int. J. Mach. Tools Manuf. 2012, 57, 27–33. [Google Scholar] [CrossRef]
- Özgüven, H.N.; Houser, D. Mathematical models used in gear dynamics—A review. J. Sound Vib. 1988, 121, 383–411. [Google Scholar] [CrossRef]
- Velex, P.; Berthe, D. Dynamic tool load on gear tranis. In Proceedings of the 5th American Society of Mechanical Engineers International Conference on Gearing and Power Transmission, Herston, TX, USA, 22–25 January 1989; pp. 1447–1454. [Google Scholar]
- Theodossiades, S.; Natsiavas, S. Non-linear dynamics of gear-pair systems with periodic stiffness and backlash. J. Sound Vib. 2000, 229, 287–310. [Google Scholar] [CrossRef]
- Chen, Z.; Shao, Y. Mesh stiffness calculation of a spur gear pair with tooth profile modification and tooth root crack. Mech. Mach. Theory 2013, 62, 63–74. [Google Scholar] [CrossRef]
- Cui, L.; Huang, J.; Zhai, H.; Zhang, F. Research on the meshing stiffness and vibration response of fault gears under an angle-changing crack based on the universal equation of gear profile. Mech. Mach. Theory 2016, 105, 554–567. [Google Scholar] [CrossRef]
- Mohammed, O.D.; Rantatalo, M.; Aidanpää, J.-O. Dynamic modelling of a one-stage spur gear system and vibration-based tooth crack detection analysis. Mech. Syst. Signal Process. 2015, 54, 293–305. [Google Scholar] [CrossRef]
- Wang, H.Q.; Wang, P.X.; Song, L.Y.; Ren, B.Y. A Novel Feature Enhancement Method based on Improved Constraint Model of Online Dictionary Learning. IEEE Access 2019, 7, 17599–17607. [Google Scholar] [CrossRef]
- Cui, L.; Zhai, H.; Zhang, F. Research on the meshing stiffness and vibration response of cracked gears based on the universal equation of gear profile. Mech. Mach. Theory 2015, 94, 80–95. [Google Scholar] [CrossRef]


| Parameter | The Main Meaning |
|---|---|
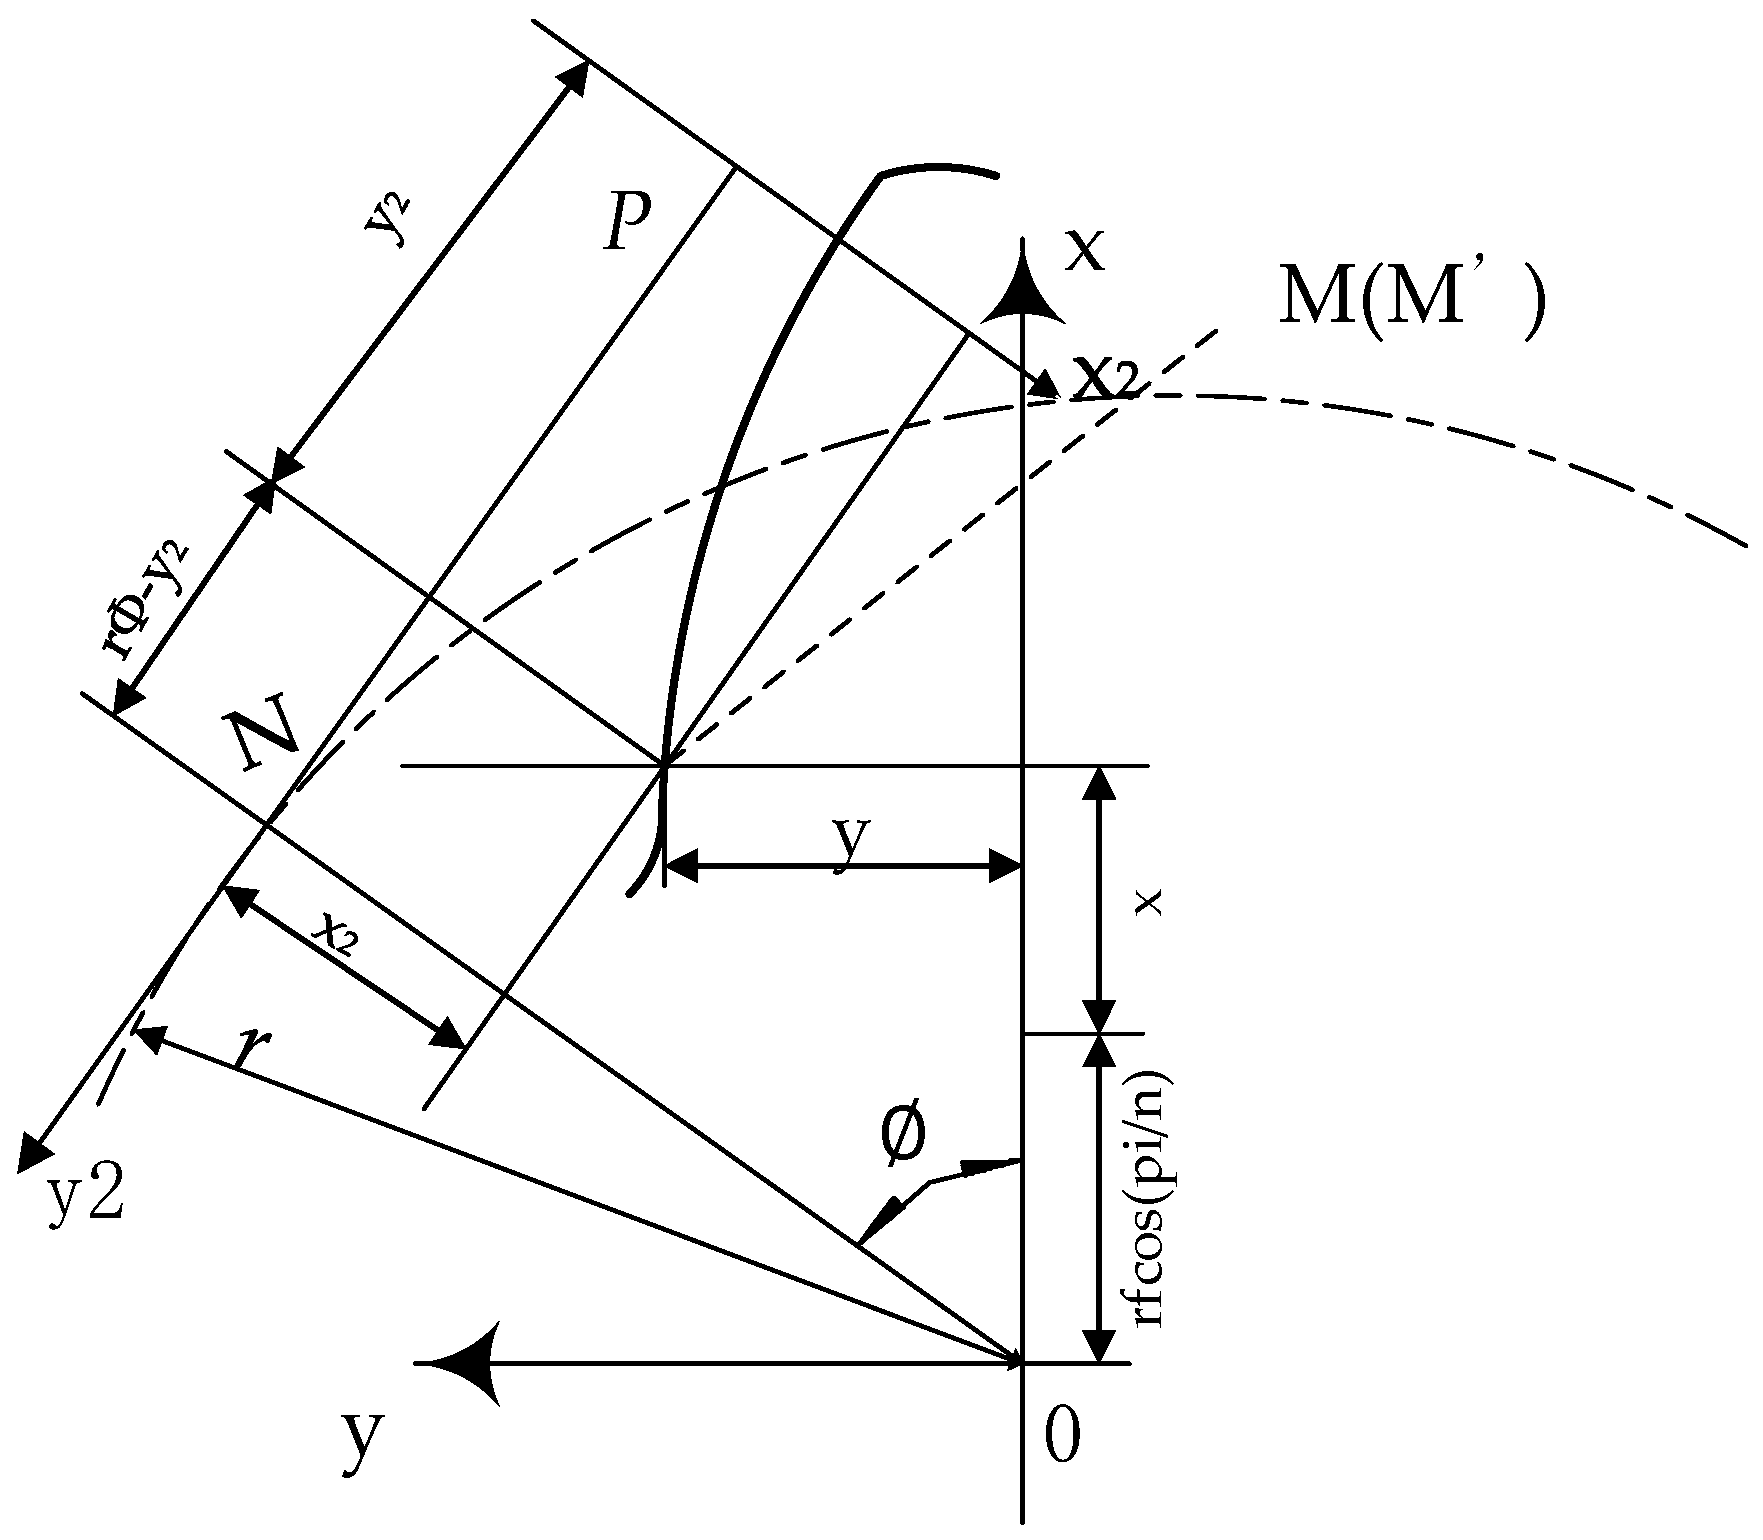
| r | the radius of the reference circle |
| φ | the angle between the center line of the tooth and NO |
| x2 | the abscissa that M projected onto in frame x2Py2 |
| y2 | the ordinate that M projected onto in frame x2Py2 |
| rf | root circle radius of gear |
| N | number of teeth of pinion |
| xc | the abscissa of the hobbing cutter point |
| ρ0 | the radius of the hobbing cutter point |
| γ | the angle between the normal of the tip outline passing through the center of the tip and Px2 |
| yw | half the width of the alveoli |
| α1 | the pressure angle |
| Parameter | The Main Meaning |
|---|---|
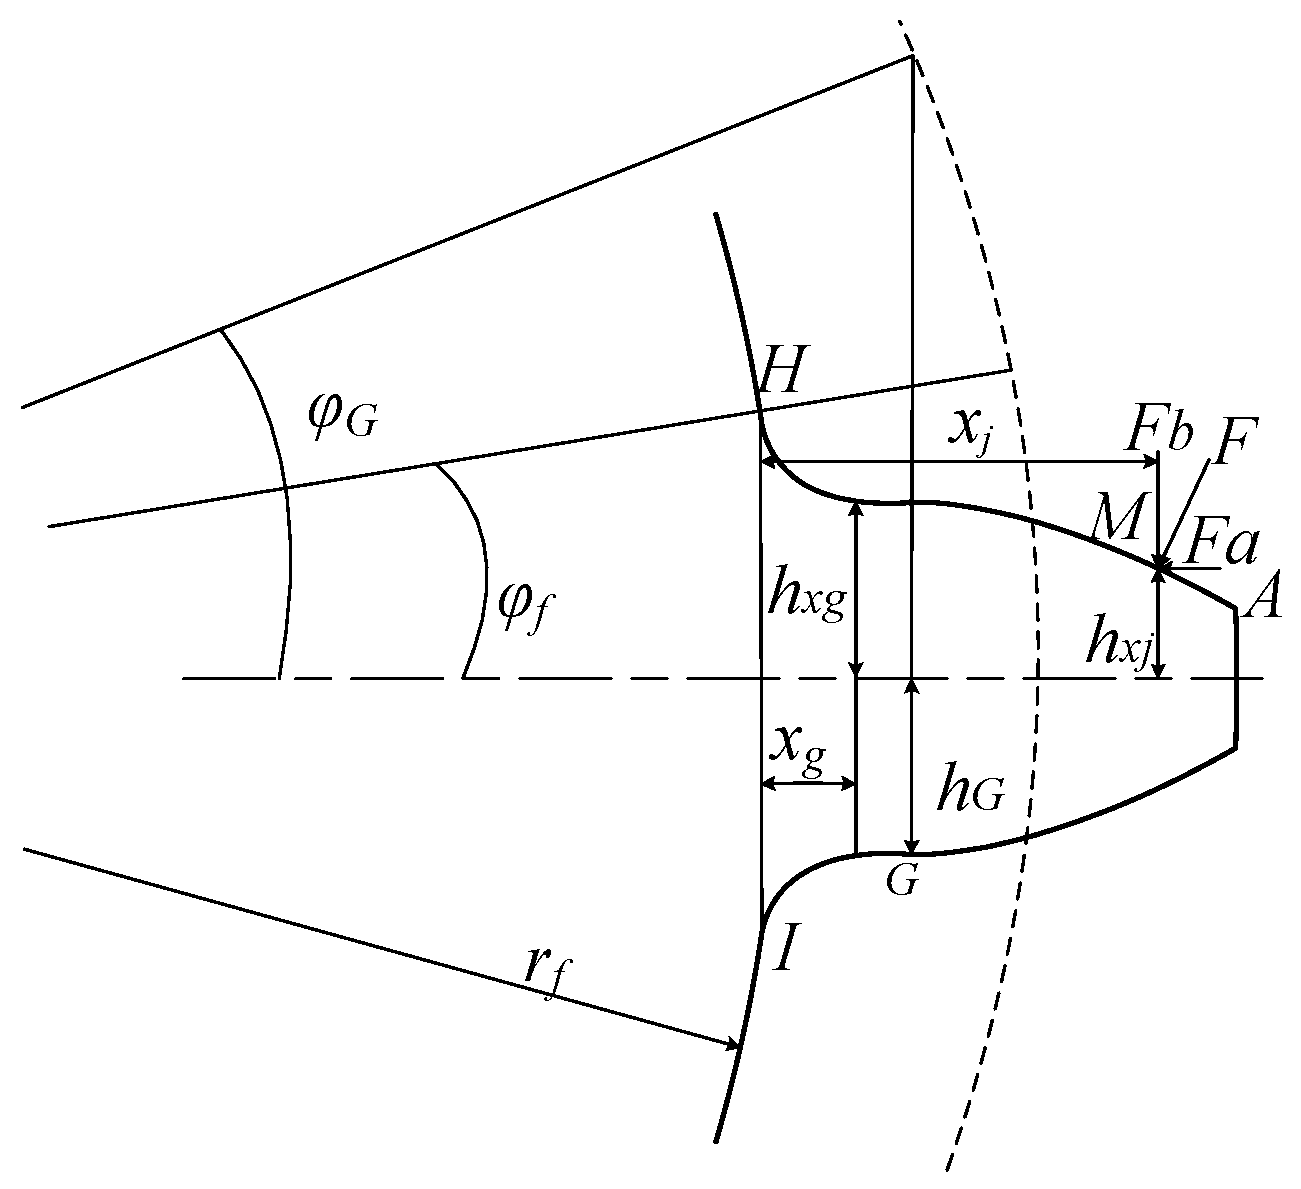
| F | the meshing force on the tooth curve |
| Fb | the y-direction component of meshing F |
| Fa | the x-direction component of meshing F |
| Ixg | rotational inertia of gear on the excessive part curve |
| dG | distance between the ending point on the excessive curve and tooth root |
| hG | distance between the end point of excessive curve and tooth midline |
| hxg | distance between the tooth midline and the contact point on the excessive curve |
| xg | the distance between the tooth root and the points on the excessive curve in x-direction |
| φf | rolling angle at the tooth root |
| φG | the rolling angle corresponding to the excessive curve ending point |
| Parameter | Value | Parameter | Value |
|---|---|---|---|
| Young′s modulus | Poisson’s ratio | ||
| Tooth number | Pressure angle | ||
| Module | Input torque | ||
| Output torque | Tooth width | ||
| Mass of pinion | Mass of gear | ||
| Contact ratio | Rotary inertia of driving gear | ||
| Rotary inertia of driven gear |
| Parameter | Value |
|---|---|
| Meshing frequency | |
| Torsional stiffness of bearings | |
| Damping coefficient of bearings | |
| Damping coefficient of meshing teeth | |
| Coefficient of friction |
© 2019 by the authors. Licensee MDPI, Basel, Switzerland. This article is an open access article distributed under the terms and conditions of the Creative Commons Attribution (CC BY) license (http://creativecommons.org/licenses/by/4.0/).
Share and Cite
Ma, J.; Liu, T.; Zha, C.; Song, L. Simulation Research on the Time-Varying Meshing Stiffness and Vibration Response of Micro-Cracks in Gears under Variable Tooth Shape Parameters. Appl. Sci. 2019, 9, 1512. https://doi.org/10.3390/app9071512
Ma J, Liu T, Zha C, Song L. Simulation Research on the Time-Varying Meshing Stiffness and Vibration Response of Micro-Cracks in Gears under Variable Tooth Shape Parameters. Applied Sciences. 2019; 9(7):1512. https://doi.org/10.3390/app9071512
Chicago/Turabian StyleMa, Jianfeng, Tongtong Liu, Chunqing Zha, and Liuyang Song. 2019. "Simulation Research on the Time-Varying Meshing Stiffness and Vibration Response of Micro-Cracks in Gears under Variable Tooth Shape Parameters" Applied Sciences 9, no. 7: 1512. https://doi.org/10.3390/app9071512
APA StyleMa, J., Liu, T., Zha, C., & Song, L. (2019). Simulation Research on the Time-Varying Meshing Stiffness and Vibration Response of Micro-Cracks in Gears under Variable Tooth Shape Parameters. Applied Sciences, 9(7), 1512. https://doi.org/10.3390/app9071512