Article

Computational Study of Wet Steam Flow to Optimize Steam Ejector Efficiency for Potential Fire Suppression Application

1
School of Mechanical and Manufacturing Engineering, University of New South Wales, Sydney, NSW 2052, Australia
2
Department of Chemical and Materials Engineering, Hefei University, Hefei 230601, China
3
Australian Nuclear Science and Technology Organization (ANSTO), Locked Bag 2001, Kirrawee DC, NSW 2232, Australia
*
Author to whom correspondence should be addressed.
Appl. Sci. 2019, 9(7), 1486; https://doi.org/10.3390/app9071486
Submission received: 2 March 2019 / Revised: 3 April 2019 / Accepted: 4 April 2019 / Published: 9 April 2019
(This article belongs to the Special Issue Progress in Combustion Diagnostics, Science and Technology)

Abstract

:
The steam ejector is a core component of an ejector-based refrigeration system. Additionally, steam ejectors can also be potentially applied for a fire suppression system by using pressurized steam droplets to rapidly quench and extinguish the fire. The use of steam will significantly reduce the amount of water consumption and pipe flow rate compared to conventional sprinklers. However, the efficiency of the steam ejector nozzle is one of major factors that can influence the extinguishing mechanisms and the performance of pressurized steam for fire suppression. In this article, to formulate an assessment tool for studying the ideal entrainment ratio and initial flow wetness, a wet steam model has been proposed to enhance our understanding of the condensation and evaporation effects of water droplets from a numerical perspective. The entire steam-ejector system including the nozzle, mixing chamber, throat and diffuser were modeled to study the profiles in axial pressure and temperature across the system, and were compared with self-measured experimental data. In addition, the flow and heat transfer interactions between the fluid mixture and nucleating water droplets were numerically examined by comparing initial conditions with different liquid fractions, as opposed to the ideal gas assumption. With the application of the proposed wet-steam model, the numerical model showed vast improvement in the axial pressure distribution over the ideal gas model. Through numerical conditions, it was found that reducing the wetness of the secondary inlet flow will potentially optimize the system performance with a significant increase of the entrainment ratio from 0.38 to 0.47 (i.e., improvement of around 23%).

1. Introduction

A steam ejector is a fluid phase-change device, which can utilize low-grade energy, such as industrial waste heat, to generate vacuum environments. The first steam ejector was designed by Flugel in 1939 [1]. Ever since it has been developed, the steam ejector has been widely applied in multiple industrial sectors, including refrigeration, chemistry, metallurgy, petroleum, and food processing [2,3,4,5]. Steam ejectors can also be applied to a fire suppression system in place of water mist to provide greater displacement of oxygen from a fire plume due to the evaporation of water droplets. Based on nozzles and water mist, numerous studies on different characteristics of the system such as pressure, injection rate, cone angles, and droplet dimensions were conducted for different working conditions and were performed both experimentally and numerically in recent years [6,7,8].
A steam ejector utilizes high-pressure steam to pump low-pressure fluids. It has many advantages over other commonly used devices, such as no moving parts, less-required maintenance and low cost in manufacturing and energy consumption. Although the structure of a steam ejector is relatively simple, the flow behavior within the enclosure can be extremely complex, involving phenomena such as transonic flow, shockwaves, phase change etc.
The configuration of a typical steam ejector [9] along with the corresponding pressure changes and velocity distribution is shown in Figure 1. In general, a steam ejector consists of four main components: (i) primary nozzle, (ii) mixing chamber, (iii) throat, and (iv) subsonic diffuser. The steam ejector work cycle starts with the acceleration of highly pressurized primary fluid to supersonic after passing through the nozzle. Approaching the end of the nozzle, a relative low-pressure region is generated due to the high velocity, which entrains the secondary fluid stream from the evaporator into the mixing chamber. The velocity of the secondary fluid increases within the mixing chamber due to the energy and momentum exchange between the two fluid streams. Subsequently, the speed of the mixed flow is reduced to subsonic range, due to the normal shock wave occurring in the throat. The mixed flow is further compressed after exiting via the subsonic diffuser. This entire entrainment process is very complex, and analysis requires a deep understanding of the underlying physical fluid behaviors and the change in water droplets within the steam ejector. One of the key parameters to assess the performance of the steam ejector is the entrainment ratio or mass flow ratio [10], which is defined as:
E n t r a i n m e n t R a t i o = M a s s   f l o w   r a t e   o f   p r i m a r y   f l o w M a s s   f l o w   r a t e   o f   s e c o n d a r y   f l o w
As a characteristic index of efficiency, a stream ejector with a higher entrainment ratio is usually preferable. In addition, the performance of the steam ejector can also be described by the characteristic curve (see Figure 1) and herein the critical back pressure plays an important role. According to the critical back pressure, the steam ejector entrainment ratio can be separated into three modes [11]: (i) critical mode (double-choking), (ii) subcritical mode (single-choking) and (iii) back-flow mode (malfunction) as indicated in Figure 2. In the double-choking mode, the entrainment ratio of the stream ejector remains as a constant with the increase of back pressure up to a critical point. Afterwards, the entrainment ratio dramatically decreases to zero, and the ejector loses its function. Previous works have been carried out using both experimental and numerical approaches to evaluate the effect of key parameters on the performance of a steam ejector. These studies include the optimization of key components such as the mixing chamber, nozzle, throat etc. as well as the assessment of the system under various operating conditions have also been performed. For instance, Chunnanond et al. [9] conducted an experimental investigation on the pressure profile along the ejector axial direction and concluded that the performance of the ejector was predominately governed by the amount of secondary fluid as well as the momentum of the mixed stream. Sankarlal et al. [12] studied the effects of non-dimensional parameters including the compression and expansion ratios, on the system performance. The results showed that the coefficient of performance is proportional to the expansion ratio and is inversely proportional to the compression ratio. Aidoun et al. [13] and Wang et al. [14] applied various boundary conditions for inlet flows and investigated their effect on the entrainment ratio. The results suggested that, with the implementation of superheat inlet flow, improvement of entrainment ratio could be achieved, whereas the pressure at the exit remains unchanged. The performance of a steam ejector can be improved by optimizing the geometric configuration of the key components. Varga et al. [15,16,17] and Ma et al. [18] developed the relationship between the entrainment ratio and the area ratio. The area ratio is a critical non-dimensional factor that has a significant impact on the performance of the system which is defined as the ratio between the cross-section area of primary nozzle and constant area section. Other experimental [9] and numerical studies [19,20,21] have also been conducted on the nozzle exit position. It was reported that positioning the nozzle exit upstream of the mixing chamber entrance gave better performance than pushing it into the mixing chamber. Furthermore, Sun et al. [22] and Cizungu et al. [23] investigated the correlation between the primary nozzle diameter and system performance. Chaiwongsa et al. [24] and Ruangtrakoon et al. [25,26] performed parametric studies on the influence of different configurations of the primary nozzle, and suggested that the expansion angle of the nozzle is also critical to the performance of the steam ejector. Most experimental studies focused on the optimization of geometric parameters and operating conditions as well as the explanation of experimental phenomena. The running cost for the experiment is also too costly to generate a lot of data for comparison. However, the numerical simulation can perform a comprehensive analysis for the flow behavior based on the thermal dynamics and fluid dynamics with the advantages of reducing cost and increasing the efficiency.
Computational fluid dynamics (CFD) simulation has become an effective tool to analyze the understanding of complex flow behavior due to the rapid advancement of numerical methods and computational power. Previous numerical studies demonstrated that, with the cautiously selected sub-molecular modeling components, CFD simulation could provide detailed information about the flow field that often difficult to assess by experimental means such as gaining more detail about nucleating small particles in the main flow field [27,28]. During the past few decades, extensive numerical research works based on ideal gas assumption have been performed to analyze the flow field development of the steam ejector. However, the spontaneous condensation phenomena occurring in the nozzle during operation [29] have not been captured under the ideal gas assumption. When the steam passes through the nozzle, the temperature of steam would be much lower than the stagnation temperature due to the inner energy partly transforming into kinetic energy caused by the occurrence of the condensation phenomena. Fluid thermodynamics characteristics of the inlet flows are described in Figure 3a. The state of primary fluid moves from the original state (point A) to point C, which is an isentropic expansion process. However, the real expansion process is line AC’, due to energy loss existing in the actual process. The secondary fluid started from Point B is mixed with the primary fluid along the isobar line CB and arrives in point M at the end of mixing process. Subsequently, as for the shock wave, the mixed flow reaches a subsonic condition (Point E) and it arrives in condition F after it eventually passes through the diffuser. The steam jet refrigeration cycle is applied in the ejector refrigeration system [30]. Figure 3b,d illustrates a typical one stage ejector refrigeration system, where the steam ejector is shown in Figure 3c. Based on this system, numerical studies with the consideration of spontaneous condensation of the steam ejector have also been performed to analyze the development of the primary fluid and the complicated phase change process. For example, Yang et al. [31] simulated the condensation process during the nozzle, and Mazzelli et al. [32] compared the CFD modeling with an experimental test-case for the condensation. The spontaneous condensation in the nozzle of the steam ejector was studied in recent decades [33,34,35]. Sharifi et al. [34] found that the steam condensation increases the flow Mach number and the ejector’s performance comparison with a dry gas. Wang et al. [33,35] investigated the influences of superheating operation of the primary fluid. It was concluded that 0 K–20 K superheating for the primary fluid has a positive impact on the entrainment ratio, while superheating over 20 K was meaningless and led to energy waste. Wang et al. [36] showed that the primary pseudo-shock flow gives a further downstream choking position and a higher secondary fluid flow velocity at the choking position with the wet steam model. Furthermore, Bakhtar et al. [37] applied a time-marching technique to obtain more accurate numerical predictions. This technique was proven to be effective and feasible for the two-dimensional flows of the nucleating and wet steam model in nozzles. Those studies, nevertheless, are limited to mainly focus on the individual parts of the system, i.e., the nozzle. Detailed analysis of the flow field development as well as the information about phase change within the entire steam ejector including all four major components, however, has so far not been performed. Furthermore, it is critical to have a clear study of the condensation effect inside the whole steam ejector, especially in the application of the wet steam model.
Considering the above-mentioned research gap, in this article, the working process of the entire steam ejector consisting of the nozzle, mixing chamber, throat and diffuser will be considered entirely utilizing CFD simulations. In essence, key objectives of this study can be summarized by the following statements:
  • The simulation will take advantage of a wet steam model to investigate the condensation effect on the flow behavior and steam ejector performance.
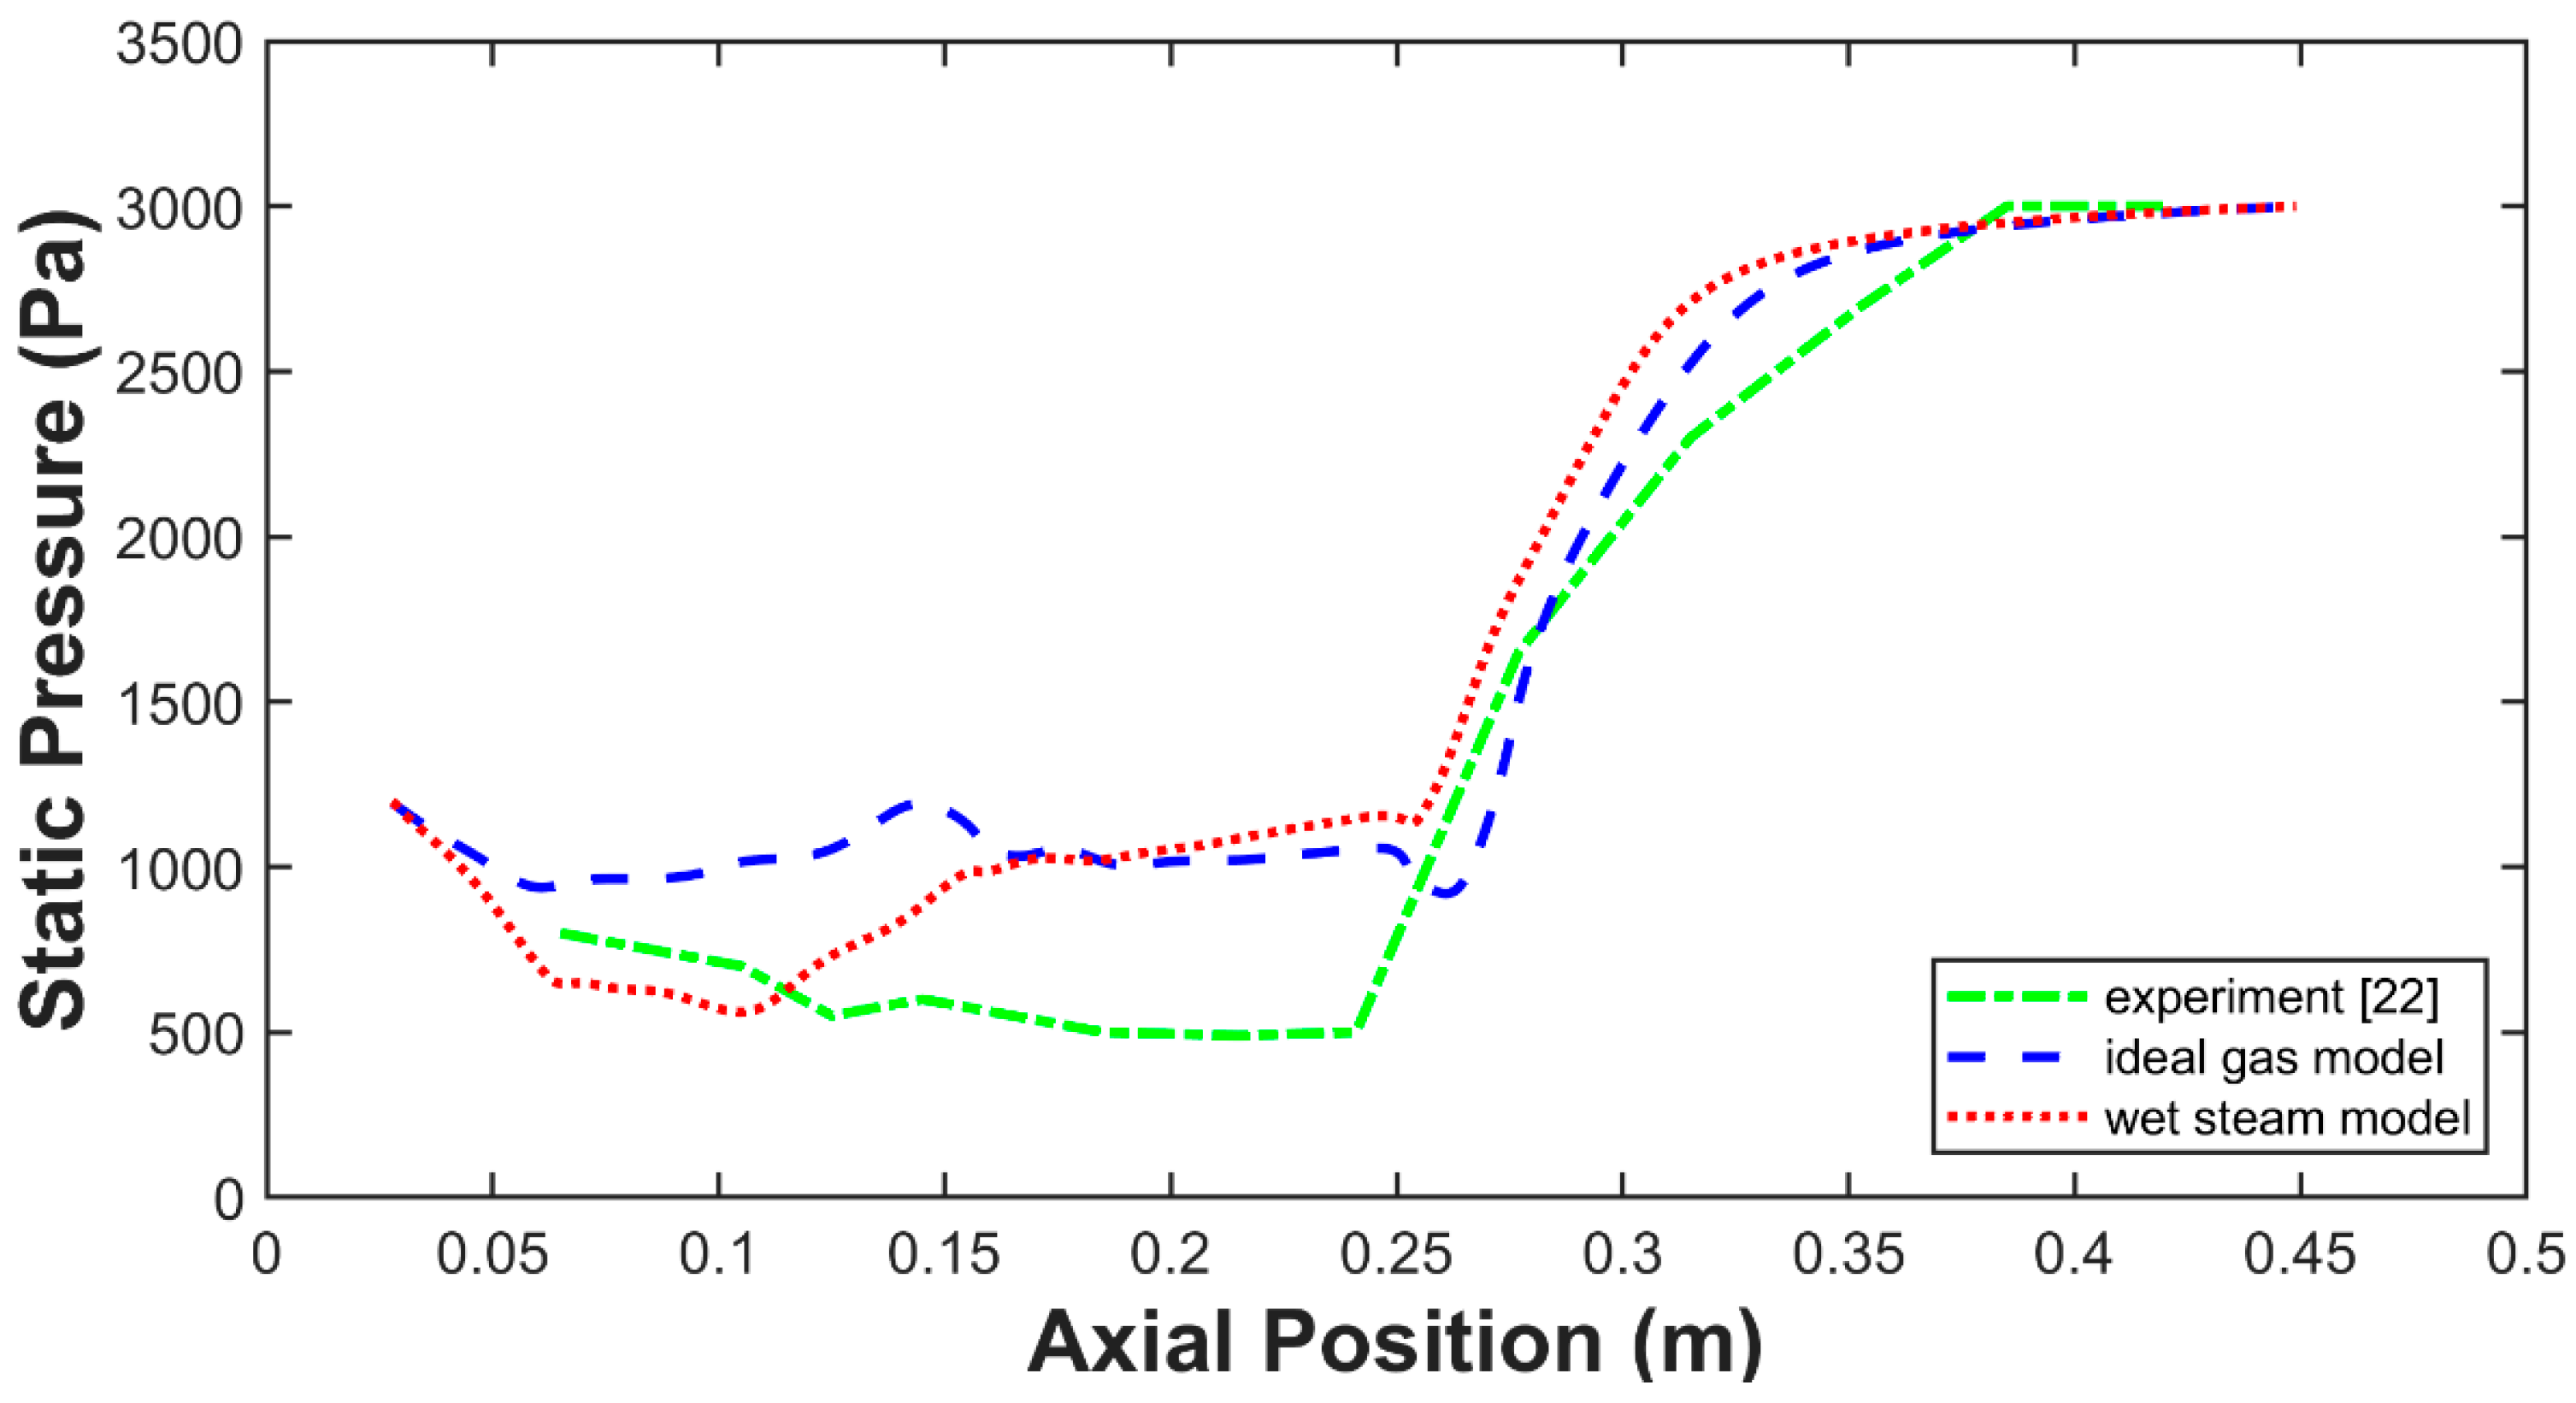
  • The numerical model will be validated against experimental data and the results will also be compared with the ideal gas model.
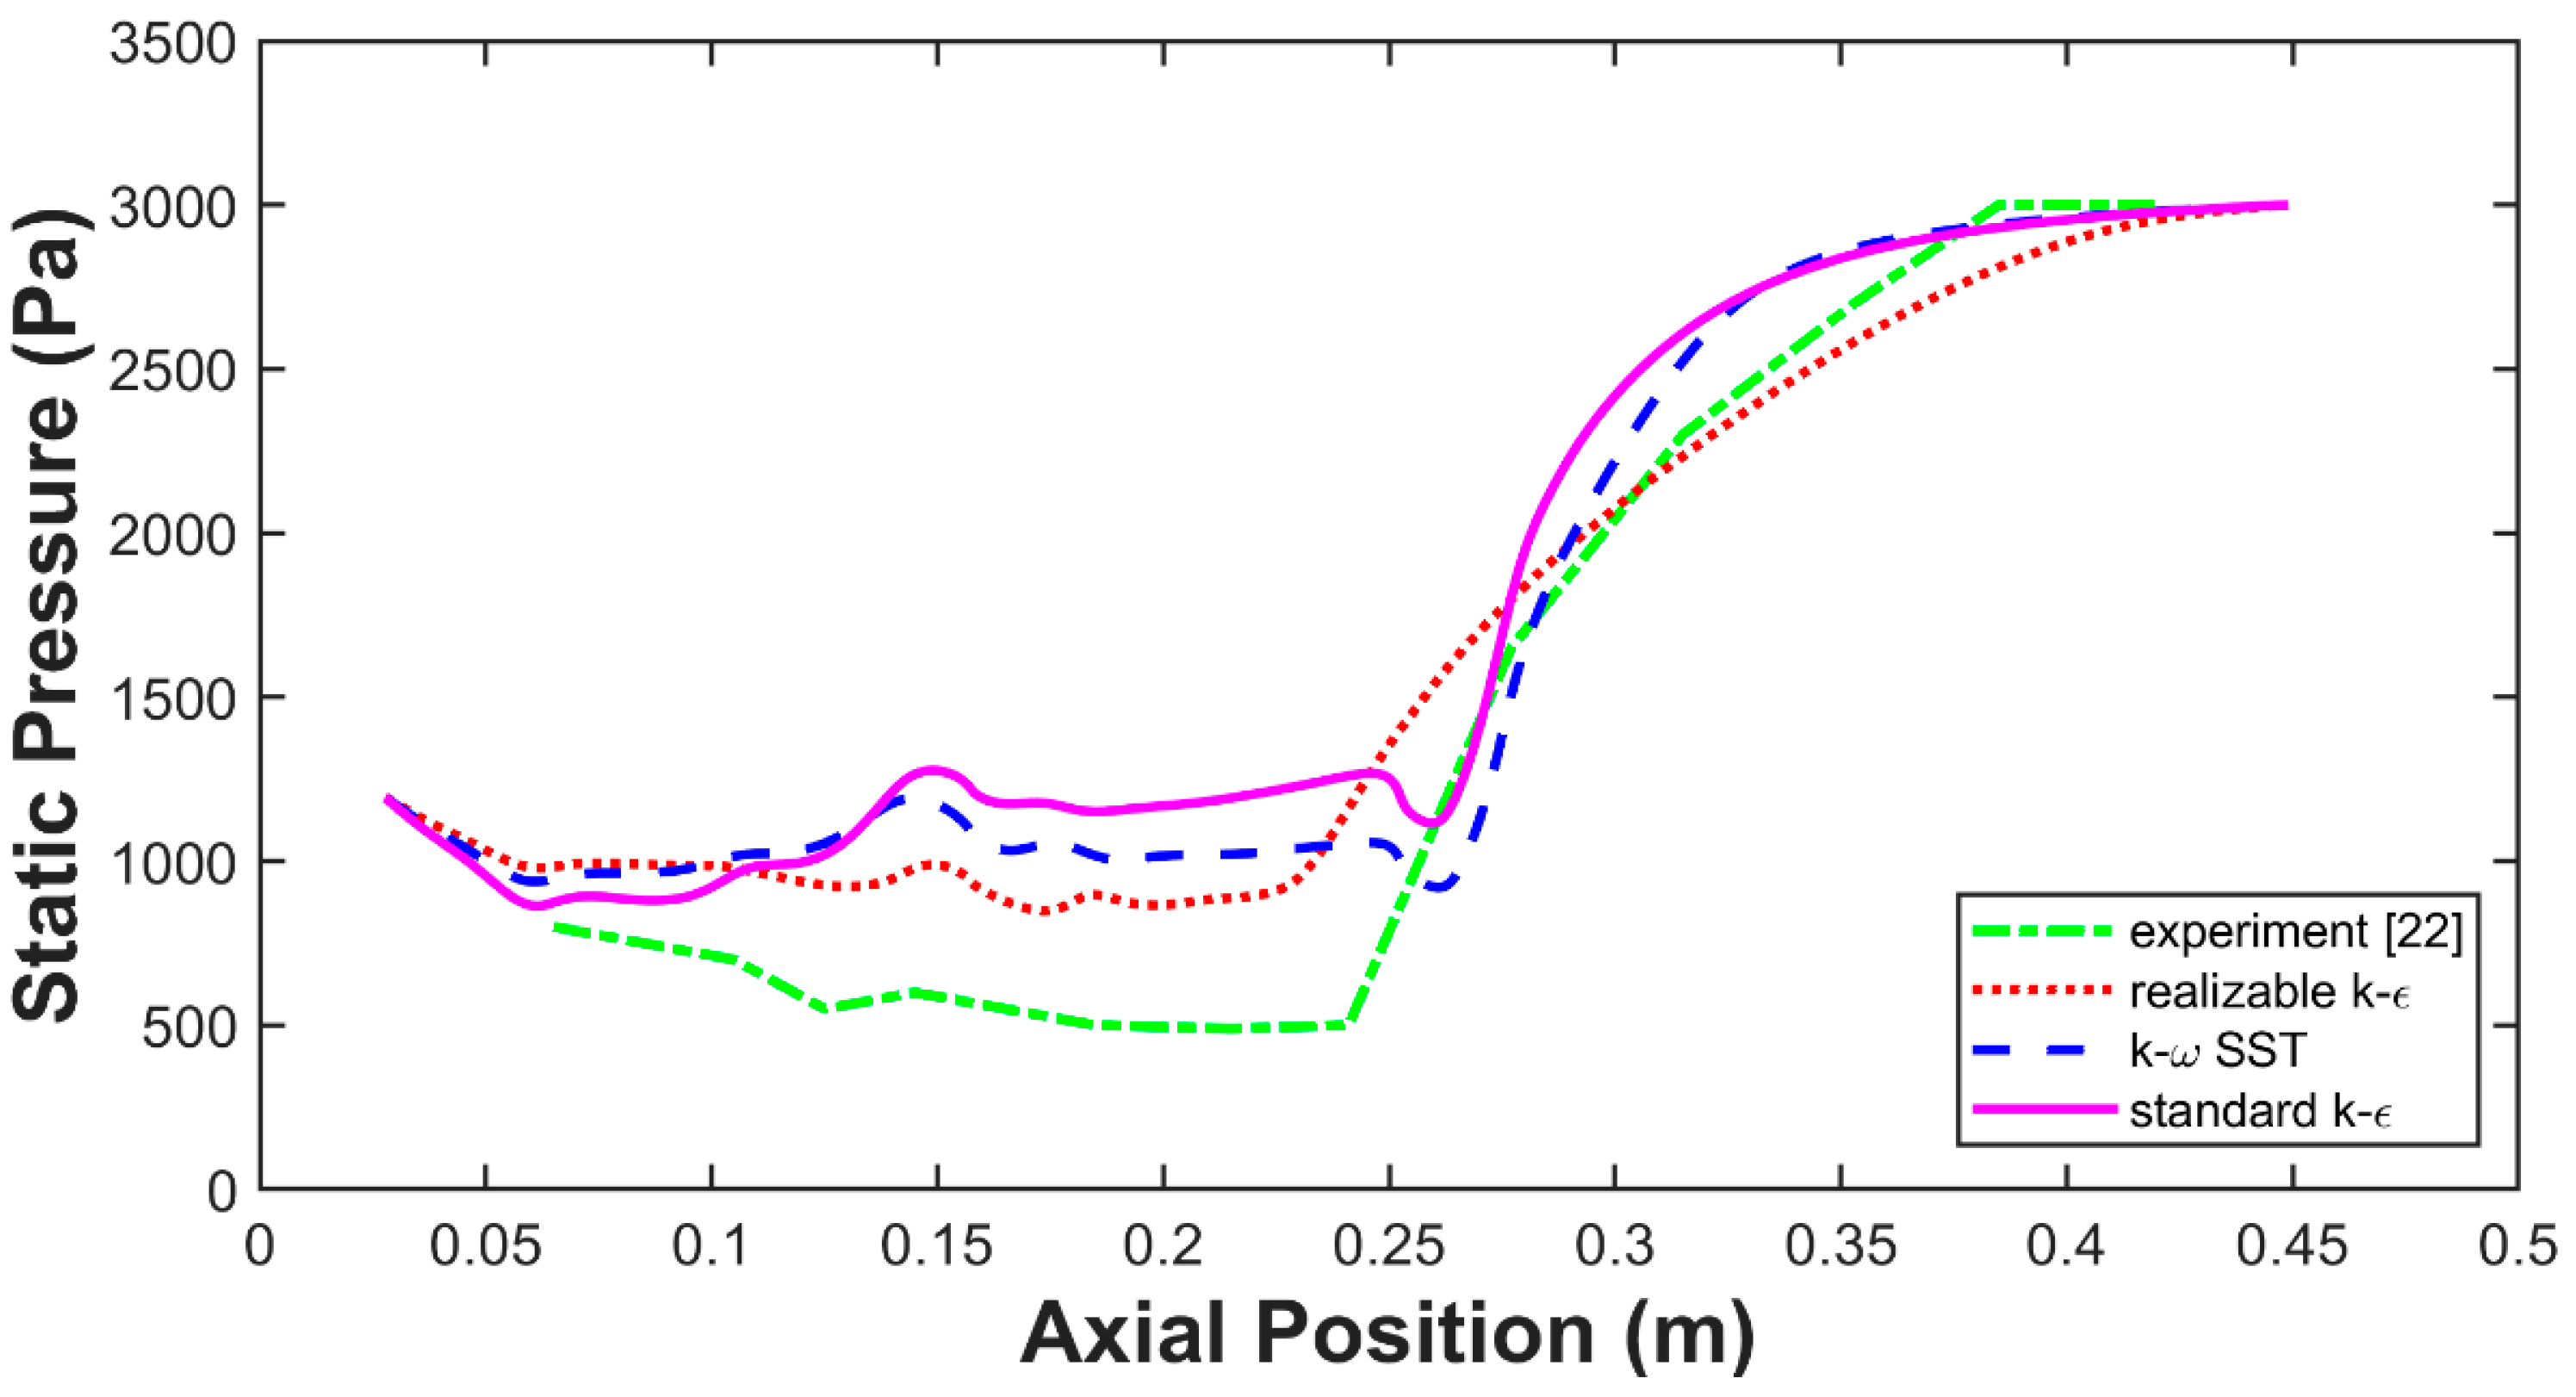
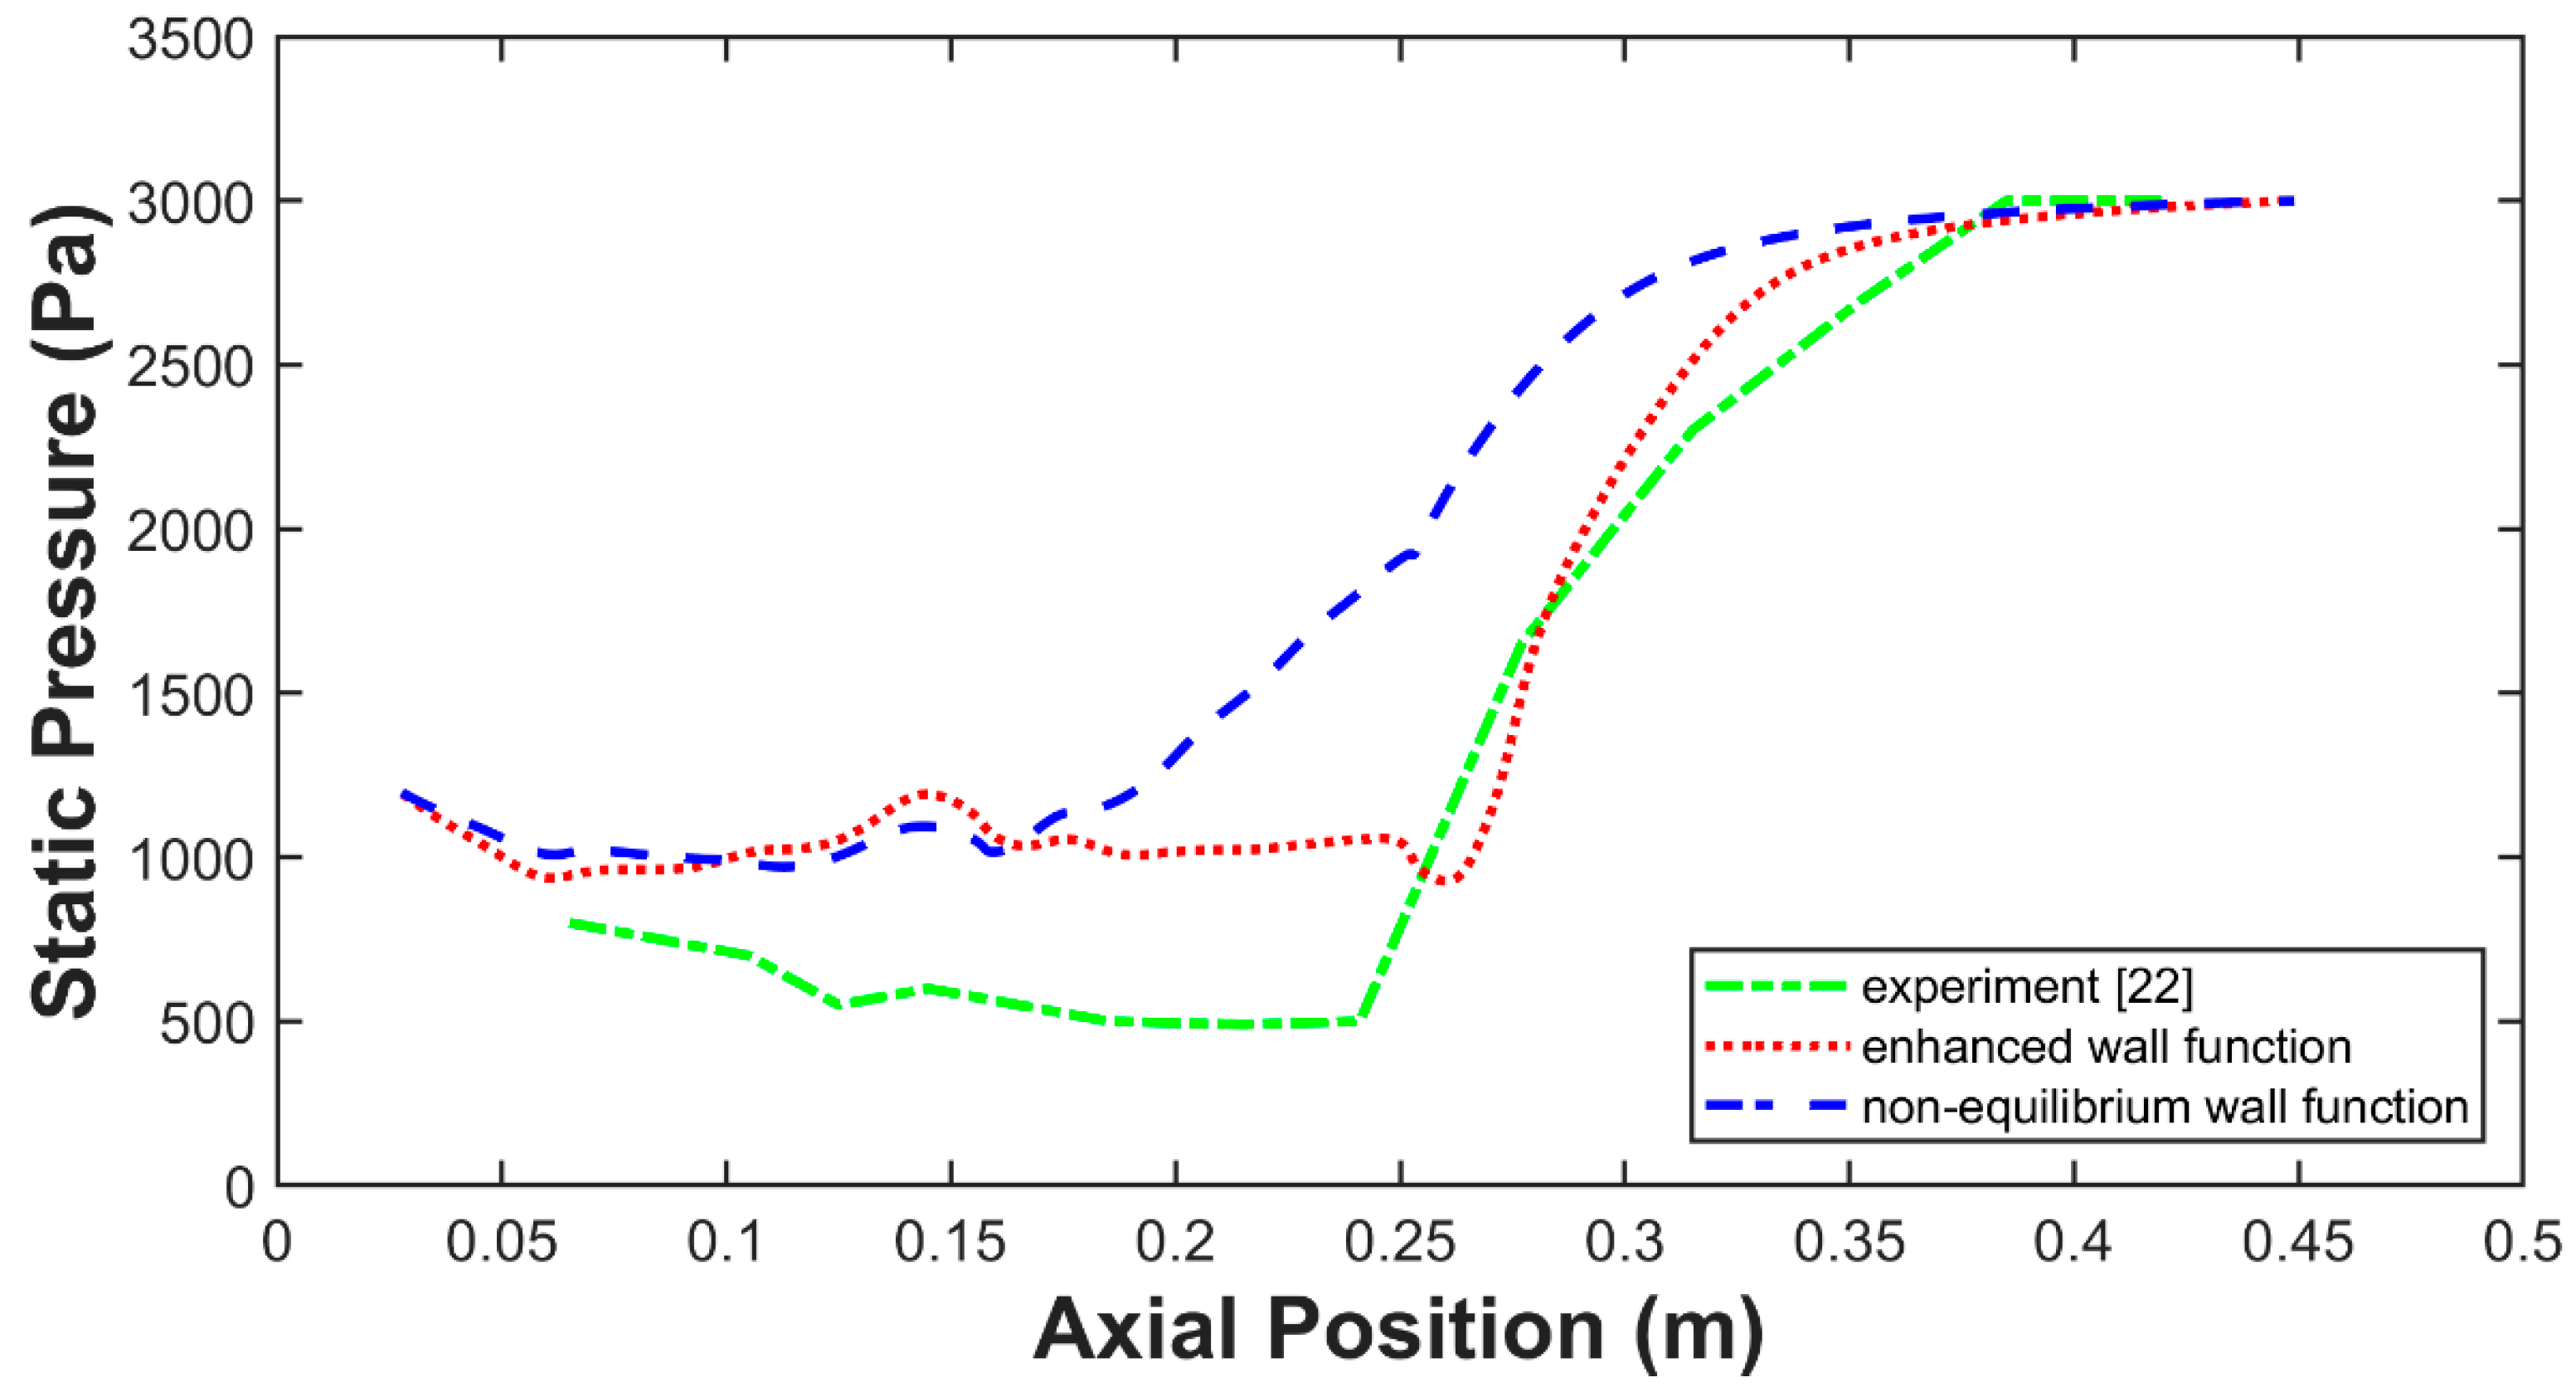
  • Different wall functions and turbulences models will be tested to determine the most optimized model in terms of prediction accuracy.
  • A series of simulations with different wetness operating conditions will be performed to investigate the relationship between the wetness of working flows and pump efficiency.

2. Mathematical Model

In order to model the complex, non-linear and fully-coupled turbulent and steam interacting fluid mixture involved in a steam-ejector, the conserved properties including velocity, temperature, and mass fraction of water droplets were solved based on the governing equations of fluid dynamics and transport equations, in associated with the wet-steam model. The governing equations are mathematical statements of the physical and chemical phenomena of the considered fluid mixture, which can be numerically resolved in the form of computational codes to obtain solutions for fluid problems, whilst the heat exchange led by the phase-changes of steam droplets were considered by the additional transport properties for steam.

2.1. Wet Steam Modeling

The wet steam flow was modeled by the Eulerian-Eulerian approach. Compressible Navier-Stokes equations were adopted for modeling of the condensation process of the two-phase flow. In addition, two more transport equations accounting for the liquid-phase mass-fraction (β) and the number of liquid-droplets per unit volume (η) were used to capture and describe the distribution of water droplets within the field [38]. The two-equation model is a viable approach which governs the proportion and particle numbers by resolving two conservative transporting properties, and it has been proven to be effective in applications such as turbulence and smoke particles modeling [36,39,40]. Based on the classical non-isothermal nucleation theory, the formation of liquid-droplets in a homogeneous nonequilibrium condensation process is described in the phase change model.
As for the non-equilibrium state in supersonic flows, the nucleation and condensation of condensable gases are overwhelmingly complicated [41,42]. Based on the single-fluid Eulerian model [41], several assumptions were implemented to ensure the simulation was numerically stable and efficient. Since the mass fraction of the condensed phase is quite small (<0.2), the effect of droplets size to the main flow stream is negligible and the interactions between droplets are not considered. Moreover, since the droplets sizes are sufficiently small, the volume of the condensed phase and thermal capacity are negligible [27]. A non-slip condition was also assumed, which means that the velocity difference between the droplets and gaseous-phase is negligible. Within the phase change model, the droplet was assumed to be spherical and surrounded by infinite vapor space due to the small liquid volume fraction. The droplet growth was based on average representative mean radii.
With the aforementioned assumptions, the Euler Equations [43] can be written as:
U t + F x + G y = 0
where x and y represent the special coordinates while t depicts the physical time. The unsteady term U, flux matrices F and G respectively in x-, y-directions can be expressed as:
U = [ ρ ρ u ρ v ρ E ] , F = [ ρ u ρ u 2 + P ρ u v ( ρ E + P ) u ] , G = [ ρ v ρ u v p v 2 + P ( ρ E + P ) v ]
The mixture density (ρ) is given by:
ρ = ρ v ( 1 β )
where (ρv) is the vapor density and (β) is the liquid-phase mass fraction. And in Equation (3), the internal energy (E) and the specific enthalpy (h) are given by:
E = h 0 P ρ
h 0 = h + ( u 2 + v 2 ) 2
h = ( 1 β ) h v + h l
In order to describe the distribution of nucleating droplets within the computational field, two transport properties were introduced and solved. The first being the mass fraction of fluid condensed liquid phase (β), where the transport equation can be expressed as:
ρ β t + ( ρ v β ) = Γ
The second additional transport equation governs the number density of the droplets per unit volume, which is given by:
ρ η t + ( ρ v η ) = ρ I
In Equation (8), Γ is the mass generation rate, related to the nucleation rate (I). It is defined by the sum of a mass increase due to nucleation and growth/demise of these droplets during the nonequilibrium condensation process in the classical nucleation theory [38]:
Γ = 4 3 π ρ l I r 3 + 4 π ρ l η r ¯ 2 r ¯ t
where r * is the Kelvin-Helmholtz critical droplet radius above which the droplet will grow and below which the droplet will evaporate [44] and it is defined as:
r = 2 σ ρ l R T ln S
where σ is the liquid surface tension evaluated at temperature T, and S is the supersaturation ratio defined as the ratio of vapor pressure to the equilibrium saturation pressure:
S = P P s a t ( T )
In Equation (9), the number of liquid-droplets per unit volume (η) is given by:
η = β ( 1 β ) V d ( ρ l / ρ v )
where Vd is the average droplet volume, which is calculated by the average droplet radius ( r ¯ d ) using the volume formula of a circle.
Also in Equation (8), the nucleation rate I is described by the steady-state classical homogeneous nucleation theory [45]:
I = q c 1 + θ ( ρ v 2 ρ l ) 2 σ M m 3 π exp ( 4 π r 2 σ 3 K b T )
where θ is a non-isothermal correction factor and is determined by the following relation:
θ = 2 ( γ 1 ) ( γ + 1 ) ( h l v R T ) ( h l v R T 0.5 )
Based on the nucleation model, the condensation process involves two mechanisms: (i) Mass transfer from gas phase to droplets and (ii) the transfer of heat from the droplets to the vapor in the form of latent heat [46]. This energy transfer relation can be written as:
r ¯ t = P h l v ρ l 2 π R T ( γ + 1 ) 2 γ C p ( T 0 T )

2.2. Wet Steam Equation of State

In wet steam flow calculations, it is more convenient to relate steam properties using a simpler form of the thermodynamic state equations [45]. The equation of state is given by:
P = ρ v R T ( 1 + B ρ v + C ρ v 2 )
where B and C are the second and the third virial coefficients are given by the following empirical expressions:
B = a 1 ( 1 + τ α ) 1 + a 2 e τ ( 1 e τ ) 5 2 + a 3 τ
where τ = 1500/T, α = 10,000.0, a1 =0.0015, a2 = −0.000942, and a3 = −0.0004882.
C = a ( τ τ 0 ) e α τ + b
where τ = T/647.286, τ0 = 0.8978, α = 11.16, a = 1.772, and b = 1.5 × 10⁻⁶.
The vapor isobaric specific heat capacity (Cpv), specific enthalpy (hv), and specific entropy (sv), which is applied for calculating the state of vapor, are also given below.
C p v = C p 0 ( T ) + R { [ ( 1 α v T ) ( B B 1 ) B 2 ] ρ v + [ ( 1 2 α v T ) C + α v T C 1 C 2 2 ] ρ v 2 }
h v = h 0 ( T ) + R T [ ( B B 1 ) ρ v + ( C C 1 2 ) ρ v 2 ]
s v = s 0 ( T ) R [ ln ρ v + ( B + B 1 ) ρ v + ( C + C 1 ) 2 ρ v 2 ]
where Cp0, h0, s0 are the standard state isobaric specific heat capacity, enthalpy, entropy respectively.

3. Modeling Setup and Boundary Conditions

The dimensions of the steam ejector geometry were based on the experiments conducted by Sriveerakul et al. [47], which are summarized in Table 1. A two-dimensional axisymmetric geometry was applied in this study to improve the simulation efficiency [48]. Structured quadrilateral meshes were applied as displayed in Figure 4, and some refinements were performed around the primary nozzle region due to the occurrence of condensation and other sharp-changing properties. This section may be divided by subheadings. It should provide a concise and precise description of the experimental results, their interpretation as well as the experimental conclusions that can be drawn. A mesh sensitivity analysis was carried out to investigate the independence of mesh refinement towards the computational results. Three mesh sizes were used to perform the analysis, with coarse, medium and fine meshes comprising of 8117, 77,676 and 175,522 grid elements respectively. Comparing the test cases, shown in Figure 5, the medium mesh showed a better result than the coarse mesh. Nevertheless, the deviation of results between the medium mesh and the fine mesh was within 4.2%, which is relatively small. Considering simulation efficiency, while retaining the accuracy of further refined mesh, the medium mesh was chosen for all simulations carried out in this study.
The numerical simulation is performed by commercial CFD software package, ANSYS-Fluent with in-house attachment UDF. The inlet boundary conditions were summarized in Table 2. As the flow inside the nozzle region is transonic, the outlet pressure was then set to an arbitrary low number. The realizable k−ε turbulence model was adopted for the turbulence flow and enhanced wall functions were applied to provide a more accurate representation of the flow in the near-wall regions. The finite-volume approach was implemented for solving the governing equations. The discretized system was solved by the Green-Gauss Node based method and the convection terms were discretized with a second-order upwind scheme.

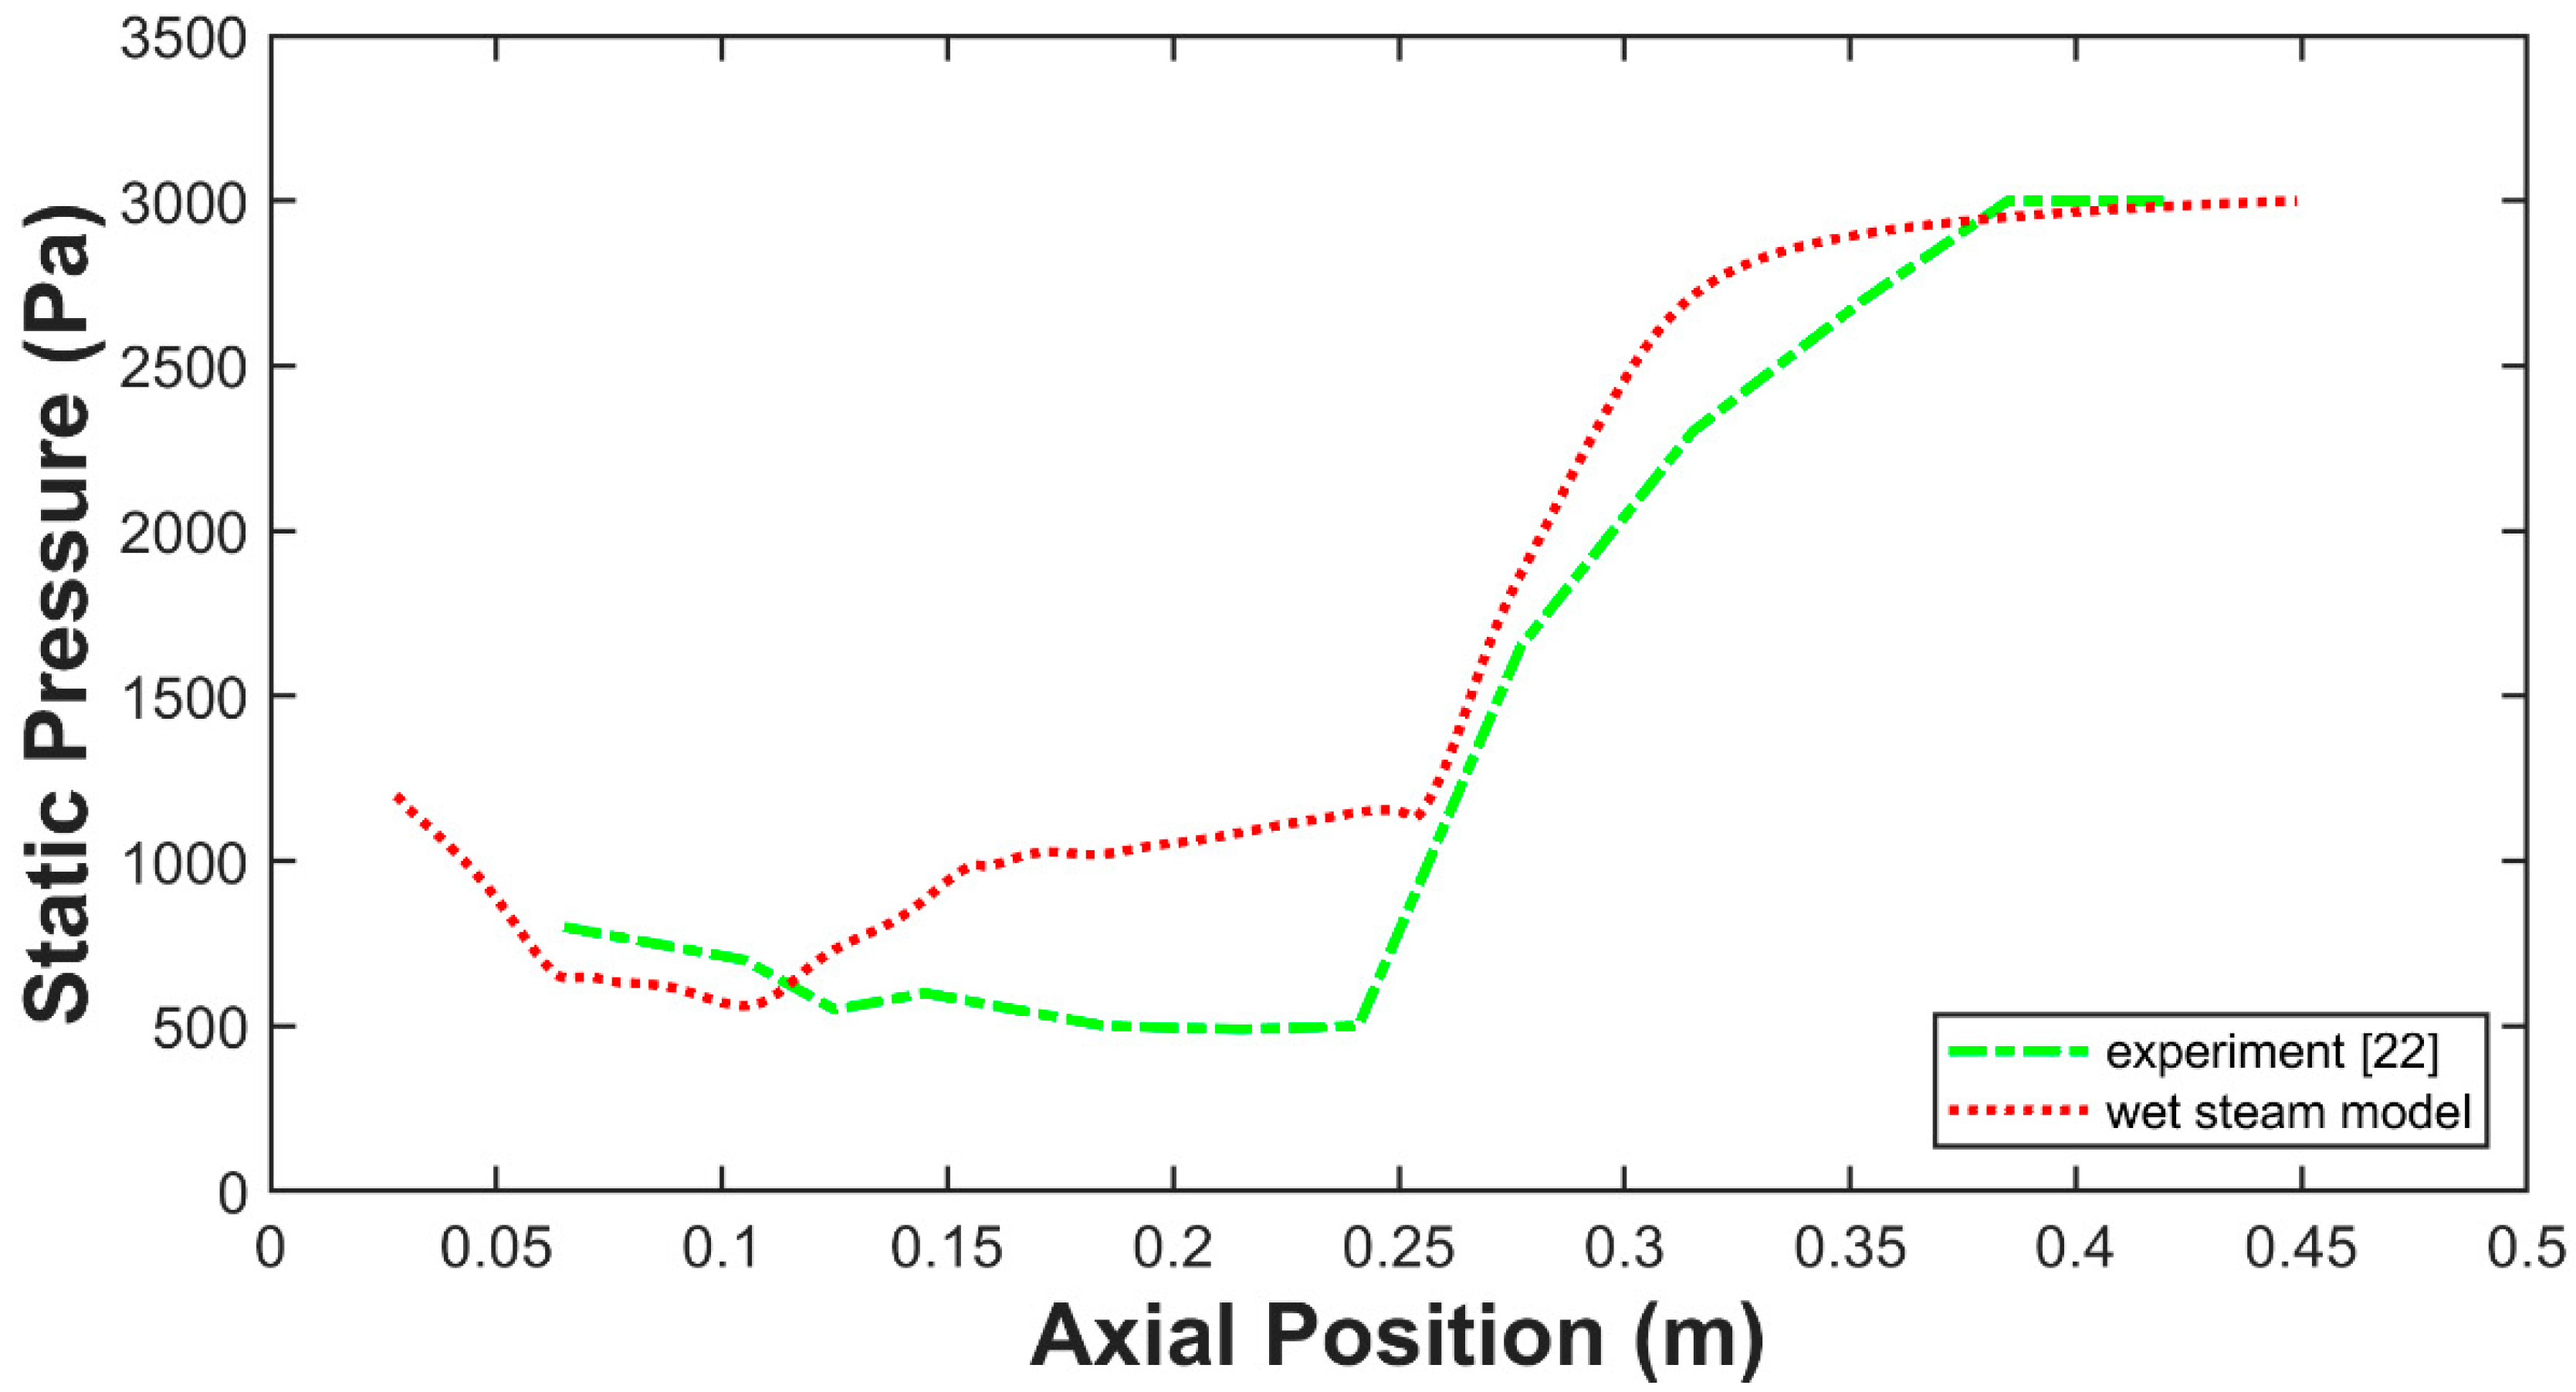
4. Validation of the Numerical Model

The static pressure distribution along the steam ejector upper wall was validated against the experimental measurements reported by Sriveerakul et al. [47]. As shown in Figure 6, the overall static pressure profile showed good agreement with the experimental data, and the position of the shockwave was also well aligned. Within the mixing chamber section (i.e., axial position from 0.06 m to 0.15 m), the predicted static pressure distribution was slightly lower than the experimental data. One possible reason for this error might be the over-predicted condensation effect in the simulation. Furthermore, the remaining static pressure distribution profile of the numerical result was over- predicted against experimental data. Considering deviations shown in Figure 6, there are limitations in the experimental data collection, and it is extremely difficult to obtain measurements in the steam ejector. In this study, the experimental data was obtained from the wall of the steam ejector, where the solution variables have large gradients and the momentum and other scalar transports occur most vigorously. Also, the steam of the primary flow was generated by the boiler, where the state is not the pure dry saturated water steam, and this has a negative effect on the experimental testing data. Additionally, before the primary flow passed through the nozzle, part of steam condensed inside the boiler, which makes the experimental pressure lower than the numerical simulation results. Apart from the deviations in static pressure at axial positions from 0.15–0.25 (which are clarified in the response above), the numerical predictions were in good agreement with experimental results. The trends between the experimental and numerical results are the same, which is that the pressure increased due to the shock wave happened at the throat. Also, the value of pressure was the same around 1200 Pa at the mixing chamber and eventually increased to 3000 Pa at the exit of diffuser. Therefore, the numerical results are validated against experimental results. Figure 7 illustrates the axial pressure distribution results from the wet steam model and ideal gas model against the experimental data. Overall, the numerical results from the wet steam model are in better agreement with the experimental data in comparison to the ideal gas case. With the consideration of the condensation effect in the wet steam model, there was a significant improvement in the pressure predictions within the mixing chamber (the axial position from 0.06 m to 0.15 m). Otherwise, the difference is small between the ideal gas and wet steam models for the rest of the profile.

5. Results and Discussion

5.1. Turbulence Model and Wall Functions for Steam Ejector Modeling

The flow state during the entire working process involves both high pressure and high-velocity flows and shockwaves. Therefore, a suitable turbulence model is essential for accurate numerical predictions. Figure 8 illustrates the static pressure results from three turbulence models against the experimental data. Three different turbulence models (i.e., standard k−ε, realizable k–ε and the k−ω SST model) were applied in this study. As shown in Figure 8, the results of the realizable k−ε model were the most accurate compared to experimental results. The only section in which the k−ω SST model showed slightly improved prediction over the realizable k−ε model was during first half of the throat section (i.e., axial position from 0.15 m to 0.2 m). However, after the shock, the k−ω SST model shows a bigger deviation from experimental data than the k−ε models. In addition to turbulence models, wall functions also need to be carefully considered because the turbulent flows near the wall region have large gradients, and the experimental data was collected from the wall of the steam ejector. Therefore, implementing wall functions should improve the accuracy of the wall-bounded turbulent flows. Figure 9 illustrates the axial pressure distribution for the realizable k−ε model with different wall functions. As can be seen in Figure 9, the enhanced wall function showed a better performance compared to the non-equilibrium wall function. Taking into consideration the aforementioned results, the realizable k−ε model with the enhanced wall functions was chosen to further investigate the condensation effect on the performance of the steam ejector.

5.2. Wetness Influences of Inlets on Entrainment Ratio

Condensation occurs in the nozzle of the steam ejector and results in the formation of water droplets. These water droplets pass through the steam ejector in the primary flow and have significant influence on the mixing process and the flow behavior. The wet steam is a mixture of saturated vapor and fine liquid droplets, and the wetness is defined by the liquid mass fraction. In this article, four working conditions with different wetness settings on the primary and secondary flows were chosen to investigate the effects of wetness on the condensation effect. The case details are listed in Table 3.
Case 1 is a virtue case which tests a totally dry fluid stream, which means both the liquid mass fraction of primary and secondary flow are set as zero. Case 4 is more like the actual scenario since in reality there is humidity and the steam should be somewhat wet. The liquid mass fraction was set to 0.1 on both inlet flows, which corresponds to the fact that most nozzle and turbine flows will have a wetness factor less than 0.1. In addition, large values of the wetness fraction lead to instability in the solution due to the large source terms in the transport equations.
The axial static temperature distribution for the 4 case studies are illustrated in Figure 10. Case 1 and 2 shows a slightly different trend to Case 3 and 4 during the nozzle section. It is proven that the wetness of primary flow has a more significant effect on the condensation in comparison to that of secondary flow. The gap in temperature distribution along the axis position between Case 1 & 2 and Case 3 & 4 is due to the heat realized from the condensation effect. From Figure 10, it is also concluded that: (i) For Case 1, since both the primary and secondary flow are totally dry, the condensation effect is the most significant and can be reflected from the figure as it has the highest temperature overall. (ii) On the contrary, Case 4 has the least condensation effect since the incoming fluid has the greatest moisture content before it approaches the mixing chamber. (iii) Compared with Case 4, the temperature of Case 2 in the nozzle part is higher since the condensation happened in the nozzle and some latent heat was released due to the condensing effect, which leads to a delay of the temperature drop. (iv) Case 3 shows the same trend of Case 4 during the nozzle part because the wetness of primary flow is the same. For the mixing chamber, with the different wetness of secondary flow, the condensation of secondary fluid for Case 3 occurred and the process released heat to the mixed flow, leading to an increased temperature. (v) Case 2 and 3 illustrates that the wetness of the primary flow has a more significant effect on the condensation in the whole working process of the steam ejector compared to the secondary flow.
From Figure 11, it is concluded that during the mixing process, the nucleation rate is high, and droplets were generated, which means that condensation is still happening in the mixing chamber. Compared to Case 4, Case 3 shows a wider area of droplets nucleation, which leads to a higher entrainment ratio. Theoretically, reducing the wetness of secondary flow has a positive impact on improving the entrainment ratio and the performance of the steam ejector. With less wetness of the secondary flow, the nucleation can last from mixing chamber to throat, which increases the range of condensation effect and improves the entrainment ratio of the steam ejector. The pumping efficiency of the steam ejector was calculated based on the Equation (1) for all four cases, which was summarized in Figure 12. Compared to the ideal gas model, the entrainment ratio of Case 1 and 3 was improved, due to the application of the wet steam. The condensation effect was taken into consideration during the pumping progress by using the wet steam model, and the primary flow entrained more secondary flow, which improves the pumping efficiency. It is also evident that reducing the wetness of the secondary fluid, the entrainment ratio is the highest to 0.47, which significantly improves the performance of the steam ejector.

6. Conclusions

In this study, numerical simulations have been performed to study the entire steam ejector system. A wet steam model was implemented to describe the condensation and evaporation processes of the water droplets within the system. The numerical model was validated against experimental results which were found to agree well with the experimental data in terms of the static pressure distribution along the steam ejector. In addition, the model was able to provide an accurate prediction of the changes in water droplets, axial pressure, temperature, and pressure distribution within the entire system. The investigation into different wetness of inlet flows showed that in the whole working process, the wetness of secondary flow influences the pumping efficiency more than the primary flow. Within a certain range (from 0 to 0.1), the wetness of the secondary flow has an inverse proportion relationship with the entrainment ratio. The nucleation rate of water droplets is improved by the decrease of the wetness of the secondary flow at the front half of the mixing chamber, leading to better performance of the steam ejector. On the other hand, the wetness of the primary flow plays a domain role on the spontaneous condensation at the diffuser part. In summary, the following are the key findings from this study:
  • Based on the ideal gas model, the realizable k−ε turbulence model with enhanced wall functions showed a better performance of simulating the working process of the steam ejector.
  • Compared with the ideal gas model, the wet steam model showed a better agreement against the experimental data, especially in the mixing chamber section with approximately 23% improvement.
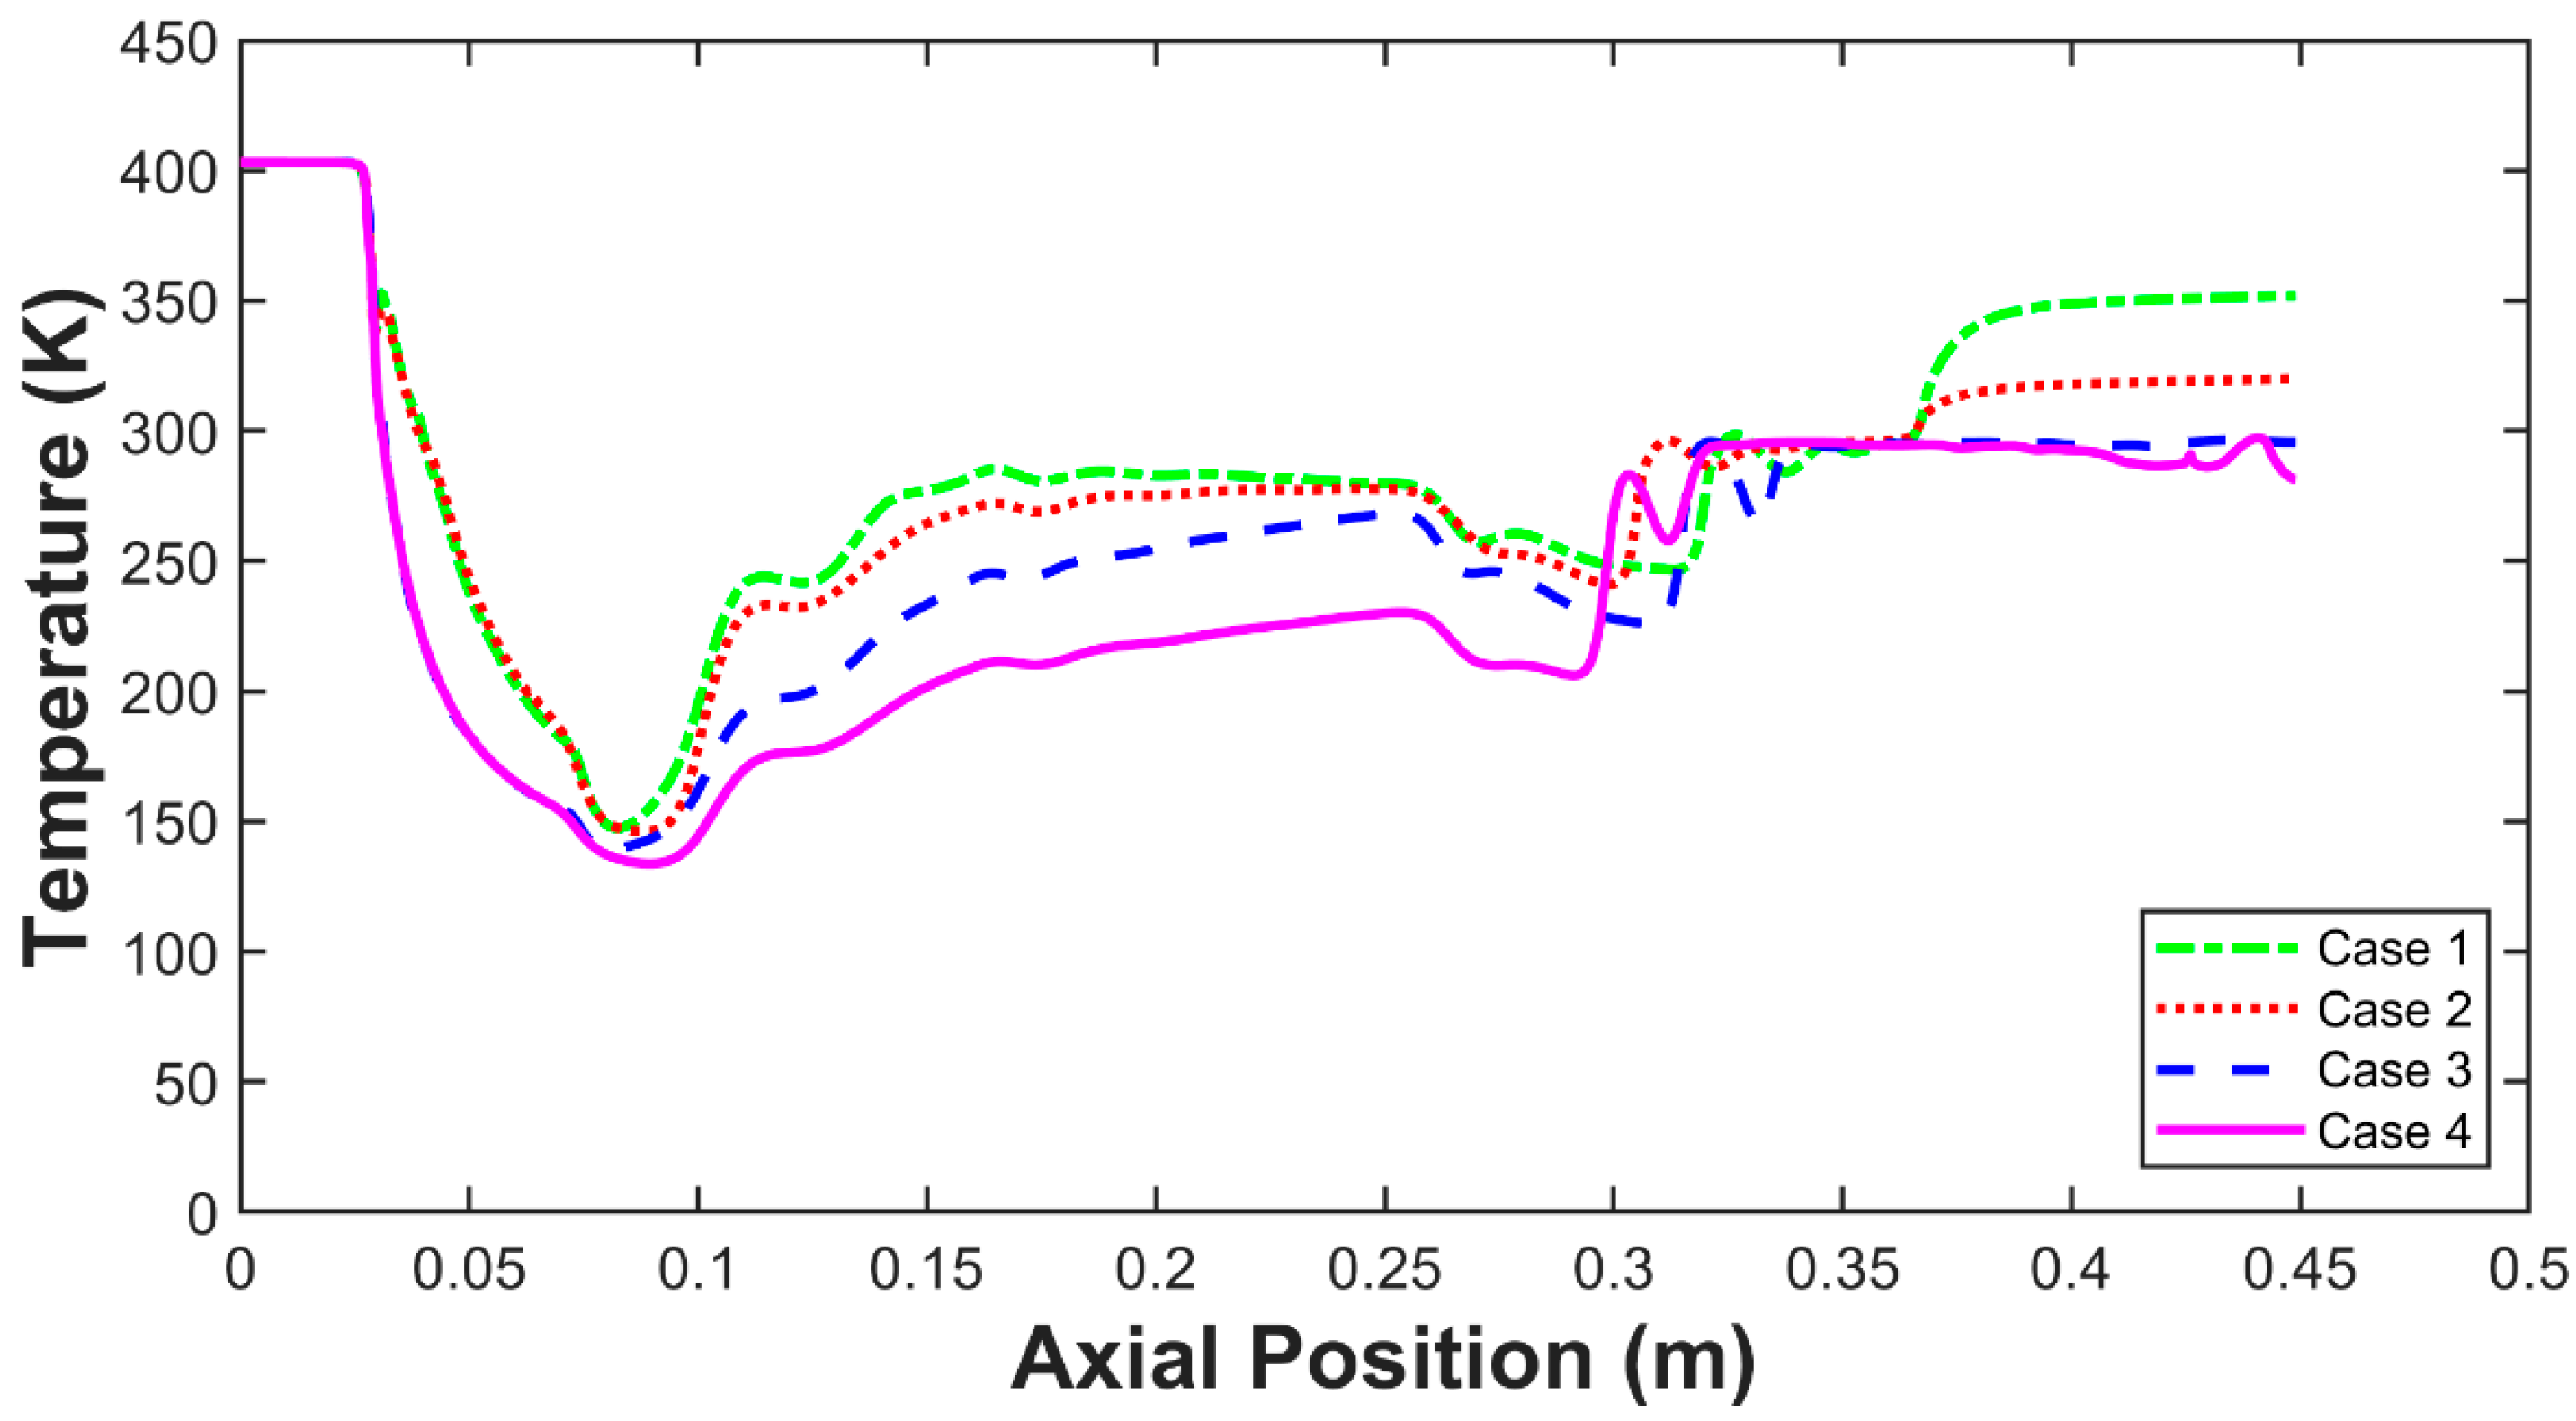
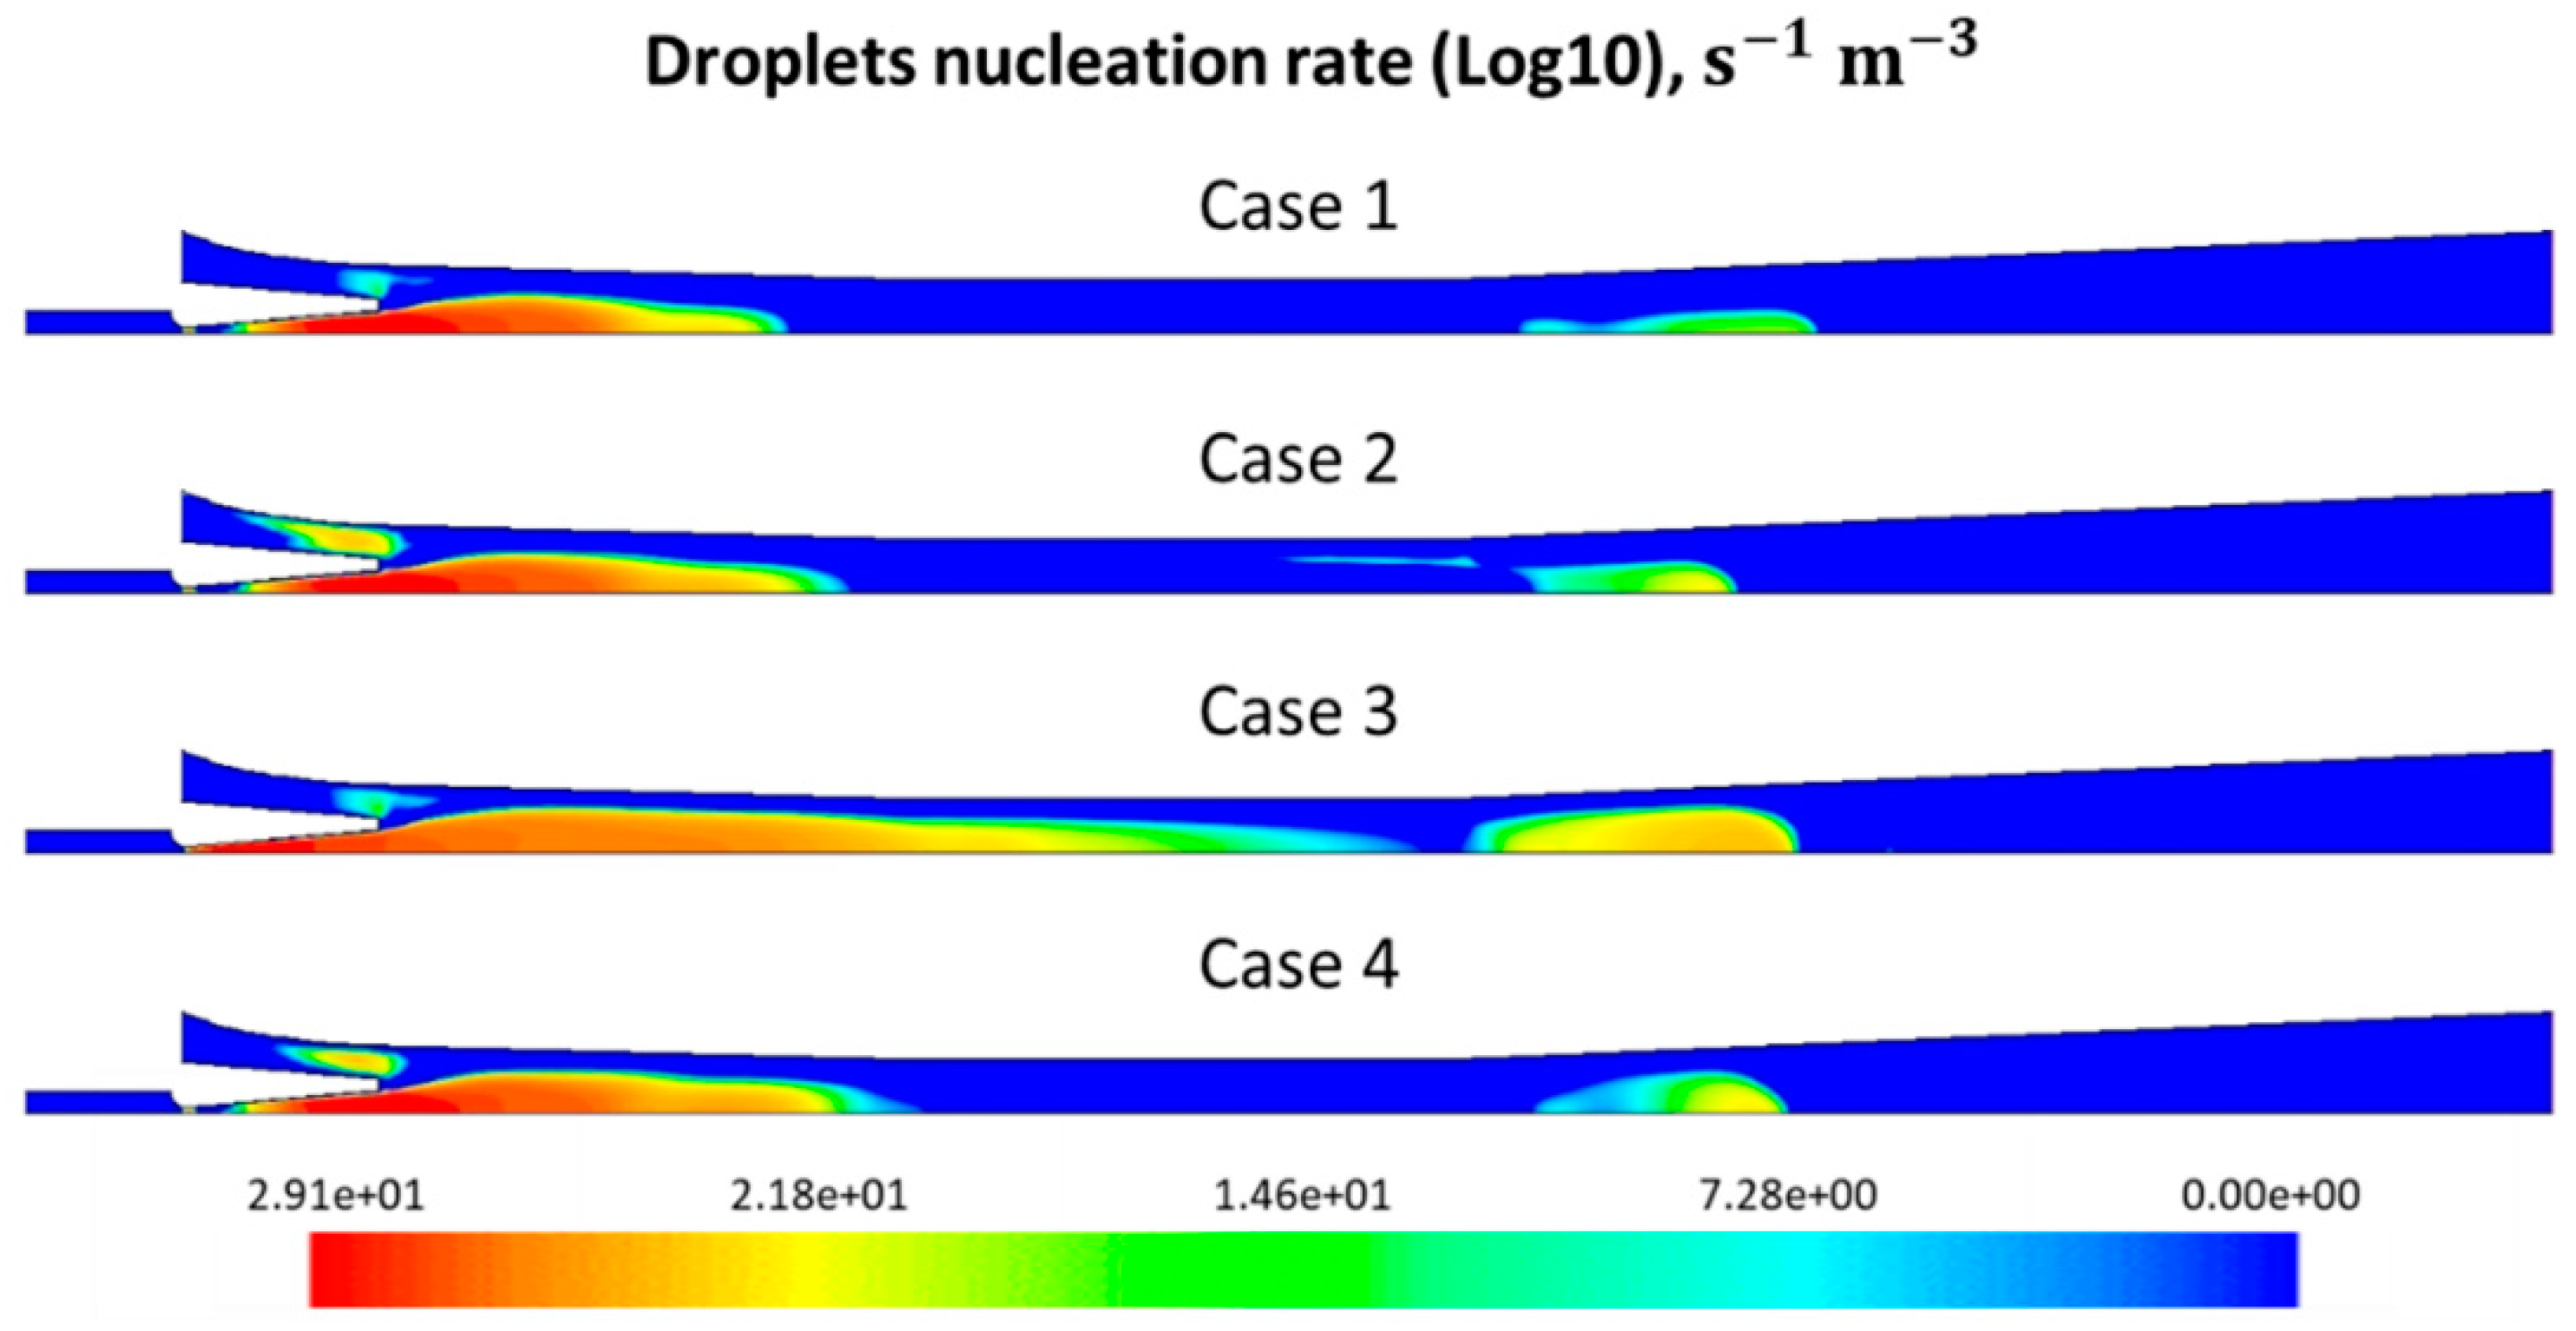
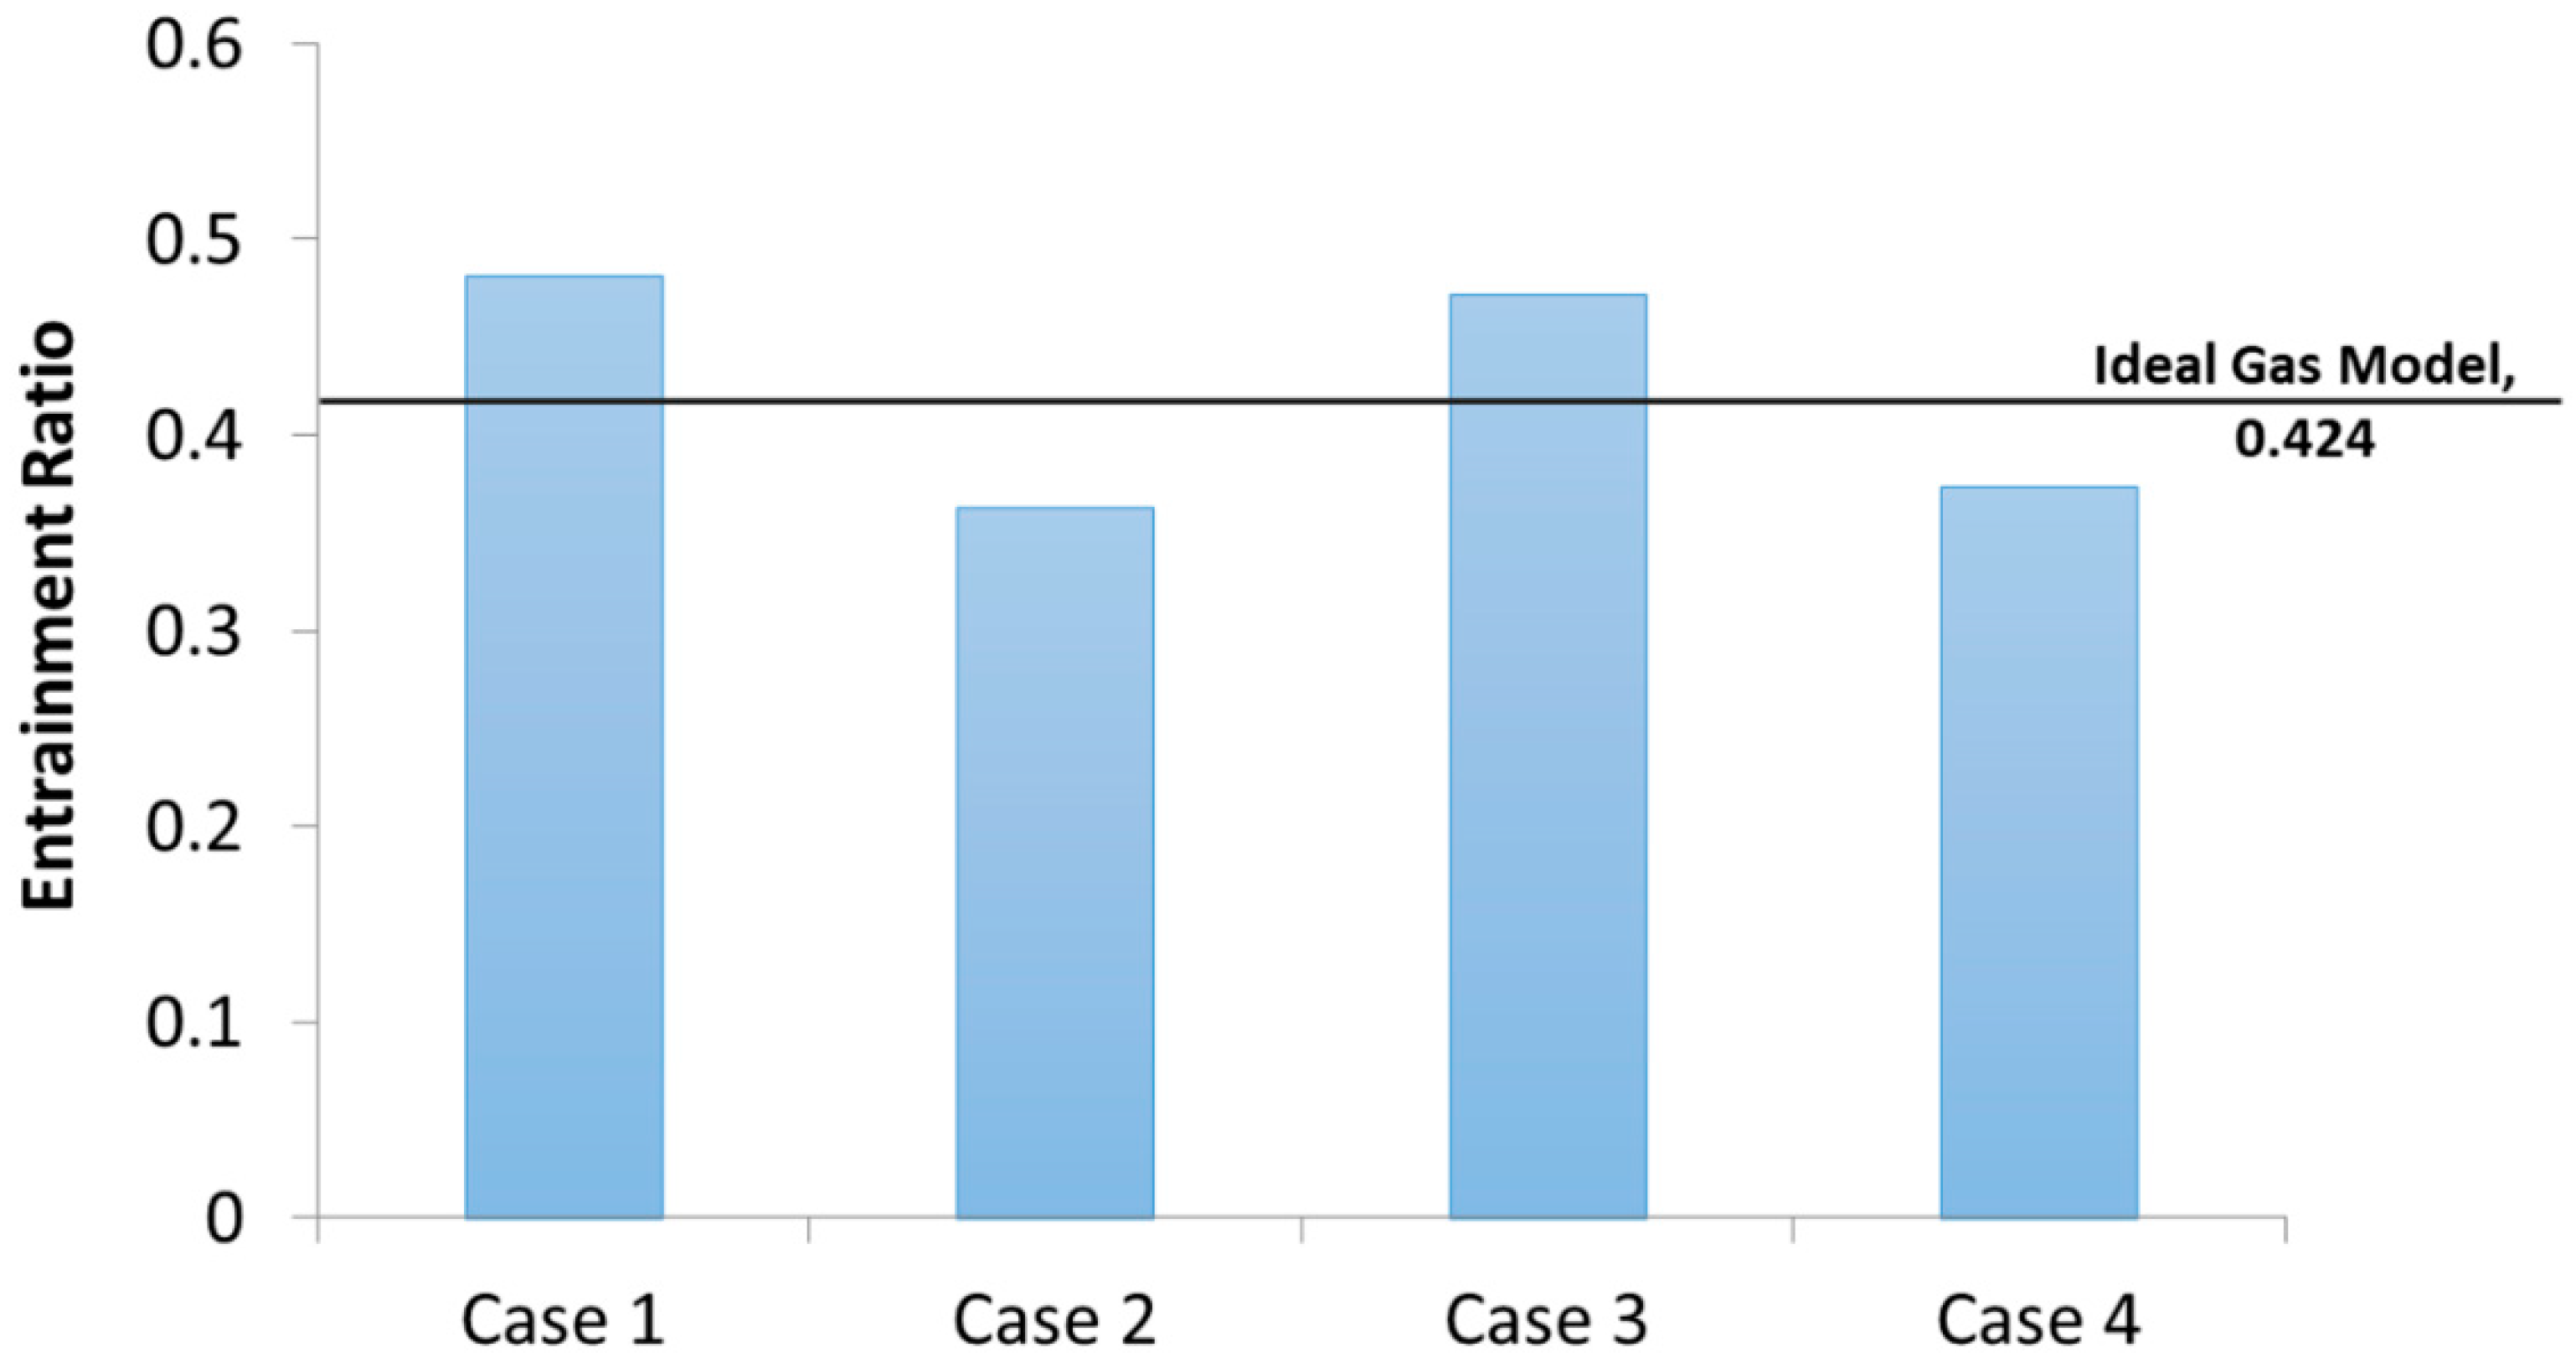
  • The spontaneous condensation happened in the nozzle and during the mixing chamber, the condensation effect had an influence on the entrainment ratio.
  • By reducing the wetness of the secondary fluid or improving the wetness of the primary fluid, the condensation effect lasted longer and improved the entrainment ratio, which means the performance of the steam ejector is enhanced.

Author Contributions

Conceptualization, G.H.Y. and A.L.; methodology, A.L. and G.H.Y.; software, A.C.Y.Y. and T.B.Y.C.; data curation, A.L. and H.L.; formal analysis, A.C.Y.Y. and C.W.; numerical simulations, A.L. and A.C.Y.Y.; validation, T.B.Y.C. and C.W.; writing—original draft preparation, A.L. and A.C.Y.Y.; writing—review and editing, C.W. and W.Y.; visualization, R.C. and T.B.Y.C.; supervision, G.H.Y. and V.T.; project administration, A.L. and W.Y.; funding acquisition, G.H.Y.

Funding

This research was funded by the Australian Research Council (ARC Industrial Transformation Training Centre IC170,100,032) and the Australian Government Research Training Program. All financial and technical support are deeply appreciated by the authors.

Conflicts of Interest

The authors declare no conflict of interest.

Nomenclature

B, Cvirial coefficients (m3/kg, m6/kg2)
Cp, Cp0isobaric heat capacity, standard state heat capacity (J/kg·K)
Ementrainment ratio
h, h0, hl, hv, hlvspecific enthalpy, standard state enthalpy, liquid specific enthalpy, vapor specific enthalpy, specific enthalpy between phases (J/kg)
Inucleation rate (1/s)
KbBoltzmann constant (J/mol·K)
kturbulent kinetic energy (m2/s2)
Mmolecular mass (kg)
P pressure (Pa)
P b back pressure (Pa)
P b * critical back pressure (Pa)
P b r reversing back pressure (Pa)
P s a t saturation pressure
qcevaporation coefficient
Rgas-law constant (J/mol·k)
r ¯ droplet average radius (m)
r * critical droplet radius (m)
Ssuper saturation ratio
s, s0, svspecific entropy, standard state entropy, vapor specific entropy (J/kg·mol·K)
Tthermal temperature (K)
T0droplet temperature (K)
ttime (s)
uvelocity (m/s)
Vdaverage droplet volume (m3)
αvvolume fraction
βmass fraction
γspecific heat capacities ratio
Γmass generation rate (kg/s)
εturbulent energy dissipation rate (m2/s3)
ηdroplet number density (1/m3)
θ non-isothermal correction factor
μ, μtdynamic viscosity, turbulent viscosity (Pa·s)
νkinetic viscosity (m2/s),
ρ, ρl, ρvmixture density, liquid density, vapor density (kg/m3)
σdroplet surface tension (N/m)
Einternal energy

References

  1. Riffat, S.; Jiang, L.; Gan, G. Recent development in ejector technology—A review. Int. J. Ambient Energy 2005, 26, 13–26. [Google Scholar] [CrossRef]
  2. Lucas, C.; Koehler, J. Experimental investigation of the COP improvement of a refrigeration cycle by use of an ejector. Int. J. Refrig. 2012, 35, 1595–1603. [Google Scholar] [CrossRef]
  3. Dopazo, J.A.; Fernandez-Seara, J. Experimental evaluation of an ejector as liquid re-circulator in an overfeed NH3 system with a plate evaporator. Int. J. Refrig. 2011, 34, 1676–1683. [Google Scholar] [CrossRef]
  4. Han, B.; Liu, Z.L.; Wu, H.Q.; Li, Y.X. Experimental study on a new method for improving the performance of thermal vapor compressors for multi-effect distillation desalination systems. Desalination 2014, 344, 391–395. [Google Scholar] [CrossRef]
  5. Wang, X.; Dong, J.; Lei, H.; Li, A.; Wang, R.; Chen, W.; Tu, J. Modeling and simulation of steam-jet vacuum pump. Zhenkong Kexue yu Jishu Xuebao/J. Vac. Sci. Technol. 2013, 33, 1069–1073. [Google Scholar]
  6. Yinshui, L.; Zhuo, J.; Dan, W.; Xiaohui, L. Experimental research on the water mist fire suppression performance in an enclosed space by changing the characteristics of nozzles. Exp. Thermal Fluid Sci. 2014, 52, 174–181. [Google Scholar] [CrossRef]
  7. Yang, P.Z.; Liu, T.; Qin, X.A. Experimental and numerical study on water mist suppression system on room fire. Build Environ. 2010, 45, 2309–2316. [Google Scholar] [CrossRef]
  8. Beji, T.; Zadeh, S.E.; Maragkos, G.; Merci, B. Influence of the particle injection rate, droplet size distribution and volume flux angular distribution on the results and computational time of water spray CFD simulations. Fire Saf. J. 2017, 91, 586–595. [Google Scholar] [CrossRef]
  9. Chunnanond, K.; Aphornratana, S. An experimental investigation of a steam ejector refrigerator: The analysis of the pressure profile along the ejector. Appl. Therm. Eng. 2004, 24, 311–322. [Google Scholar] [CrossRef]
  10. Huang, B.J.; Jiang, C.B.; Hu, F.L. Ejector Performance-Characteristics and Design Analysis of Jet Refrigeration System. J. Eng. Gas Turbines Power 1985, 107, 792–802. [Google Scholar] [CrossRef]
  11. Huang, B.J.; Chang, J.M.; Wang, C.P.; Petrenko, V.A. A 1-D analysis of ejector performance. Int. J. Refrig. 1999, 22, 354–364. [Google Scholar] [CrossRef]
  12. Sankarlal, T.; Mani, A. Experimental investigations on ejector refrigeration system with ammonia. Renew. Energy 2007, 32, 1403–1413. [Google Scholar] [CrossRef]
  13. Aidoun, Z.; Ouzzane, A. The effect of operating conditions on the performance of a supersonic ejector for refrigeration. Int. J. Refrig. 2004, 27, 974–984. [Google Scholar] [CrossRef]
  14. Wang, X.D.; Dong, J.L. Numerical study on the performances of steam-jet vacuum pump at different operating conditions. Vacuum 2010, 84, 1341–1346. [Google Scholar] [CrossRef]
  15. Varga, S.; Oliveira, A.C.; Diaconu, B. Influence of geometrical factors on steam ejector performance—A numerical assessment. Int. J. Refrig. 2009, 32, 1694–1701. [Google Scholar] [CrossRef]
  16. Varga, S.; Oliveira, A.C.; Diaconu, B. Numerical assessment of steam ejector efficiencies using CFD. Int. J. Refrig. 2009, 32, 1203–1211. [Google Scholar] [CrossRef]
  17. Varga, S.; Oliveira, A.C.; Ma, X.L.; Omer, S.A.; Zhang, W.; Riffat, S.B. Experimental and numerical analysis of a variable area ratio steam ejector. Int. J. Refrig. 2011, 34, 1668–1675. [Google Scholar] [CrossRef]
  18. Ma, X.L.; Zhang, W.; Omer, S.A.; Riffat, S.B. Experimental investigation of a novel steam ejector refrigerator suitable for solar energy applications. Appl. Therm. Eng. 2010, 30, 1320–1325. [Google Scholar] [CrossRef]
  19. Yadav, R.L.; Patwardhan, A.W. Design aspects of ejectors: Effects of suction chamber geometry. Chem. Eng. Sci. 2008, 63, 3886–3897. [Google Scholar] [CrossRef]
  20. Riffat, S.B.; Omer, S.A. CFD modelling and experimental investigation of an ejector refrigeration system using methanol as the working fluid. Int. J. Energy Res. 2001, 25, 115–128. [Google Scholar] [CrossRef]
  21. Bartosiewicz, Y.; Aidoun, Z.; Desevaux, P.; Mercadier, Y. Numerical and experimental investigations on supersonic ejectors. Int. J. Heat Fluid Flow 2005, 26, 56–70. [Google Scholar] [CrossRef]
  22. Sun, D.W. Variable geometry ejectors and their applications in ejector refrigeration systems. Energy 1996, 21, 919–929. [Google Scholar] [CrossRef]
  23. Cizungu, K.; Groll, M.; Ling, Z.G. Modelling and optimization of two-phase ejectors for cooling systems. Appl. Therm. Eng. 2005, 25, 1979–1994. [Google Scholar] [CrossRef]
  24. Chaiwongsa, P.; Wongwises, S. Experimental study on R-134a refrigeration system using a two-phase ejector as an expansion device. Appl. Therm. Eng. 2008, 28, 467–477. [Google Scholar] [CrossRef]
  25. Ruangtrakoon, N.; Aphornratana, S.; Sriveerakul, T. Experimental studies of a steam jet refrigeration cycle: Effect of the primary nozzle geometries to system performance. Exp. Thermal Fluid Sci. 2011, 35, 676–683. [Google Scholar] [CrossRef]
  26. Ruangtrakoon, N.; Thongtip, T.; Aphornratana, S.; Sriveerakul, T. CFD simulation on the effect of primary nozzle geometries for a steam ejector in refrigeration cycle. Int. J. Therm. Sci. 2013, 63, 133–145. [Google Scholar] [CrossRef]
  27. Gerber, A.; Kermani, M. A pressure based Eulerian–Eulerian multi-phase model for non-equilibrium condensation in transonic steam flow. Int. J. Heat Mass Transf. 2004, 47, 2217–2231. [Google Scholar] [CrossRef]
  28. Yuen, A.C.Y.; Yeoh, G.H.; Timchenko, V.; Chen, T.B.Y.; Chan, Q.N.; Wang, C.; Li, D.D. Comparison of detailed soot formation models for sooty and non-sooty flames in an under-ventilated ISO room. Int. J. Heat Mass Transf. 2017, 115, 717–729. [Google Scholar] [CrossRef]
  29. Wang, X.D.; Dong, J.L.; Wang, T.; Tu, J.Y. Numerical analysis of spontaneously condensing phenomena in nozzle of steam-jet vacuum pump. Vacuum 2012, 86, 861–866. [Google Scholar] [CrossRef]
  30. Munday, J.T.; Bagster, D.F. A new ejector theory applied to steam jet refrigeration. Ind. Eng. Chem. Process Des. Dev. 1977, 16, 442–449. [Google Scholar] [CrossRef]
  31. Yang, Y.; Walther, J.H.; Yan, Y.Y.; Wen, C. CFD modeling of condensation process of water vapor in supersonic flows. Appl. Therm. Eng. 2017, 115, 1357–1362. [Google Scholar] [CrossRef]
  32. Mazzelli, F.; Giacomelli, F.; Milazzo, A. CFD modeling of condensing steam ejectors: Comparison with an experimental test-case. Int. J. Therm. Sci. 2018, 127, 7–18. [Google Scholar] [CrossRef]
  33. Wang, X.D.; Lei, H.J.; Dong, J.L.; Tu, J.Y. The spontaneously condensing phenomena in a steam-jet pump and its influence on the numerical simulation accuracy. Int. J. Heat Mass Transf. 2012, 55, 4682–4687. [Google Scholar] [CrossRef]
  34. Sharifi, N.; Boroomand, M.; Sharifi, M. Numerical assessment of steam nucleation on thermodynamic performance of steam ejectors. Appl. Therm. Eng. 2013, 52, 449–459. [Google Scholar] [CrossRef]
  35. Wang, X.D.; Dong, J.L.; Li, A.; Lei, H.J.; Tu, J.Y. Numerical study of primary steam superheating effects on steam ejector flow and its pumping performance. Energy 2014, 78, 205–211. [Google Scholar] [CrossRef]
  36. Wang, X.D.; Dong, J.L.; Zhang, G.L.; Fu, Q.; Li, H.; Han, Y.; Tu, J.Y. The primary pseudo-shock pattern of steam ejector and its influence on pumping efficiency based on CFD approach. Energy 2019, 167, 224–234. [Google Scholar] [CrossRef]
  37. Bakhtar, F.; Tochai, M.M. An investigation of two-dimensional flows of nucleating and wet steam by the time-marching method. Int. J. Heat Fluid Flow 1980, 2, 5–18. [Google Scholar] [CrossRef]
  38. Ishizaka, K. A high-resolution numerical method for transonic non-equilibrium condensation flow through a steam turbine cascade. Proc. of the 6th ISCFD 1995, 1, 479–484. [Google Scholar]
  39. Yuen, A.C.Y.; Yeoh, G.H.; Timchenko, V.; Cheung, S.C.P.; Barber, T.J. Importance of detailed chemical kinetics on combustion and soot modelling of ventilated and under-ventilated fires in compartment. Int. J. Heat Mass Transf. 2016, 96, 171–188. [Google Scholar] [CrossRef]
  40. Chen, T.B.Y.; Yuen, A.C.Y.; Yeoh, G.H.; Timchenko, V.; Cheung, S.C.P.; Chan, Q.N.; Yang, W.; Lu, H. Numerical study of fire spread using the level-set method with large eddy simulation incorporating detailed chemical kinetics gas-phase combustion model. J. Comput. Sci. 2018, 24, 8–23. [Google Scholar] [CrossRef]
  41. Yang, Y.; Zhu, X.; Yan, Y.; Ding, H.; Wen, C. Performance of supersonic steam ejectors considering the nonequilibrium condensation phenomenon for efficient energy utilisation. Appl. Energy 2019, 242, 157–167. [Google Scholar] [CrossRef]
  42. Wen, C.; Karvounis, N.; Walther, J.H.; Yan, Y.; Feng, Y.; Yang, Y. An efficient approach to separate CO2 using supersonic flows for carbon capture and storage. Appl. Energy 2019, 238, 311–319. [Google Scholar] [CrossRef]
  43. Yang, Y.; Shen, S.Q. Numerical simulation on non-equilibrium spontaneous condensation in supersonic steam flow. Int. Commun. Heat Mass Transf. 2009, 36, 902–907. [Google Scholar] [CrossRef]
  44. Young, J. Two-dimensional, nonequilibrium, wet-steam calculations for nozzles and turbine cascades. J. Turbomach. 1992, 114, 569–579. [Google Scholar] [CrossRef]
  45. Young, J.B. An Equation of State for Steam for Turbomachinery and Other Flow Calculations. J. Eng. Gas Turbines Power 1988, 110, 1–7. [Google Scholar] [CrossRef]
  46. Young, J. Spontaneous condensation of steam in supersonic nozzles. Physicochem. Hydrodyn. 1982, 3, 57–82. [Google Scholar]
  47. Sriveerakul, T.; Aphornratana, S.; Chunnanond, K. Performance prediction of steam ejector using computational fluid dynamics: Part 1. Validation of the CFD results. Int. J. Therm. Sci. 2007, 46, 812–822. [Google Scholar] [CrossRef]
  48. Pianthong, K.; SeehanaM, W.; Behnia, M.; SriveerakUl, T.; Aphornratana, S. Investigation and improvement of ejector refrigeration system using computational fluid dynamics technique. Energy Convers. Manag. 2007, 48, 2556–2564. [Google Scholar] [CrossRef]
Figure 1. Configuration of a typical steam ejector and flow characteristic along the axis of the steam ejector.
Applsci 09 01486 g001
Figure 2. Characteristic curve of a steam ejector at a fixed temperature [10].
Applsci 09 01486 g002
Figure 3. (a) Enthalpy-entropy diagram of the working process in the nozzle of the steam ejector. (b) Main view of the ejector refrigeration system (c) Steam ejector. (d) Three-dimensional isometric side view of the system.
Applsci 09 01486 g003
Figure 4. An enlarged view of the structural mesh system applied in the steam ejector fluid domain.
Applsci 09 01486 g004
Figure 5. Comparison of velocity distribution along the axial position for different meshes.
Applsci 09 01486 g005
Figure 6. Comparison of static pressure distribution along the ejector wall between wet steam model and experimental data.
Applsci 09 01486 g006
Figure 7. Static pressure distribution along ejector wall between ideal gas model and wet steam model against the experimental data.
Applsci 09 01486 g007
Figure 8. Axial static pressure distribution of different turbulence models against the experimental data.
Applsci 09 01486 g008
Figure 9. Static pressure distribution of different wall functions against the experimental data.
Applsci 09 01486 g009
Figure 10. Axial static temperature distribution of different wetness of inlet flows based on the wet steam model.
Applsci 09 01486 g010
Figure 11. Contours of droplets nucleation rate with different wetness of inlet flows.
Applsci 09 01486 g011
Figure 12. Entrainment Ratio of different wetness of inlet flows.
Applsci 09 01486 g012
Table 1. Detailed dimensions for the inlet and outlet diameter sizes, lengths of the components for the steam ejector.
GeometryValue
Diameter of Nozzle inlet7.75 mm
Diameter of Nozzle outlet8 mm
Diameter of Mixing chamber inlet24 mm
Diameter of Mixing throat19 mm
Length of Nozzle60 mm
Length of Mixing chamber130 mm
Length of Throat95 mm
Length of Diffuse180 mm
Expanded angle of nozzle10°
Nozzle exit position0 mm
Table 2. Temperature and pressure configurations for the primary and secondary inlets.
Inlet FluidTemperature (K)Pressure (Pa)
Primary fluid393.15200,000
Secondary fluid283.151200
Table 3. Different wetness settings for inlet flows.
Case NumberWetness of Primary Flow (Inlet 1)Wetness of Secondary Flow (Inlet 2)
Case 100
Case 200.1
Case 30.10
Case 40.10.1

