Abstract
The self-deployment of nodes with non-uniform coverage in underwater acoustic sensor networks (UASNs) is challenging because it is difficult to access the three-dimensional underwater environment. The problem is further complicated if network connectivity needs to be considered. In order to solve the optimization problem of sensor network node deployment, we propose a maximum coverage and connectivity self-deployment algorithm that is based on ant colony optimization (MCC-ACO). We carry out the greedy strategy, improve the path selection probability and pheromone update system, and propose a self-deployment algorithm based on the foundation of standard ant colony optimization algorithms, so as to achieve energy-saving optimization coverage of target events. The main characteristic of the MCC-ACO algorithm is that it fully considers the effects of the changes in the event quantities and the random distribution of the nodes on the deployment effect of the nodes, ensures that every deployed node can be connected to the sink, and achieves the matching of node distribution density and event distribution. Therefore, the MCC-ACO algorithm has great practical value. A large number of comparative simulation experiments show that the algorithm can effectively realize the self-deployment problem of underwater sensor nodes. In addition, the paper also gives the impact of changes in the number of events in the network on the deployment effect.
1. Introduction
As sensor network research deepens and practical application needs are expanded, three-dimensional sensor networks have attracted increasing attention. In particular, the emergence of underwater network research in recent years has driven the development of three-dimensional sensor network systems [,,]. In marine sensor node deployment, nodes are deployed in a three-dimensional underwater space to achieve the stereoscopic sensing of the monitored region. Figure 1 shows the structure of an underwater movable sensor network system [,]. Sensor nodes that are equipped on autonomous underwater vehicles (AUVs) move to the monitoring sites that are required before utilizing their self-organization ability to carry out network formation and real-time monitoring in order to acquire various monitoring information within the network distribution region. After data integration and other forms of information processing, underwater acoustic communication is used to transmit real-time monitoring information to a sink node on the water surface before a sink on the water surface transmits the real-time information to observers.
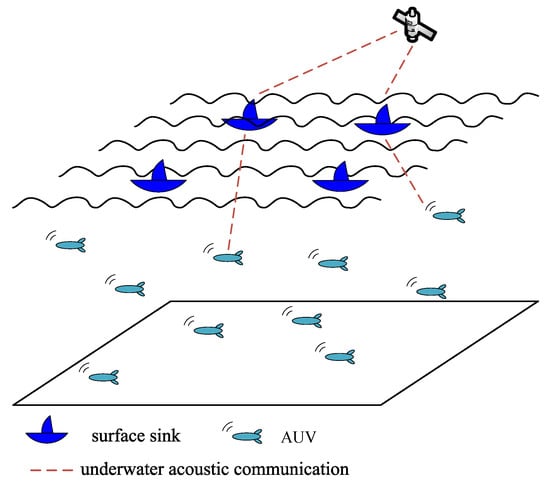
Figure 1.
Underwater mobile sensor network system structure.
Because underwater nodes are often deployed in large areas of water that are sparsely populated by humans, the expensive batteries are not easily changed [,,], and environmental damage causes frequent accidental node failures. Therefore, practical deployment algorithms must simultaneously consider coverage and connectivity [,,,,]. Coverage requires every location in the monitoring region or every crucial location in the monitoring region to be monitored by at least one sensor node. Connectivity requires the network signal to not be segmented, i.e., it requires every deployed node to be connected “many to one” to the sink note. This is different from existing “point-to-point” communication networks (such as ad hoc networks).
The research background of this study was based on regional point coverage, and the typical applications of these types of problems include environmental monitoring systems and target monitoring systems. In this type of application, a regional “event” that can partially represent environmental parameters is usually selected as the “monitoring point” for coverage (i.e., the node deployment for point coverage is actually completed). Monitoring the environmental parameters of these selected regional points enables a more accurate reflection of the environmental situation of the entire region. Therefore, the goal of the coverage design is to optimize the coverage of these selected monitoring points.
In order to solve the coverage problems for target events in three-dimensional space, this study employs cubic modeling for underwater three-dimensional spaces. What is more, a coordinate system for a three-dimensional grid is used to represent the location of the nodes in order to propose an ant colony optimization-based self-deployment algorithm that maintains maximum coverage and connectivity. This algorithm was used to search for the optimal combinations in the network in order to achieve high network coverage and full connectivity (i.e., a connectivity rate of one). In contrast to conventional deployment protocols, our contribution mainly reflects the following two aspects:
- (1)
- We convert the solution for the node locations into a combinatorial optimization problem for processing. This method establishes a heuristic search strategy for the network based on standard ant colony optimization algorithms in order to select valid nodes in candidate network nodes and to achieve full coverage of target events and connection between every node and the sink.
- (2)
- Taking into account the slow convergence speed and large search blindness of standard ant colony optimization algorithms, we also improve the path probability selection and pheromone updating mechanisms of a standard ant colony optimization algorithm in this study.
The rest of this paper is organized as follows: Section 2 will introduce the related work of this study. Section 3 describes the research question of this paper and introduces the node sensing model. Section 4 further elaborates on the specific details of the MCC-ACO algorithm. Section 5 describes the algorithm simulation and performance evaluation, and Section 6 summarizes this paper.
2. Related Works
In the node deployment design for sensor networks, node deployment problems can be classified into continuous point deployment and grid-based point deployment problems based on the different modeling methods for the deployment region. In continuous point deployment, the deployment region is considered a collection of infinite candidate deployment points; i.e., sensor nodes can be deployed anywhere in the monitoring region. In grid-based point deployment design, the region is divided into a grid that can be uniform or non-uniform. The advantage of grid division is that it can simplify the problem and it can restrict the solution space to a limited set of candidate points, thereby allowing the usage of classical linear programming or artificial intelligence methods in order to find the solution. The following section will elaborate on some study results from these two types of solution protocols.
Li et al. [] proposed a three-dimensional virtual forces deployment algorithm in which a two-dimensional virtual forces deployment algorithm [] was expanded to a three-dimensional space. This algorithm is suitable for use in an underwater three-dimensional environment because it can increase network coverage and connectivity, but it cannot ensure the full connectivity of the network (i.e., a connectivity rate of one). Further, the calculation results of this method are highly dependent on the initial random scattering results. Therefore, the results have not been confirmed. In order to carry out effective coverage of the events in the monitored waters, Du et al. [] proposed a particle swarm-inspired underwater sensor network deployment algorithm in which the particle swarm optimization and the congestion control were combined in order to solve the network coverage problems effectively. This method has low complexity, a fast convergence speed, and an achievable distribution, but its network connectivity cannot be guaranteed. In order to carry out effective coverage of events in the monitored water, Wang et al. [] further proposed a distributed hybrid fish swarm optimization algorithm based on the particle swarm-inspired node deployment algorithm. This method makes full use of the behavioral characteristics of fish swarms to establish information pools, increase the global search capacity of a fish swarm, avoid the blind movement of nodes, and extend the network life cycle. However, this algorithm only considers the event coverage of the network, so high network connectivity cannot be obtained.
With the continuous development of sensor network application technologies, the demand for a viable network design tool has become increasingly urgent. With regard to achievable engineering, moderate precision, and flexible expansion, grid-based network deployment protocols all show great advantages. Therefore, grid-based network design has become an active field in the current research on node deployment problems. Pompili [] proposed two-dimensional and three-dimensional underwater wireless sensor network structures and a deterministic deployment protocol based on a mathematical perspective for the node deployment problems in these structures so that a minimum number of nodes would be used to achieve the full coverage and the full connectivity of the network. Alan et al. [] conducted a study on node deployment problems in three-dimensional wireless sensor networks, and they set the goal of using a minimum number of nodes to achieve full coverage and full connectivity for the network. In their study, the three-dimensional Thiessen polygonal space-filling concept was used for a comparative analysis of the space filling results of a truncated octahedron, a regular tetrahedron, a hexagonal prism, and a rhombic dodecahedron. The results showed that a truncated octahedron space filling method could enable the network to satisfy coverage requirements using the minimum number of nodes. Dhillon et al. [] proposed the maximum average coverage deployment (MACD) algorithm, used the grid model to simulate the monitored region, and used greedy iterative strategies to complete the node deployment. As a new type of swarm intelligence optimization algorithm, ant colony algorithm (ACO) has the advantages of positive feedback, being distributed, parallel, self-organizing, etc., and has fewer adjustable parameters, which is suitable for node deployment in large-scale complex environments of UASNs. Based on the ant colony optimization (ACO) algorithm, Huang et al. [] proposed a sensor node deployment strategy, which can effectively avoid the blindness of node movement. However, there are many disadvantages such as too many nodes participating in the movement and too many redundant nodes. Therefore, Qasim et al. [] proposed a three-dimensional grid minimum cost deployment algorithm based on ant colony optimization. The algorithm modifies the standard ACO algorithm to achieve node sparse deployment, but it is easy to fall into local optimization in the late iteration, while the algorithm execution time is longer.
The aforementioned algorithms can achieve high network coverage and connectivity, or even full coverage and full connectivity. However, these algorithms require a high density of nodes, which is not suitable for the application scenario of the sparse deployment of UASNs. Furthermore, these methods do not consider the communication problems between nodes and the effects of the sink location on the deployment strategies. Therefore, these methods have great limitations.
3. Preliminaries
3.1. 3D Underwater Space Model
This paper mainly studies the deployment design of sensor nodes based on grid division. In order to simplify the problem, the cubic modeling of the region to be monitored was carried out in order to determine the three-dimensional coordinate system of the water body [], as shown in Figure 2. The entire monitored water area was divided into several cubic grids with an edge length of l (known as the grid resolution). The vertex of every grid was used as the corresponding grid point, and these grid points were used to represent the entire grid. Generally speaking, the smaller the edge length l was, the greater the accuracy was. In the model in Figure 2, if the grid points in the grid are potential candidate sites for node distribution, then the main task in the node deployment problem for UASNs is selecting the candidate grid points for the deployment of the sensor nodes. This ensures that all of the deployed nodes are connected to the sink while also ensuring that the set of the deployed sensor nodes can cover all of the events. This problem is defined as the maintaining maximum coverage and connectivity (MMCC) problem.
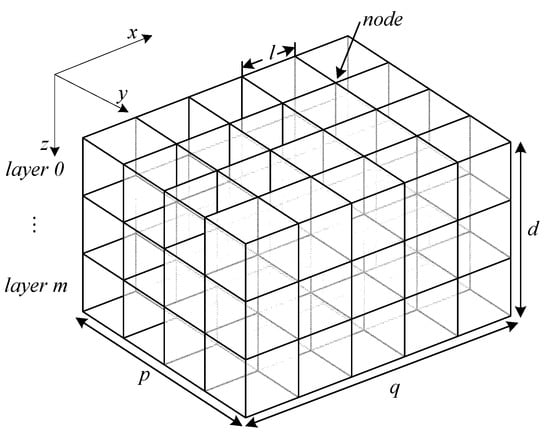
Figure 2.
Coordinate system for the underwater three-dimensional space.
3.2. Node Sensing Model
The Boolean perceptual model [] is the most common and most basic node-sensing model that is used to describe the sensing capabilities of the nodes on the surrounding monitored water areas. The function can be used to represent whether an event is covered by the node :
Here, , represent the three-dimensional coordinates of the node . represent the three-dimensional coordinates of the event, and represents the sensing radius of the node. It should be noted that the targets that the user is interested in are defined as events. In addition, we can see from the underwater three-dimensional space model that the coordinates of the node correspond to the grid point . When the function is one, this means that the event is covered by the node . By combining this function with Equation (1), the coverage of the event can be defined as:
where is the number of nodes. By combining this equation with the coverage equation, the function can be defined in order to represent whether the event is covered:
When the function is zero, this means that the event is not covered by the node.
3.3. Problem Formulation
Assume the user-interested target in the area A to be monitored is called an event e, and the event set . At the same time, assume that in order to achieve full coverage of the event and full connectivity of the network, n sensor nodes need to be deployed. The sensor node set (referred to as the node set ) and any node have the same sensing, communication, and mobility capabilities. Then, the MMCC problem studied in this paper can be described by the following mathematical model:
where is the moving distance of the node. The objective function (4) describes the length of the minimum moving distance, which belongs to the global optimization goal. The constraint Equation (5) indicates that each monitoring event is covered by at least one node. At the same time, the constraint Equation (6) indicates that each node must be connected to the BS. If there is a single-hop or multi-hop path connecting the node to the BS, the node is said to be BS-connected, and the function of the BS will return to one, otherwise it will return to zero.
4. Maintaining Maximum Coverage and Connectivity Scheme
4.1. Design Principles
Ant colony optimization algorithms were proposed based on inspiration from actual research on ant colony behavior. These algorithms are some of the most successful examples of swarm intelligence systems. Ant colony optimization algorithms have been applied to many types of problems such as typical tourist agency problems in order to optimize the problems of communication networks [,,,].
Ant colony optimization algorithms have demonstrated good performance when dealing with the traveling salesman problem (TSP). In this study, we introduced an ant colony optimization algorithm into the node deployment problem of sensor networks in order to propose a maximum coverage and connectivity self-deployment algorithm that was based on ant colony optimization (MCC-ACO). Furthermore, the grid point of each deployed candidate sensor node was analogous to the city points in the TSP problem, and all of the covered events were analogous to the task termination of postmen.
The primary design consideration for MCC-ACO was to ensure that every sensor node in the deployment could be connected to the sink node in order to ensure network connectivity. The method used in this paper involved enabling the initial site deployment of the ants to be within the communication radius of the sink. Following this deployment, the movement radius of the ants was limited in order to make this radius lower than the communication radius and to ensure that the grid point that every ant moved to was directly connected to the sink node (or through other deployed sensor nodes). In this way, when the ants continuously moved, the sensor nodes in the deployment continuously increased. In the end, the set of sensor nodes in the deployment could cover all of the monitoring points, and the first iteration of ants was completed.
The movement process of the ants is explained by Figure 3a–c. As shown in Figure 3a, Node 1 in the deployment was directly connected to the sink. After the deployment of Node 1, the candidate network area of the deployment sensor nodes was further expanded to the blue sensing region in Figure 3a. Any sensor node deployed in this region could connect to the sink. After a grid point was selected in the blue sensing region in Figure 3a for the deployment of the sensor node, the candidate network area in the blue sensing region was further expanded, as shown in Figure 3b. This deployment was successively carried out for Sensor Nodes 3, 4, and 5 until all events (stars) were completely covered, as shown in Figure 3c. Through this node deployment, we could ensure that all of the deployed nodes were connected to the sink. The following section explains the problem of ensuring that the minimum number of nodes was used to achieve coverage, which was a problem that could be solved using the ant colony optimization algorithm.
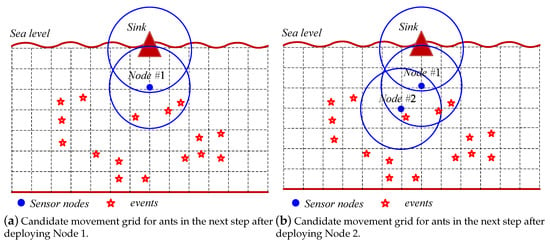
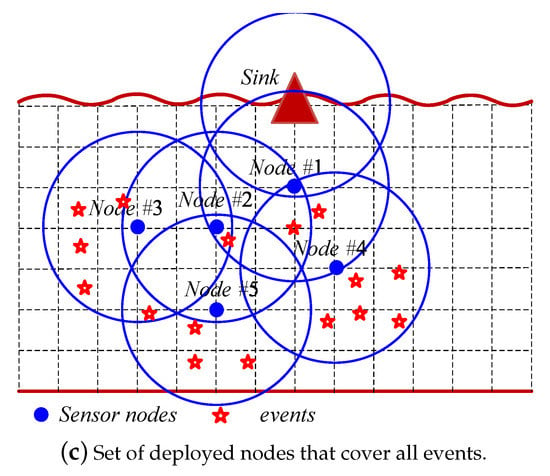
Figure 3.
Schematic diagram of the movement process of ants.
4.2. Design of the MCC-ACO Algorithm
In the basic algorithm of the MCC-ACO, the basic ant colony optimization algorithm model is introduced in the design for sensor network deployment. However, as mentioned above, the initial background for proposing the ant colony optimization algorithm involves the solutions of non-deterministic polynomial (NP) problems that are represented by a TSP problem when the scale of the problem is limited. When the number of grids in the partitions is extremely large, there will be some scalability problems when the ant colony optimization algorithm is introduced into the node deployment problems. If ant colony optimization algorithms are used in this instance, this will result in poor scalability, low algorithm efficiency, and even situations that have no solutions. Therefore, there is no need to establish a model that is suitable for an ant colony optimization algorithm based on the sensor node deployment in grid partitions, but existing ant colony optimization algorithms should be revised to achieve some scalability. This paper established a suitable model for basic ant colony optimization algorithms and carried out appropriate revisions based on the application background, which is described as follows.
(1) Introduction of the Greedy Mechanism
As shown in Figure 3, as the ants move, more and more candidate grids can be selected for deploying sensor nodes in the next step (as shown by the blue coverage area in the figure). It will increase the chances of different choices of ants, so the search will be more random, the convergence speed of the algorithm will drop sharply, and the final result will be very close to the performance of the random algorithm. In the TSP problem, due to the small number of cities (tens of nodes), the non-random convergence of the ant colony algorithm can be guaranteed, but in the sensor network, when the number of grid nodes is greatly expanded (often tens of thousands of grids can be reached), ants will fall into the dilemma of the random search and random pheromone enhancement. Therefore, this paper introduces the greedy strategy in the ant search process. The core idea is to eliminate the grid points that do not contribute to the completion of the coverage in the candidate grid, so as to narrow the range of candidate grid points.
For ease of explanation, three definitions are introduced below:
Definition 1.
Candidate grid point set : Define the candidate set of the next target grid point that can be selected when the ant moves to a grid point to be . After the ant is deployed in the initial position, the ant adds the grid point of the deployment location to the selected point set and then updates the set according to the rules that can be connected to the sink (as shown in Figure 3. can be expressed as:
where is the coordinate of the candidate grid points in ; is the coordinate of the deployed nodes in monitored area A.
Definition 2.
Unfamiliar monitoring point: If a monitoring point is not covered by any deployed sensor nodes, define such monitoring points as “unfamiliar monitoring points”.
Definition 3.
Effective candidate grid point set : Define the effective grid point set as the grid points in the set that can cover the “unfamiliar monitoring points”. If represents the location of an unfamiliar monitoring point, then can be expressed as:
where is the coordinate of the candidate grid point in .
In the actual design of the algorithm, a matrix variable is used to represent the set of grid points that the ant can select next, and then, ant colony search with the greedy strategy is expressed as:
The core idea of the greedy strategy is to select the grid points that can cover the “unfamiliar monitoring points” from the ant’s next set of optional grid points as the candidate computing grid points. If for some reason, such candidate grid points do not exist, the algorithm discards the greedy strategy and uses the original set of candidate grid points for calculation.
(2) Path-selection probabilities
The initial task of the ant colony optimization algorithm is the solution of NP problems. Therefore, a specific application model needs to be established in accordance with the specific problem when introducing the problem into the sensor node deployment design. The ant colony optimization model for the MCC-ACO algorithm is shown as follows:
In the MCC-ACO, the movement probability of the k node from the grid point i to the grid point j is defined as shown in Equation (10) [,,]:
where represents the pheromone density in the path at time t. Heuristic information is used to guide the node to move towards the grid point using a shorter path.
According to the theory of the ant colony optimization algorithm, and show the relative importance between the previous empirical data and this independent search. Here, the heuristic information factor reflects the relative importance of the cumulative amount of information (residual information content) of the node during the movement in the node search process. The expected heuristic factor affects the relative importance of the heuristic information (expectation) of the node during the movement in the guiding node search. From Equation (10), we can see that if = 0, then Equation (10) degrades into a completely greedy algorithm, i.e., every ant only chooses the best current grid point to which to move. If = 0, then every ant selects the next grid point to hop to, based on existing experience. This limits the innovative search capabilities of the ants. In MCC-ACO, if the value of the influence factor is constant, it will affect the convergence of the algorithm. In order to speed up the convergence of the initial stage and avoid rapid local convergence, we modify the value of the impact factor as follows.
where and are constants and ,. n refers to current search times. represents the maximum number of search. The value of will decrease as the number of searches n increases. In this way, a relatively fast search speed is employed in the early stages of the search. As the algorithm progresses, the search speed will gradually slow down.
If variable is used to indicate the number of unfamiliar monitoring points, then we can use the improved heuristic value from the following equation:
where the first term is a constant whose main function is to prevent the denominator in Equation (10) from having a value of zero. The second term represents the potential number of events that can be monitored in the sensing radius of the next step, which aids in driving the node to move to the maximum candidate points and accelerate the convergence of the algorithm. In addition, we added the third term for the heuristic value ( represents the Euler distance between the current node and the candidate node) and introduced the scaled distance variable. The function of this variable is to ensure that the choice of the next point is at a further grid point in order to obtain a sparse deployment network and reduce the total number of sensors. It should be noted that the valid candidate points refer to grid points that can monitor events.
The movement relationship that comprises Equations (10) and (12) is termed a pseudorandom rule. This rule tends to select short grid points with high pheromone density as a movement direction.
(3) Pheromone updating
During the process of the event search, the node will release pheromones in the paths taken by it, and the local updating of pheromones is carried out using Equation (13):
where is the threshold value and c is the number of mobile search nodes. represents the evaporation coefficient of the existing pheromones and reflects the evolution status of the entire ant colony system. The magnitude of this variable directly affects the global search capabilities and convergence speed of the MCC-ACO, and its value is determined mainly based on practical experience and repeated debugging. is used to simulate the natural evaporation process of the pheromones that are left on the movement path. The aim of introducing the natural evaporation process is to ensure that poor grid point selections will be removed slowly, along with the evaporation of the existing pheromones as the iteration progresses, in order to reduce the “attractiveness” to subsequent nodes. Therefore, the evaporation coefficient has a “survival of the fittest” function. represents the added pheromone on a grid point after the node has passed that grid point. This value is determined by the solution provided by that node. Nodes that have completed the task with the lowest number of hops will leave the highest level of pheromones on the grid point. This will attract the following ants and cause them to follow these grid points to continue to search for better solutions. Therefore, has a role as an empirical value, and it is defined as:
where Q is a constant that represents the number of tracks left by the ants, and its value is not affected by changes in . L represents the distance of the movement of the node in the current iteration. It should be noted that the variable L shows the degree of global optimization. When the node has completed its task, the length of its movement distance is calculated before updating the pheromones in the grid points through which the node has passed. Thus, a good movement path for a node will attract subsequent node iterations, and the nodes will use this mutual exchange and attraction to complete the optimization behavior for a colony. Based on the above discussion, we obtained a complete self-deployment algorithm for maintaining the maximum coverage and connectivity in underwater sensor networks based on an ant colony optimization, as shown in Algorithm 1.
| Algorithm 1 Detailed description of MCC-ACO. |
|
5. Simulation and Performance Evaluation
In order to validate the performance of the MCC-ACO algorithm fully in this study, we carried out multiple Monte Carlo simulation experiments for underwater (3D) node deployment in a MATLAB simulation environment. First, we simulated the node deployment optimization process for a three-dimensional underwater sensor network and analyzed the MCC-ACO algorithm when one instance was run on the node deployment platform. Subsequently, The NDSBAalgorithm [] and the ACO-MCC3D algorithm [] are typical ACO-based deployment algorithms, so these two algorithms were chosen for comparisons. The performance of the NDSBA algorithm, the ACO-MCC3D algorithm, and the MCC-ACO algorithm were compared using the following evaluation indicators: moving distance, number of node deployments, and node distribution density. The computing platform for the operating algorithm simulation was an Intel(R) Core(TM) i7-3770 CPU @ 3.40 GHz (4CPUs) processor, 8 GB RAM, and Windows 7 operating system. During the simulation, we referred to [,], and the parameters of this algorithm and the experimental parameters were set as: = 1, = 0.2, = 86, c = 5, = 1, = 5, = 15 m, = 15 m, = 0.5, and = 50.
5.1. Convergence of the MCC-ACO
In order to verify the fast convergence characteristics of MCC-ACO, under the same condition, we evaluated the calculation time and number of nodes deployed in MCC-ACO of UASNs with different grid sizes and compared this with the results of the standard ant colony algorithm (ACO). In order to eliminate the random effects of the experiment, the final result was taken from the average of 30 experiments.
In general, due to the evolutionary constraints of the standard ACO, many iterations are required to generate the optimal solution. However, as search rules improve, MCC-ACO is able to obtain an optimal solution with fewer iterations, with fewer nodes to deploy. We compared the MCC-ACO’s computation time and number of node deployments with the standard ACO calculation time and number of node deployments at different grid sizes. The corresponding test results are shown in Table 1.

Table 1.
The statistic results of the experiments.
From Table 1, it is obvious that MCC-ACO can provide better node deployment solutions than standard ACO with the increase of the grid size. We can see that with the increase of the grid size, the number of nodes deployed by the MCC-ACO scheme was much larger than that of the standard ACO scheme. This is because MCC-ACO can effectively eliminate invalid solutions. Its performance is independent of grid size and only related to the location of event distribution. The standard ACO scheme contains redundant nodes. In addition, when the grid size was less than 8 × 8 × 8, MCC-ACO took more computing time, while when the grid size was larger than 8 × 8 × 8, the computing time of standard ACO increased exponentially. This is because when the network scale is small, the solution space to be searched is small. Compared with standard ACO, the computational complexity of MCC-ACO is larger, and its performance advantage is not obvious enough. However, when the grid scale increases, the advantage of MCC-ACO becomes more obvious. In short, the convergence and solution ability of MCC-ACO are better than those of standard ACO.
5.2. Algorithm Simulation and Analysis
We conducted three sets of experiments in a 50 m × 50 m × 50 m three-dimensional underwater monitoring region. For Experiment 1, 10 events were randomly distributed. For Experiment 2, 20 events were randomly distributed. For Experiment 3, 30 events were randomly distributed. It should be noted that the interval was set as 10 m, i.e., there were 6 × 6 × 6 grid points in the three-dimensional underwater monitoring region.
We employed the MCC-ACO algorithm to achieve the deployment of the sensor nodes. The operation results are shown in Figure 4, Figure 5 and Figure 6. The red stars represent events, and the blue dots represent the locations of the nodes (the sphere is the three-dimensional sensing range). It can be seen that the MCC-ACO algorithm can achieve event coverage with all of the nodes, and the deployed nodes can all connect to the sink. More importantly, the node distribution density and the event distribution density achieved a good fit.
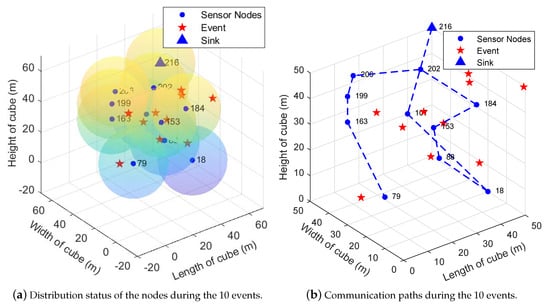
Figure 4.
Experiment 1: 10 events that were randomly distributed (unit: m).
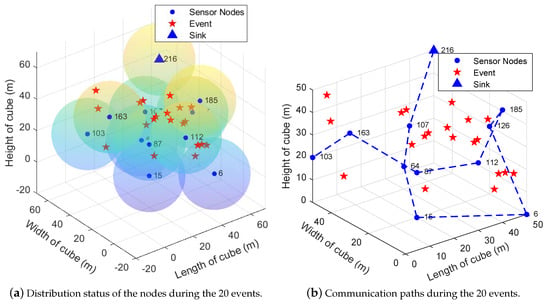
Figure 5.
Experiment 2: 20 events that were randomly distributed (unit: m).
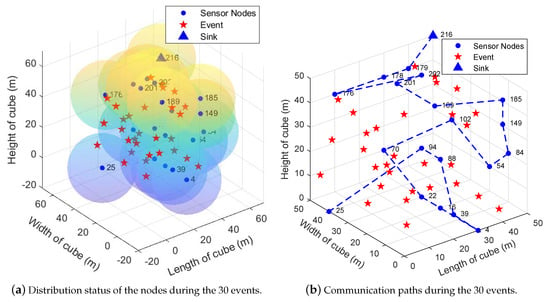
Figure 6.
Experiment 3: 30 events that were randomly distributed (unit: m).
In addition, Table 2 shows the statistical results of the aforementioned experiments in detail. represents the length of the communication path, and represents the number of deployed nodes. In order to eliminate the random effects in the experiments, the mean of 20 experiments was taken for every set of experiments, and the number of deployed nodes and the lengths of communication paths were recorded. It is clear that as the number of events increased, the number of nodes to be deployed increased correspondingly. In addition, the distances of the data transmission paths also increased. This was because the events were randomly distributed and relatively scattered. Hence, some nodes were needed to cover events, while other nodes were needed to maintain the connection between the nodes and the sink even though they did not cover events.

Table 2.
Experimental statistical results.
In the following section, this paper divides the 50 m × 50 m × 50 m three-dimensional underwater monitoring region into 25 × 25 × 25 grid points. The performance of the three algorithms is compared when the sensing radius and communication radius are 10 m and 20 m, respectively.
Figure 7a,b shows a comparison of the number of deployed nodes for different numbers of events. It can be seen that when the number of events was the same, the number of nodes that were required for deployment in the MCC-ACO and ACO-MCC3D algorithms was relatively lower than the number of nodes that was required for the NDSBA algorithm. This was because these two deployment strategies improved on the heuristic search rules. Consequently, further grid points were preferentially selected, producing a sparse deployment network and reducing the total number of deployed nodes. In addition, compared with the ACO-MCC3D algorithm, the algorithm proposed in this paper required a lower number of deployed nodes. This was mainly because the deployment strategy of this node was carried out for the condition of full connectivity, so the tabu table could record the distribution status of each node, thereby effectively preventing overlap between nodes. Therefore, the number of deployed nodes decreased under specific spatial conditions. By comparing Figure 7a,b, we can see that the number of nodes required for all of the deployment methods increased as the number of events increased. This was because more events required more nodes to cover them. In addition, when the node sensing space covered the entire monitoring region, as the number of events increased, the number of nodes remained essentially unchanged, as shown in Figure 7b.
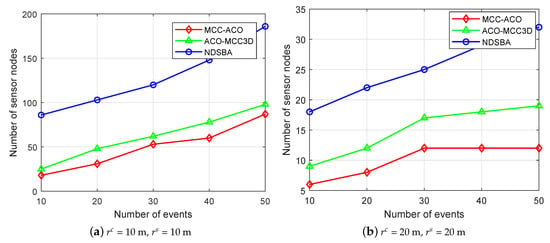
Figure 7.
Comparison of the number of deployed nodes for different numbers of events.
Figure 8a,b shows the comparison of the distribution density of the deployed nodes for different numbers of events. The three algorithms can achieve good results in network coverage, but there are many differences in node distribution density. The events in the grid were randomly distributed, causing the node deployment to not only cover events, but also to ensure consistency between the node distribution density and the event distribution density as much as possible []. Based on the statistical methods for node distribution density proposed by Du et al. [], we compared the fit between the node distribution density and the event distribution density of the three algorithms. From the figure, we can see that when the three algorithms were compared, the MCC-ACO algorithm proposed in this paper can achieve high coverage performance, which was generally maintained at above 0.9. This is mainly because the NDSBA and ACO-MCC3D algorithms tended to obtain local optimal solutions and their nodes tended to move blindly. These algorithms do not consider the fit between the node distribution and the event distribution. However, the MCC-ACO algorithm utilizes the characteristic of network full connectivity to record the distribution status of all of the nodes in the network and establish a tabu table so that overcrowding in certain sites is avoided during the movement of nodes, thereby avoiding multiple coverage of events. In addition, from Figure 8a,b, we can see that when the node sensing radius and the communication radius are smaller and when the number of events is lower, there is no need for an excess number of nodes to cover events. However, more nodes are required to maintain the communication between nodes and the sink. Therefore, the coverage performance of the event set is smaller. As shown in Figure 8a, as the number of events increases, the fit relationship becomes better, and this relationship maintains a relatively high value, as shown in Figure 8b.
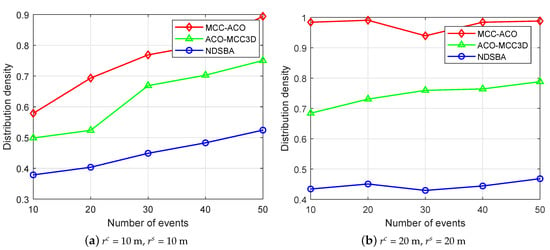
Figure 8.
Comparison of the distribution density of the deployed nodes for different numbers of events.
6. Conclusions
The grid-based node deployment design of underwater sensor networks is currently one of the research hotspots in artificial node deployment. In this study, we developed an energy-saving node deployment algorithm MCC-ACO (with a preference for node movement distance), and we used this algorithm as a basis to analyze the algorithm operating mechanisms in detail. We demonstrated the operation results of the node deployment algorithms. According to the analysis of the results of the simulation, the proposed MCC-ACO algorithm outperformed the existing solutions of the NDSBA algorithm and ACO-MCC3D algorithm by 20∼50% in the number of deployed nodes’ reduction; meanwhile, the distribution density of nodes tended to be more reasonable. The greatest characteristic of the MCC-ACO algorithm is that it fully considers the effects of the random distribution of underwater events and the unequal number of events involved in the sensor node deployment, ensuring that every deployed node is connected to the sink.
Based on existing studies, the next step of this work is to consider the effects of the algorithm parameter selection on the sensor network deployment performance while considering the feasibility design problem of the network. Many network applications must not only satisfy the connectivity and coverage requirements, but also satisfy the requirements of a more reliable network design.
Author Contributions
H.W. and L.Z. conceived of and designed the whole procedure of this paper. Y.L. and Y.F. contributed to the Introduction and System Model Sections. Z.L. performed the computer simulation and analyzed the results.
Funding
This research was supported by the National Natural Science Foundation of China (61571250), the Zhejiang Natural Science Foundation (LY18F010010), the Key Laboratory of Mobile Network Application Technology of Zhejiang Province, the K. C. Wong Magna Fund of Ningbo University, the Youth Project of Ningde Normal University(2017Q105,2018Q103), the Education Department of Fujian Province (JT180596), the Teaching Reform Project of the Ningde Teachers College(JG2018012) and the project of the Fujian Provincial Natural Science Fund (2017I0016,2017J01775,2015J01660).
Conflicts of Interest
The authors declare no conflict of interest.
References
- Davis, A.; Chang, H. Underwater wireless sensor networks. In Proceedings of the IEEE 2012 Oceans, Hampton Roads, VA, USA, 14–19 October 2012; pp. 1–5. [Google Scholar]
- Wang, Z.; Zhou, S.; Wang, Z. Underwater Distributed Antenna Systems: Design Opportunities and Challenges. IEEE Commun. Mag. 2018, 56, 178–185. [Google Scholar] [CrossRef]
- Ayaz, M.; Baig, I.; Abdullah, A.; Faye, I. Review: A survey on routing techniques in underwater wireless sensor networks. J. Netw. Comput. Appl. 2011, 34, 1908–1927. [Google Scholar] [CrossRef]
- Luo, H.; Wu, K.; Ruby, R.; Hong, F.; Guo, Z.; Ni, L.M. Simulation and Experimentation Platforms for Underwater Acoustic Sensor Networks: Advancements and Challenges. ACM Comput. Surv. 2017, 50, 28–72. [Google Scholar]
- Pompili, D.; Melodia, T.; Akyildiz, I.F. Void-Handling Techniques for Routing Protocols in Underwater Sensor Networks: Survey and Challenges. IEEE Commun. Surv. Tutor. 2017, 19, 800–827. [Google Scholar]
- Darehshoorzadeh, A.; Boukerche, A. Underwater Sensor Networks: A New Challenge for Opportunistic Routing Protocols. IEEE Commun. Mag. 2015, 53, 98–107. [Google Scholar] [CrossRef]
- Wang, H.; Li, Y.; Chang, T.; Chang, S. An Effective Scheduling Algorithm for Coverage Control in Underwater Acoustic Sensor Network. Sensors 2018, 18, 2512. [Google Scholar] [CrossRef]
- Bicen, A.O.; Sahin, A.B.; Akan, O.B. Spectrum-aware underwater networks: Cognitive acoustic communications. IEEE Trans. Veh. Technol. Mag. 2012, 7, 34–40. [Google Scholar] [CrossRef]
- Akkaya, K.; Newell, A. Self-deployment of sensors for maximized coverage in underwater acoustic sensor networks. Comput. Commun. 2009, 32, 1233–1244. [Google Scholar] [CrossRef]
- Sandeep, D.N.; Kumar, V. Review on Clustering, Coverage and Connectivity in Underwater Wireless Sensor Networks: A Communication Techniques Perspective. IEEE Access 2017, 5, 11176–11199. [Google Scholar] [CrossRef]
- Wang, C.; Lin, H.; Jiang, H. CANS: Towards Congestion-Adaptive and Small Stretch Emergency Navigation with Wireless Sensor Networks. IEEE Trans. Mob. Comput. 2016, 15, 1077–1089. [Google Scholar] [CrossRef]
- Senel, F.; Akkaya, K.; Erol-Kantarci, M.; Yilmaz, T. Self-deployment of mobile underwater acoustic sensor networks for maximized coverage and guaranteed connectivity. Ad Hoc Netw. 2015, 34, 170–183. [Google Scholar] [CrossRef]
- Detweiler, C.; Doniec, M.; Vasilescu, I.; Rus, D. Autonomous depth adjustment for underwater sensor networks: Design and applications. IEEE/ASME Trans. Mechatron. 2012, 17, 16–24. [Google Scholar] [CrossRef]
- Li, X.; Ci, L.; Yang, M.; Tian, C.; Li, X. Deploying Three-Dimensional Mobile Sensor Networks Based on Virtual Forces Algorithm. Commun. Comput. Inf. Sci. 2012, 334, 204–216. [Google Scholar]
- Zou, Y.; Chakrabarty, K. Sensor deployment and target localization based on virtual forces. In Proceedings of the 22th Annual Joint Conference of Computer and Communications, San Francisco, CA, USA, 30 March–3 April 2006; pp. 1293–1303. [Google Scholar]
- Du, H.; Xia, N.; Zheng, R. Particle swarm inspired underwater sensor self-deployment. Sensors 2014, 14, 15262–15281. [Google Scholar] [CrossRef] [PubMed]
- Wang, H.; Li, Y.; Chang, T.; Chang, S.; Fan, Y. Event-Driven Sensor Deployment in an Underwater Environment Using a Distributed Hybrid Fish Swarm Optimization Algorithm. Appl. Sci. 2018, 8, 1638. [Google Scholar] [CrossRef]
- Alam, S.N.; Haas, Z. Coverage and connectivity in three-dimensional networks. In Proceedings of the 12th Annual ACM International Conference on Mobile Computing and Networking, Los Angeles, CA, USA, 24–29 September 2006; pp. 346–357. [Google Scholar]
- Dhillon, S.S.; Chakrabarty, K. Sensor placement for effective coverage and surveillance in distributed sensor networks. In Proceedings of the Wireless Communications and Networking, New Orleans, LA, USA, 16–20 March 2003; pp. 1609–1614. [Google Scholar]
- Huang, G.; Chen, D.; Liu, X. A Node Deployment Strategy for Blindness Avoiding in Wireless Sensor Networks. IEEE Commun. Lett. 2015, 19, 1005–1008. [Google Scholar] [CrossRef]
- Qasim, T.; Zia, M.; Minhas, Q.A.; Bhatti, N.; Saleem, K.; Qasim, T.; Mahmood, H. An ant colony optimization based approach for minimum cost coverage on 3-D grid in wireless sensor networks. IEEE Commun. Lett. 2018, 22, 1140–1143. [Google Scholar] [CrossRef]
- Cayirci, E.; Tezcan, H.; Dogan, Y.; Coskun, V. Wireless sensor networks for underwater surveillance Systems. Ad Hoc Netw. 2006, 4, 431–446. [Google Scholar] [CrossRef]
- Ghosh, A.; Das, S.K. Coverage and connectivity issues in wireless sensor networks: A survey. Pervasive Mob. Comput. 2008, 4, 303–334. [Google Scholar] [CrossRef]
- Pan, R.; Chua, D.; Pathmasuntharam, J.S.; Xu, Y.P. An Opportunistic Relay Protocol with Dynamic Scheduling in Wireless Body Area Sensor Network. IEEE Sens. J. 2015, 15, 3743–3750. [Google Scholar] [CrossRef]
- Wang, Z.; Xing, H.; Li, T.; Yang, Y.; Qu, R.; Pan, Y. A Modified Ant Colony Optimization Algorithm for Network Coding Resource Minimization. IEEE Trans. Evol. Comput. 2016, 20, 325–342. [Google Scholar] [CrossRef]
- Abouei, J.; Plataniotis, K.N.; Pasupathy, S.; Pasupathy, S. On the Energy Efficiency of LT Codes in Proactive Wireless Sensor Networks. IEEE Trans. Signal Process. 2011, 59, 1116–1127. [Google Scholar] [CrossRef]
© 2019 by the authors. Licensee MDPI, Basel, Switzerland. This article is an open access article distributed under the terms and conditions of the Creative Commons Attribution (CC BY) license (http://creativecommons.org/licenses/by/4.0/).