Article

3D Face Profilometry Based on Galvanometer Scanner with Infrared Fringe Projection in High Speed

1
School of Aeronautics and Astronautics, Sichuan University, Chengdu 610065, China
2
College of Electronics and Information Engineering, Sichuan University, Chengdu 610065, China
3
Artificial Intelligence Key Laboratory of Sichuan Province, Sichuan University of Science and Engineering, Zigong 643000, China
*
Author to whom correspondence should be addressed.
Appl. Sci. 2019, 9(7), 1458; https://doi.org/10.3390/app9071458
Submission received: 22 February 2019 / Revised: 23 March 2019 / Accepted: 1 April 2019 / Published: 7 April 2019
(This article belongs to the Special Issue High-speed Optical 3D Shape and Deformation Measurement)

Abstract

:

Featured Application

In this paper, the galvanometer scanner with infrared fringe projection is introduced for structured light 3D shape metrology. The proposed system has the characteristics of high-speed projection, low-cost, small-size, infrared or visible illumination, and non-contact. It can be used in 3D shape measurement and machine vision inspection. Especially in the field of 3D face recognition, there are a lot of potential applications.

Abstract

Structured light 3D shape metrology has become a very important technique and one of the hot research topics in 3D face recognition. However, it is still very challenging to use the digital light projector (DLP) in a 3D scanner and achieve high-speed, low-cost, small-size, and infrared-illuminated measurements. Instead of using a DLP, this paper proposes to use a galvanometer scanner to project phase-shifted fringes with a projection speed of infrared fringes up to 500 fps. Moreover, the measurement accuracy of multi-frequency (hierarchical) and multi-wavelength (heterodyne) temporal phase unwrapping approaches implemented in this system is analyzed. The measurement accuracy of the two methods is better than 0.2 mm. Comparisons are made between this method and the classical DLP approach. This method can achieve a similar accuracy and repeatability compared to the classical DLP method when a face mask is measured. The experiments on real human face indicate that this proposed method can improve the field of 3D scanning applications at a lower cost.

Graphical Abstract

1. Introduction

Three-dimensional (3D) face measurement has been widely employed in 3D-aided face recognition to overcome the effects of pose, expression, and illumination variations in facial images with great potential in many applications [1]. Dense and accurate 3D point cloud data of a human face can be obtained by fringe projection profilometry (FPP) approaches [2], which have proven to be one of the most promising techniques [3,4,5,6,7] in 3D measurement, and the scanning result is more realistic and accurate than the multi-view images method [8].
Various methods based on projecting different kinds of structured light patterns have been developed and used for face 3D measurement. PS. Huang et al. [9] measured a human face by removing the colour filter of a digital light processing (DLP) projector. In this case, the three sinusoidal fringe patterns with a 120-deg phase shift between neighbouring channels can be compressed to the red, green and blue channels of a one-colour image, and this allows very fast phase-shifted fringe pattern acquisition. Zhang et al. [10,11,12] used different numbers of encoded 1-bit binary dithered patterns or just defocus binary fringes to realize fast 3D surface measurements and a good result was obtained under laboratory conditions. In these works, the performance of TI’s digital micro-mirror device (DMD) projector with high-speed binary images projection was fully developed. Zhao et al. [13] presented a four-step triangular pattern phase-shifting 3D measurement using the motion blur method to measure the moving hand and were able to record 3D data in real time. Zuo et al. [14] used bi-frequency tripolar pulse-width-modulation fringe projection to realize a high-speed three-dimensional shape measurement technique for dynamic scenes; the tripolar pulse-width-modulation technique is employed to generate ideal fringe patterns with a slight defocus. In Reference [15], a novel method of properly optimizing sinusoidal pulse width modulation patterns according to some criteria to further improve the defocusing technique was proposed. Wang [16] proposed a binarized dual phase-shifting approach to improve the phase quality, which can realize error reduction for the binary defocusing technique while maintaining its advantage of 1-bit projection with high-speed. Flores et al. [17] proposed a method to solve the problem of gamma nonlinearity in triangular-pattern phase-shifting profilometry by using synthesizing triangular intensity fringes. All of the above methods modify the DLP projector based on the characteristics of 1-bit fast projection. However, Projector modification is very difficult and the equipment cost is high.
Su and Zhang [18] reviewed some dynamic 3D measurement methods based on Fast Fourier Transform (FFT) fringe analysis with 2-D grating pattern projection and measured a 3D face, however, this method is sensitive to light and the environment for face 3D measurements. Zhang et al. [19] measured a vibrating Chinese drum and dynamic vortex shape in real-time using the Fast Fourier Transform. Except to use the phase information of fringe projection to encode the object surface, some other methods of labelling the object surface by random statistical patterns were proposed. Xue et al. [20] also proposed a method to improve the measurement accuracy by using one colour speckle projection as a set of speckle, but the colour crosstalk increases the instability of the measurement results.
In order to achieve high precision and robust 3D measurement required by 3D face recognition, An et al. [21] presented a phase unwrapping method with pixel-by-pixel based geometric constraints of the structured light system without requiring additional cameras. This has the advantage of taking high-speed measurements without increasing the system complexity or cost. Yang et al. [22] proposed to revise the FPP approaches by combining one code pattern and the geometric constraints in fringe projection to reduce the projection number of grey patterns with a low frame rate projector.
To implement 3D face measurements with an FPP first approach is to project patterns with infrared or near-infrared projection, which can minimize interference to the human eye and avoid discomfort. Then, the projection should be as fast as possible and as few as possible, which can make the imaging process less sensitive to the motion of moving surfaces. Finally, the cost of the projection hardware should be minimized to reduce the cost of the final products and improve its market application.
For example, the successful application of three-dimensional measurement technologies from Microsoft Kinect, Intel RealSense, and Apple iPhone X propels the application development and simultaneously drives the need for better 3D imaging technologies [23], especially for high-precision 3D data measurements for 3D face recognition.
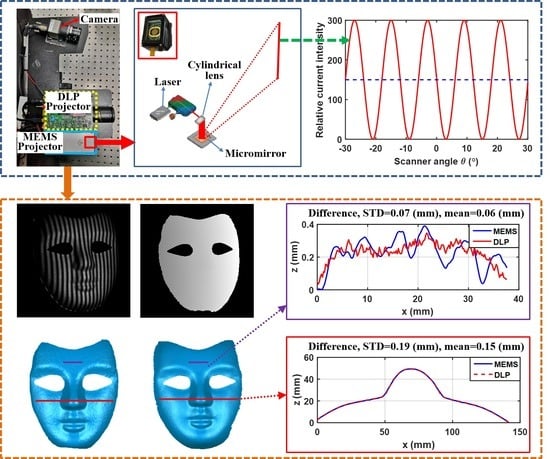
In this research, a galvanometer scanner (labelled as MEMS) device of micro-vibration mirror for sinusoidal laser scanning is used. This device is made by xiaoU technology Co., Ltd. of Qingdao China, and the model of the device is UFGKH0A1IR01. It has one scanning axis with a 32 kHz frequency and an 830 nm laser. In this system, the laser beam is used in combination with a cylindrical mirror to form the scanning line. In principle, the projection speed of the sinusoidal fringes can be up to 32 kHz. However, due to the optical setup, the light intensity is too low to perform any measurement at full speed. Therefore, the fastest scanning speed of the MEMS is 500 fps. This MEMS, with an infrared laser scanning cost less than 100 USD, does not interfere with the human eye and meets the needs of 3D face recognition for measurement accuracy and speed. With an IDS 3250 camera (manufactured by IDS Imaging Development Systems GmbH in Obersulm, Germany), a system that can achieve 3D face acquisition at 8 Hz rate with good quality when using a three-step phase-shifting algorithm is developed successfully. The FPP methods of the multi-frequency (hierarchical) method [24] and multi-wavelength (heterodyne) method [25,26] are investigated and compared in detail both analytically and experimentally. At the same time, the measurement accuracy based on the MEMS applied projector and the traditional DLP projector is compared. This setup demonstrates the fast 3D shape measurements of a real human face.
The paper is organized as follows. The basic principles of fringe projection and the phase-shifting approach of the multi-frequency method and multi-wavelength method are explained in Section 2. Section 3 presents the experimental verifications with different samples such as plane models and human face. Section 4 discusses this setup and the applications. Finally, conclusions are drawn in Section 5.

2. Principles

2.1. The Principle of Fringe Projection Profilometry

A typical FPP system consists of a camera and a projector, as illustrated in Figure 1. The 3D shape can be measured using the principles of triangulation with the matching computation for the correspondence among A, B, and C. The FPP approach is basically to encode the relationship of A, B and C by using the phase-shifting profilometry, which also acquires the highest measurement accuracy with a high resolution since it works in good conditions of illumination and surface reflection [2].
A sequence of fringes is projected onto an object surface by a projector and then the modulated images are captured by the camera; the modulated fringe images can be represented as
I n ( x , y ) = I ( x , y ) + I ( x , y ) cos [ ϕ ( x , y ) + 2 π n / N ] ,
where n = 0, 1, 2, …, N − 1, I ( x , y ) is the average intensity, N is a step of phase shift, I ( x , y ) is the intensity modulation, and ϕ ( x , y ) is the phase function. In Reference [27], the wrapped phase map can be solved by
ϕ ( x , y ) = arctan n = 0 N 1 I n ( x , y ) sin ( 2 π n / N ) n = 0 N 1 I n ( x , y ) cos ( 2 π n / N ) ,
Typically, in the phase-shifting process, N is chosen to be as high as possible to improve the three-dimensional measurement accuracy. For fast 3D measurements, a three-step (i.e., N = 3) phase-shifting algorithm is used for the FPP. The phase provided from Equation (2) is wrapped in the range from −π to π, so a phase unwrapping algorithm has to be adapted to obtain a continuous phase map by removing 2π discontinuities. Mathematically, the relationship between the unwrapped phase Φ ( x , y ) and wrapped phase ϕ ( x , y ) can be described as
Φ ( x , y ) = ϕ ( x , y ) + 2 π k ( x , y )
The key is to determine the variable k ( x , y ) of the absolute fringe order. Here, the order k ( x , y ) is an integer number which can be calculated pixel-by-pixel from a set of fringe patterns with different frequencies with a certain regularity and such methods are shown in subsequently.

2.2. Algorithms of Temporal Phase Unwrapping

For the two different frequencies phase map, the wrapped phase maps are ϕ l and ϕ h , the corresponded unwrapping phase maps are Φl and Φh, and the corresponding frequencies are fl and fh, respectively. The fringe period T express as frequency f is T = 1 / f . The subscripts l and h represent low-frequency and high-frequency, respectively. Obviously, the relationship between the unwrapped phase and the wrapped phase can be written as
{ Φ l ( x , y ) = ϕ l ( x , y ) + 2 π k l ( x , y ) Φ h ( x , y ) = ϕ h ( x , y ) + 2 π k h ( x , y ) ,
where the kl and kh are the integer fringe orders, respectively. It is easy to prove that the high-frequency phase order kh can be calculated by the low-frequency phase order kl as the following relationship
k h ( x , y ) = N I N T [ ( f h / f l ) ϕ l ( x , y ) ϕ h ( x , y ) 2 π ] ,
where NINT is the calculation of the closest integer value. Once one fringe pattern is projected and covers the high-frequency fringe, the unwrapping phase of low-frequency Φl must be required as Φ l = ϕ l . This means the unwrapping phase of a high-frequency can be determined from Equation (4) and Equation (5) as illustrated in Figure 2. This approach is also called multi-frequency temporal phase unwrapping.
The multi-wavelength temporal phase unwrapping approach means the use of fringe projection with different wavelengths. Since the reference phase is also calculated by the two different wrapped phase maps as
ϕ e q ( x , y ) = ϕ h ( x , y ) ϕ l ( x , y ) ,
The equivalent fringe period Teq can be described as
T e q = T l T h T l T h ,
Very obviously, the high-frequency fringe order of kh can be referred in Equation (5) as
k h ( x , y ) = N I N T [ ( f h / f e q ) ϕ e q ( x , y ) ϕ h ( x , y ) 2 π ] ,
If the frequency difference between the high and low frequencies is one, the equivalent phase ϕ e q must be one fringe period as described in multi-frequency temporal phase unwrapping Φ e q = ϕ e q ; see Figure 3. The unwrapping phase of high-frequency can be determined from Equations (6) and (8). The phase unwrapping process is shown in Figure 2. This approach is also called multi-wavelength temporal phase unwrapping.
The reference wrapped phase with one fringe period is calculated by two different phase patterns with one frequency difference; see Equation (6). Then the high-frequency wrapped phase is unwrapped by the reference phase, as shown in Figure 2.

3. Experiments

Figure 4 shows the implementation of the FPP of the 3D shape measurement system using the new MEMS infrared projector. The experimental system consists of one CMOS cameras with infrared band imaging and 1600 × 1200 pixels (model UI-3250CP-M-GL, produced by the company of IDS Imaging Development Systems GmbH in Obersulm, Germany). The camera is used with a 12 mm focal length lens (model FL-CC1214-2M, Ricoh Corporation of Japan). The projector of MEMS is a scanning micro-mirror with a scanning angle of 60°, a projection frequency of 500 fps and a laser central wavelength of 830 nm. The projector for contrast is a DLP projector (model PDC03) with a projection speed of 30 fps and 1280 × 800 pixels, (Fuzhou Giant Vinda Photoelectric Technology Co., Ltd., Fuzhou, China). The synchronous trigger signal timing is sent out by the projector and then sent to the cameras as a precisely synchronized external trigger signals to capture pictures simultaneously. A series of experiments is performed to estimate the performance using the measurement system by different phase unwrapping methods.
As shown in Figure 5a, the galvanometer scanner is a new device with infrared laser projection. Its size—12 mm width and 22 mm length—is very small compared to a traditional DLP projector. The micro-galvanometer system is a cantilevers structure, which can change the scanning angle of the reflected micro-mirror attached to the spring tips. The scanning angle can be controlled by electromagnetic, electrostatic or piezoelectric methods with a scanning speed up to 32 kHz. As shown in Figure 5b, the laser spot is converted into a line with a cylindrical lens. When the scanning angle of the micro-mirror changes, the laser current changes according to the mode of a sinusoidal wave, then a complete two-dimensional fringe pattern can be projected, as shown in Figure 5c. The light source of the MEMS can use different wavelength lasers according to the needs, for example, infrared laser projection for face measurement.

3.1. Comparison of Measurement Accuracy in Different Phase Unwrapping Methods

A static planar surface to evaluate the performance of this measurement system using different temporal phase unwrapping approaches is measured. The standard sample is a plane of marble surface with a 0.18-micron flatness.
The distance between the plane marble surface and the camera ranged from 555 mm to 635 mm with a step size of 20 mm. On each position, the sinusoidal fringe patterns are projected onto the sample and modulate the surface, then the captured images are used to retrieve the absolute phase map (see Section 2.2) by a four-step phase-shifting method and temporal phase unwrapping algorithm. One of the captured fringe images is shown in Figure 6a. Combined with the structured light system calibration parameters, the plane 3D data can be reconstructed.
Taking the measurement data of the first position as an example, the 3D plane data are reconstructed by using the methods of hierarchical and heterodyne as shown in Figure 6b,c, respectively. The comparisons are performed using the same cross-section of the 3D data, which is shown in Figure 6b,c with the black and red lines, respectively. In order better to see the error distribution, the 3D data of the two lines with the subtraction of their respective fitting line is presented. It can be seen that the measurement results using the method of heterodyne are slightly better than the method of hierarchical, as shown in Figure 6d. However, both datasets have a small curvature, which will be explained in the next section.
The reconstructed 3D point cloud of the plane marble surface is fitted by a standard plane. The distances between the 3D points and this standard plane are calculated as plane measurement errors for the measurement accuracy evaluation. Figure 6e shows the measurement errors of the plane plate from Figure 6b. The measurement accuracy of the plane at five positions is shown in Table 1. These measurement results demonstrate that the FPP method implemented on this experimental scheme is capable to achieve an accuracy with a 0.2 mm standard deviation. The measurement error using the heterodyne method is smaller than the hierarchical method, so the heterodyne method will be chosen as the temporal phase unwrapping method in this structured light system in the following measurements.

3.2. Quantitative Evaluation of Heterodyne Method Based on MEMS Projector

For further quantitative evaluation, a standard ball (model G-BALL25.4, produced by the company of CALIB OPTICS, Shenzhen, China) with an absolute diameter of 25.3988 mm to see the performance of this MEMS projector system using a heterodyne method is measured. The ball is shown in Figure 7a. The ball was placed at ten different positions respectively and then scanned by this proposed system. The placement of the ball in the space is shown in Figure 7b. The distance between the front and back planes is 30 mm. At each position, a 3D shape measurement was performed and the measuring accuracy was analyzed by calculating the absolute error between the fitting diameter of the measured data and its true value. The spherical diameter was fitted using Geomagic Studio® 2013, which was made by Geomagic, Inc., Morrisville, NC, USA. Figure 7c shows one of measured 3D shape in the first position. The measurement accuracy of the ball at the ten different positions is shown in Table 2. It can be seen that for the ball the maximum absolute error is 0.172 mm, the minimum absolute error is 0.027 mm.

3.3. The Measurement Results Based on MEMS and DLP Projector

This method and the traditional fringe projection with DLP are compared. In this case, the sample is a face mask shown in Figure 8. Figure 8a shows one of the captured fringe patterns using MEMS. Using the phase unwrapping method of heterodyne and fringe images of Figure 8a, the unwrapped phase is then computed, as shown in Figure 8b. The 3D geometry can be recovered as shown in Figure 8c. The results of the 3D reconstruction mask using the DLP projector is shown in Figure 8d.
To further visualize the difference between the 3D shape using this proposed MEMS and the DLP method, the same cross-section of two 3D mask geometry shown in Figure 8c,d are plotted in Figure 8e,f (purple and red lines, respectively). The standard deviation and mean error of the cross-section were calculated using Matlab® with the version of 2015, which was made by Mathworks, USA. Figure 8e is a comparison of small-scale cross-section data from the mask head, it can be noticed that the MEMS measurement error is larger than DLP. The mean error of small cross-section difference is 0.06 mm and the standard deviation is 0.07 mm. Figure 8f shows that the mean error of larger cross-section difference is 0.15 mm and the standard deviation is 0.19 mm. From this figure, it can be seen that the two methods give very similar results. This demonstrates that the 3D data obtained from the proposed MEMS scanning method are reliable and the method can be advantageously applied for face scanning instead of the DLP projection method.

3.4. Measurement Results of Real Human Faces

The measurements to further verify that this proposed structured light system can work well for real human faces were performed. Figure 9 shows the 3D measurement results of two real people faces. One of the captured fringe patterns for each measurement is shown in Figure 9a,c. Figure 9b,d show, respectively, the 3D shape of the first face measurement and the second face measurement results in a front view.
Because of the influence of face skin colour and reflectivity, the surface quality of the facial reconstruction is slightly worse than the face mask reconstruction, especially in terms of noise and smoothing. In any case, the method provides enough face data for three-dimensional face shape reconstruction, which can be improved by adjusting optical parameters and also by using anti-glare spays.

4. Discussion

Compared with the DLP fringe projection, the 3D data measured using this proposed MEMS galvanometer has fringe-like errors (Figure 6). The error may be caused by the inaccuracy of the fringe boundary corresponding to the high-frequency phase. The closer the scanning boundary is, the greater the error will be, as shown in Figure 6d.
When the phase-shifted fringes are projected with DLP projector The DMD chip contains numerous micro-mirrors, each of which is projected as one pixel. Projection fringe pattern is generated by a computer according to the equal period of pixels. As shown in Figure 10a, when the focal length f of the projector and the distance z between the projector and the object are fixed, the ratio between d1 and d2 is equal to that between x1 and x2. Because the pixel spacing is equal, as long as the high-frequency fringes are integer times of the low-frequency fringes on the DMD, the fringe boundary of the measured object surface is also aligned, as shown in Figure 10b. In this case, the corrected unwrapping phase can be obtained.
The period of projection fringes is determined by the number of pixels in the DMD, but the period can only be controlled by the scanning angle of the MEMS, as shown in Figure 5c.
If the range of scanning angle is divided equally to generate the fringe with different periods pattern, the width of one fringe which is projected to the object surface must be different for different scanning angles θ. Figure 11a illustrates that the tangent values are not linear when from −30 degrees to 0 degrees and from 0 degrees to 30 degrees, and the derivatives in different scanning angles is different (Figure 11b). Therefore, the equal interval scanning angle as a period to produce fringes pattern will cause the misalignment in boundaries of the fringes between the low-frequency pattern and the high-frequency pattern. That will inevitably lead to an inaccurate phase unwrapping of the fringe boundary. In the next work, how to achieve non-equiangular calibration will be focused on.

5. Conclusions

This paper presents a novel structured light projection method for three-dimensional shape measurements using MEMS to realize the scanning of phase-shifted fringe projection. This developed system achieved 8 Hz 3D face shape measurement limited by the used camera. The experiments demonstrate how 3D measurement could be performed using a MEMS infrared scanning device as a projector. The measurement results of the standard plane and ball samples show that the accuracy is better than 0.2 mm. Face mask experiment demonstrated the success of this proposed method and have been compared with the data obtained by an expensive DLP projector. Real human face measurements also prove that it can be applied in the field of face recognition, where rapid 3D shape measurements are required. We expect that this work can help improve the field of 3D scanning application by developing a low cost and simple solution. For the future work, the calibration of the MEMS to obtain an equal length of the scanning fringes will be investigated.

Author Contributions

Conceptualization, J.X. and Q.Z.; Data curation, M.W. and Y.H.; Investigation, J.X., C.L. and W.L.; Software, J.X. and W.L.; Writing—original draft, J.X. and Q.Z.; Writing—review & editing, J.X., Q.Z., C.L. and M.W.

Funding

This research was funded by the National Key Scientific Instrument and Equipment Development Projects of China, grant number 2013YQ490879; and was funded by the Open fund for Artificial Intelligence Key Laboratory of Sichuan Province of China, grant number 2018RYJ07.

Acknowledgments

The authors would like to thank Feiyu Yang for helpful valuable discussions and as a face model in experiment. The authors also would like to thank Mourad Idir and Lei Huang in the Optics and Metrology group of NSLS-II at Brookhaven National Laboratory in USA for helpful language revision.

Conflicts of Interest

The authors declare no conflict of interest.

References

  1. Betta, G.; Capriglione, D.; Gasparetto, M.; Zappa, E.; Liguori, C.; Paolillo, A. Face recognition based on 3D features: Management of the measurement uncertainty for improving the classification. Measurement 2015, 70, 169–178. [Google Scholar] [CrossRef]
  2. Zuo, C.; Huang, L.; Zhang, M.; Chen, Q.; Asundi, A. Temporal phase unwrapping algorithms for fringe projection profilometry: A comparative review. Opt. Lasers Eng. 2016, 85, 84–103. [Google Scholar] [CrossRef]
  3. Zhang, S. Recent progresses on real-time 3D shape measurement using digital fringe projection techniques. Opt. Lasers Eng. 2010, 48, 149–158. [Google Scholar] [CrossRef]
  4. Quan, C.; Chen, W.; Tay, C.J. Phase-retrieval techniques in fringe-projection profilometry. Opt. Lasers Eng. 2010, 48, 235–243. [Google Scholar] [CrossRef]
  5. Li, B.; Zhang, S. Microscopic structured light 3D profilometry: Binary defocusing technique vs. sinusoidal fringe projection. Opt. Lasers Eng. 2017, 96, 117–123. [Google Scholar] [CrossRef]
  6. Zhang, S. Absolute phase retrieval methods for digital fringe projection profilometry: A review. Opt. Lasers Eng. 2018, 107, 28–37. [Google Scholar] [CrossRef]
  7. Gorthi, S.S.; Rastogi, P. Fringe projection techniques: Whither we are? Opt. Lasers Eng. 2010, 48, 133–140. [Google Scholar] [CrossRef] [Green Version]
  8. Dou, P.; Kakadiaris, I.A. Multi-view 3D face reconstruction with deep recurrent neural networks. Image Vision Comput. 2018, 80, 80–91. [Google Scholar] [CrossRef]
  9. Huang, P.S.; Zhang, C.; Chiang, F.-P. High-speed 3-D shape measurement based on digital fringe projection. Opt. Eng. 2003, 42, 163–168. [Google Scholar] [CrossRef]
  10. Zhang, S.; Van Der Weide, D.; Oliver, J. Superfast phase-shifting method for 3-D shape measurement. Opt. Express 2010, 18, 9684–9689. [Google Scholar] [CrossRef] [PubMed]
  11. Lohry, W.; Zhang, S. High-speed absolute three-dimensional shape measurement using three binary dithered patterns. Opt. Express 2014, 22, 26752–26762. [Google Scholar] [CrossRef]
  12. Hyun, J.-S.; Zhang, S. Superfast 3D absolute shape measurement using five binary patterns. Opt. Lasers Eng. 2017, 90, 217–224. [Google Scholar] [CrossRef]
  13. Zhao, H.; Diao, X.; Jiang, H.; Li, X. High-speed triangular pattern phase-shifting 3D measurement based on the motion blur method. Opt. Express 2017, 25, 9171–9185. [Google Scholar] [CrossRef]
  14. Zuo, C.; Chen, Q.; Gu, G.; Feng, S.; Feng, F.; Li, R.; Shen, G. High-speed three-dimensional shape measurement for dynamic scenes using bi-frequency tripolar pulse-width-modulation fringe projection. Opt. Lasers Eng. 2013, 51, 953–960. [Google Scholar] [CrossRef]
  15. Zuo, C.; Chen, Q.; Feng, S.; Feng, F.; Gu, G.; Sui, X. Optimized pulse width modulation pattern strategy for three-dimensional profilometry with projector defocusing. Appl. Opt. 2012, 51, 4477–4490. [Google Scholar] [CrossRef] [PubMed]
  16. Wang, Y.; Basu, S.; Li, B. Binarized dual phase-shifting method for high-quality 3D shape measurement. Appl. Opt. 2018, 57, 6632–6639. [Google Scholar] [CrossRef]
  17. Flores, J.L.; Torales, G.; Ferrari, J.A.; Ayubi, G.; Castillo, O.E.; Martino, M.D. Binary coded triangular fringes for 3-D surface-shape measurement. Appl. Opt. 2013, 52, 3576–3582. [Google Scholar] [CrossRef]
  18. Su, X.; Zhang, Q. Dynamic 3-D shape measurement method: A review. Opt. Lasers Eng. 2010, 48, 191–204. [Google Scholar] [CrossRef]
  19. Zhang, Q.; Su, X. High-speed optical measurement for the drumhead vibration. Opt. Express 2005, 13, 3110–3116. [Google Scholar] [CrossRef] [PubMed]
  20. Xue, J.; Su, X.; Zhang, Q. High-speed 3D face measurement based on color speckle projection. In Proceedings of the International Conference on Experimental Mechanics, Singapore, 15 October 2014; p. 93022Y. [Google Scholar] [CrossRef]
  21. An, Y.; Hyun, J.-S.; Zhang, S. Pixel-wise absolute phase unwrapping using geometric constraints of structured light system. Opt. Express 2016, 24, 18445–18459. [Google Scholar] [CrossRef]
  22. Yang, X.; Zeng, C.; Luo, J.; Lei, Y.; Tao, B.; Chen, X. Absolute Phase Retrieval Using One Coded Pattern and Geometric Constraints of Fringe Projection System. Appl. Sci. 2018, 8, 2673. [Google Scholar] [CrossRef]
  23. Zhang, S. High-speed 3D shape measurement with structured light methods: A review. Opt. Lasers Eng. 2018, 106, 119–131. [Google Scholar] [CrossRef]
  24. Huntley, J.M.; Saldner, H. Temporal phase-unwrapping algorithm for automated interferogram analysis. Appl. Opt. 1993, 32, 3047–3052. [Google Scholar] [CrossRef] [PubMed]
  25. Burke, J.; Bothe, T.; Osten, W.; Hess, C.F. Reverse engineering by fringe projection. In Proceedings of the International Symposium on Optical Science and Technology, Seattle, WA, USA, 19 June 2002; p. 4778. [Google Scholar] [CrossRef]
  26. Reich, C.; Ritter, R.; Thesing, J. White light heterodyne principle for 3D-measurement. In Proceedings of the Lasers and Optics in Manufacturing III, Munich, Germany, 16–20 June 1997; p. 3100. [Google Scholar] [CrossRef]
  27. Srinivasan, V.; Liu, H.C.; Halioua, M. Automated phase-measuring profilometry of 3-D diffuse objects. Appl. Opt. 1984, 23, 3105–3108. [Google Scholar] [CrossRef]
Figure 1. The schematic diagram of a typical fringe projection profilometry (FPP) setup, which consists of a camera and a projector. A, B and C are the points of the same phase point on the pattern, the object surface, and the captured image, separately.
Applsci 09 01458 g001
Figure 2. The illustration of high-frequency fringe order determination based on one fringe pattern in multi-frequency temporal phase unwrapping.
Applsci 09 01458 g002
Figure 3. The illustration of equivalent phase map ϕ e q calculation as the difference between ϕ l and ϕ h in the multi-wavelength temporal phase unwrapping approach. ϕ e q is also regarded as the reference phase with the phase value ranges from 0 to 2π.
Applsci 09 01458 g003
Figure 4. The experimental setup for this FPP measurement system, the projector of galvanometer scanner (MEMS) and digital light projector (DLP) are used to project fringe patterns, respectively. The experimental system uses one projector and one camera. (a) Experimental setup; (b) DLP projector; (c) Projected fringe by DLP; (d) MEMS projector; (e) Projected fringe by MEMS.
Applsci 09 01458 g004
Figure 5. The galvanometer scanner. (a) MEMS device; (b) Principle of laser scanner; (c) The relationship between current intensity and scanning angle.
Applsci 09 01458 g005
Figure 6. The measurement of a standard plane in the first position. (a) The one of the captured fringe; (b) 3D reconstruction result of the hierarchical method; (c) 3D reconstruction result of heterodyne method; (d) 3D measurement data of the same cross-section on the plane as shown in (b,c) with black and red lines, respectively. The z coordinate is the value of 3D measurement data minus the fitting line; (e) Measurement errors of the plane from data analysis as shown in (b).
Applsci 09 01458 g006
Figure 7. The measurement results of the standard ball. (a) The standard ball; (b) Ten measuring positions of the ball; (c) 3D reconstruction result of the ball in the first position.
Applsci 09 01458 g007
Figure 8. The measurement results of a face mask. (a) One of the captured fringe images; (b) Unwrapped phase map by using the projector of MEMS; (c) Reconstructed 3D geometry using phase map shown in (b); (d) Reconstructed 3D geometry by using the projector of DLP; (e) 3D data comparison in a cross-section between MEMS projection and DLP projection, the cross-section on the forehead with purple line as shown in (c,d); (f) 3D data comparison in a cross-section between MEMS projection and DLP projection, the cross-section on the middle face with red line as shown in (c,d).
Applsci 09 01458 g008
Figure 9. The measurement results of capturing the real faces. (a) One of the captured face images with infrared fringe from the first person; (b) 3D facial reconstruction result in front view of the first person; (c) One of the captured face images with infrared fringe from the second person; (d) 3D facial reconstruction result in the front view of the second person.
Applsci 09 01458 g009
Figure 10. The DLP projector. (a) The projection geometry; (b) The upper and lower images on the left are projection patterns with the fringe frequency of two and four. The right images are a line of phase values corresponding to the blue line of the left image, respectively. The fringe boundary on the projection plane coincides with the fringe boundary on the DMD completely.
Applsci 09 01458 g010
Figure 11. Different scanning angles lead to different widths of the projection fringes, even though the period with interval scanning angle is the same. (a) The relation between scanning angle θ and tangent value; (b) The relation between scanning angle θ and derivative of the tangent function.
Applsci 09 01458 g011
Table 1. The evaluation results of the plate plane.
PositionStandard Deviation (mm)
HeterodyneHierarchical
10.1090.119
20.1250.130
30.1490.152
40.1480.173
50.1650.180
Table 2. The quantitative evaluation of standard ball with the diameter of 25.3988 (Unit: mm).
PositionFitting DiameterAbsolute ErrorPositionFitting DiameterAbsolute Error
125.352−0.047625.4310.032
225.227−0.172725.245−0.154
325.4560.057825.5410.142
425.5620.163925.5870.188
525.4260.0271025.231−0.168

