Article

The Detection and Recognition of RGB-LED-ID Based on Visible Light Communication using Convolutional Neural Network

1
School of Automation Science and Engineering, South China University of Technology, Guangzhou 510640, China
2
SIAT-Sense Time Joint Lab, Shenzhen Institutes of Advanced Technology, Chinese Academy of Sciences, Shenzhen 518055, China
3
School of Materials Science and Engineering, South China University of Technology, Guangzhou 510640, China
4
School of Electronic and Information Engineering, South China University of Technology, Guangzhou 510640, China
5
School of Computer Science and Engineering, South China University of Technology, Guangzhou 510006, China
*
Authors to whom correspondence should be addressed.
These authors contributed equally to this work, Weipeng Guan and Jingyi Li are co-first authors of the article.
Appl. Sci. 2019, 9(7), 1400; https://doi.org/10.3390/app9071400
Submission received: 18 February 2019 / Revised: 27 March 2019 / Accepted: 27 March 2019 / Published: 3 April 2019
(This article belongs to the Section Electrical, Electronics and Communications Engineering)

Abstract

:
In this paper, an online to offline (O2O) method based on visible light communication (VLC) is proposed, which is different from the traditional VLC with modulation and demodulation. It is a new VLC with modulation and recognition. We use RGB light emitting diode (RGB-LED) as the transmitter, and use Pulse Width Modulation (PWM) to modulate the signal to make it flicker at high frequency. Therefore, several features are created. At the receiver, the complementary metal-oxide-semiconductor (CMOS) image sensor is applied to our system to capture LED images with stripes. A convolution neural network (CNN) is then introduced in our system as a classifier. By offline training for the classifiers and online recognition of LED-ID, the scheme proposed could improve the speed of LED-ID (the unique identification of each different LED) identification and improve the robustness of the system. This is the first application of CNN in the field of VLC.

1. Introduction

Visible light communication (VLC) has attracted much attention in recent years, because RGB-LED communication devices (such as lamps, TVs, traffic signs) are used everywhere [1]. Moreover, VLC is safer than radio frequency (RF), because of the line of sight (LOS) propagation and non-penetration of light waves through opaque surfaces. Therefore, there is the hope that a powerful offline to-online (O2O) and peer-to-peer (P2P) communication medium might be developed that receives information from multiple RGB-LEDs. In this paper, we propose a new VLC scheme different from previous modulation- and demodulation-based schemes to achieve higher accuracy and robustness for recognition of RGB-LED-ID (the unique identification of each different LED).
There are two kinds of VLC: one uses photodiode (PD) as the receiver, and the other uses an image sensor as the receiver. VLC based on image sensors has wider application value [2]. In this paper, we propose an optical fringe code (OFC) detection and recognition based on visible light communication using a convolutional neural network (CNN). We use RGB-LED as the transmitter, and it is derived by pulse width modulation (PWM). At the receiver, a complementary metal-oxide-semiconductor (CMOS) image sensor in a smartphone is used to capture the LED projection. LED projection is a form of stripe image, because of the roll mechanism of CMOS sensors. A CNN is then used to build the classifier. After offline training is completed, online recognition of OFC can be implemented. The experimental results show that the scheme we propose can not only improve the distance and accuracy of OFC recognition, but also improve the applicability and stability of OFC recognition. In addition, the number of OFC is far more than that in our previous work in Reference [3]. Therefore, the OFC is expected to become an effective complement to traditional 2D code scanning technology in the future.
Compared with the traditional modulation and demodulation method and our previous work, the main advantage of the proposed method is practicability. There are a lot of application scenarios of our system. For example, mobile payment is now a very popular technology, and OFC can be used as an effective complementary means of mobile payment technology. In the future field of autopilot, OFC can be used as an important means to realize navigation signs. It has the characteristic of luminescence, and has higher robustness than single pattern recognition. Last but not least, in outdoor advertising business, the use of OFC can provide new ideas for night advertising. Combined with virtual reality technology, OFC can offer attractive potential to lighting advertising boards. Overall, it could be a promising technology.

2. Related Work

Most of the early studies on VLC focused on increasing communication rate, signal-to-noise ratio, etc. A barcode-based VLC system between smart devices was proposed in Reference [4], which showed high level of security. Unfortunately, the error rate increased due to the “blooming” effect of image sensors caused by uneven light output. In Reference [5], the authors found a way to avoid the “blooming” effect. However, the effective transmission distance was too short (about 4 cm), and when the distance was large, the data packet could be partially lost. There are a lot of similar works, such as References [6,7,8].
These works have all been in terms of signal modulation and demodulation, and sought improvement in signal encoding and decoding to transmit a large amount of data. In our previous work [3], for the first time, we pushed VLC from “encoding + decoding” to “encoding + recognition.” This shows a more powerful practicality than traditional VLC, but this method needs complicated image processing and feature selection, which is not universal. What is more, the system only has 1035 unique LED-IDs under the same light intensity, which greatly restricts “encoding + recognition” VLC wider application, and recognition rate is also limited by the accuracy of feature extraction.

3. Theory

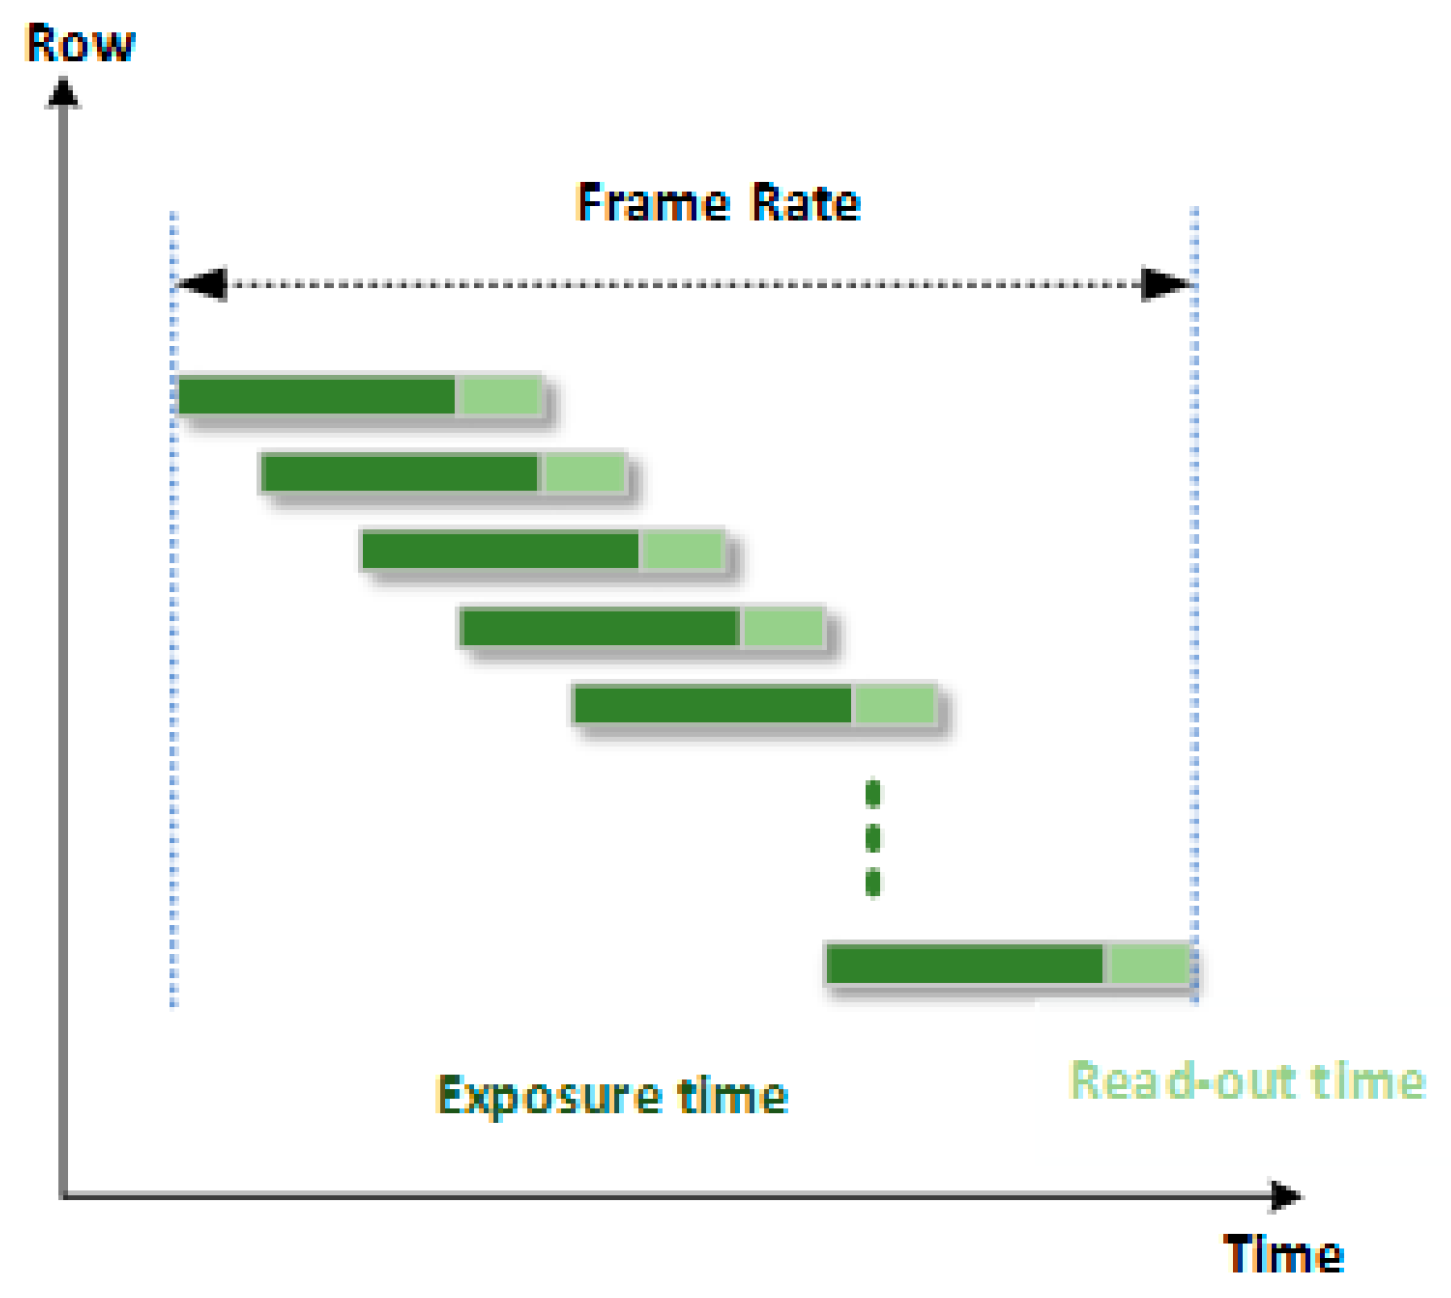
3.1. Receiver and Transmitter

Modern smartphone cameras almost entirely use CMOS image sensors to record images. CMOS image sensors have a unique effect on exposure—the rolling shutter mechanism [9,10]. Each row of images in the CMOS sensor is activated sequentially, which means that the row-by-row sensor exposes and records pixel data row by row, which is shown in Figure 1. This means that the high frequency scintillation light will leave a stripe pattern on the CMOS sensor.
In this paper, the PWM method is employed. It is a very effective technique to control analog circuits by the digital transmission of microprocessors. By periodically opening the LED on/off, the data bit 1/0 is encoded and transmitted. In addition, the frequency, coding sequence, and phase are considered to produce OFC with different characteristics, which is shown in Figure 2, Figure 3 and Figure 4.
By increasing the frequency, the width of the stripes will decrease and the number of stripes will increase. An example is shown in Figure 2 under the same distance condition.
In addition to the number and width of stripes, the color and color cycle of stripes can also be changed by changing the phase between LEDs of different colors. An example is shown in Figure 3. The phase difference of the right image in Figure 3 is 15°, and the left one is 75°. It can be seen that different phase differences can lead to different colors of LED projections.
By changing the encoding sequence, the width, number, color, and color change period of the strip can be changed. A simple example is illustrated in Figure 4. The encoding sequence of the right image in Figure 4 is “01,” and the left one is “011.”
In addition, the distance between the LED (RGB-LED 9W) and CMOS camera is also a factor, but different from the above three parameters; if the above three parameters are the same, the recognition results should be the same in different distances. Thus, we separate it from misunderstandings. As the distance increases, the number of stripes decreases. Example pictures are shown in Figure 5.

3.2. Color Theory

Our eyes experience a process called “persistence of vision,” which means the sum of time. In this process, the eye amasses photons until it reaches saturation. The time is referred to as t c :
ζ = I t ( t t c )
In Equation (1), I is the LED project’s color intensity stimulus. t c is the critical time. The average value of the stimulus at the critical time is the perception of color by the human eye. Given by Bloch’s law, the color of ψ is:
ψ = I R ( t ) d t + I G ( t ) d t + I B ( t ) d t t
In Equation (2), I R ( t ) , I G ( t ) , and I B ( t ) are the intensity functions of red, green, and blue light respectively. When all three lights of the RGB-LED light are emitted at the same ratio, the human eye can perceive the white light for a critical duration. This is the color theory we know, as in Reference [11].

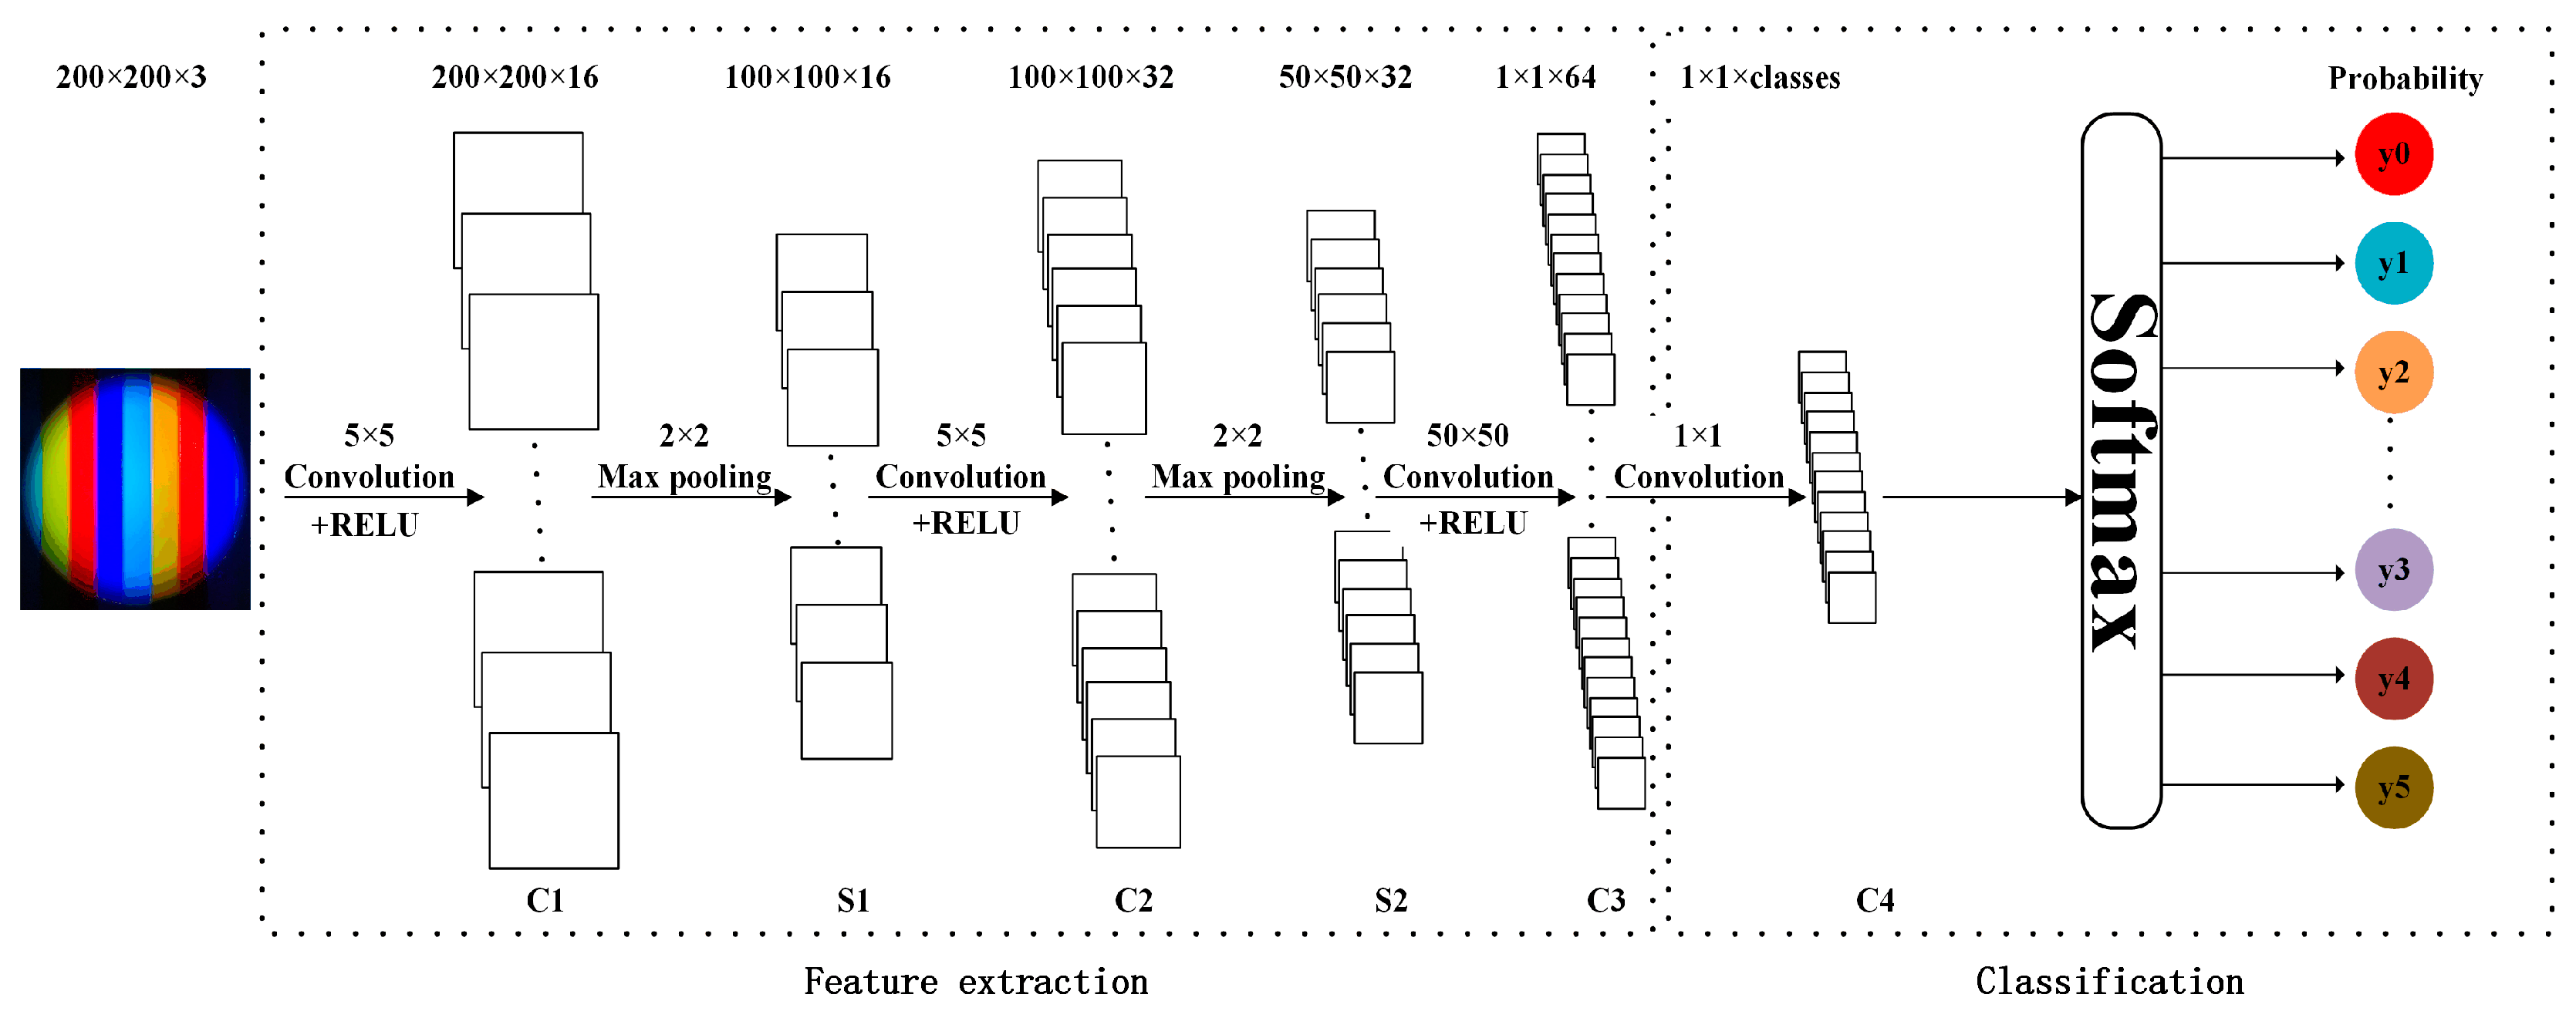
3.3. Convolutional Neural Network

Convolution neural networks (CNN) have been widely used as classifiers in recent years. LeCun et al. proposed a neural network architecture “LeNet-5” for pattern recognition, which is straightforward but performs favorably against the traditional machine learning algorithm. In our case, we conducted a similar architecture with the “LeNet-5” in our pipeline, which is illustrated in Figure 6.
Our architecture consisted of seven layers. Two sets of convolutional and max pooling layers were stacked to extract the feature map, followed by a flattening convolutional layer for shrinking the feature dimension, then two fully-connected layers, and finally a softmax classifier. In detail, we adopted a ReLU activation function instead of Tanh in order to fasten the convergence. Feeding a 200 × 200 × 3 pixel size input image, a 5 × 5 kernel size was selected for feature extraction and a 2 × 2 kernel size for downsampling. A flattening convolutional layer with 50 × 50 kernel size was then selected to adjust the feature dimension for classification. Finally, two fully-connected layers with a softmax classifier output the probability of prediction results for each class. When used for recognition, CNN can easily provide a lot of feature information without complex image preprocessing. Therefore, our schemes could handle more LED-OFC features by using CMOS sensors to modulate multiple parameters of RGB-LED. Moreover, the feature information was selected inherently, which removes the uncertainty caused by manual selection and improves the accuracy and robustness of the system.

4. Experimental Section

4.1. Experimental Setup

A brief overview of the system and the experimental situation follows in Figure 7.
The key hardware parameters are shown in Table 1.

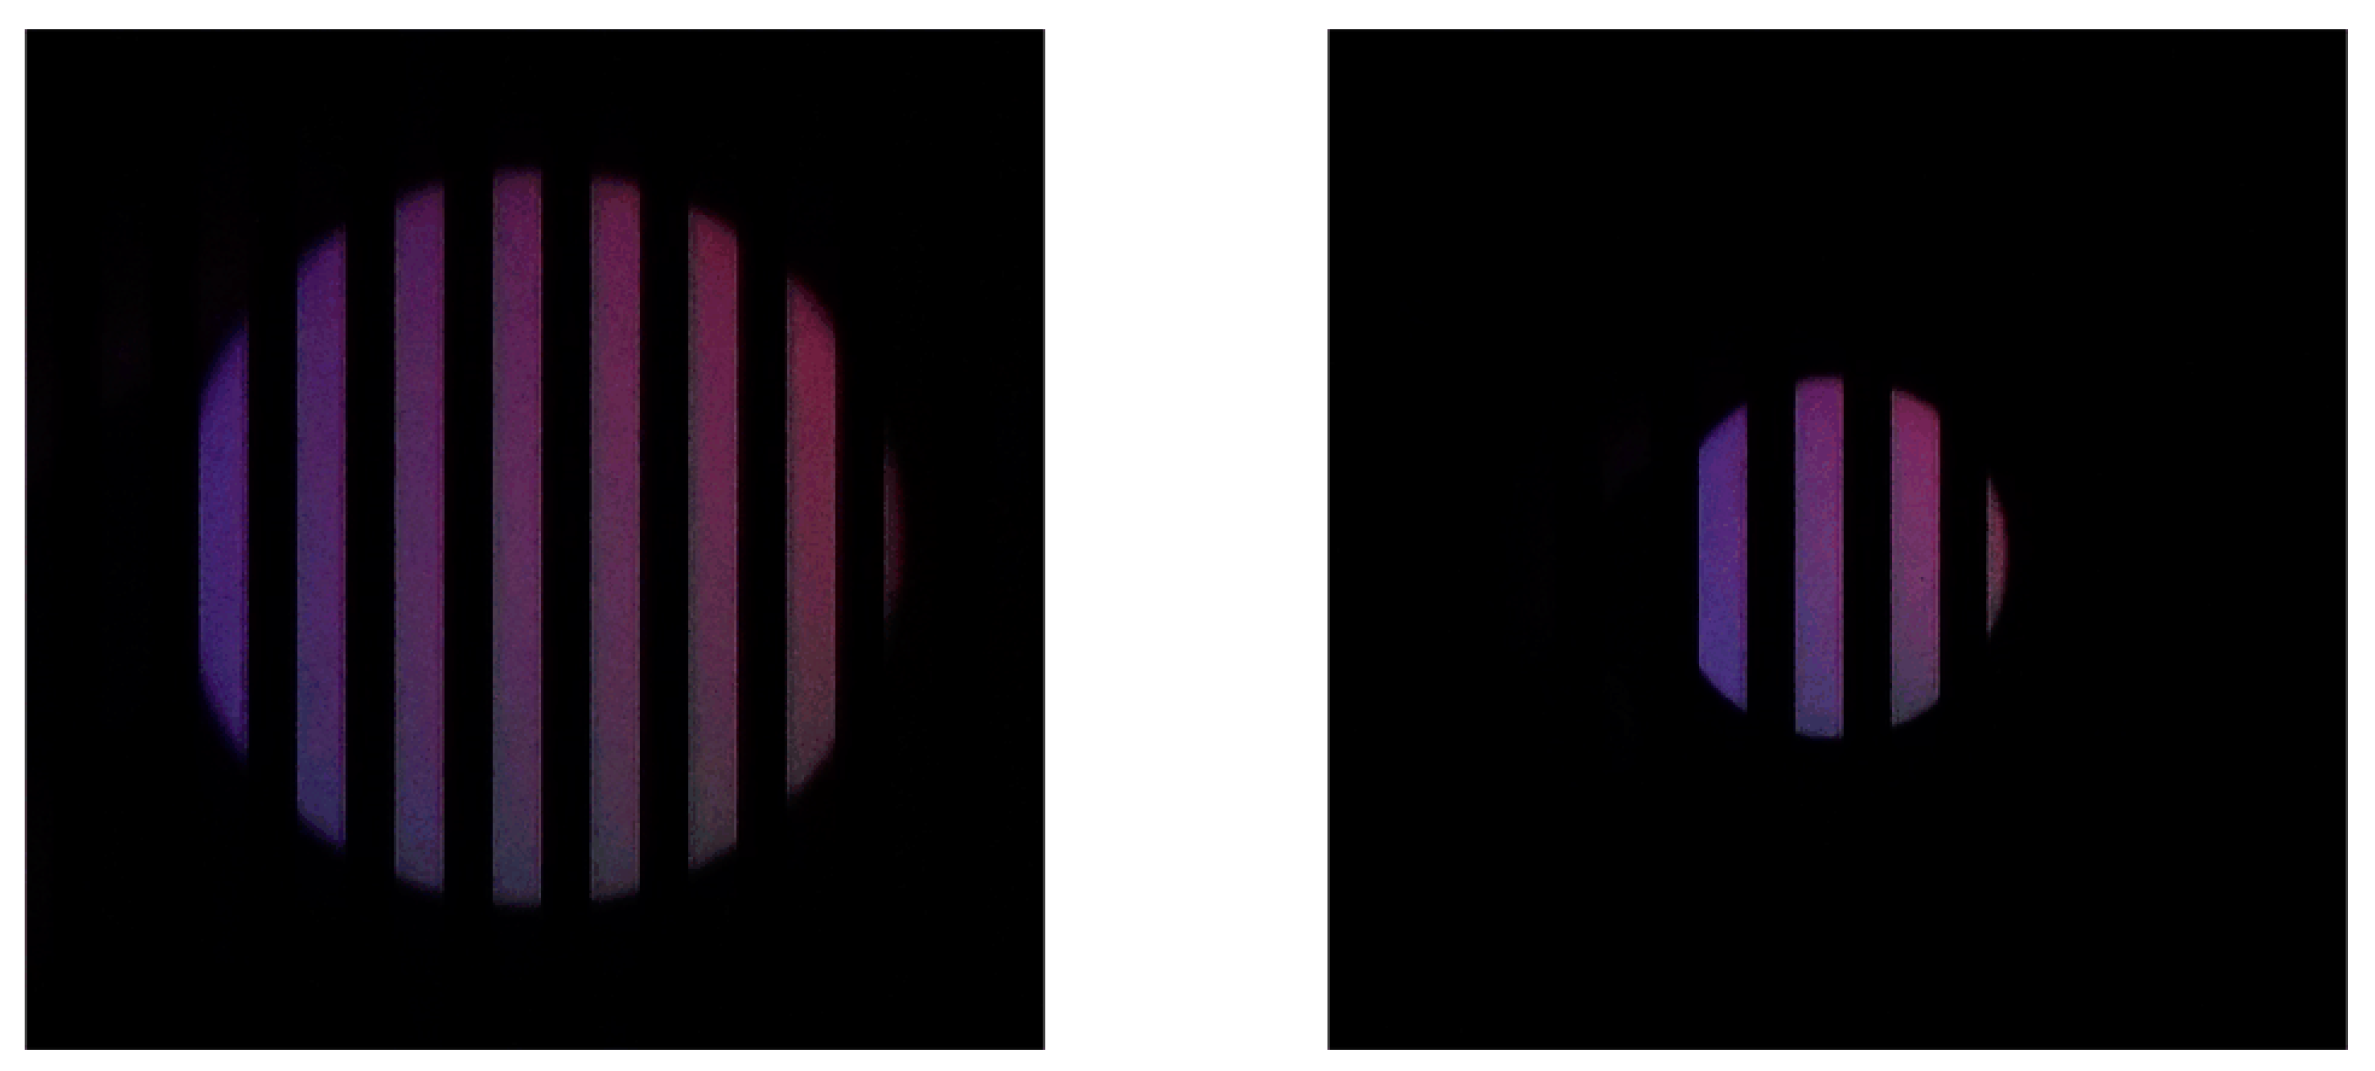
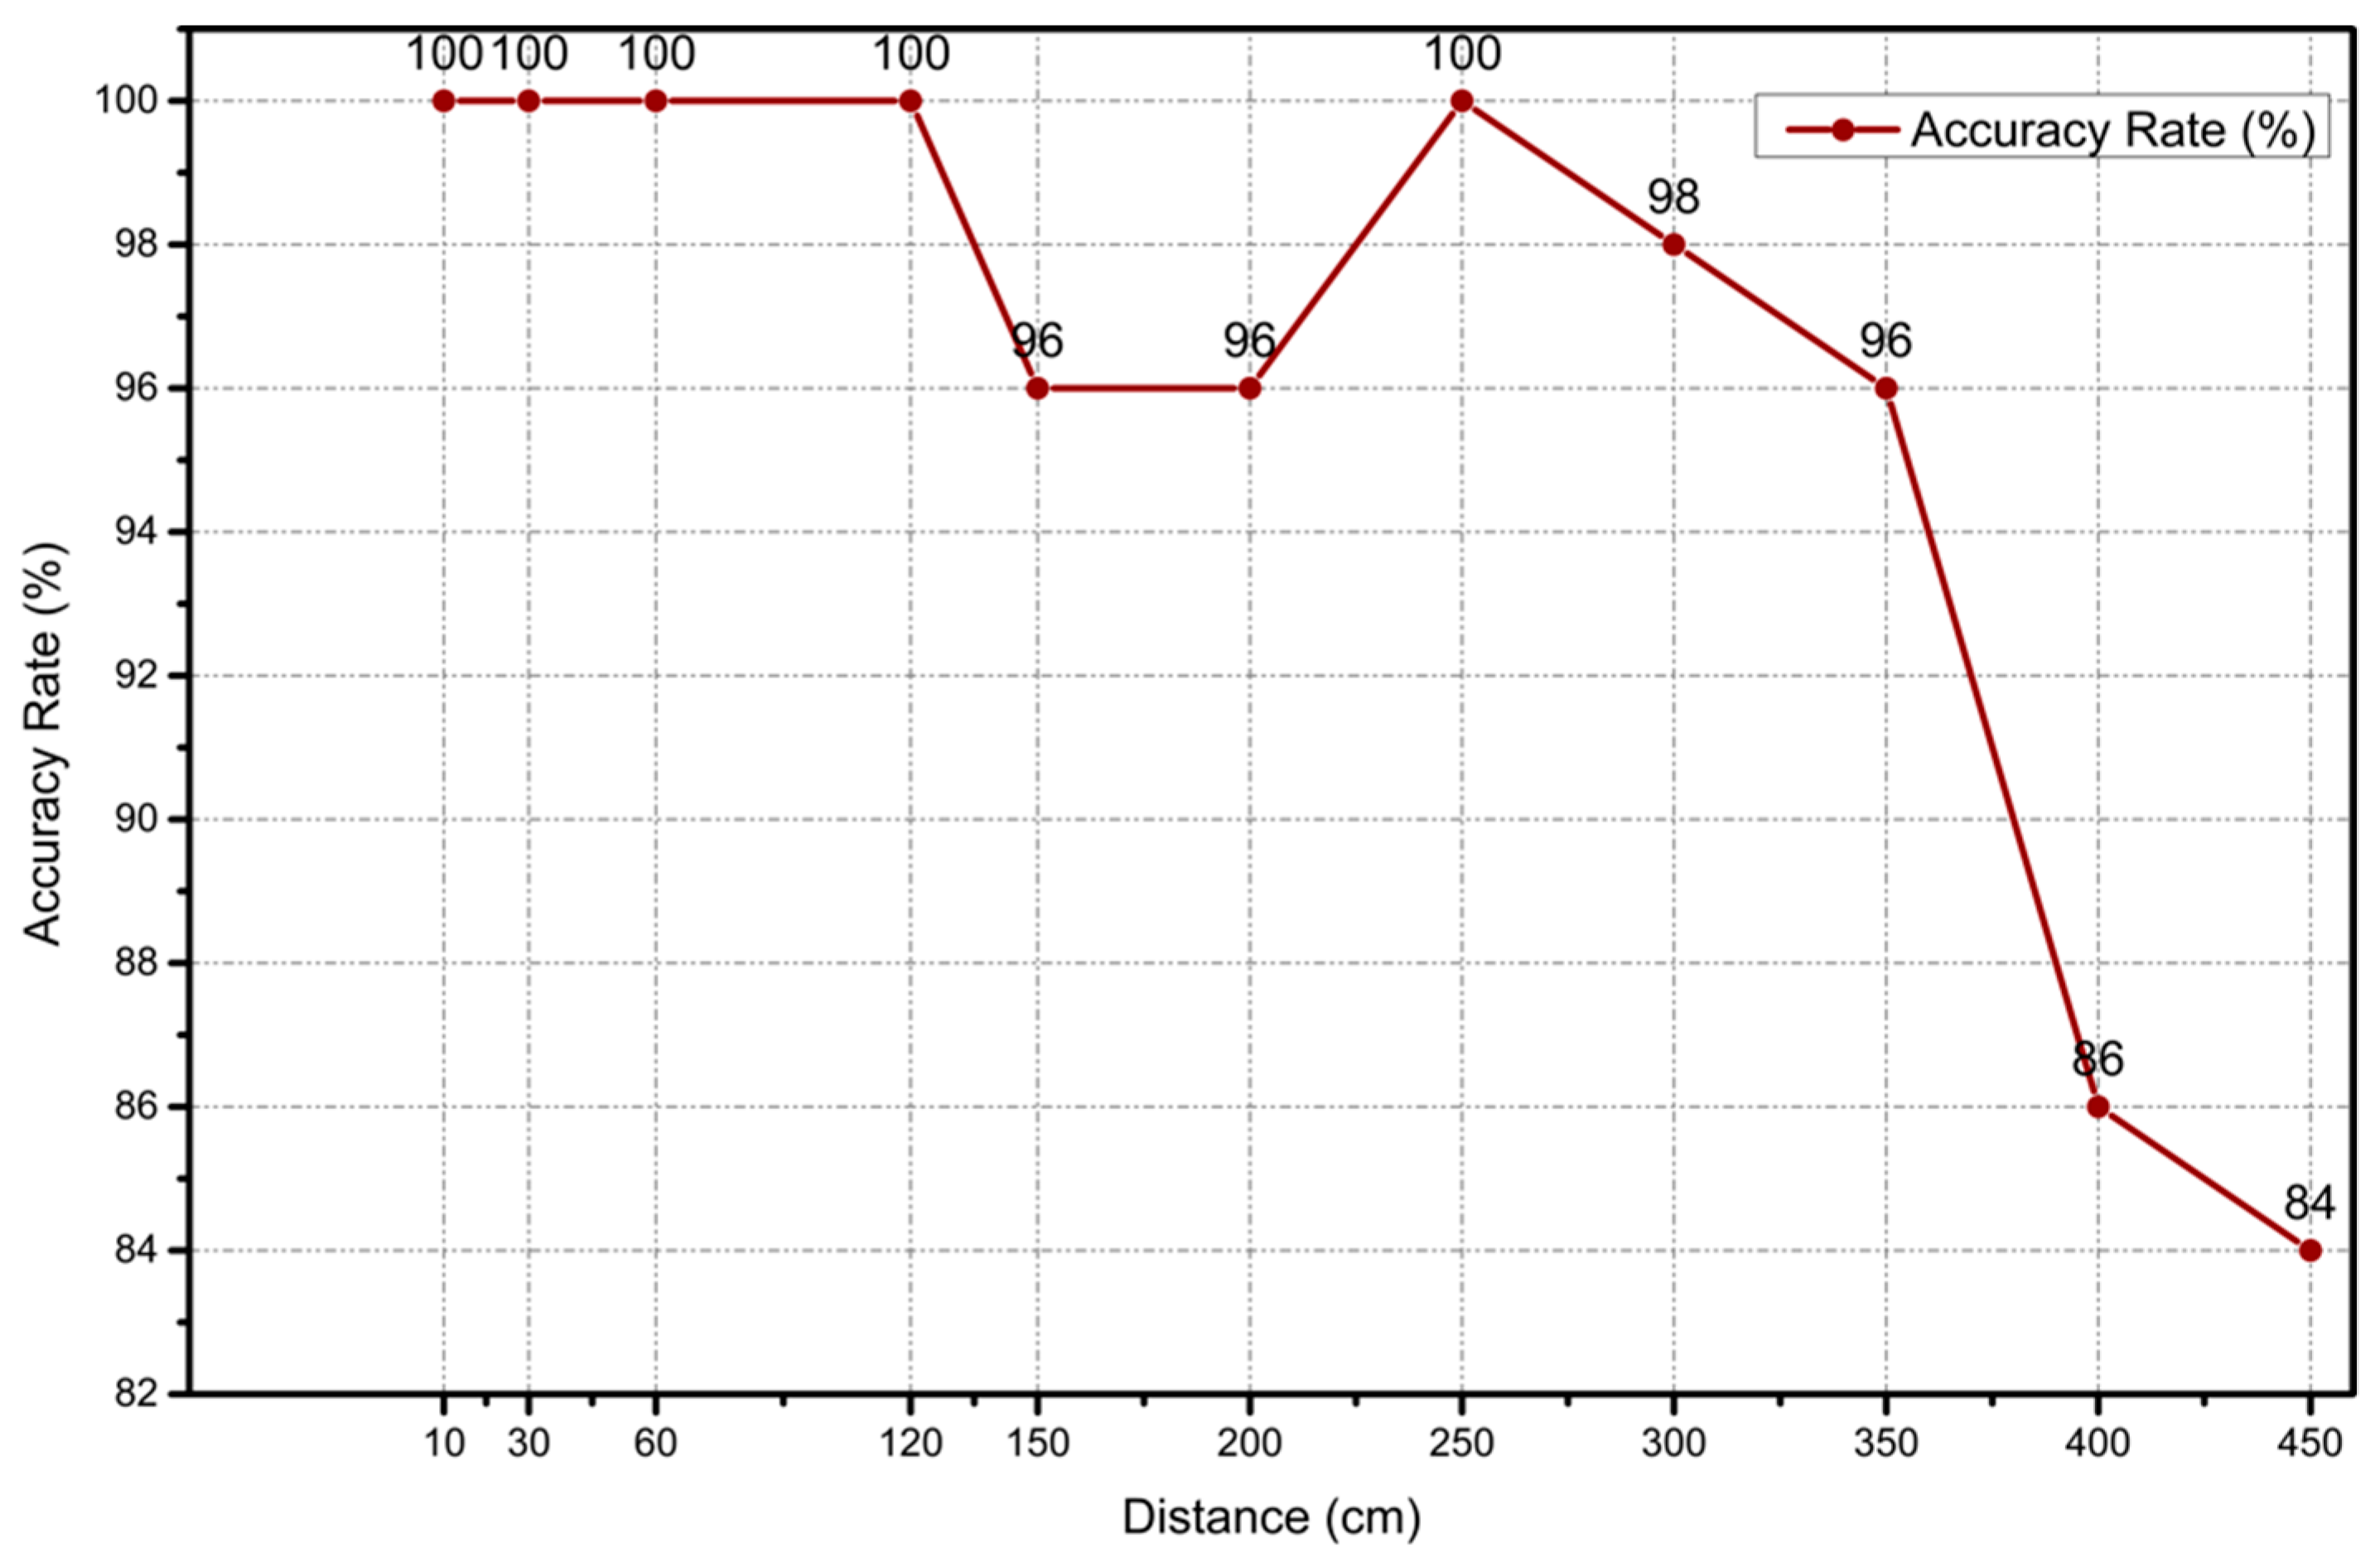
4.2. Distance and LED-OFC Recognition Result Analysis

As mentioned before, the change of distance will lead to the change of fringe number. What is more, the light intensity also decreases as the distance increases, which will have an impact on the final recognition accuracy. It is worth mentioning that, for each LED-OFC, the absolute width of the stripes at different distances does not change, since the focal length does not change at different distances. An experiment is designed to explore the impact of the distance and other parameters was conducted as follows: The phase difference was 0°, the encoding sequence was “01”, the duty ratio was 50%, and different frequencies were used to generate different LED-OFC ID at each distance (500 Hz–6500 Hz with interval of 400 Hz). We acquired about 3000 LED-OFC images for training and 300 images for testing at each distance. The experiment results are shown in Figure 8.
The recognition accuracy fluctuated little at the initial stage until the distance exceeded 3.5 m, and then began to decline rapidly, as seen above. This indicates that the proposed method can achieve much greater distance than the traditional modulation and demodulation method, which can only achieve 10 cm to 50 cm transmission distances. As mentioned before, as the distance increases, the number of stripes decreases, which causes the transmitted data frame structure to be lost, so the transmission distance is strictly limited. For example, the number of stripes cannot less than 8 if the transmission encoding sequence has 8 bits, otherwise a complete packet cannot be received, which will make the transmitted data incorrectly demodulated. The above experiment result proves that the proposed method does not have this limitation.

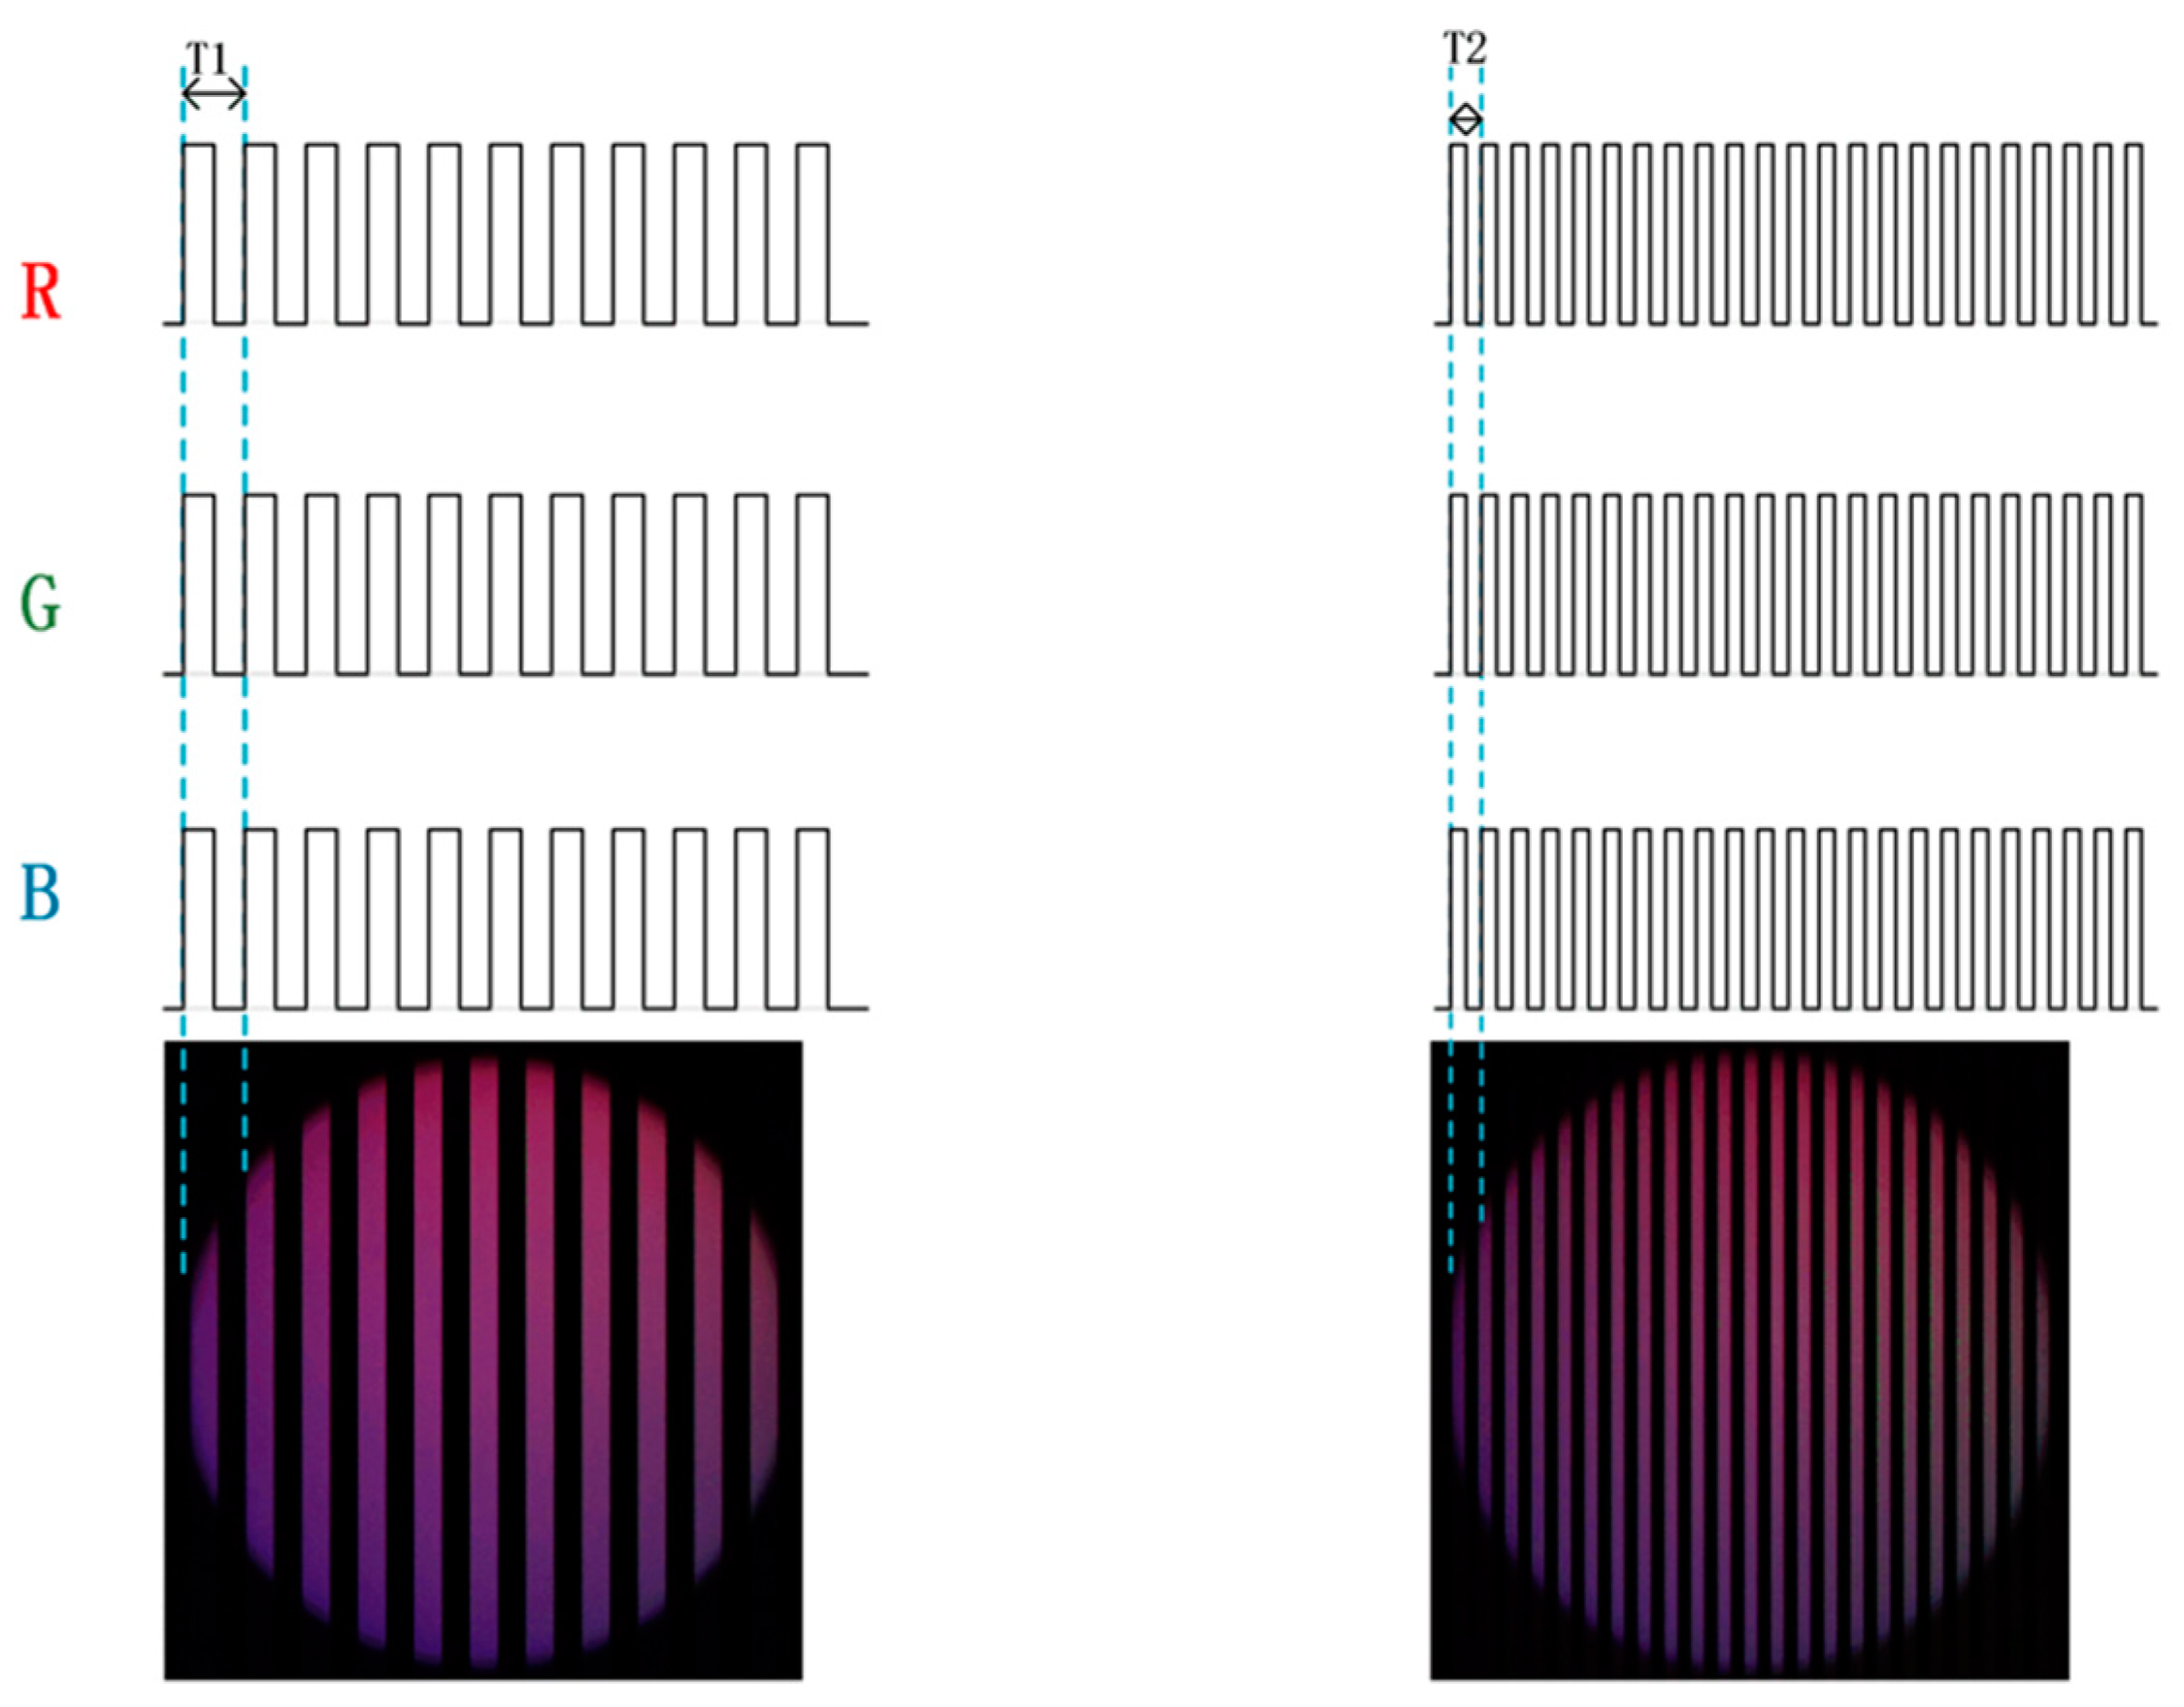
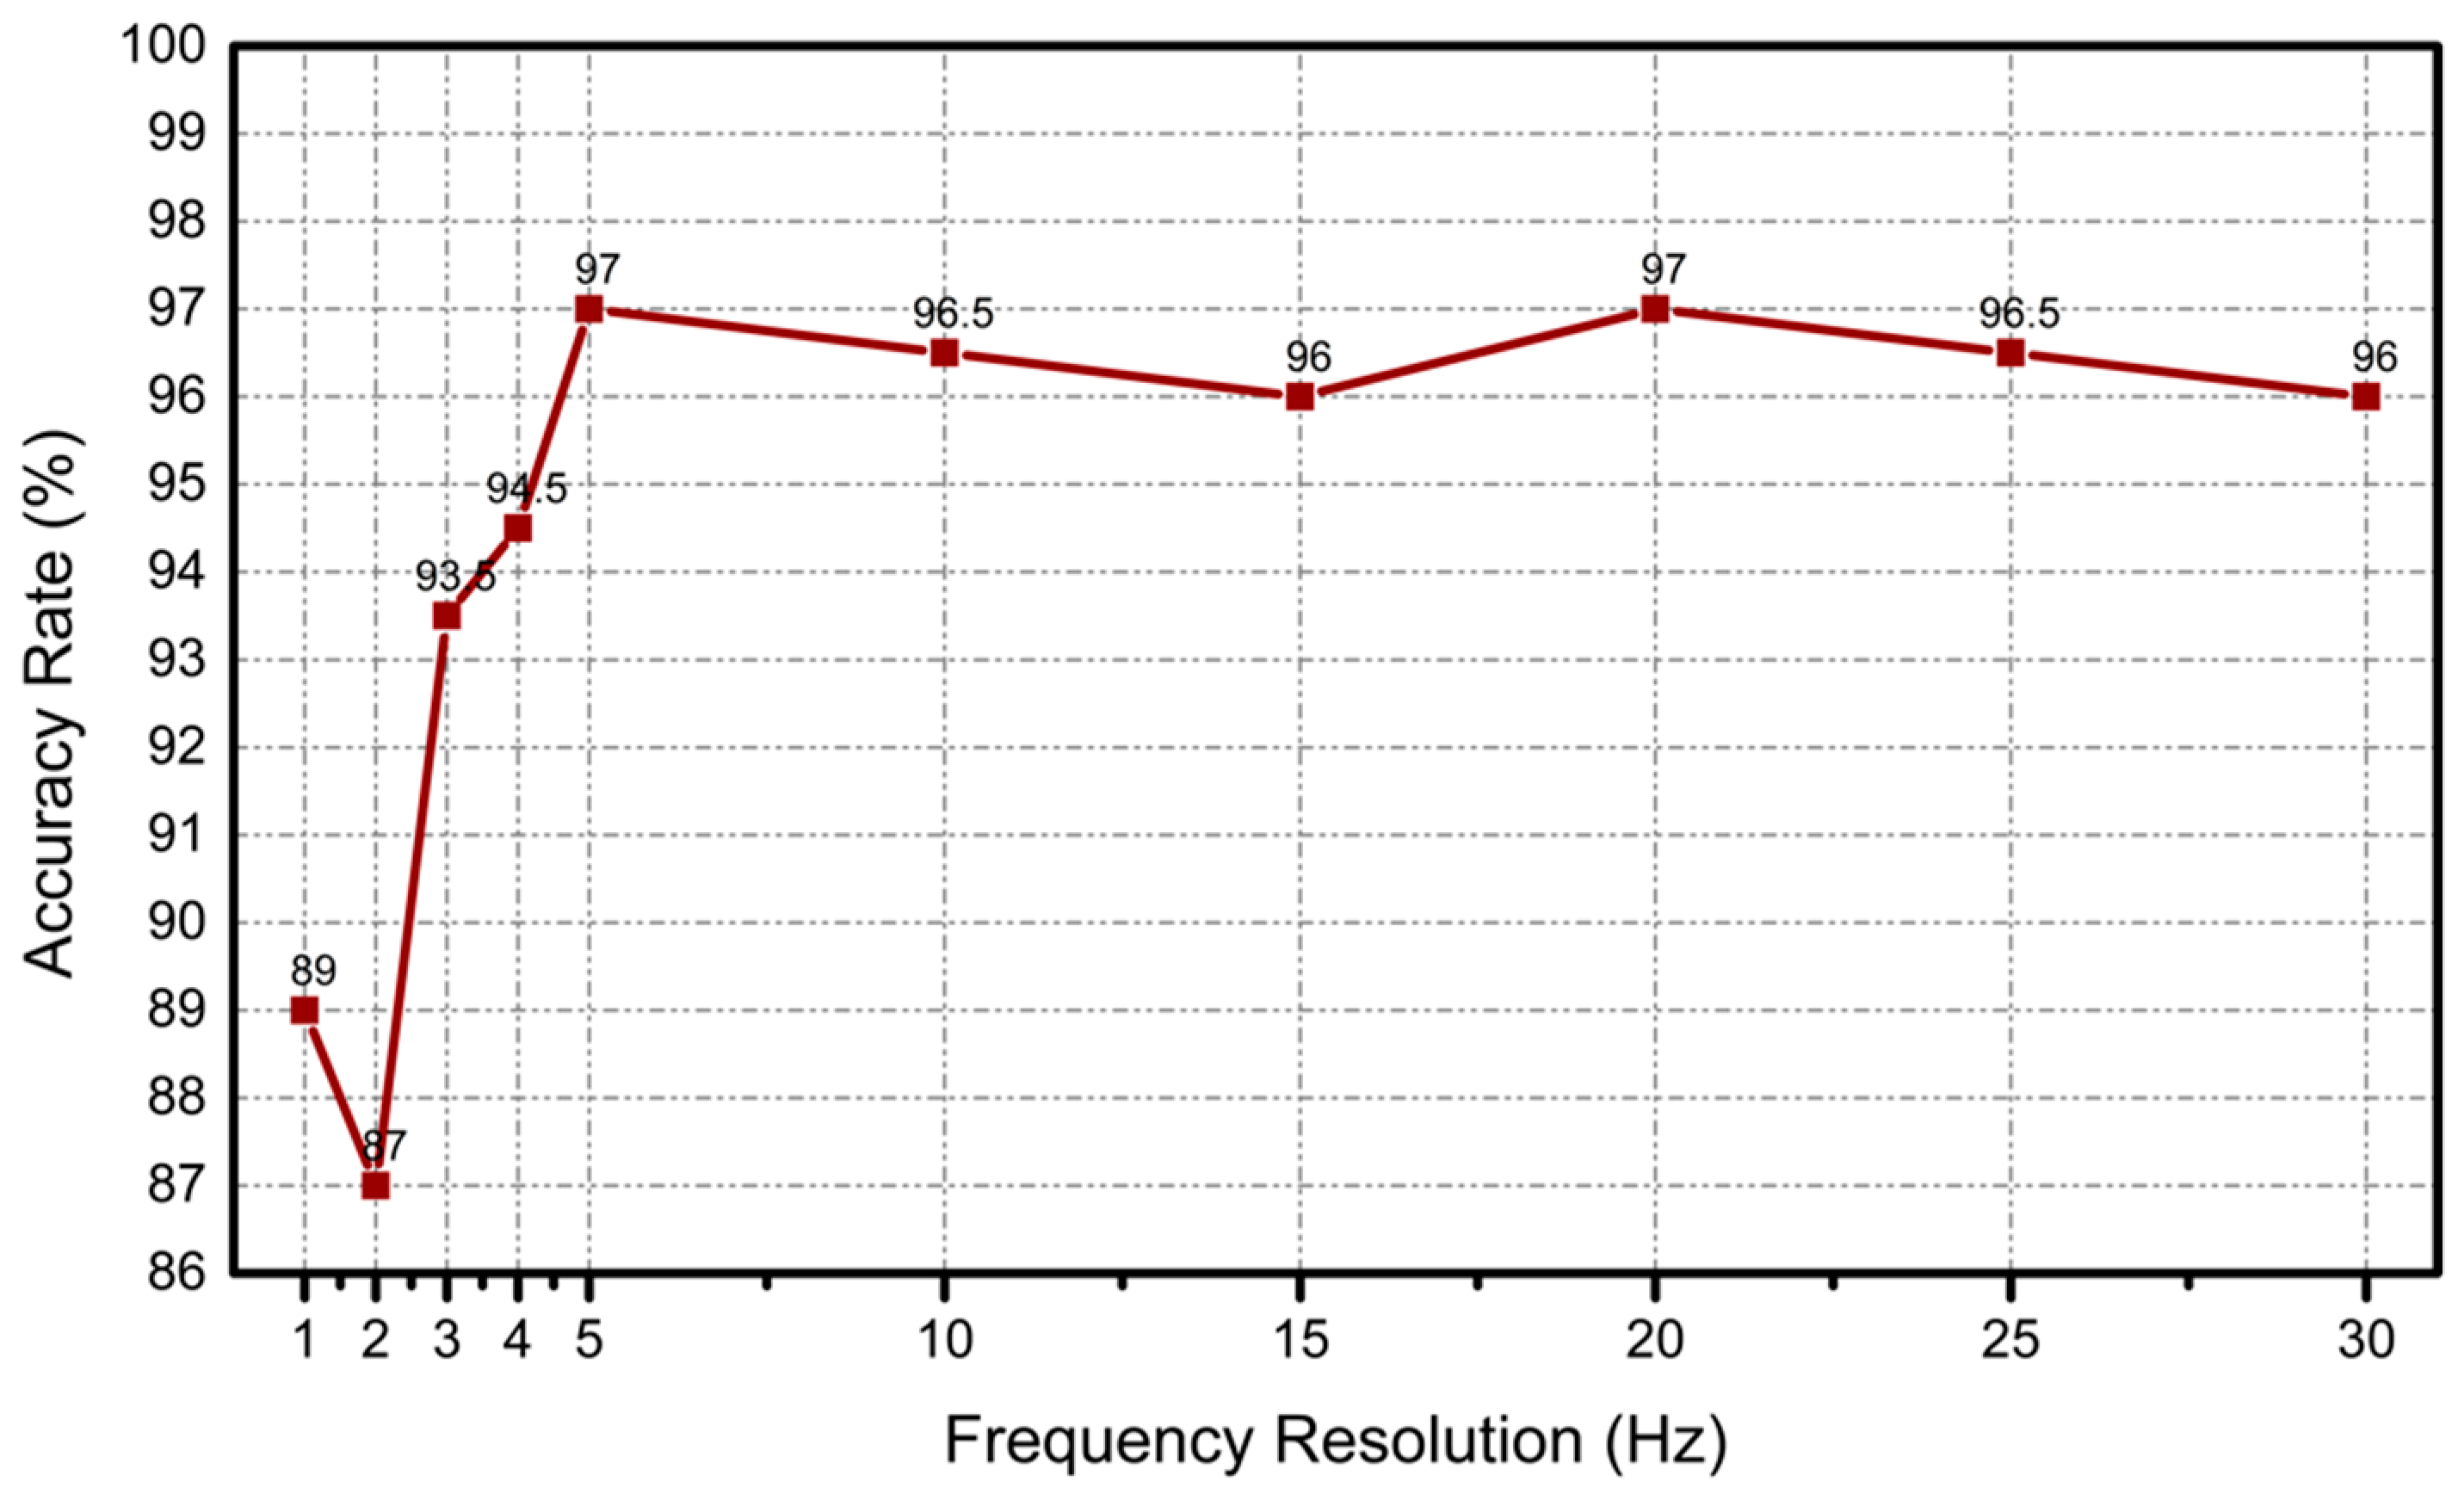
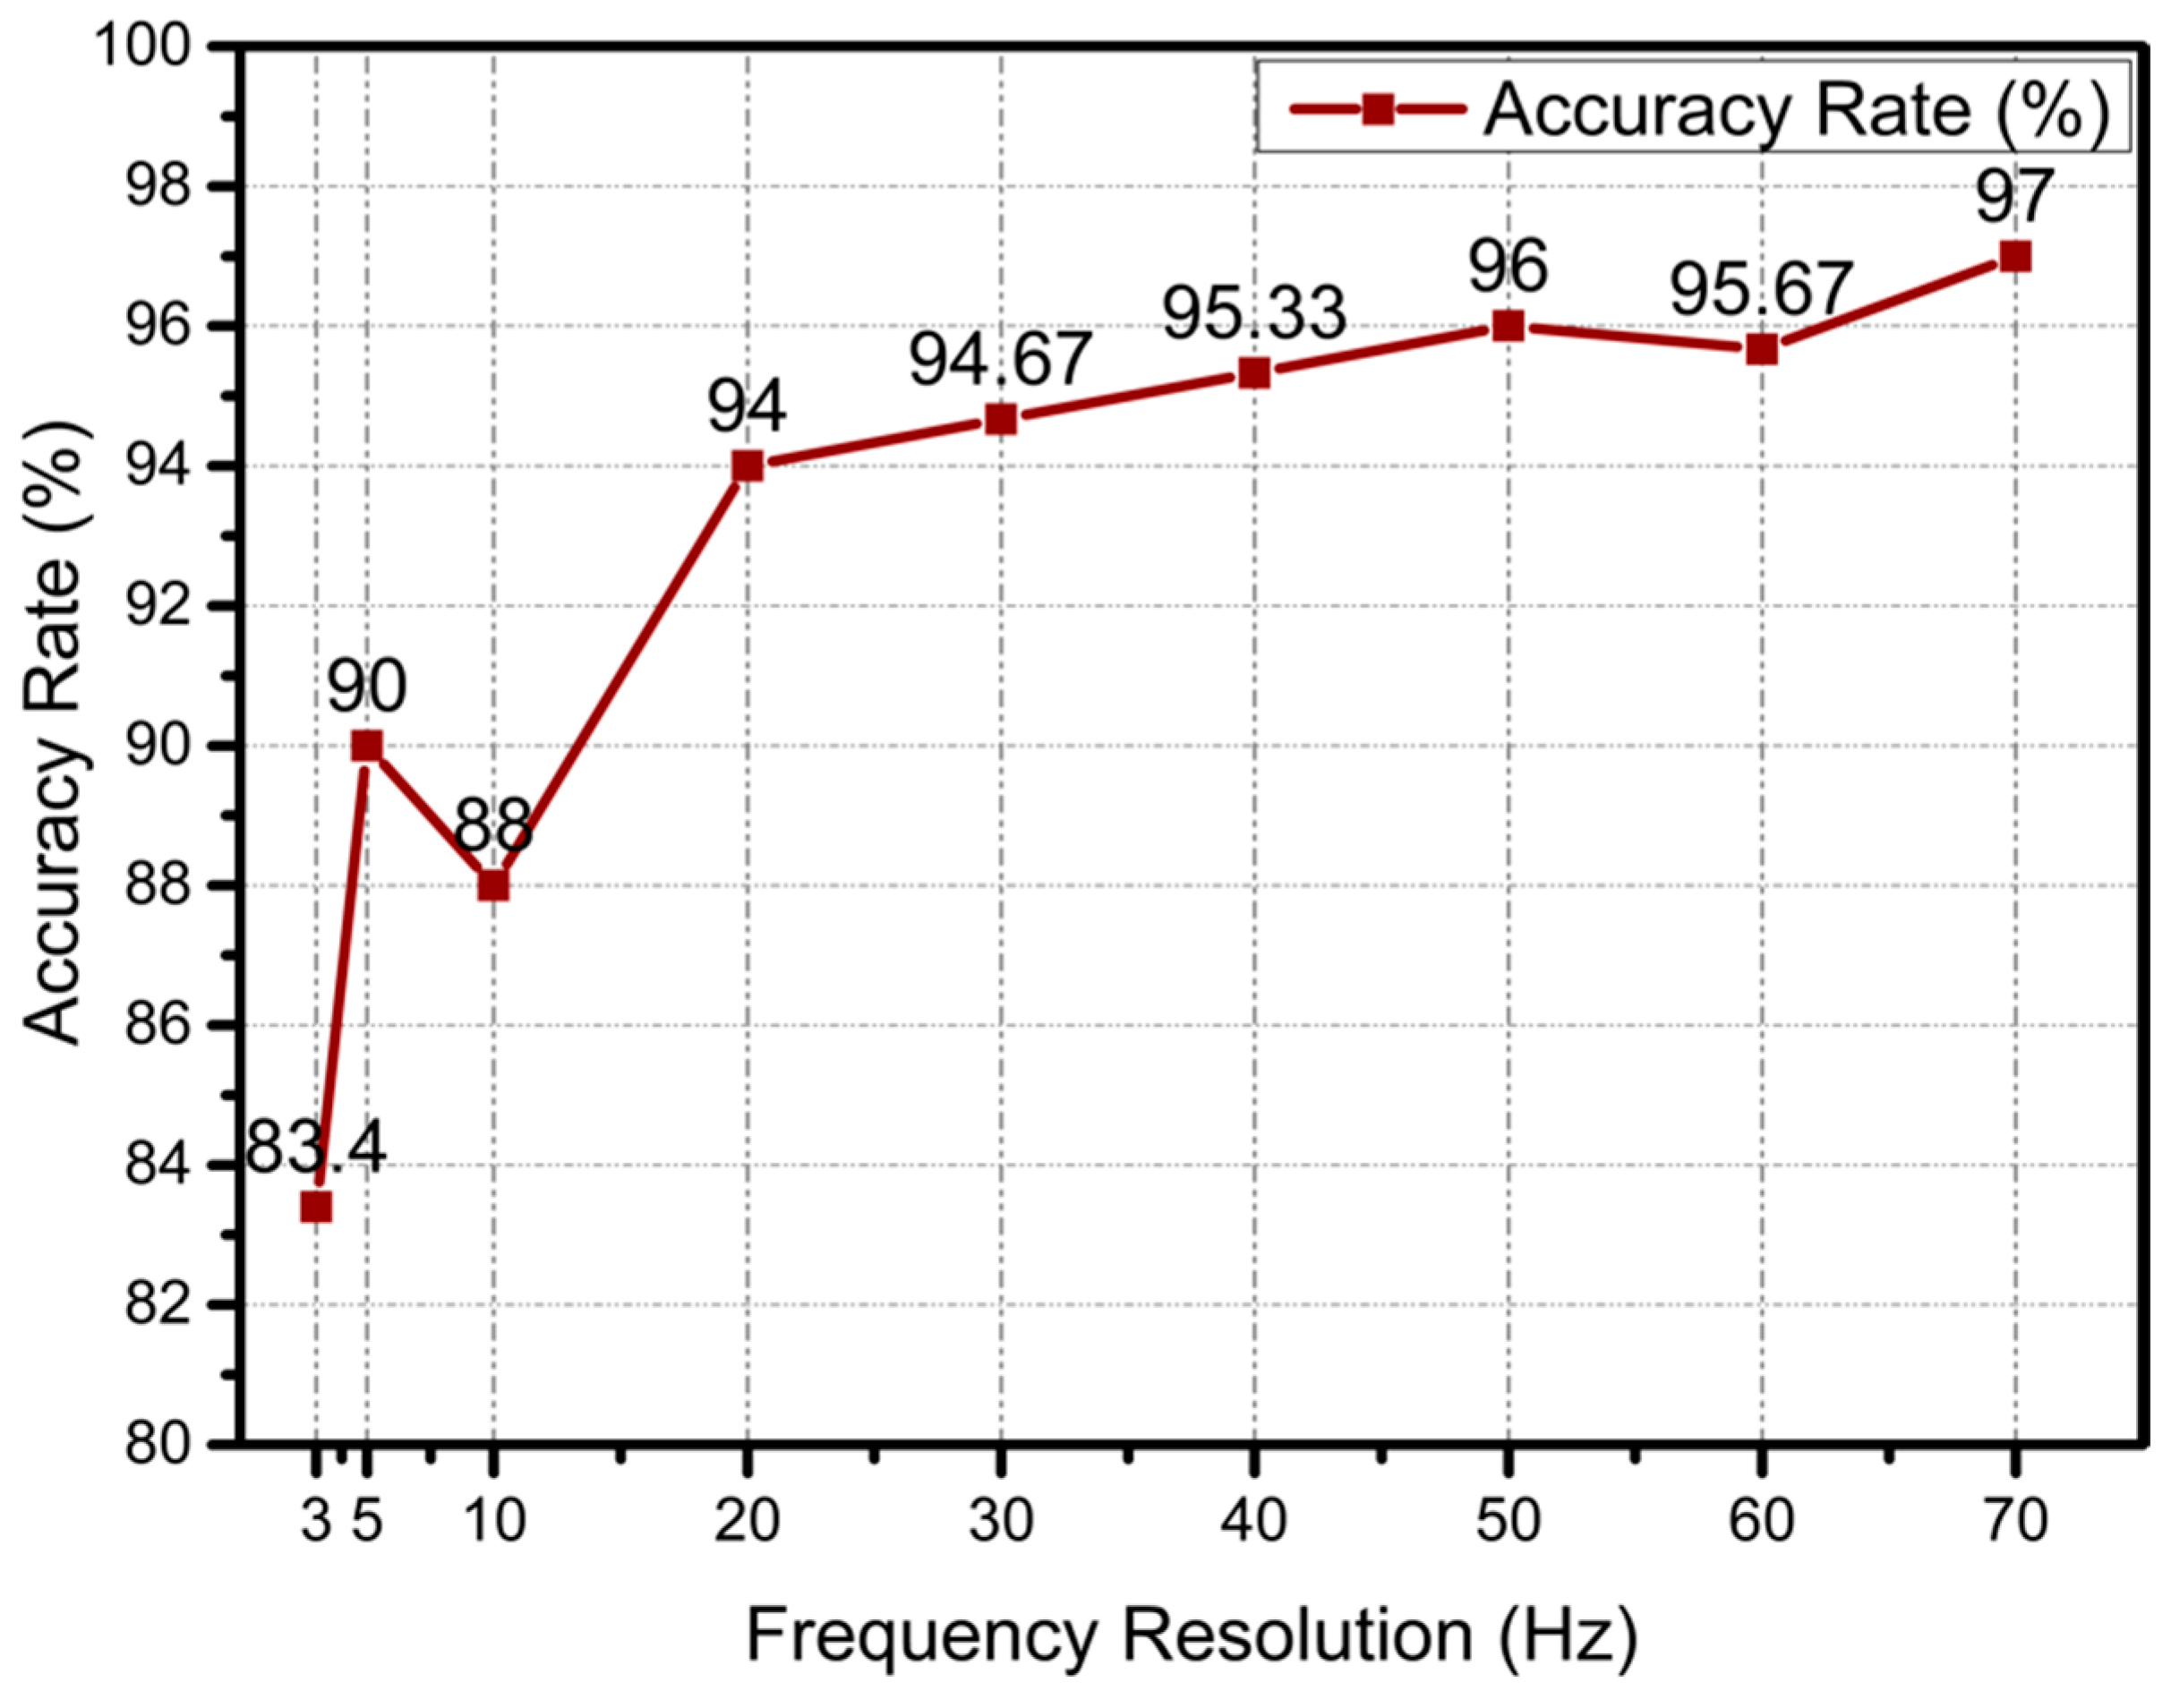
4.3. Frequency Resolution and LED-OFC Recognition Result Analysis

The stripe number and width will all be changed if the frequency changes. However, there is a frequency difference threshold beyond which CNN cannot accurately distinguish the different frequencies of LED-OFC. The threshold is higher in the high frequency range, since it is more difficult to recognize denser stripes. Therefore, experiments were conducted to explore the impact of different frequency resolutions on LED-OFC recognition (the frequency difference of LED-OFCs with different frequencies). In particular, experiments were performed in the low frequency range (500 Hz–5000 Hz) and the high frequency range (5000 Hz–10,000 Hz). Other parameters were: the phase difference was 0°, the distance was 20 cm, and the encoding sequence was “01.” About 2000 images were captured for training, and 200 images for testing in each frequency resolution. The results are shown as follows.

4.3.1. Low Frequency Range

As shown in Figure 9, the recognition accuracy rate rapid declined when the frequency dropped below 3 Hz. When the frequency was greater than 5 Hz, the recognition accuracy was acceptable. That is, to ensure high recognition accuracy, the frequency resolution should be greater than 5 Hz when in a low frequency range.

4.3.2. High Frequency Range

As shown in Figure 10, the minimum frequency resolution in the high frequency range was eight times (40 Hz) that in the low frequency range as seen above, which also proves our previous analysis that, because of the excessively dense stripes of the LED-OFC, the minimum frequency resolution is greater in the high frequency range.
From the above experiments, the conclusion can be drawn that the minimum frequency resolution to ensure high recognition accuracy is 40 Hz. The totally different types of LED-OFC can be calculated as follows: ( 10000 5000 ) 40 + ( 5000 500 ) 5 = 1025 . Moreover, since the color features of the stripes, including the color and the color change cycle, would change if the frequency of each LED were different, more different LED-OFCs can be obtained; only the assumption that all the frequencies were the same was considered in the above experiments. Therefore, there are about 1025 types of frequency. As far as RGB-LED is concerned, since the frequencies of each LED are non-interfering, there will be three different frequencies. According to the principle of permutation and combination in mathematics, the total number should be: 109 ( A 1025 3 ).

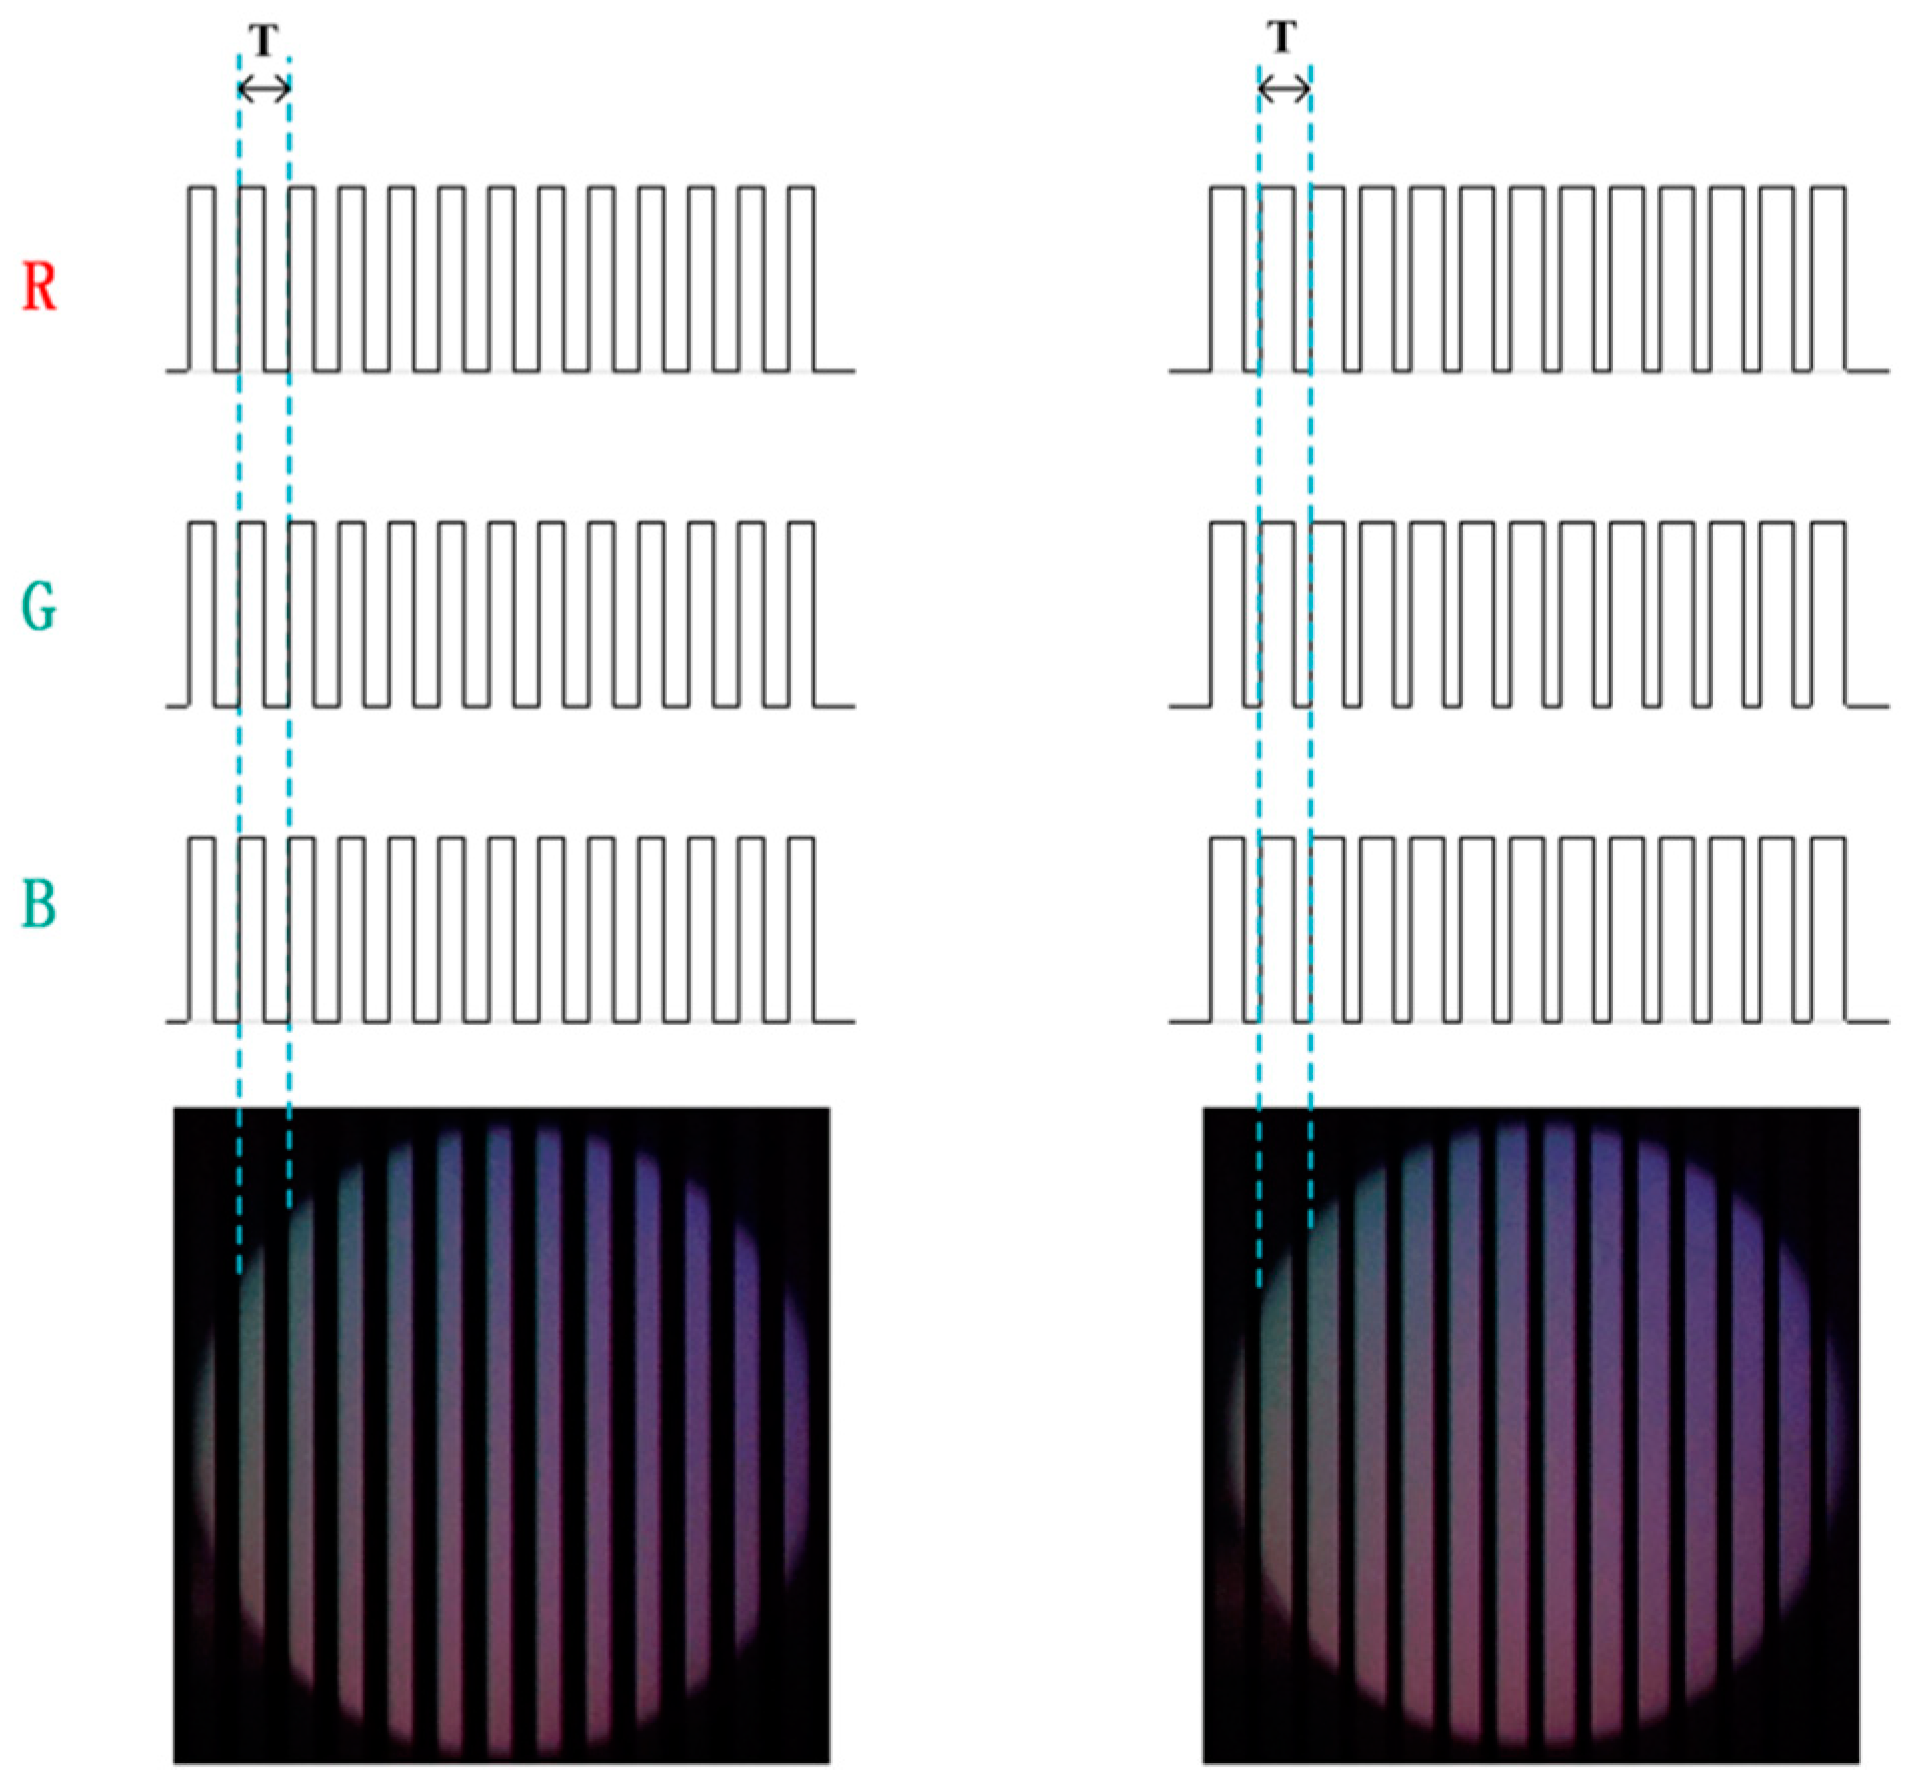
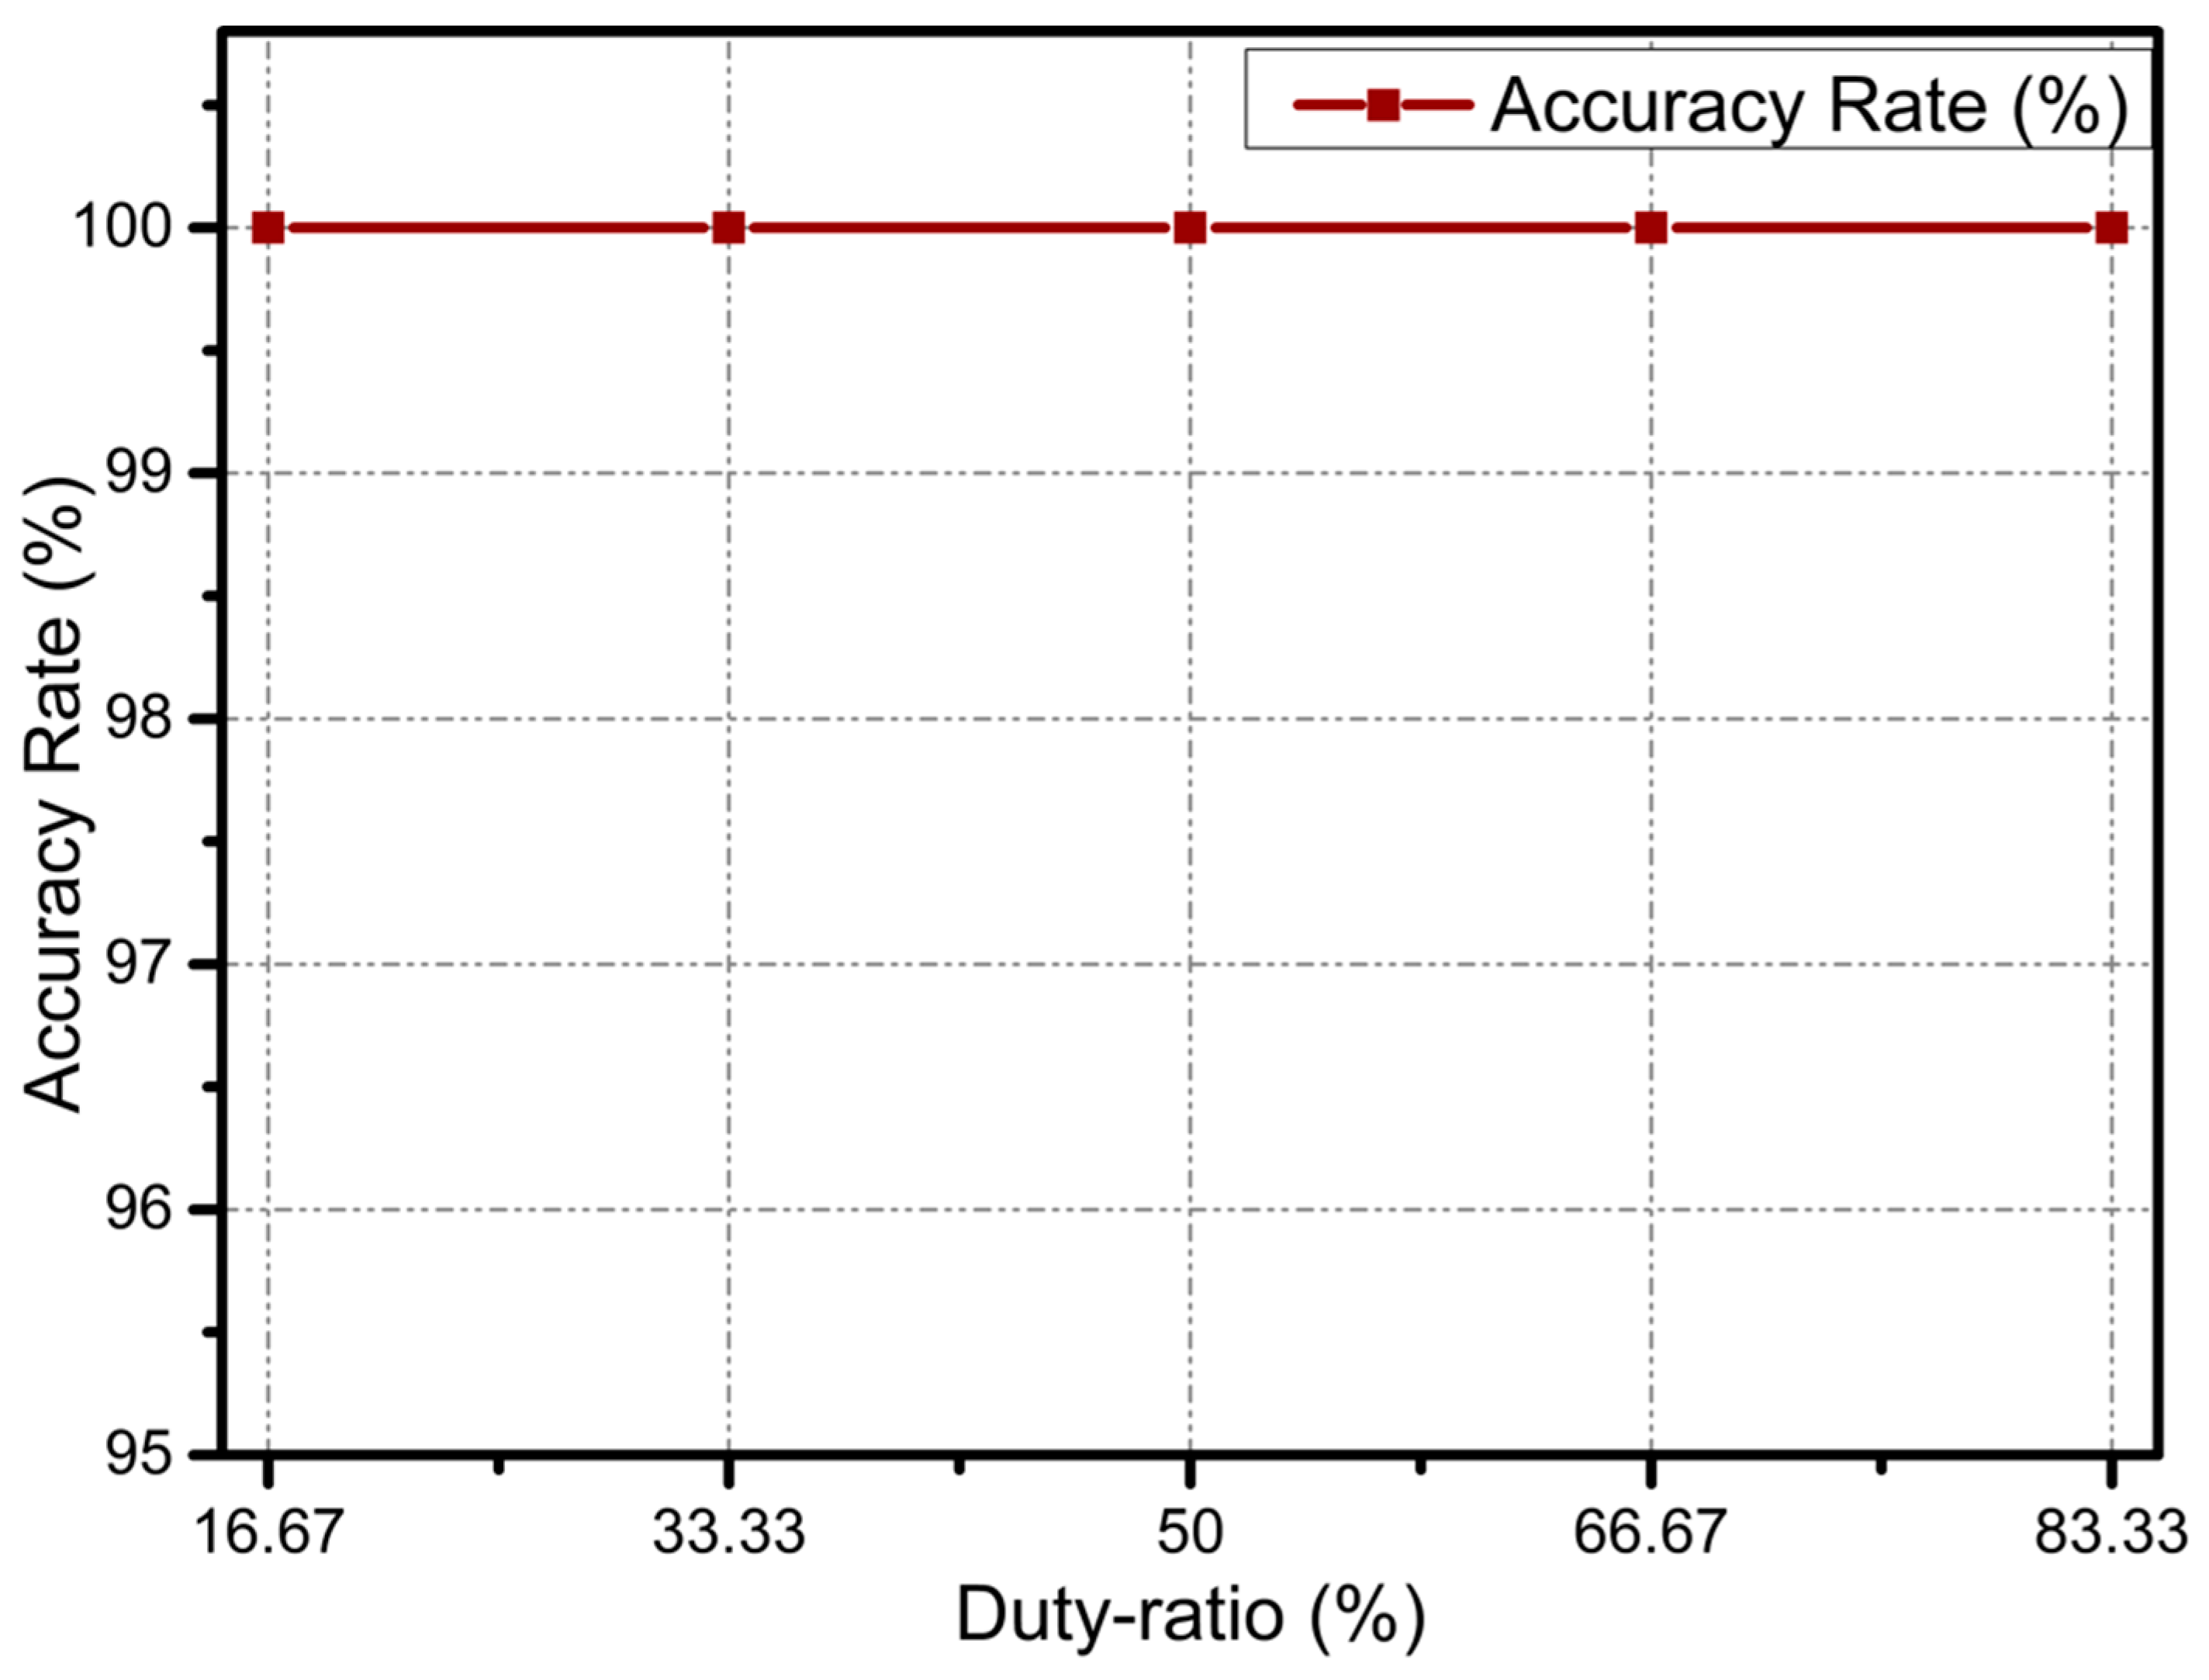
4.4. Duty Ratio and LED-OFC Recognition Result Analysis

By changing the duty ratio, although the number, width, and color of the stripe will be changed, the light intensity will also be changed, which may have an impact on the final recognition result. In this experiment, we explored the effect of different duty ratios on the recognition result. Other parameters were used as follows: the frequency was 1000 Hz, the phase difference was 0°, the distance was 20 cm, and the encoding sequence was “01.” As above, for each duty ratio, 2000 images were acquired for training, and 200 images for testing. The experiment result is shown in Figure 11.
As seen above, the recognition accuracy always maintained 100% as the duty ratio changes. This indicates that the effect of duty ratio on the final recognition result is negligible. This also lays the foundation for the subsequent exploration of the impact of the encoding sequence, as different encoding sequences may result in different duty ratios, which means the experiment has multiple variables. If the duty ratio is negligible, subsequent experiments will be able to explore the effect of encoding sequences on recognition accuracy by controlling variables.

4.5. Phase Difference Resolution and LED-OFC Recognition Result Analysis

As mentioned before, one of the purposes of introducing RGB-LED is to introduce phase difference parameters, which cause the color features (Including color and cycle of the stripes) of the LED-OFC to be changed. This greatly enriches the features of LED-OFC, and facilitates the recognition of CNN. Here, an experiment was designed to explore the minimum phase difference resolution (similar to the experiments in which the frequency resolution was explored above, the phase difference resolution represents the phase difference between different LED-OFCs) that CNN can recognize with high accuracy. Other parameters were as follows: the frequency was 1000 Hz, the distance was 10 cm, and the encoding sequence is “0/1”. As above, for each phase difference resolution, 3000 images were acquired for training, and 300 images for testing. The result is shown in Figure 12.
As we can see, the recognition accuracy became stable (above 95%) when the phase difference resolution was greater than 7.2°. This indicates that the minimum phase difference resolution to ensure high recognition accuracy is 7.2°, and the total number of LED-OFC categories that can be distinguished is 50 ( 360 7.2 = 50 ). As with the frequency resolution experiments above, the rough number can be calculated as follows: There are 50 types of phase difference, as the result shows. There are two non-interfering phase differences on the part of RGB-LED. There is a phase difference between red LED and green LEDs, and a phase difference between green LED and blue LEDs. According to the principle of permutation and combination, the total number should be: 103 ( A 50 2 ).

4.6. Encoding Sequence and LED-OFC Recognition Result Analysis

To explore the effect of encoding sequence on LED-OFC recognition, a six-digit encoding sequence was used. In addition, since the encoding sequence was transmitted cyclically, there were some sequences that are duplicated. Based on this, the non-repeating sequences were selected, which is shown in Table 2. The other parameters were as follows: the frequency was 1000 Hz, the phase difference was 0°, and the distance was 20 cm. For each encoding sequence, about 300 images were acquired for training and 30 images for testing. The final experiment result is shown in Figure 13.
As seen above, the recognition accuracy was high enough; most sequences achieved a 100% accuracy rate, and the recognition accuracy of all encoding sequences was above 95%. As for the relatively low accuracy (96.43% and 95.83%), recognition errors may have been caused by jitter during shooting or other reasons, but, in general, the recognition accuracy was completely acceptable. Moreover, the length of the encoding sequence can be changed, and encoding sequences of different lengths will not produce the same LED-OFC; this indicates that, in theory, many different encoding sequences (including encoding sequence length and encoding sequence bits) can be used to generate many different LED-OFCs which could be recognized with high accuracy, and, in the above experiment, only a six-digit encoding sequence was used to prove the feasibility.

5. Conclusions

In this paper, an OFC detection and recognition system based on VLC using CNN is proposed. Different from the traditional encoding and decoding methods, this paper transforms the problem into an OFC recognition problem, which greatly simplifies the complexity of the VLC system. Frequency, phase, encoding sequence, and distance between receiver and transmitter are considered to produce various OFCs. A CNN structure with FCN style is applied. Once the OFC is recognized correctly, the related information can be obtained.
The results show that the maximum recognizable distance and recognition accuracy were both improved compared with the traditional 2D barcode recognition method. In particular, the proposed scheme can identify approximately 1200 (50 × 2375 = 118,750) different OFCs with high accuracy (more than 95%), which is about 120 times that of Reference [3]. The effective recognition of distance is 3.5 m, which is suitable for most scenes. Therefore, the proposed scheme can complement the traditional two-dimensional bar code, and can be applied to various scenes.
However, there still exist some inevitable limitations to our proposed method. Firstly, the performance of the scheme particularly relies on the restrictive condition that the camera and RGB-LEDs must be parallel to each other. Secondly, the recognition results will be imprecise when detecting high speed objects. Thirdly, the cost of modifying RGB-LEDs is too high for production. Although all the above disadvantages exist, they do not outweigh the innovation and improvement of this paper upon previous methods. These drawbacks will also become our focus and direction in future work.

Author Contributions

Conceptualization, W.G.; Data curation, X.Z., Y.Y., J.Z., J.J.; Investigation, J.L.; Methodology, W.G.; Project administration, J.L. and S.W.; Resources, X.Z.; Software, X.Z. and J.Z.; Supervision, S.W.; Visualization, J.Z. and X.Z.; Writing—original draft, W.G. and J.L.; Writing—review & editing, W.G. and J.L.

Funding

This research was funded by National Undergraduate Innovative and Entrepreneurial Training Program grant number 201510561003, 201610561065, 201610561068, 201710561006, 201710561054, 201710561057, 201710561058, 201710561199, 201710561202, 201810561217, 201810561195, 201810561218, 201810561219, Special Funds for the Cultivation of Guangdong College Students’ Scientific and Technological Innovation (“Climbing Program” Special Funds) grant number pdjh2017b0040, pdjha0028, pdjh2019b0037 and Guangdong science and technology project grant number 2017B010114001.

Conflicts of Interest

The authors declare no conflict of interest.

References

  1. Jin, F.; Li, X.; Zhang, R.; Dong, C.; Hanzo, L. Resource Allocation Under Delay-Guarantee Constraints for Visible-Light Communication. IEEE Access 2017, 4, 7301–7312. [Google Scholar] [CrossRef]
  2. Fang, J.; Yang, Z.; Long, S.; Wu, Z.; Zhao, X.; Liang, F.; Jinag, Z.L.; Chen, Z. High-speed indoor navigation system based on visible light and mobile phone. IEEE Photonics J. 2017, 9, 1–11. [Google Scholar] [CrossRef]
  3. Xie, C.; Guan, W.; Wu, X.; Fang, L.; Cai, Y. The LED-ID Detection and Recognition Method based on Visible Light Positioning using Proximity Method. IEEE Photonics J. 2018, 10, 1–16. [Google Scholar] [CrossRef]
  4. Zhang, B.; Ren, K.; Xing, G.; Fu, X.; Wang, C. SBVLC: Secure barcode-based visible light communication for smartphones. IEEE Trans. Mob. Comput. 2006, 15, 432–446. [Google Scholar] [CrossRef]
  5. Chen, H.W.; Wen, S.S.; Liu, Y.; Fu, M.; Weng, Z.C.; Zhang, M. Optical camera communication for mobile payments using an LED panel light. Appl. Opt. 2018, 57, 5288–5294. [Google Scholar] [CrossRef] [PubMed]
  6. Zhang, X.; Gao, Q.; Gong, C.; Xu, Z. User Grouping and Power Allocation for NOMA Visible Light Communication Multi-Cell Networks. IEEE Commun. Lett. 2017, 21, 777–780. [Google Scholar] [CrossRef]
  7. Islim, M.S.; Ferreira, R.X.; He, X.; Xie, E.; Videv, S.; Viola, S.; Watson, S.; Bamiedakis, N.; Penty, R.V.; White, I.H.; et al. Towards 10 Gb/s orthogonal frequency division multiplexing-based visible light communication using a GaN violet micro-LED. Photonics Res. 2017, 5, A35–A43. [Google Scholar] [CrossRef]
  8. Lin, B.; Tang, X.; Yang, H.; Ghassemlooy, Z.; Zhang, S.; Li, Y.; Lin, C. Experimental Demonstration of IFDMA for Uplink Visible Light Communication. IEEE Photonics Technol. Lett. 2016, 28, 2218–2220. [Google Scholar] [CrossRef]
  9. Chow, C.W.; Chen, C.Y.; Chen, S.H. Enhancement of Signal Performance in LED Visible Light Communications Using Mobile Phone Camera. IEEE Photonics J. 2015, 7, 1–17. [Google Scholar] [CrossRef]
  10. Liang, K.; Chow, C.W.; Liu, Y. RGB visible light communication using mobile phone camera and multi-input multi-output. Opt. Express 2016, 24, 9383–9388. [Google Scholar] [CrossRef] [PubMed]
  11. Hu, P.; Pathak, P.H.; Feng, X.; Fu, H.; Mohapatra, P. ColorBars: Increasing data rate of LED-to-camera communication using color shift keying. In Proceedings of the 11th ACM Conference on Emerging Networking Experiments and Technologies, Heidelberg, Germany, 1–4 December 2015; pp. 1–13. [Google Scholar]
Figure 1. Rolling shutter mechanism of metal-oxide-semiconductor (CMOS) sensor.
Applsci 09 01400 g001
Figure 2. The effect of different frequencies.
Applsci 09 01400 g002
Figure 3. The effect of different phases.
Applsci 09 01400 g003
Figure 4. The effect of different encoding sequences.
Applsci 09 01400 g004
Figure 5. The effect of the distance between LED and CMOS camera.
Applsci 09 01400 g005
Figure 6. The architecture of the CNN used.
Applsci 09 01400 g006
Figure 7. (a) System overview. (b) Experimental setup.
Applsci 09 01400 g007
Figure 8. Recognition accuracy rates at different distances.
Applsci 09 01400 g008
Figure 9. The recognition accuracy rate at different frequency resolutions in the low resolution range.
Applsci 09 01400 g009
Figure 10. The recognition accuracy rate at different frequency resolution in high frequency range.
Applsci 09 01400 g010
Figure 11. The recognition accuracy rate at different duty ratios.
Applsci 09 01400 g011
Figure 12. The recognition accuracy rate at different phase difference resolution.
Applsci 09 01400 g012
Figure 13. Recognition accuracy of different encoding sequences.
Applsci 09 01400 g013
Table 1. Hardware parameters of the experiments.
ParameterValue
The focal length/mm4.25
The resolution of the camera4032 × 2448
The exposure time of the camera/ms0.1
The ISO of the camera100
The aperture of the cameraF1.7
The diameter of the LED downlight/cm6
The power of each LED/W9
Current of each LED/mA 85
Voltage of each LED/V5
Table 2. Encoding sequences.
LED-OFC IDEncoding Sequence
1000001
2000011
3000101
4001001
5000111
6001011
7010101
8001111
9010111
10011011
11011111

