Article

Guided Wave-Based Monitoring of Evolution of Fatigue Damage in Glass Fiber/Epoxy Composites

State Key Laboratory of Mechanics and Control of Mechanical Structures, College of Aerospace Engineering, Nanjing University of Aeronautics and Astronautics, Nanjing 210016, China
*
Author to whom correspondence should be addressed.
Appl. Sci. 2019, 9(7), 1394; https://doi.org/10.3390/app9071394
Submission received: 28 February 2019 / Revised: 26 March 2019 / Accepted: 26 March 2019 / Published: 3 April 2019
(This article belongs to the Special Issue Damage Inspection of Composite Structures)

Abstract

:

Featured Application

The technique presented in this paper has potential application in structural health monitoring of composite structures.

Abstract

This paper presents an experimental study on detecting and monitoring of evolution of fatigue damage in composites under cyclic loads by using guided waves. Composite specimens fabricated by glass fiber/epoxy laminates and surface mounted with piezoelectric wafers are fatigued under tension–tension loads. A laser extensometer is used to obtain the degradation of longitudinal stiffness of the specimens under fatigue states to reflect the accumulation of internal fatigue damage. Meanwhile, at different fatigue cycles, one wafer acts as actuator to excite diagnostic guided waves, and the other acts as sensor to receive corresponding response waves. These guided wave signals are then processed by wavelet packet transform to extract characteristic features of energies in multiple frequency bands. A statistical multivariate outlier analysis is then performed to determine the existence of fatigue damage and to characterize their evolution using Mahalanobis squared distance. Experimental results have demonstrated the potential applicability and effectiveness of guided waves for continuous monitoring of fatigue damage in composite structures.

1. Introduction

Nowadays, composites are widely used in engineering structures due to their advantages of light weight, high specific stiffness and strength. However, in the long run, fatigue damage initiated with matrix cracks may inevitably accumulate in composite structures under cyclic loads. If this kind of fatigue damage cannot be detected in time, it may continue to grow with new emerging damage patterns such as delamination and fiber breakages, leading to catastrophic failure of the structures [1,2]. Thus it is very important and crucial to develop structural health monitoring (SHM) techniques to detect the fatigue damage inside composite structures and, if possible, to continuously monitor its evolution [3,4,5,6,7,8,9,10,11].
During the past two decades, a lot of techniques and methods as well as sensor networks have been proposed to detect and identify damage in composites [12,13,14,15,16,17]. Among them, the guided wave-based approach is considered as one of the most promising techniques. Using advanced signal processing techniques, damage could be detected and identified by extracting characteristic information contained in transient guided waves. A wide range of theoretical and experimental studies have been performed to demonstrate the effectiveness of damage detection and identification using guided waves [18,19,20,21,22,23,24,25,26,27]. However, most of these methods focus on impact damage which is localized damage phenomenon instead of extended damage such as those caused by cyclic fatigue loads [28,29].
Usually, in the initial stage, fatigue damage in composites mainly contains accumulated micro matrix cracks, resulting in a gradual stiffness degradation [1,2]. Thus, for monitoring fatigue damage in composites, it is a straightforward way to monitor the degradation of stiffness to reflect the internal damage. For example, Seale et al. studied the change of velocities and amplitudes of guided waves in thermal–mechanical aged composites. They found that the velocities of symmetric S0 Lamb waves reduced with the reduction of the in-plane stiffness, demonstrating that the accumulated fatigue damage in composites can be characterized by measuring the velocities of the waves [28]. Rheinfurth et al. employed noncontact technique to excite and receive guided waves in composite under different fatigue loading conditions, and studied the relationship between the change of wave velocities of antisymmetric A0 Lamb waves and the stiffness degradation [29]. Further, to quantitatively indicate the internal fatigue damage, studies have been performed to identify the elastic properties of composites under different fatigue states by using guided waves and try to relate the reduction of elastic properties with internal matrix cracks with micromechanics models. For example, Marzani et al. used semianalytical finite element (SAFE) method to model the dispersion curves of guided waves in an anisotropic composite plate, and combined the experimentally obtained dispersion curves from time–frequency analysis to identify the elastic parameters [30]. Zhao et al. used a laser–ultrasonic system to measure the phase velocity of ultrasonic guided waves in composites, and then employed genetic algorithm combined with the measured phase velocity to invert the elastic modulus [31]. Tao et al. selected phase velocity of the S0 mode Lamb wave in the low frequency region to characterize the fatigue damage in a composite laminate under cyclic loads in different fatigue stages. They also used the phase velocity and damage model to predict the evolution of fatigue damage [32].
In contrast to the aforementioned velocity-based characterization methods, researchers also used signal features to characterize fatigue damage in composites with guided waves [33,34,35,36]. By extracting the damage-sensitive feature from the received guided waves, the fatigue damage can be classified and identified. For example, Peng et al. used guided waves for in situ fatigue life prognosis for composite laminates. They employed selected features such as normalized amplitude, correlation coefficient and cross-correlation to characterize the fatigue damage and established a regression model to relate them with stiffness degradation [33]. Wilson and Chang found that time-of-flight (TOF), amplitude, and power spectral density (PSD) of the guided waves were sensitive features to fatigue induced matrix cracks and delamination. They defined damage indices (DIs) with these features to characterize the growth of matrix cracks and selected the PSD as the most sensitive feature to correlate with the matrix cracks [34]. In addition to linear waves, nonlinear guided waves and their corresponding features were also employed for fatigue damage detection [35,36]. For example, Li et al. investigated the second harmonic generation of guided wave in composite laminates, and the correlation between the acoustic nonlinearity and the degradation of composite laminate was studied, demonstrating that the extracted nonlinear feature can characterize damage in an early stage [36]. However, most of these works extracted only a univariate feature in the time or frequency domain, while deterministic approaches were employed for characterizing fatigue damage without consideration of uncertainties from environmental effects and measurement noise.
This paper presents experimental studies on detecting and monitoring of evolution of fatigue damage in glass fiber/epoxy (GF/EP) composites under cyclic loads by using guided waves. Following feature extraction of signal energies in multiple frequency bands by wavelet packet transform (WPT), a statistical multivariate outlier analysis is performed to determine whether fatigue damage exist in the specimens and to characterize the evolution of fatigue damage using Mahalanobis squared distance (MSD). The rest of this paper is structured as follows. Section 2 describes the experimental fatigue tests of the composite specimens and the monitoring process. Section 3 and Section 4 present the WPT-based signal processing and feature extraction, and statistical multivariate outlier analysis, respectively. Experimental results are given in Section 5 to verify the effectiveness and applicability of the proposed method. Finally, conclusions are summarized in Section 6.

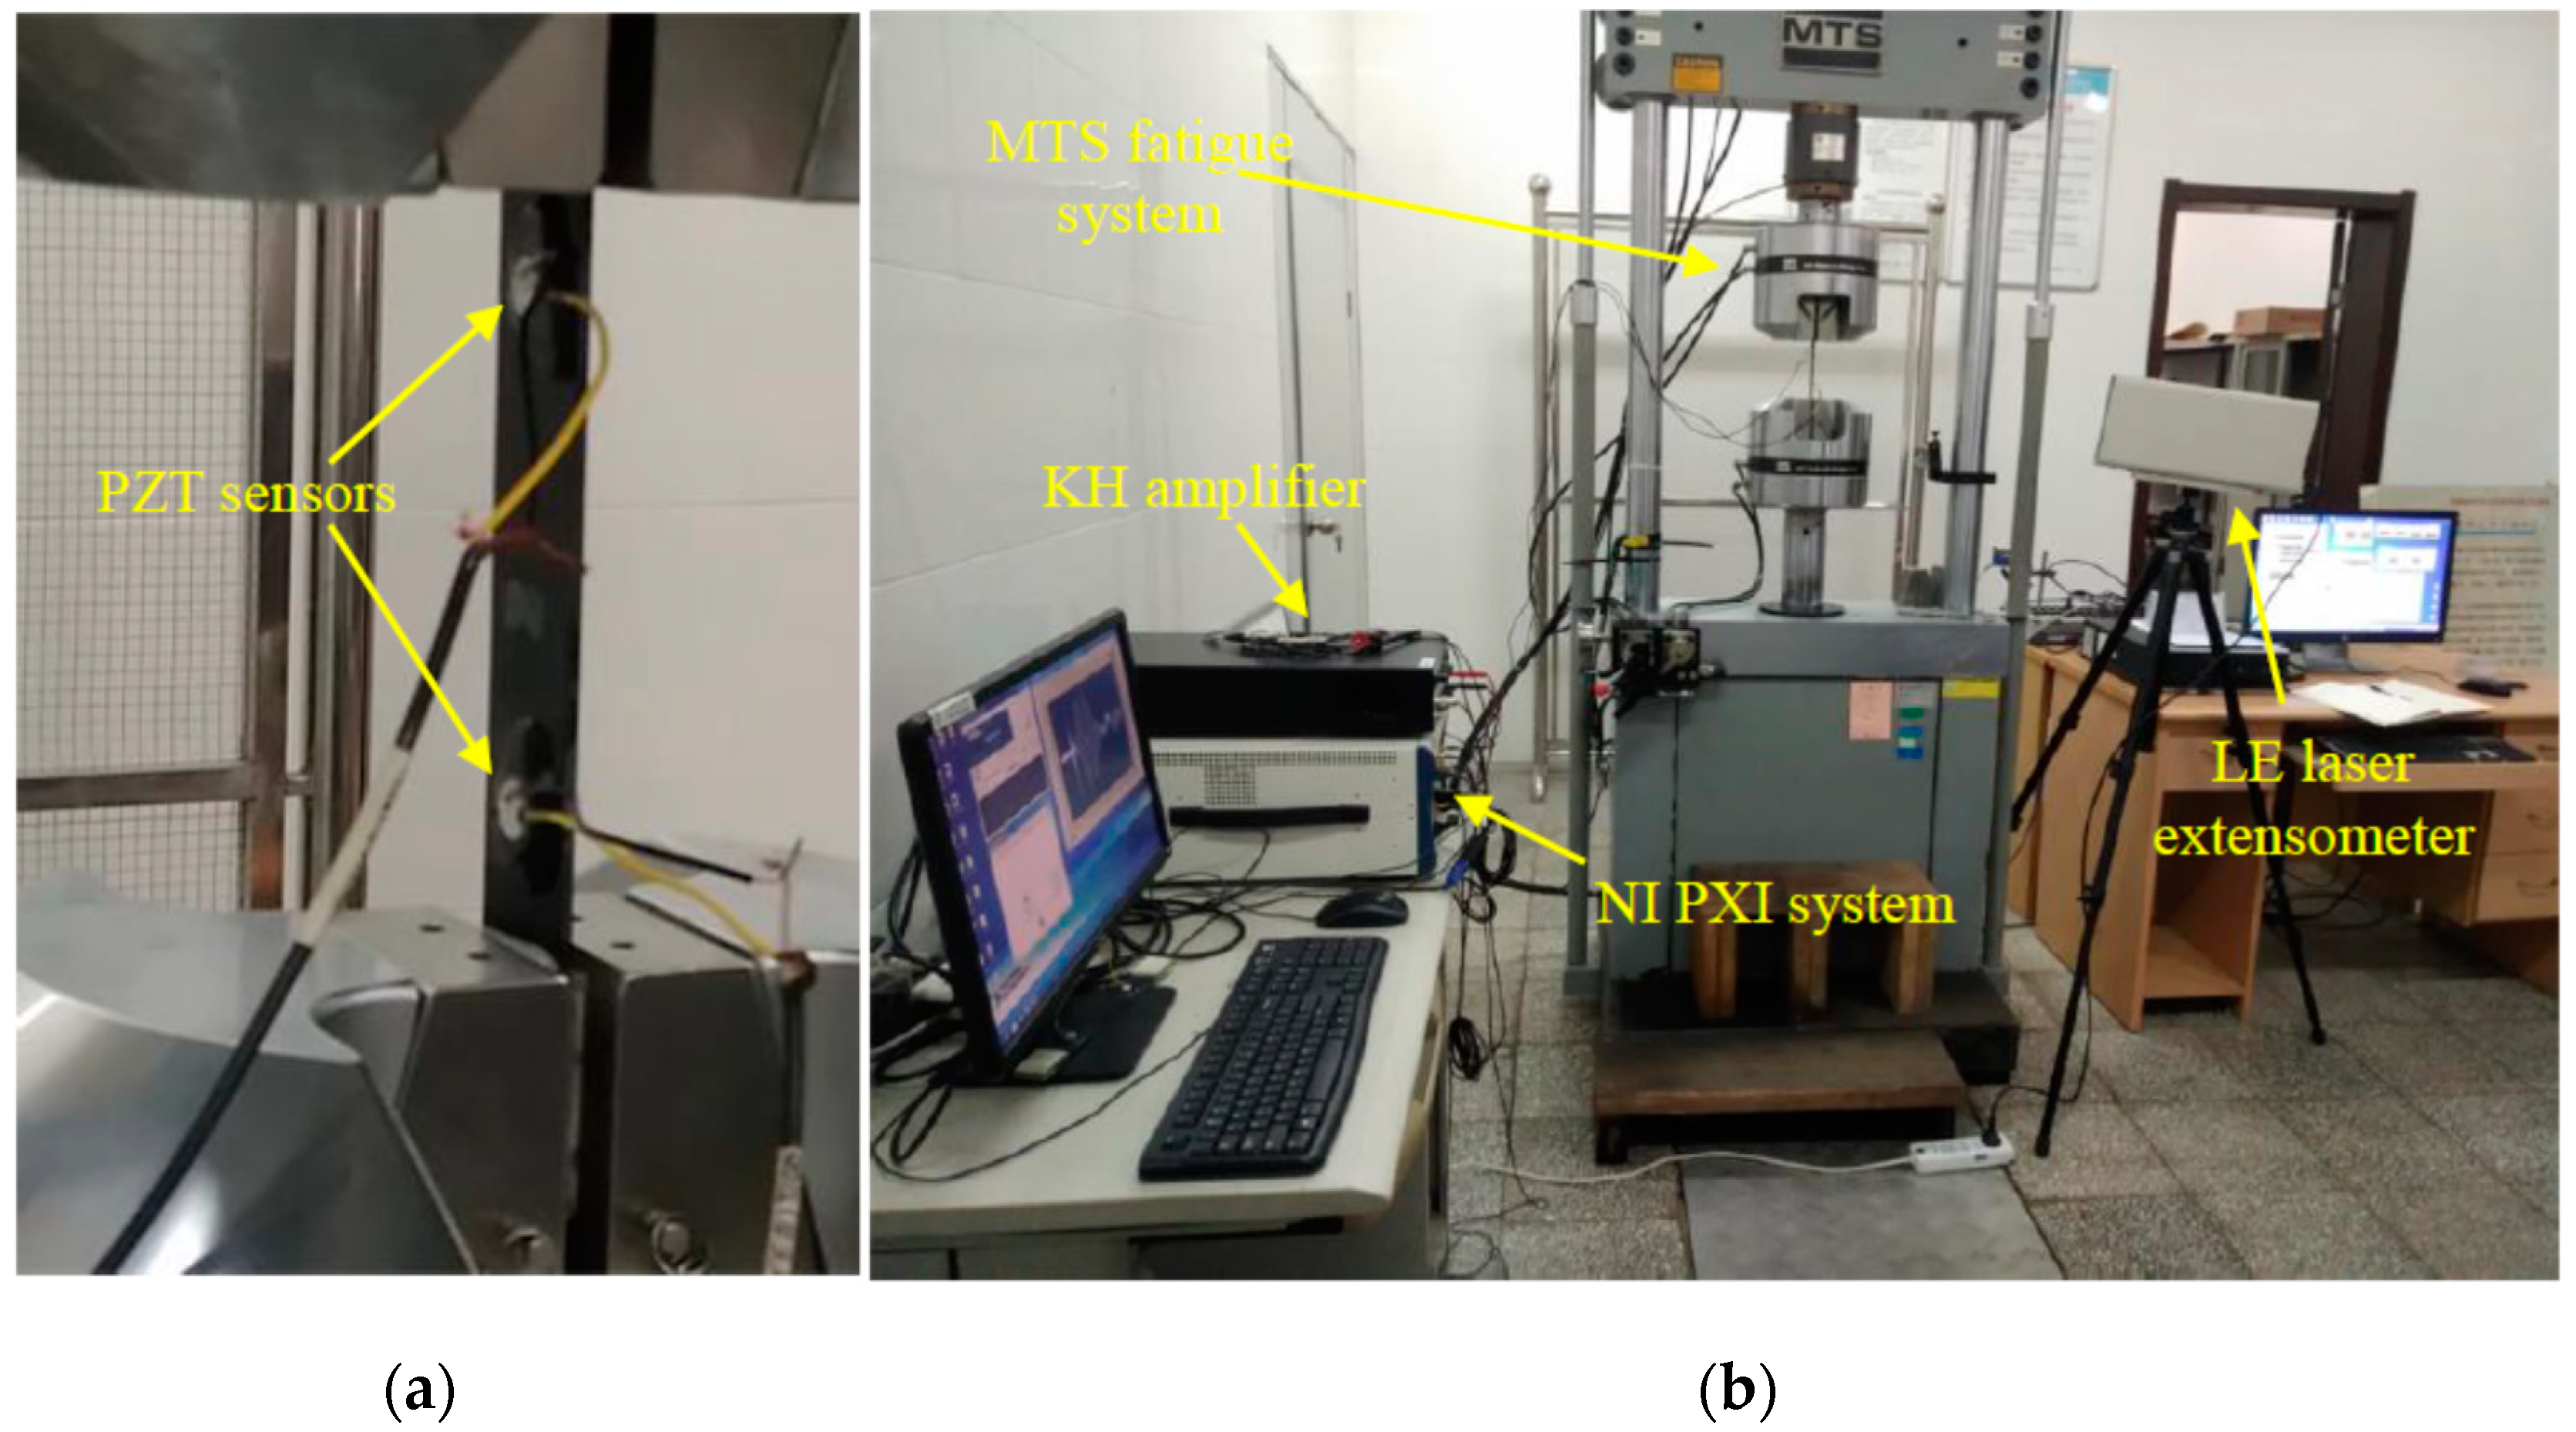
2. Experimental Test

To perform experimental study, two GF/EP laminate with [06/906]s and [04/908]s layups were fabricated, respectively. The G15000 unidirectional prepregs were purchased from Weihai Guangwei Composites Co. Ltd., with thickness of 0.12 mm and resin content of 30–40%. After stacking the layers with designed layups, the laminates are manufactured through hot-press with temperature of 120 °C for 90 min. The cured laminates have a thickness of 2.6 mm, and they were then cut into 200 mm × 30 mm specimens for tensile and fatigue tests. The average maximum tensile load for three specimens of [06/906]s layup is 22.15 kN, corresponding to an average tensile strength of 283.97 MPa, and for three specimens of [04/908]s the layup is 16.19 kN, corresponding to an average tensile strength of 207.56 MPa. The other two specimens from [06/906]s and [04/908]s layups are labeled as S_A and S_B for fatigue test, respectively. As illustrated in Figure 1a, the two ends of the specimens are reinforced for gripping, and on the surface of the specimens, two P-51 piezoelectric wafers purchased from Wuxi Haiying Co. were mounted by epoxy with a distance of 80 mm. The diameter and thickness of the wafers are 10 mm and 1 mm, respectively. In the following experiments, one wafer acts as actuator to excite diagnostic guided waves into the specimens and the other acts as sensor to receive the response waves.
A test setup consisting of a MTS 810.25 fatigue test system and a guided waves monitoring system is established. The monitoring system contains a KH-7600 wideband amplifier produced by Krohn-Hite Corporation, a PXI-5441 arbitrary function generator, a PXI-5105 digitizer, and an embedded controller, which were all produced by National Instrument Corporation. In addition, a noncontact laser extensometer LE-05 produced by Electronic Instruments Research is also used to provide reference stiffness information to the guided wave-based technique. The overall view of the test setup is shown in Figure 1b. For the fatigue test, tension–tension cyclic loads are applied to the specimens. The maximum tensile loads applied to specimens S_A and S_B are 11 kN (equals to nominal stress of 141.03 MPa) and 8 kN (equals to nominal stress of 102.56 MPa), respectively; the stress ratios and loading frequencies of both cyclic loads are 0.1 and 1 Hz, respectively. In order to follow the evolution of fatigue damage, the longitudinal stiffness of the specimens is first obtained before fatigue tests (zero fatigue cycle) and then at periodically paused intervals of each 1000 cycles. A set of small loads were applied to the specimens and the corresponding displacements were measured by the laser extensometer. With the information of loads and displacements, the longitudinal stiffness can be calculated. Table 1 lists the longitudinal stiffness data for both specimens within 10,000 fatigue cycles, while Figure 2 shows the variations of longitudinal stiffness with increase of fatigue cycles. It can been observed from Figure 2 that, with the increase of fatigue cycles, the longitudinal stiffness of the two specimens degrades; at the end of 10,000 fatigue cycles, the stiffness of specimens S_A and S_B reduces by approximately 11.2% and 8.6%, respectively. The stiffness reduction reflects the fatigue damage accumulation in the composite specimens [24,25].
Meanwhile, for monitoring the fatigue damage by using guided waves, the PXI-5441 arbitrary function generator sends a diagnostic wave signal which is amplified by KH-7600 amplifier and drives the actuator to generate guided waves, the response wave signals are then sensed by the sensor and acquired by the PXI-5105 digitizer, whose sampling rate is set at 10 MHz. In this study, a modulated five-cycle signal with center frequency of 250 kHz is employed as the diagnostic wave. Figure 3a,b shows the time trace and the frequency spectrum of the diagnostic excitation, respectively. The narrow frequency band can help to reduce distortion of the response wave signals due to dispersion effects. The response wave signals before fatigue test (zero fatigue cycle) is first acquired as the baseline signals and then measured with an interval of 1000 cycles when the fatigue tests are periodically paused. Figure 4a and Figure 5a show a comparison of six sets of typical response wave signals under the fatigue state after 1000, 2000, 3000, 4000, and 5000 fatigue cycles, as well as the baseline wave signals obtained from the two specimens, respectively. The later acquired wave signals are not plotted together due to difficulty for clearly discerning each other. Combined with the stiffness information provided by Table 1 and Figure 2, it can be seen from the figures that with the increase of fatigue cycles, fatigue damage accumulate in the specimens, leading to the change of response wave signals, especially the reduction of amplitudes. Also, as illustrated in the locally zoomed signals in Figure 4b and Figure 5b, at an early stage of the fatigue tests, the wave signals change rapidly, and then change slowly. This trend is similar to the degradation of longitudinal stiffness of the composite specimens, indicating the evolution of fatigue damage in composites can be characterized by analyzing the guided wave signals.

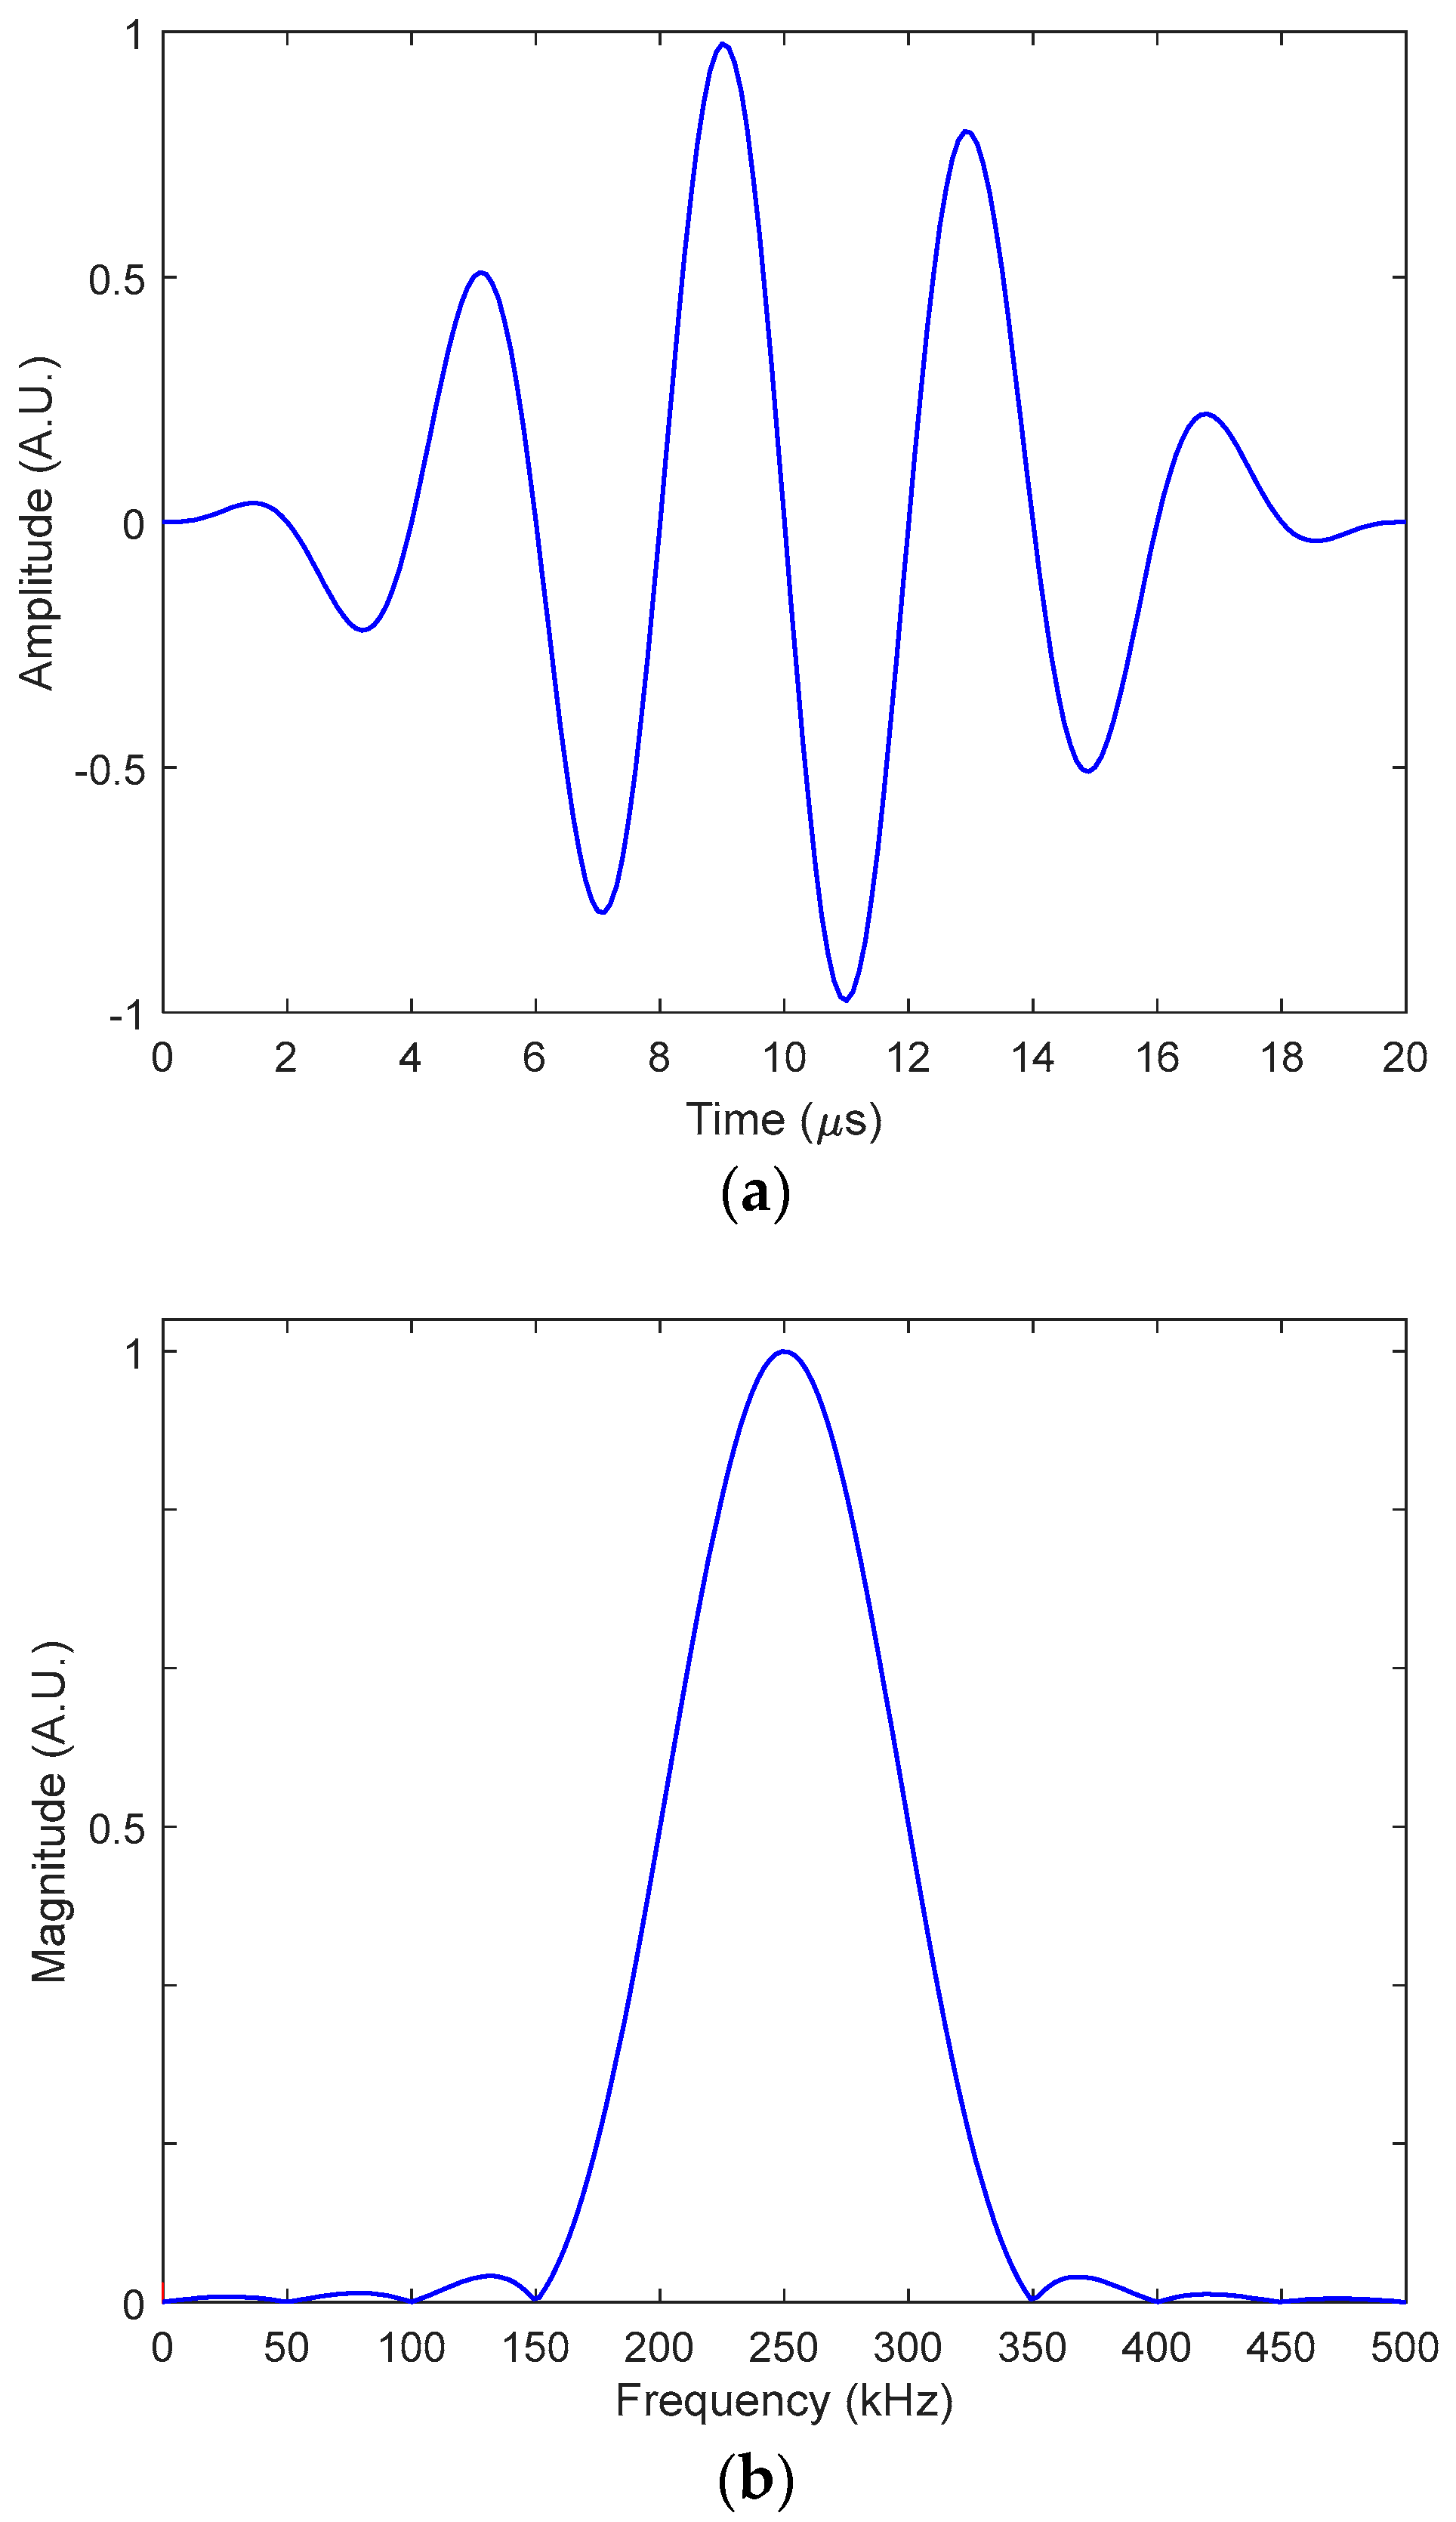
3. Signal Processing and Feature Extraction

For characterizing the accumulated internal fatigue damage, the first step is to extract damage-sensitive features from the sensed guided wave signals to indicate the presence and evolution of damage. The damage feature is a characteristic parameter or a set of parameters that could be obtained by signal processing techniques in time, frequency or time–frequency domains. Compared to traditional Fourier transform (FT)-based signal processing techniques, wavelet analysis is a widely used signal processing and feature extraction technique in guided wave-based SHM with its powerful capabilities for multiresolution analysis and time–frequency analysis [18,19,37,38].
Within the framework of wavelet analysis, a signal is decomposed into an approximation and a detail. The approximation is then itself split into a second-level approximation and detail, and the process is repeated [39]. For the sake of improvement, WPT decomposes not only the wavelet approximations at each level, but also the wavelet details. Therefore, WPT offers a richer analysis on the original signal and a complete binary decomposition tree can be produced. In this study, the guided wave signals obtained after different fatigue cycles are first decomposed by WPT into component signals to extract characteristic features, and then further analyzed to indicate the existence and evolution of internal fatigue damage.
A wavelet packet (WP) is a linear combination of wavelet functions. It can be presented as the function ψ j , k i ( t ) :
ψ j , k i ( t ) = 2 j / 2 ψ i ( 2 j t k )
where i, j, and k are the modulation, the scale, and the translation parameter, respectively. The wavelet ψ i is obtained from a recursive filtering process as
ψ 2 i ( t ) = 2 k = h ( k ) ψ i ( 2 t k )
ψ 2 i + 1 ( t ) = 2 k = g ( k ) ψ i ( 2 t k )
where the discrete filters h ( k ) and g ( k ) are quadrature mirror filters associated with the scaling function and the mother wavelet function, respectively.
For a guided wave signal S(t), according to Equation (1), at each level j, the WPT produces 2j component signals S j i ( t ) that are related to 2j sets of coefficients c j , k i :
S ( t ) = i = 1 2 j S j i ( t )
S j i ( t ) = k = c j , k i ψ j , k i ( t )
Each WP coefficient c j , k i is the inner product of the signal with the wavelet as
c j , k i = S ( t ) ψ j , k i ( t ) d t
After WPT decomposition, the WP component energy related to a single component signal is equal to
E j i = S j i ( t ) 2 d t
which stands for energy stored in the component signal S j i ( t ) .
Based on the WP component signals, an energy vector containing WP component energies in multiple frequency bands is defined by Equation (8) in this study as a multivariate signal feature:
E = [ E j 1 E j 2 E j 2 j 1 E j 2 j ] T
It is used to characterize the occurrence and evolution of fatigue damage in the composite specimens. For real applications, the energies in some WP components are very small, thus the energy vector defined in Equation (8) can be further simplified by excluding these negligible components.

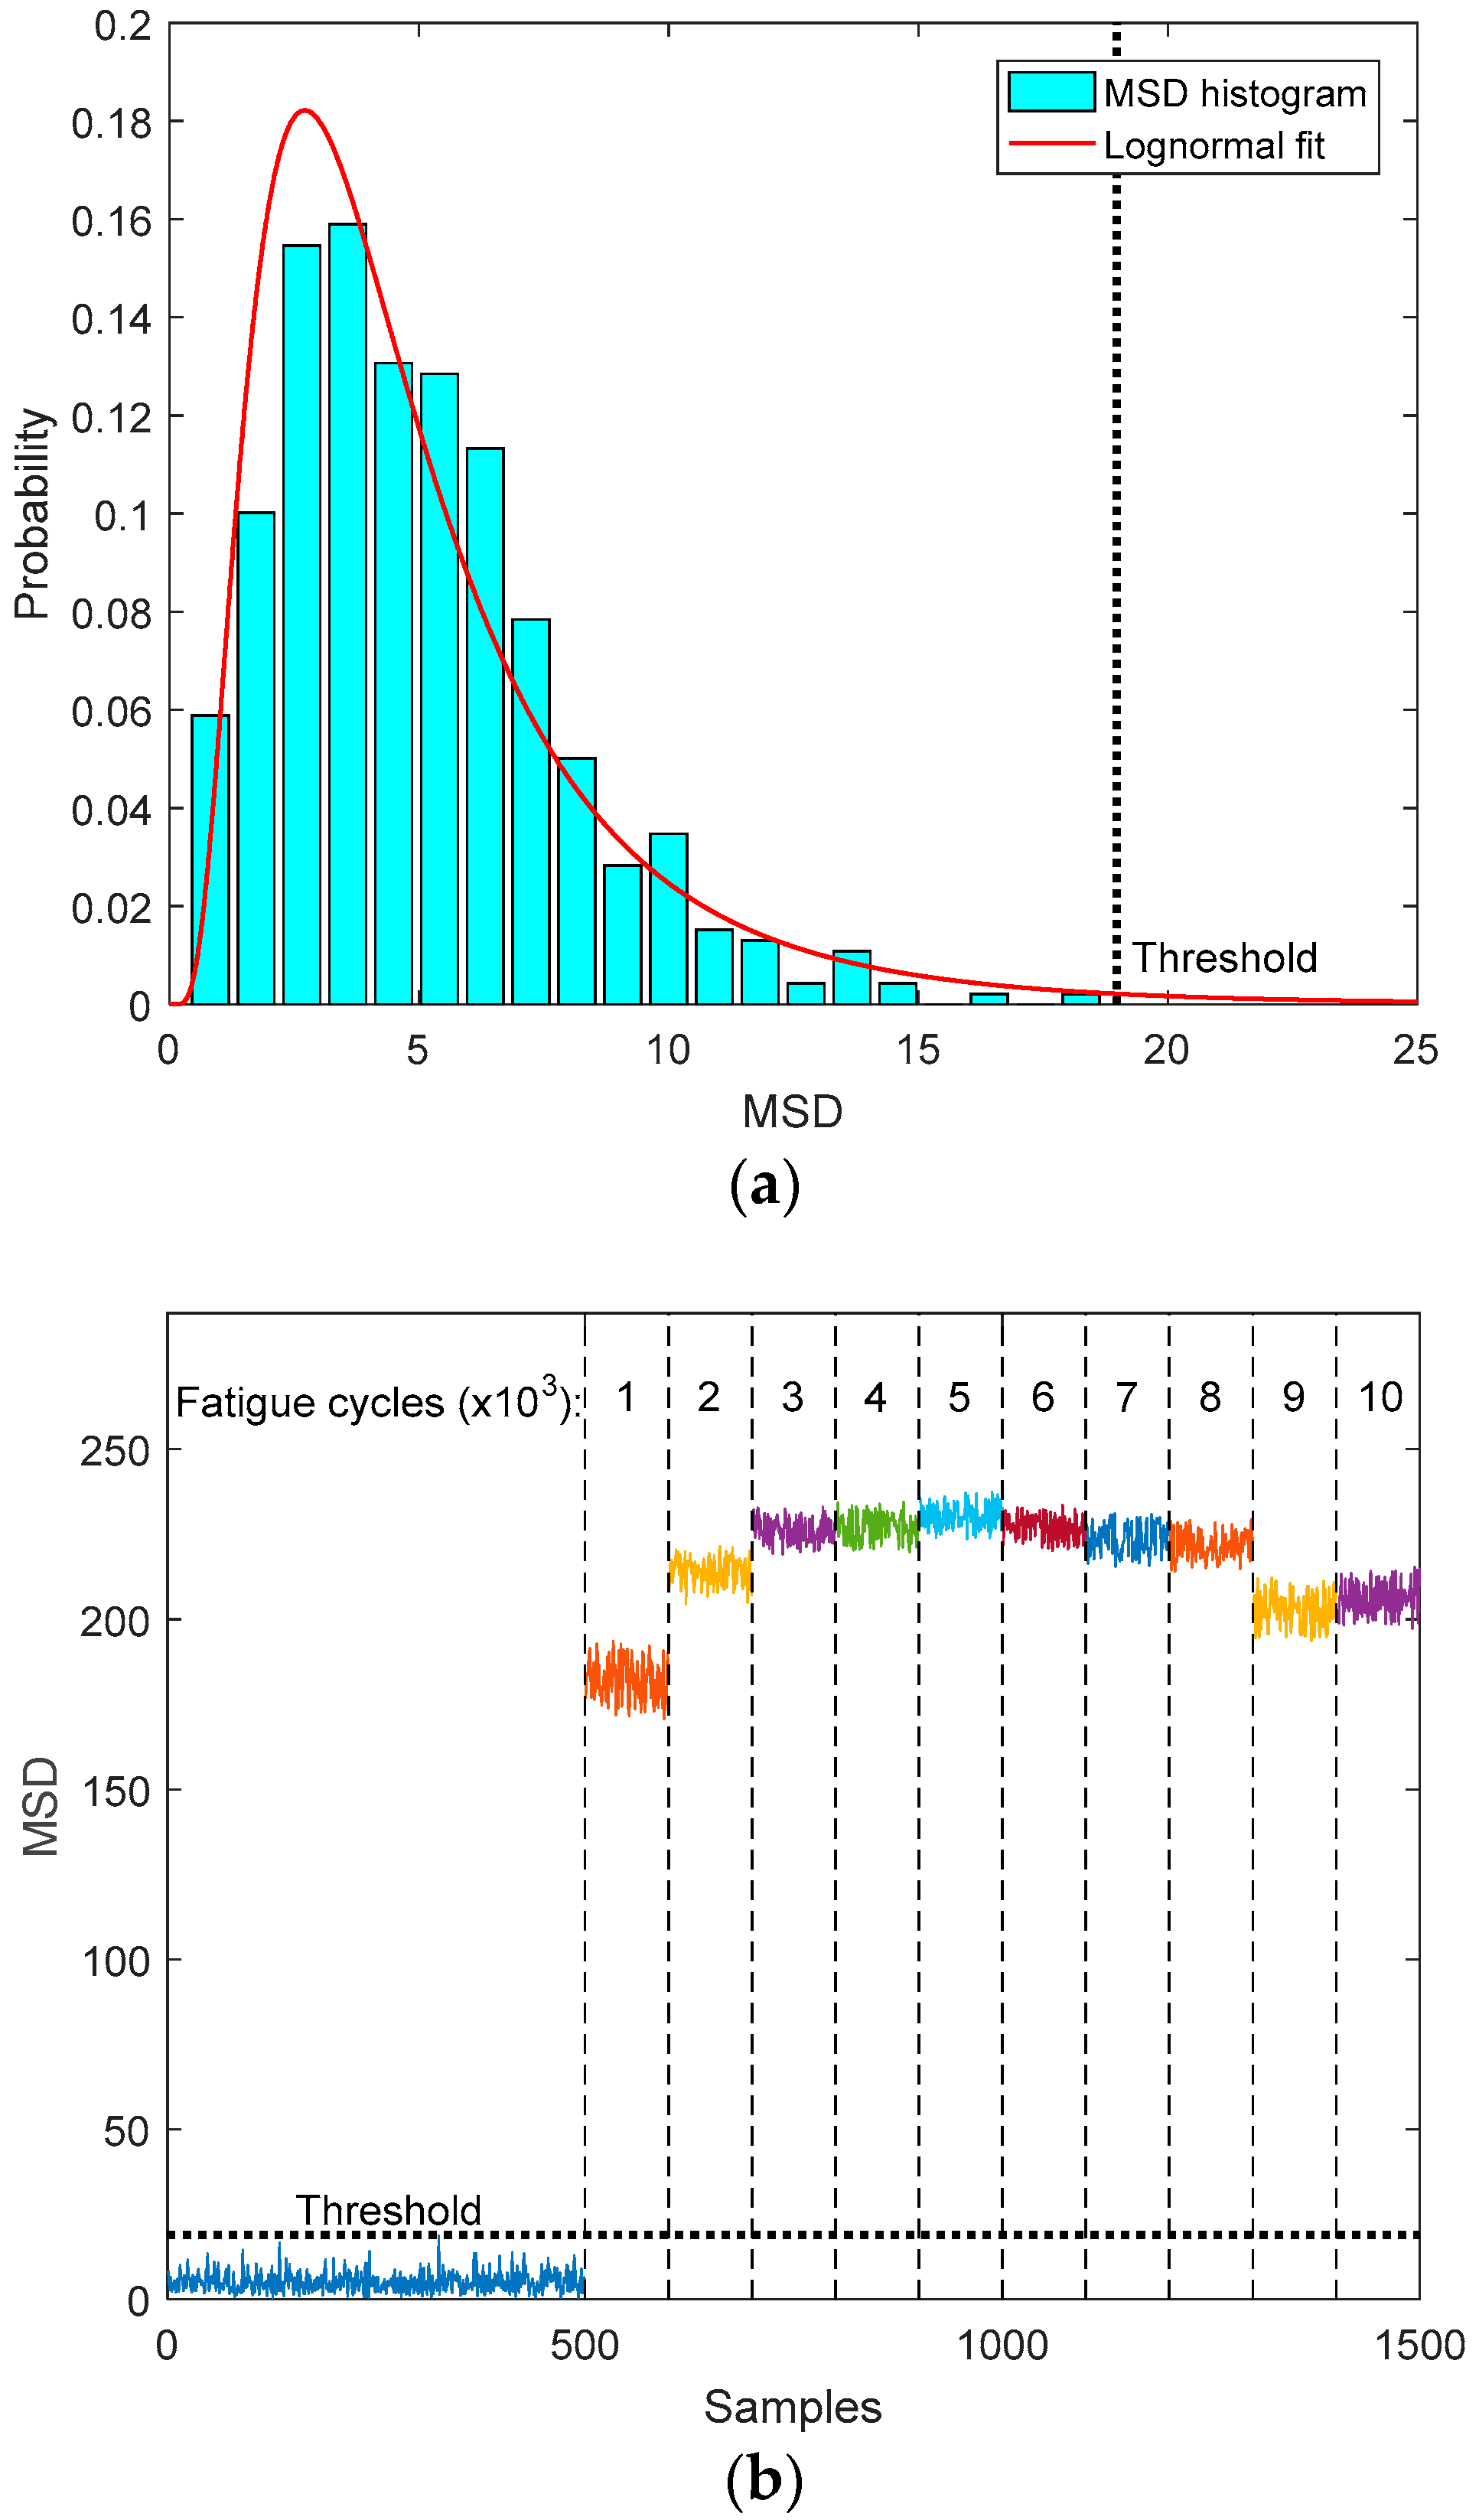
4. Statistical Multivariate Outlier Analysis

In this study, the experimental tests are under controlled laboratory condition, and the guided waves signals are not affected by various uncertainties. However, in real structural applications with operational environmental effects, the guided wave signals will being inevitably influenced by environmental conditions such as temperature and loads, and contaminated by measurement noise. Thus a statistical analysis is needed to consider these various uncertainties. Since outlier analysis have been demonstrated as a robust unsupervised learning pattern recognition tool for damage detection [40,41,42,43,44], it is employed in this study to analyze the WPT features obtained from the response guided wave signals under different fatigue states.
In statistics, an outlier is an observation that is significantly different from the rest of the population and the outlier is believed to be generated by an alternative mechanism, for example, damage in structures [40,41]. Statistical outlier analysis can be considered as a special class of pattern recognition, which classifies the abnormal data or state from the normal ones. To determine whether an observed data is an outlier, discordancy tests are usually performed. In the case of multivariate data, the discordancy test is based on deviation statistics and given by
D ξ = ( { x ξ } { x ¯ } ) T [ Σ ] 1 ( { x ξ } { x ¯ } )
where D ξ is the Mahalanobis squared distance (MSD), x ξ is the measured data corresponding to the potential outlier, and x ¯ and Σ are the mean vector and covariance matrix of the samples, respectively. Superscript T indicates transpose. The latter two values may be calculated with or without the potential outlier depending upon whether inclusive or exclusive measures are preferred [40]. In this study, the statistics is exclusively computed from the signal features, i.e., WP energy vectors defined in Equation (8) in the pristine state, without including potential outliers, i.e., WP energy vectors in the fatigue states.
In order to consider the various uncertainties on guided wave signals and construct a suitable mean vector and a covariance matrix, the guided wave signals in pristine state are copied 500 times and each copy is subsequently corrupted with amplitude fluctuation and measurement noise as described in Equation (10).
S c ( t ) = ( 1 + e ) × S e ( t ) + σ
where S e ( t ) is the experimentally obtained guided wave signals and S c ( t ) is the corrupted wave signals, e is an random number to reflect the amplitude fluctuation caused by environmental conditions, and σ is the measurement noise which is usually modeled as Gaussian white noise. In this study, we assume that e comes from a uniform distribution [emin, emax], and the level of measurement noise is described by signal-to-noise ratio (SNR). Then WPT is applied to these copies to obtain the signal features. For determining whether an observation of signal features or its MSD is an outlier, a proper threshold value D t h should be calculated. If the MSD is less than D t h , it can be considered that the change of response guided waves is introduced by environmental conditions or measurement noise; otherwise, it is because of fatigue damage occurrence and accumulation.

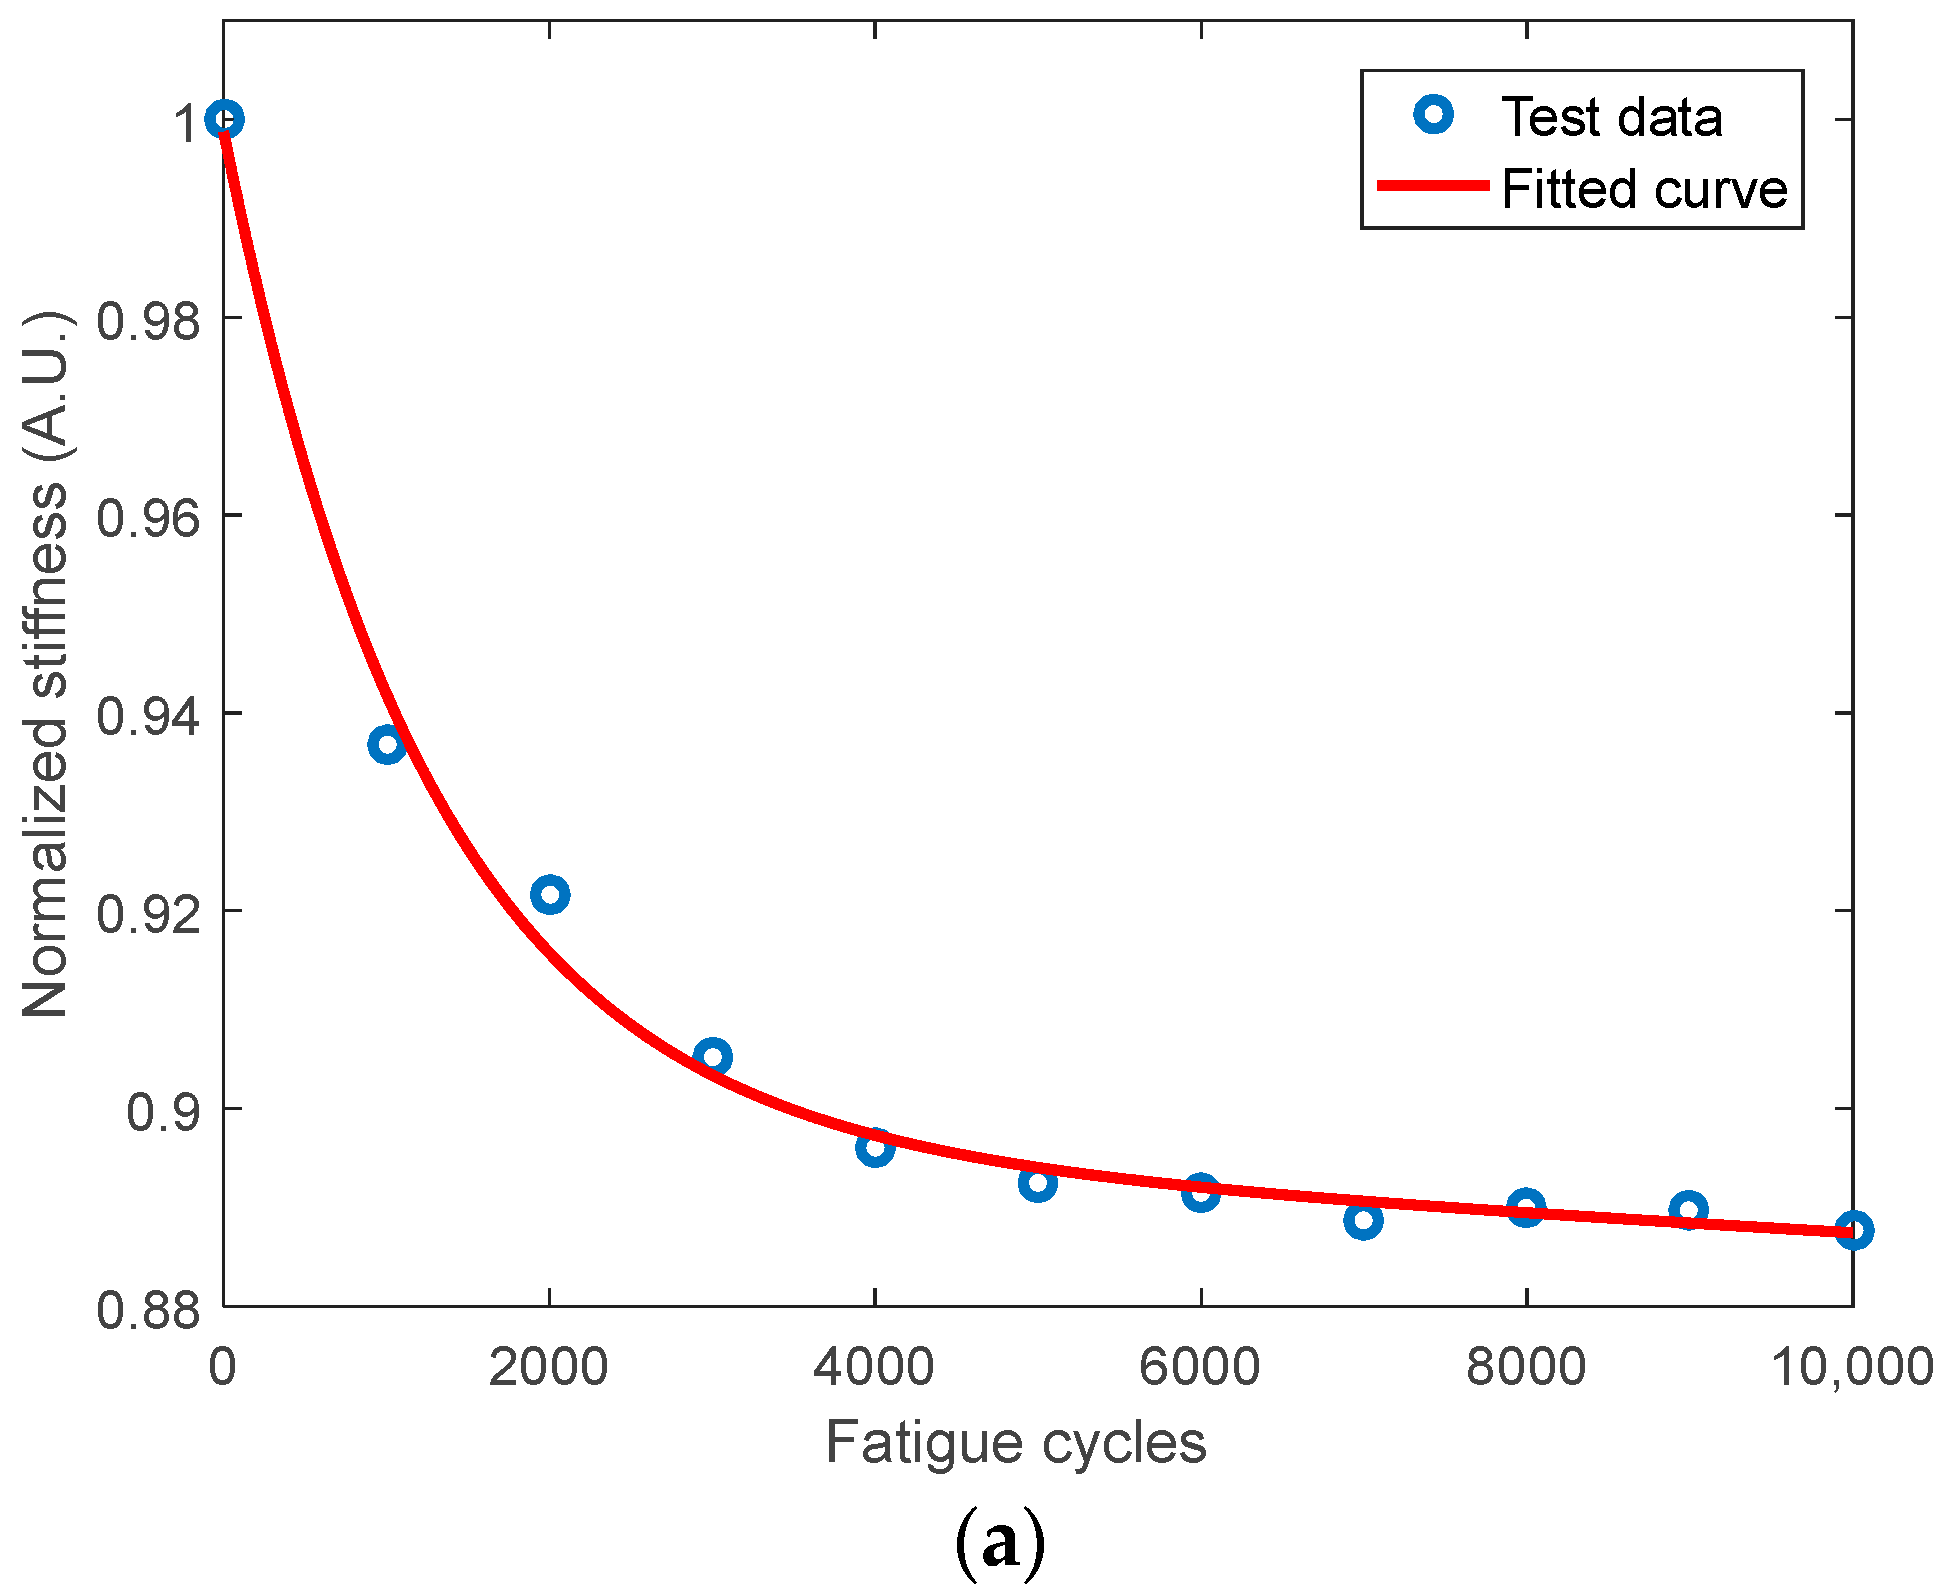
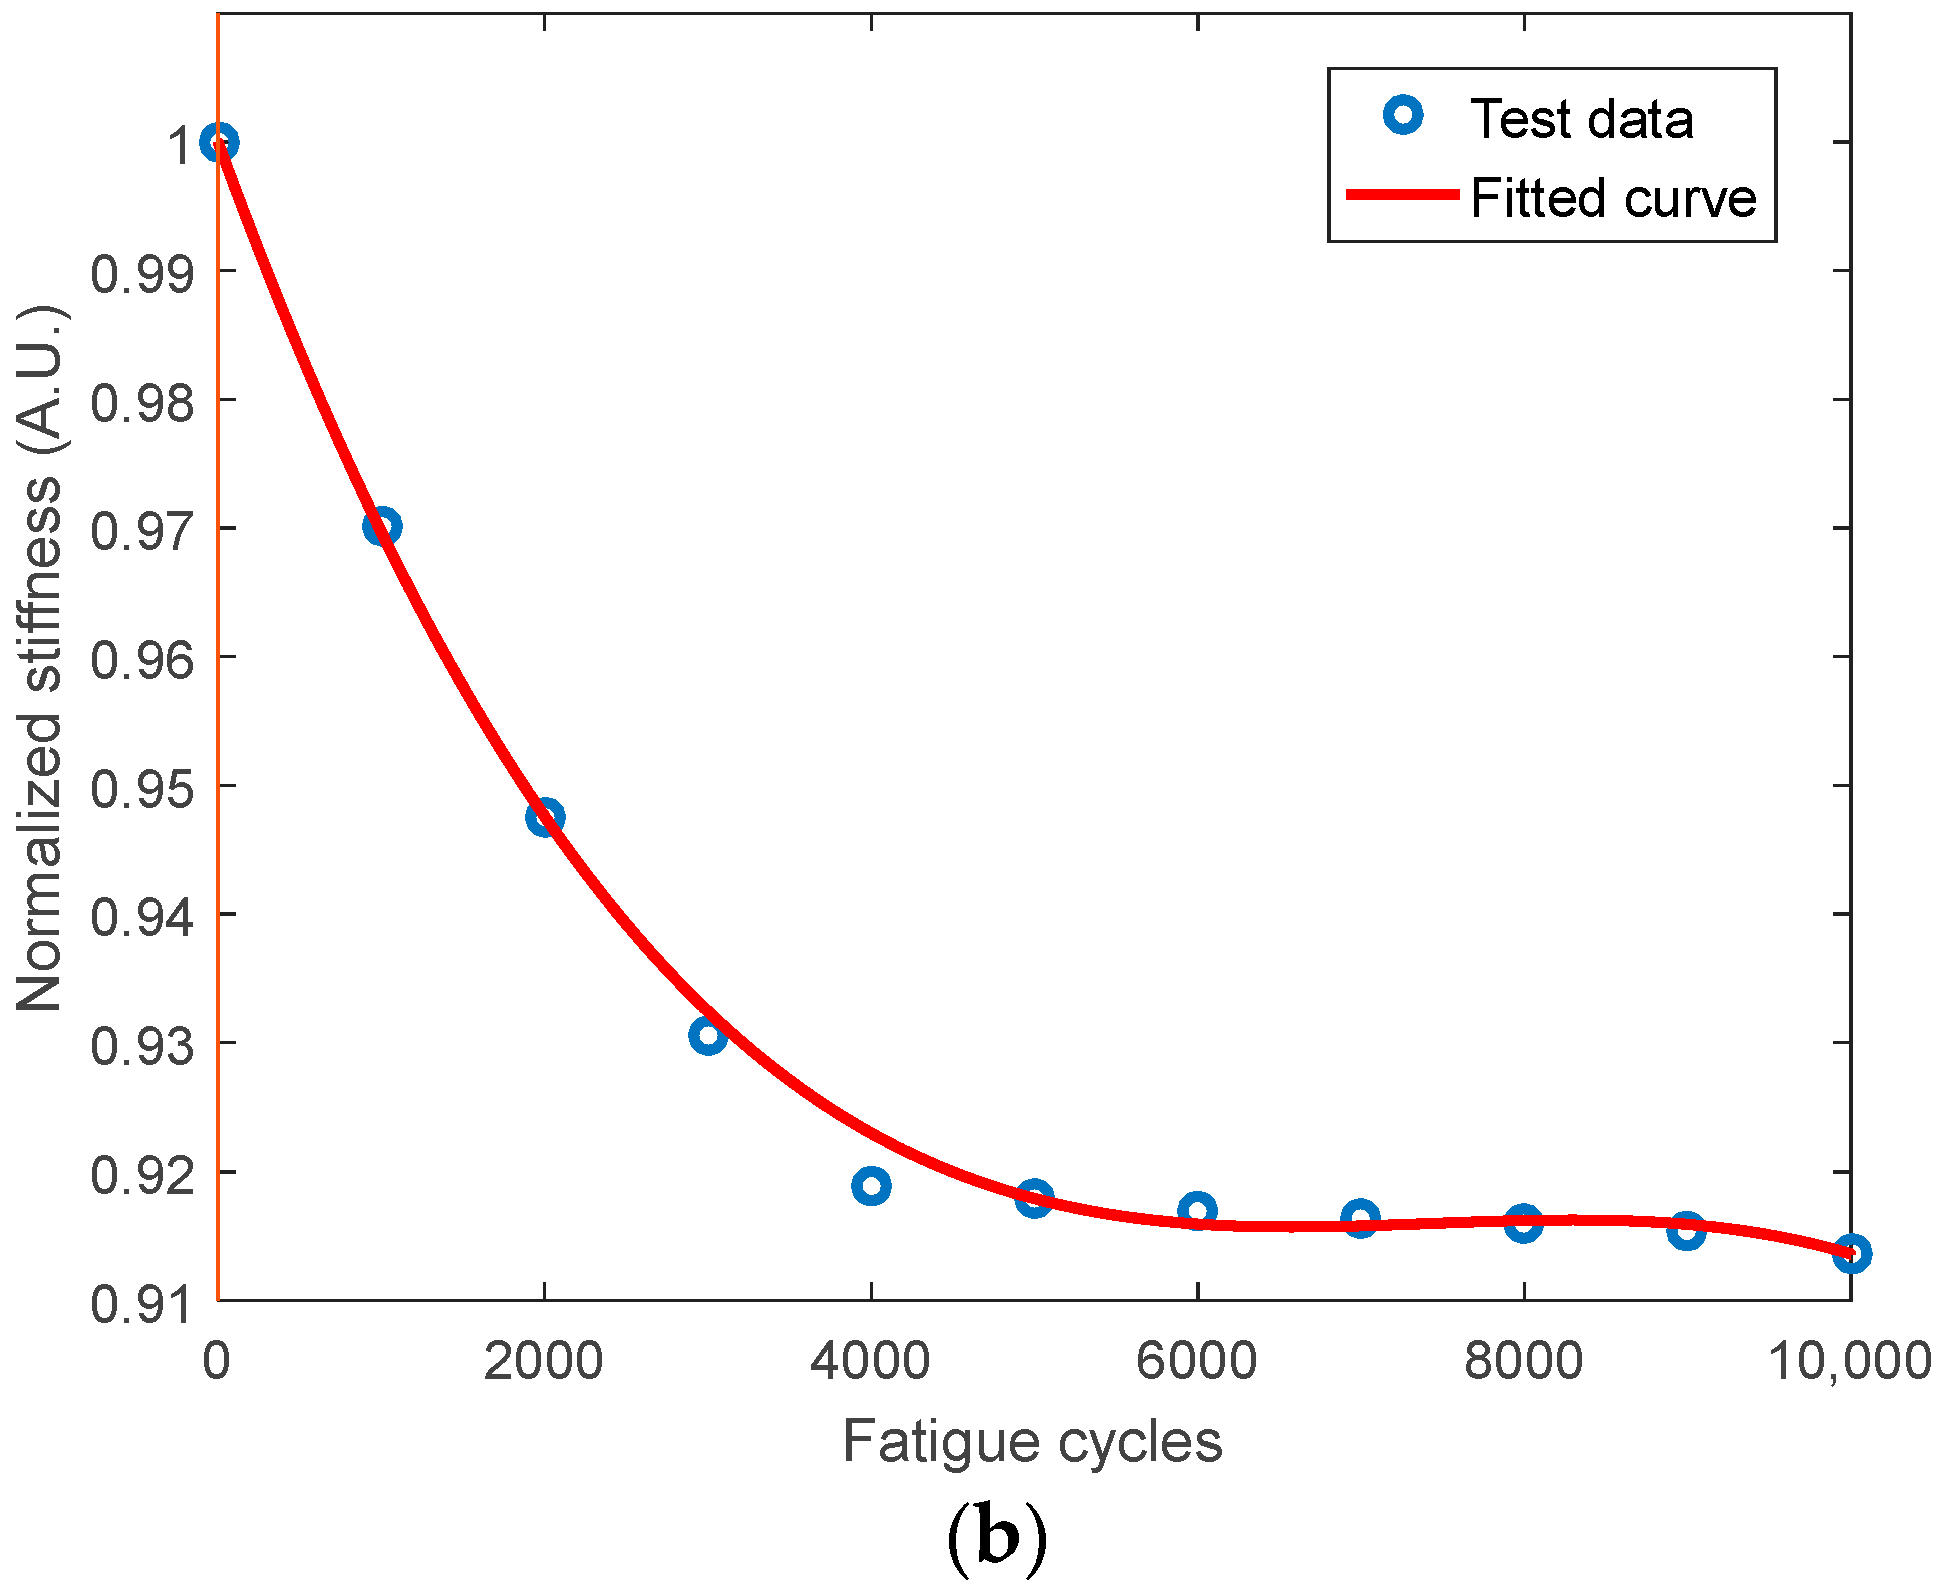
5. Experimental Results

With the aforementioned WPT-based signal processing and multivariate feature extraction method, the wave signals obtained under different fatigue states are analyzed. The mother wavelet function of Daubechies wavelet ‘db1’ is used to decompose each of the wave signals into sub-components, and a 4-level decomposition is performed with 24 = 16 components in total. Figure 6 shows the WP component energies of the baseline wave signals for specimens S_A and S_B at zero cycle, i.e., without fatigue damage. It can be seen that the WP component energies mainly concentrate on the first several components. For both specimens, the sums of energies in the first five components exceed 98% of the total energies of the wave signals, thus the first five energies form the energy vector as the multivariate signal features for characterizing the fatigue damage in this study. Figure 7 shows the evolution of the first five WP component energies of the wave signals with the increase of fatigue cycles. It can be seen that, in general, with the increase of fatigue cycles, the energies for each WP component decay quickly at the initial stage and then slow down. This trend is very similar to that of the decay of stiffness.
As aforementioned, to construct a suitable mean vector and a covariance matrix for outlier analysis, the guided wave signals in pristine state are copied 500 times and each copy is subsequently corrupted with amplitude fluctuation and measurement noise, as described in Equation (10). Two contamination levels are considered: (I) Level 1: the fluctuation factor e comes from uniform distribution [−0.05 0.05] and the SNR of measurement noise is 20 dB. (II) Level 2: The fluctuation factor e comes from uniform distribution [−0.1 0.1] and the SNR of measurement noise is 10 dB. Figure 8a,b illustrates the contaminated baseline signals with different levels for specimen S_A. Similar contaminated signals can be obtained through Equation (10) for baseline signal for specimen S_B. Then for each set of contaminated 500 baseline copies, mean vector and covariance matrix are constructed and baseline MSDs are calculated according to Equation (9). To set an appropriate threshold value, statistical analysis is performed and lognormal distribution is used to fit the probability density function (PDF) for baseline MSDs. As illustrated in Figure 9a, for wave signals from specimen S_A with Level 1 contamination, threshold is determined by taking the value corresponding to 99.9% confidence of the fitted lognormal distribution, which is 19.3. To test whether the wave signals after a certain fatigue cycles are outlier or not, the wave signals are copied 100 times and the same contamination levels for the baseline signals are applied. The corresponding MSDs for different sets of contaminated wave signals can be also calculated by Equation (9) and compared with the threshold value. If the MSDs are less than the threshold value, it can be considered that the change of guided wave features compared to the baseline set is caused by environmental conditions or measurement noise; otherwise it is caused by damage in the structure, i.e., fatigue damage in our case. It can be seen from Figure 9b, the calculated MSDs after different fatigue cycles all exceed the threshold value, and with the increase of fatigue cycles, the MSDs have a general increased trend. The means of the MSDs increase almost monotonically with the fatigue cycles. This may because only matrix cracks increasingly accumulate in specimen S_A before 10,000 fatigue cycles. It demonstrates that MSD can be used as a measure to integrate the multivariate signal features to detect and characterize fatigue damage in composites. For wave signals from specimen S_A with Level 2 contamination, Figure 10a shows the histogram of baseline MSDs and the lognormal fit, the threshold value with 99.9% confidence is 19.2, and it can be seen from Figure 10b that with the increase of contamination level, unlike the results shown in Figure 9b, most of the MSDs for wave signals right after 1000 fatigue cycles are below the threshold value, indicating that at this stage fatigue damage cannot be discerned. However, the MSDs from the later wave signals are all above the threshold value and have a general trend of increase with the increase of fatigue cycles. A similar processing procedure is applied to wave signals for specimen S_B, and the corresponding results are illustrated in Figure 11 and Figure 12. It can be seen that, for both contamination levels, the MSDs of wave signals obtained after different fatigue cycles all exceed the threshold of the baseline MSDs, and have general trends of increase with the increase of fatigue cycles until last several thousand cycles. This may because matrix cracks accumulation in specimen S_B reaches saturation after ~5000 fatigue cycles, and then new damage mechanism such as delamination occurs. Although further study is needed to disclose the interaction between guided waves and damage phenomena, it still indicates the effectiveness of MSD in integrating multiple signal features and characterizing fatigue damage in composites.

6. Conclusions

This paper presents an experimental study on detecting and monitoring of evolution of fatigue damage in composites under cyclic loads by using guided waves. Piezoelectric wafers are used to excite and receive guided wave signals to monitor the evolution of fatigue damage after different fatigue cycles. The guided wave signals are processed by WPT to extract features based on WP component energies to characterize the internal fatigue damage accumulation which is reflected by measured stiffness degradation. A statistical multivariate outlier analysis is then performed with consideration of uncertainties from amplitude fluctuations caused by environmental effects and measurement noise. It is used to determine the existence of fatigue damage in composite specimens and to characterize their evolution using MSD. Experimental results have demonstrated the effectiveness and potential application of the guided wave-based monitoring technique: the extracted WP component energies of the guided wave signals can be used as effective signal features to characterize the internal fatigue damage in composites, and the statistical outlier analysis is an effective tool to detect the damage with consideration of uncertainties, while the merged MSDs of the signal features have a similar trend to evolution of fatigue damage in composites.

Author Contributions

Conceptualization, G.Y.; Methodology, G.Y., X.L., and J.T.; Investigation, G.Y., X.L., and J.T.; Data Curation, X.L. and J.T.; Writing—Original Draft preparation, G.Y.; Writing—Review and Editing, G.Y., X.L., and J.T.; Supervision, G.Y.

Funding

This research is supported by the National Nature Science Foundation (Grant No. 11602104) and the Fundamental Research Funds for the Central Universities (Grant No. NS2016011).

Conflicts of Interest

The authors declare no conflicts of interest.

References

  1. Talreja, R. Multi-scale modelling in damage mechanics of composite materials. J. Mater. Sci. 2006, 41, 6800–6812. [Google Scholar] [CrossRef]
  2. Reifsnider, K.L. Fatigue of Composite Materials; Elsevier: New York, NY, USA, 2012. [Google Scholar]
  3. Reis, P.; Ferreira, J.; Richardson, M. Fatigue damage characterization by NDT in polypropylene/glass fibre composites. Appl. Compos. Mater. 2011, 18, 409–419. [Google Scholar] [CrossRef]
  4. Shin, C.S.; Chiang, C.C. Fatigue damage monitoring in polymetric composites using multiple fiber bragg gratings. Int. J. Fatigue 2006, 28, 1315–1321. [Google Scholar] [CrossRef]
  5. Gao, L.; Thostenson, E.T.; Zhang, Z.G.; Chou, T.W. Sensing of damage mechanisms in fiber-reinforced composites under cyclic loading using carbon nanotubes. Adv. Sci. 2009, 19, 123–130. [Google Scholar] [CrossRef]
  6. De Baere, I.; van Paepegem, W.; Degrieck, J. Electrical resistance measurement for in situ monitoring of fatigue of carbon fabric composites. Int. J. Fatigue 2010, 32, 197–207. [Google Scholar] [CrossRef] [Green Version]
  7. Mouritz, A.P.; Townsend, C.; Shah Khan, M.Z. Non-destructive detection of fatigue damage in thick composites by pulse-echo ultrasonics. Compos. Sci. Technol. 2000, 60, 23–32. [Google Scholar] [CrossRef]
  8. Toubal, L.; Karama, M.; Lorrain, B. Damage evolution and infrared thermography in woven composite laminates under fatigue loading. Int. J. Fatigue 2006, 28, 1867–1872. [Google Scholar] [CrossRef]
  9. Bourchak, M.; Farrow, I.R.; Bond, I.P.; Rowland, C.W.; Menan, F. Acoustic emission energy as a fatigue damage parameter for CFRP composites. Int. J. Fatigue 2007, 29, 457–470. [Google Scholar] [CrossRef]
  10. Jespersen, K.M.; Zangenberg, J.; Lowe, T.; Withers, P.J.; Mikkelsen, L.P. Fatigue damage assessment of uni-directional non-crimp fabric reinforced polyester composite using X-ray computed tomography. Compos. Sci. Technol. 2016, 136, 94–103. [Google Scholar] [CrossRef] [Green Version]
  11. Ling, Y.; Mahadevan, S. Integration of structural health monitoring and fatigue damage prognosis. Mech. Syst. Signal Process. 2012, 28, 89–104. [Google Scholar] [CrossRef]
  12. Staszewski, W.J.; Mahzan, S.; Traynor, R. Health monitoring of aerospace composite structures—Active and passive approach. Compos. Sci. Technol. 2009, 69, 1678–1685. [Google Scholar] [CrossRef]
  13. Diamanti, K.; Soutis, C. Structural health monitoring techniques for aircraft composite structures. Prog. Aerosp. Sci. 2010, 46, 342–352. [Google Scholar] [CrossRef]
  14. Kinet, D.; Megret, P.; Goossen, K.W.; Qiu, L.; Heider, D.; Caucheteur, C. Fiber bragg grating sensors toward structural health monitoring in composite materials: Challenges and solutions. Sensors 2014, 14, 7394–7419. [Google Scholar] [CrossRef] [PubMed]
  15. Giurgiutiu, V.; Santoni-Bottai, G. Structural health monitoring of composite structures with piezoelectric-wafer active sensors. AIAA J. 2011, 49, 565–581. [Google Scholar] [CrossRef]
  16. Bosse, S.; Lechleiter, A. A hybrid approach for structural monitoring with self-organizing multi-agent systems and inverse numerical methods in material-embedded sensor networks. Mechatronics 2016, 34, 12–37. [Google Scholar] [CrossRef]
  17. Neuschwander, K.; Moll, J.; Memmolo, V.; Schmit, M.; Bucker, M. Simultaneous load and structural monitoring of a carbon fiber rudder stock: Experimental results from a quasi-static tensile test. J. Intell. Mater. Syst. Struct. 2019, 30, 272–282. [Google Scholar] [CrossRef]
  18. Lemistre, M.; Balageas, D. Structural health monitoring system based on diffracted Lamb waves analysis by multiresolution processing. Smart Mater. Struct. 2001, 10, 504–511. [Google Scholar] [CrossRef]
  19. Seth, S.K.; Spearing, S.M.; Constantinos, S. Damage detection in composite materials using Lamb wave methods. Smart Mater. Struct. 2002, 11, 269–278. [Google Scholar] [Green Version]
  20. Basri, R.; Chiu, W.K. Numerical analysis on the interaction of guided lamb waves with a local elastic stiffness reduction in quasi-isotropic composite plate structures. Compos. Struct. 2004, 66, 87–99. [Google Scholar] [CrossRef]
  21. Su, Z.; Ye, L.; Lu, Y. Guided lamb waves for identification of damage in composite structures: A review. J. Sound Vib. 2006, 295, 753–780. [Google Scholar] [CrossRef]
  22. Ng, C.T.; Veidt, M. A lamb-wave-based technique for damage detection in composite laminates. Smart Mater. Struct. 2009, 18, 074006. [Google Scholar] [CrossRef]
  23. Polimeno, U.; Meo, M. Detecting barely visible impact damage on aircraft composite structures. Compos. Struct. 2009, 91, 398–402. [Google Scholar] [CrossRef]
  24. Yan, G.; Zhou, L. Damage detection for composite structure using statistical outlier analysis with temperature effect. Trans. Nanjing Univ. Aero. Astro. 2011, 28, 231–239. [Google Scholar]
  25. Watkins, R.; Jha, R. A modified time reversal method for Lamb wave based diagnostics of composite structures. Mech. Syst. Signal Process. 2012, 31, 345–354. [Google Scholar] [CrossRef]
  26. Rogge, M.D.; Leckey, C.A.C. Characterization of impact damage in composite laminates using guided wavefield imaging and local wavenumber domain analysis. Ultrasonics 2013, 53, 1217–1226. [Google Scholar] [CrossRef]
  27. Capriotti, M.; Kim, H.E.; Lanza di Scalea, F.; Kim, H. Non-destructive inspection of impact damage in composite aircraft panels by ultrasonic guided waves and statistical processing. Materials 2017, 10, 616. [Google Scholar] [CrossRef]
  28. Seale, M.D.; Madaras, E.I. Lamb wave evaluation of the effects of thermal-mechanical aging on composite stiffness. J. Compos. Mater. 2000, 34, 27–38. [Google Scholar] [CrossRef]
  29. Rheinfurth, M.; Kosmann, N.; Sauer, D.; Busse, G.; Schulte, K. Lamb waves for non-contact fatigue state evaluation of composites under various mechanical loading conditions. Compos. Part A 2012, 43, 1203–1211. [Google Scholar] [CrossRef]
  30. Marzani, A.; Marchi, L.D. Characterization of the elastic moduli in composite plates via dispersive guided waves data and genetic algorithms. J. Intell. Mater. Syst. Struct. 2013, 24, 2135–2147. [Google Scholar] [CrossRef]
  31. Zhao, J.L.; Qiu, J.; Ji, H.L. Reconstruction of the nine stiffness coefficients of composites using a laser generation based imaging method. Compos. Sci. Technol. 2016, 126, 27–34. [Google Scholar] [CrossRef]
  32. Tao, C.C.; Ji, H.L.; Qiu, J.H.; Zhang, C.; Wang, Z.; Yao, W. Characterization of fatigue damages in composite laminates using Lamb wave velocity and prediction of residual life. Compos. Struct. 2017, 166, 219–228. [Google Scholar] [CrossRef]
  33. Peng, T.; Liu, Y.; Saxena, A.; Goebel, K. In-situ fatigue life prognosis for composite laminates based on stiffness degradation. Compos. Struct. 2015, 132, 155–165. [Google Scholar] [CrossRef]
  34. Wilson, C.L.; Chang, F.K. Monitoring fatigue-induced transverse matrix cracks in laminated composites using built-in acousto-ultrasonic techniques. Struct. Health Monit. 2016, 15, 335–350. [Google Scholar] [CrossRef]
  35. Deng, M.; Pei, J. Assessment of accumulated fatigue damage in solid plates using nonlinear lamb wave approach. Appl. Phys. Lett. 2007, 90, 121902. [Google Scholar] [CrossRef]
  36. Li, W.; Cho, Y.; Achenbach, J.D. Detection of thermal fatigue in composites by second harmonic lamb waves. Smart Mater. Struct. 2012, 21, 085019. [Google Scholar] [CrossRef]
  37. Rizzo, P.; Sorrivi, E.; Lanza di Scalea, F.; Viola, E. Wavelet-based outlier analysis for guided wave structural monitoring: Application to multi-wire strands. J. Sound Vib. 2007, 307, 52–68. [Google Scholar] [CrossRef]
  38. Sohn, H.; Park, G.; Wait, J.R.; Limback, N.P.; Farrar, C.R. Wavelet-based active sensing for delamination detection in composite structures. Smart Mater. Struct. 2004, 13, 153–160. [Google Scholar] [CrossRef]
  39. Mallat, S. A theory for multiresolution signal decomposition: The wavelet representation. IEEE Trans. Pattern Anal. Mach. Intell. 1989, 11, 674–693. [Google Scholar] [CrossRef]
  40. Worden, K.; Manson, G.; Fieller, N.R.J. Damage detection using outlier analysis. J. Sound Vib. 2000, 229, 647–667. [Google Scholar] [CrossRef]
  41. Worden, K.; Manson, G. The application of machine learning to structural health monitoring. Philos. Trans. R. Soc. A 2007, 365, 515–537. [Google Scholar] [CrossRef] [PubMed] [Green Version]
  42. Cheung, A.; Cabrera, C.; Sarabandi, P.; Nair, K.K.; Kiremidjian, A.; Wenzel, H. The application of statistical pattern recognition methods for damage detection to field data. Smart Mater. Struct. 2008, 17, 065023. [Google Scholar] [CrossRef]
  43. Park, S.; Inman, D.J.; Yun, C.B. An outlier analysis of MFC-based impedance sensing data for wireless structural health monitoring of railroad tracks. Eng. Struct. 2008, 30, 2792–2799. [Google Scholar] [CrossRef]
  44. Pavlopoulou, S.; Worden, K.; Soutis, C. Novelty detection and dimension reduction via guided ultrasonic waves: Damage monitoring of scarf repairs in composite laminates. J. Intell. Mater. Syst. Struct. 2016, 27, 549–566. [Google Scholar] [CrossRef]
Figure 1. Experimental setup: (a) glass fiber/epoxy GF/EP specimen and (b) fatigue test and monitoring systems.
Applsci 09 01394 g001
Figure 2. Longitudinal stiffness degradation with fatigue cycles: (a) specimen S_A and (b) specimen S_B.
Applsci 09 01394 g002aApplsci 09 01394 g002b
Figure 3. Diagnostic excitation with center frequency of 250 kHz: (a) time trace and (b) frequency spectrum.
Applsci 09 01394 g003
Figure 4. Response wave signals after different fatigue cycles for specimen S_A: (a) six signals and (b) zoomed signals.
Applsci 09 01394 g004
Figure 5. Response wave signals after different fatigue cycles for specimen S_B: (a) six signals and (b) zoomed signals.
Applsci 09 01394 g005aApplsci 09 01394 g005b
Figure 6. Wavelet packet (WP) component energies for the baseline wave signal: (a) specimen S_A and (b) specimen S_B.
Applsci 09 01394 g006aApplsci 09 01394 g006b
Figure 7. Variations of WP component energies of wave signals with fatigue cycles: (a) specimen S_A and (b) specimen S_B.
Applsci 09 01394 g007
Figure 8. Contaminated baseline signals with different levels for specimen S_A: (a) Level 1 contamination and (b) Level 2 contamination.
Applsci 09 01394 g008
Figure 9. Outlier analysis results for specimen S_A with Level 1 contamination: (a) probability density function (PDF) of baseline Mahalanobis squared distance (MSD) and (b) MSDs for different fatigue states.
Applsci 09 01394 g009
Figure 10. Outlier analysis results for specimen S_A with Level 2 contamination: (a) PDF of baseline MSD and (b) MSDs for different fatigue states.
Applsci 09 01394 g010aApplsci 09 01394 g010b
Figure 11. Outlier analysis results for specimen S_B with Level 1 contamination: (a) PDF of baseline MSD and (b) MSDs for different fatigue states.
Applsci 09 01394 g011
Figure 12. Outlier analysis results for specimen S_B with Level 2 contamination: (a) PDF of baseline MSD and (b) MSDs for different fatigue states.
Applsci 09 01394 g012
Table 1. Longitudinal stiffness data for GF/EP specimens under fatigue cycles (Unit: GPa).
Fatigue Cycles010002000300040005000600070008000900010,000
Specimen S_A25.3023.7023.3222.9022.6722.5822.5522.4922.5122.5022.46
Specimen S_B18.1417.6017.1916.8816.6716.6516.6316.6216.6116.6016.58

