Article

Experimental Research on Bond Behavior between GFRP Bars and Stirrups-Confined Concrete

Hubei Key Laboratory of Roadway Bridge & Structure Engineering, Wuhan University of Technology, Wuhan 430070, China
*
Author to whom correspondence should be addressed.
Appl. Sci. 2019, 9(7), 1340; https://doi.org/10.3390/app9071340
Submission received: 21 February 2019 / Revised: 25 March 2019 / Accepted: 26 March 2019 / Published: 29 March 2019
(This article belongs to the Special Issue Emerging Construction Materials and Sustainable Infrastructure)

Abstract

:

Featured Application

In this paper, the bond performance between Glass-fiber-reinforced polymer (GFRP) bars and stirrups-confined concrete was studied for the first time, which is very important to promote the engineering application of FRP bars.

Abstract

This paper presents the results of a series of pullout tests that were performed on Glass-fiber-reinforced polymer (GFRP) bars embedded in concrete, while providing a detailed report on the influence of various variables that impinge upon bond behavior, such as the surface characteristics and diameter of the bars, concrete strength, as well as the confined effect of stirrups. The Bertero-Popov-Eligehausen (BPE) and Cosenza-Manfredi-Realfonzo (CMR) models analyzed the bond stress (τ)–slip (s) relationship between GFRP bar and stirrups-confined concrete. The tests results indicate that when the bond failure interface only occurs on the surface of a GFRP bar, the bond strength is not dependent upon the concrete strength. Moreover, the results indicate that in comparison to specimens without stirrups, their stirrup-containing counterparts are more prone to pullout failure with greater ductility and higher bond strength and corresponding slip. The BPE and CMR models are able to investigate the τ-s relationship between GFRP bars and the stirrups-confined concrete with accuracy. With the experimental data, the specific parameters in the models classified by surface characteristics have been suggested.

1. Introduction

The use of fibre reinforced polymers (FRP) as reinforcement in concrete structures is considered to be a possible alternative to steel in situations where corrosion is present. It is imperative that the bond behavior between FRP bars and concrete be given top priority prior to studying the performance of FRP-reinforced concrete (RC) structures. This is due to the crucial role that bond plays in terms of the coaction between FRP bars and concrete. An adequate level of bond is required between an FRP bar and concrete in order to ensure the successful transmission of forces from one to another. Unlike steel bars, the FRP bars behave anisotropic, non-homogeneous, and linear elastic properties, which may result in different force transfer mechanisms between bars and concrete. Some research on the performance of FRP-RC members [1,2] or structures [3,4] purport that the bond stress (τ)–slip (s) relationship differs greatly between that of FRP bars and that of steel bars, notably influencing the usability of the concrete structure. Contrarily, unlike steel bars, no uniform manufacturing standards have been established for FRP bars, resulting in divergences between the performance of FPR bars across different countries and manufacturers. Research into the bond behavior of different FRP bars will culminate in a standardization of the application and manufacturing regulations for the FRP-RC structures.
When compared with carbon fibre-reinforced polymer (CFRP) and aramid fibre-reinforced polymer (AFRP) bars, the glass fibre-reinforced polymer (GFRP) bars have received elevated attention due to its high chemical resistance, inexpensive price, easy processability, and significant real-world applicability. Many studies have been conducted to investigate the interfacial bond behavior of GFRP bars in concrete. The bond strength of the GFRP bars is typically within 40–80% of that corresponding to steel bars [5,6,7]. Smooth bars only develop 40–70% of bond strength of deformed bars [6,8,9]. Surface deformations with a height of at least 6% of the bar diameter are necessary to develop adequate bond behavior to concrete [10]. Larger diameter and embedment lengths of bars develop less average bond stress [6,9,11,12,13]. Moreover, some effective nondestructive evaluation techniques [14,15,16,17] were developed to monitor the initial installation quality and the long-term efficiency of the interfacial bonding between FRP and concrete. Theoretical efforts have also been made to analyze the bond mechanism of FRP to concrete. Based on the experimental results, three analytical τ-s models, namely, the Malvar model, which was the first one to be proposed for FRP bars by Malvar. [18]; the Bertero-Popov-Eligehausen (BPE) model, which was initial proposed for steel bars by Eligehausen et al. [19]; and, the Cosenza-Manfredi-Realfonzo (CMR) model, which was proposed for FRP bars by Cosenza et al. [20], have been reported in literature. The three models were compared by fitting experimental results and using finite element method [21,22]. Moreover, some scholars have updated these three models to suit the bond properties of FRP bars in different materials and environments [23,24,25,26,27]. Correspondingly, design codes for GFRP bars in the United States (U.S.) [28], Canada [29,30], and Japan [31] have stipulated guidelines that are associated with bond mechanism in terms of both embedment length and bond strength.
Research has indicated that stirrups ostensible effect on the bond behavior of a steel bar. Test results that were obtained by Darwin and Graham [32,33] have shown that, with an increased level of confinement provided by stirrups, bond strength increases; the bond strength of stirrup-containing specimens is more closely aligned to the deformation pattern that is evident in the surface of steel bars as compared to specimens without stirrups. The research by Darwin et al. [34] showed that configuring stirrups in concrete is able to decrease the amount of required development length in order to obtain the necessary bond strength between the steel bars and concrete. In effect, the ACI 408R-03 [35] standard points out that stirrups are required to be configured in concrete in beam or pullout tests, and it provides detailed regulations for stirrup configuration. However, in the vast majority of research on the bond behavior of GFRP bars, there is little mention given to the influence of the confined effect of stirrups on the bond behavior of the GFRP bars. Malvar has studied the influence of different confining pressures on the bond behavior of GFRP bars through devising a confining torus on the concrete surface of the specimens and imposing load onto the torus [18]. This study could not reflect the influence of stirrups on the bond properties of GFRP bars, because the confined effect of confining torus on concrete is obviously different from that of stirrups. Shield and Wambeke [36] have pointed out that, unlike steel bars, there is no relative higher rib area on the surface of an FRP bar and, therefore, the presence of confinement that is provided by stirrups may not demonstrate an apparent effect upon the bond behavior of an FRP bar. Yet, this conclusion relies on very few test samples; certain research that was conducted on the GFRP-RC structure indicates that the various configuration of stirrups determines the failure modes and usability of a GFRP-RC structure to a great extent [37,38,39]. Sonobe et al. [40] have explicated the methodology of FRP bar pullout testing, requiring stirrup configuration in concrete cubes. However, they have not delineated the relative conclusions of such tests. The Canadian design standard (CAN/CSA S806-02 [29], CSA S6-06 [30]) and Japanese design standard (JSCE) [31] established an explicit, predictor formula for the determination of the bond strength of FRP bars. This considers the confined effect of stirrups with only one adjustment coefficient in the formulas. The formula is weakly targeted and it lacks verification. Therefore, it is indispensable that the influence of the confined effect of stirrups on the bond behavior between GFRP bars and concrete is studied.
In this paper, 100 pullout tests for GFRP bars and 20 pullout tests for steel bars have been carried out according to CSA S806-02 [29] and ACI 440.3R-04 [41] standards. These tests investigated the effects of various parameters on bond behavior (e.g., bond strength, slip capacity, and failure mode) of GFRP bars that are embedded in concrete. Furthermore, the analytical model was also used in order to predict the τ-s relationship of GFRP bars in stirrups-confined concrete, and the appropriate parameters were derived from the present experimental data.

2. Testing Program

2.1. Material Properties

The GFRP bars in this study were made of unidirectional E-glass fibres and vynilester resin. There are three types of external surfaces of the GFRP bars: helical wrapping, helical wrapping with sand coating, and ribbed (deformations by resin). Pullout tests have also been performed upon steel bars to form a comparison. Figure 1 shows the surface deformation and the characteristics of the bars. The nominal diameters of these bars provided by manufacturers were 8, 12, 16, and 20 mm. Normalised tests were conducted to determine the cross-sectional areas (experimental bar diameter) and mechanical properties (tensile strength and elastic modulus) of the bars, according to ACI 440.3R-04 [41] and CSA S806-02 [29]. Table 1 displays the geometric and mechanical information of the bars.
In order to analyze the influence of concrete strength on the bond behavior, two different concrete strengths, C1 and C2, were used. Three concrete cubes of 150 mm × 150 mm × 150 mm were reserved and then cured for 28 days with all specimens being subjected to the same conditions, obtaining an average compressive strength of 28.2 ± 0.5 MPa for C1 and 4 47.6 ± 0.7 MPa for C2. Table 2 shows the compositions of C1 and C2.

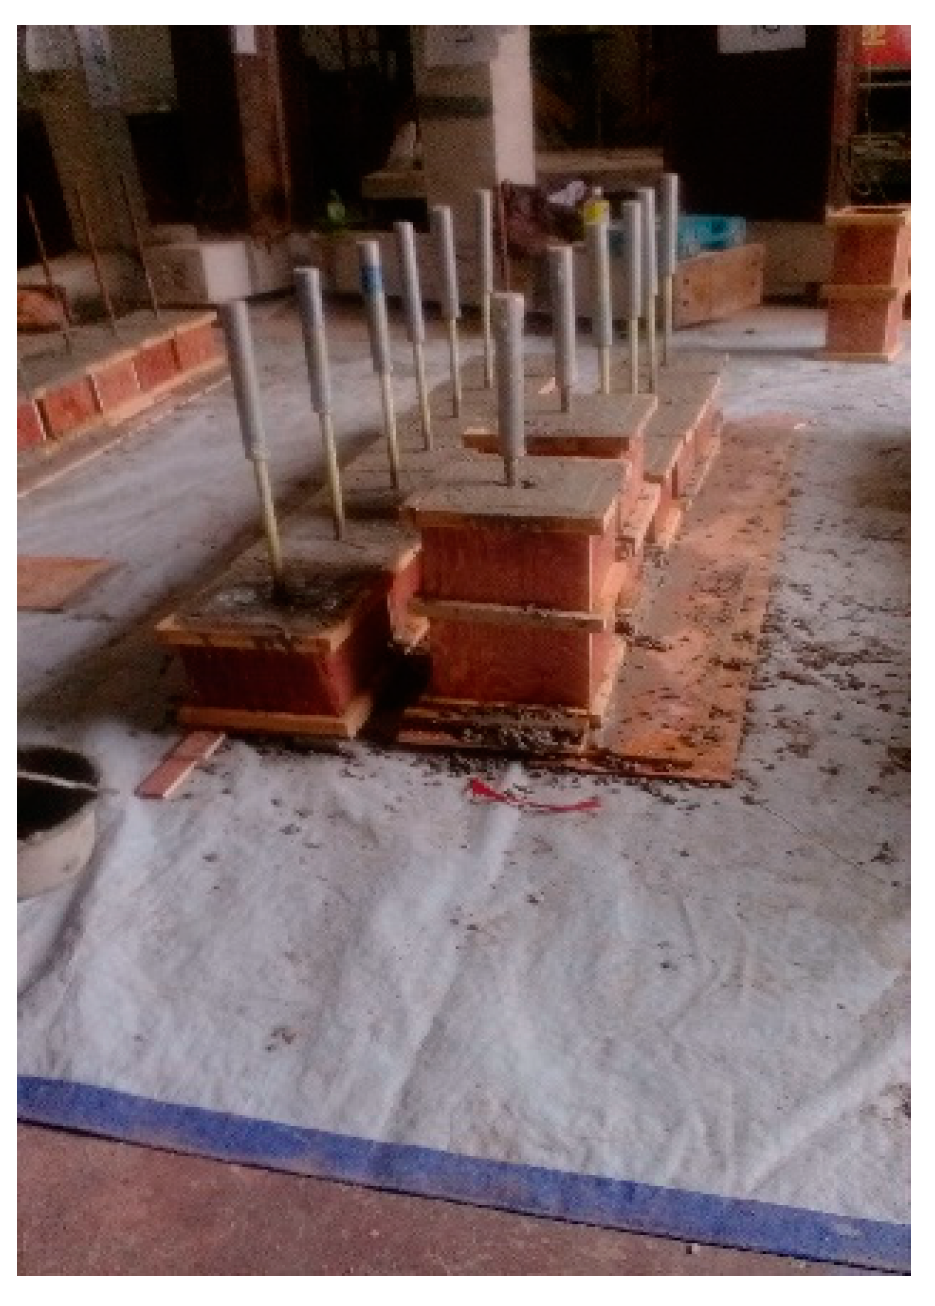
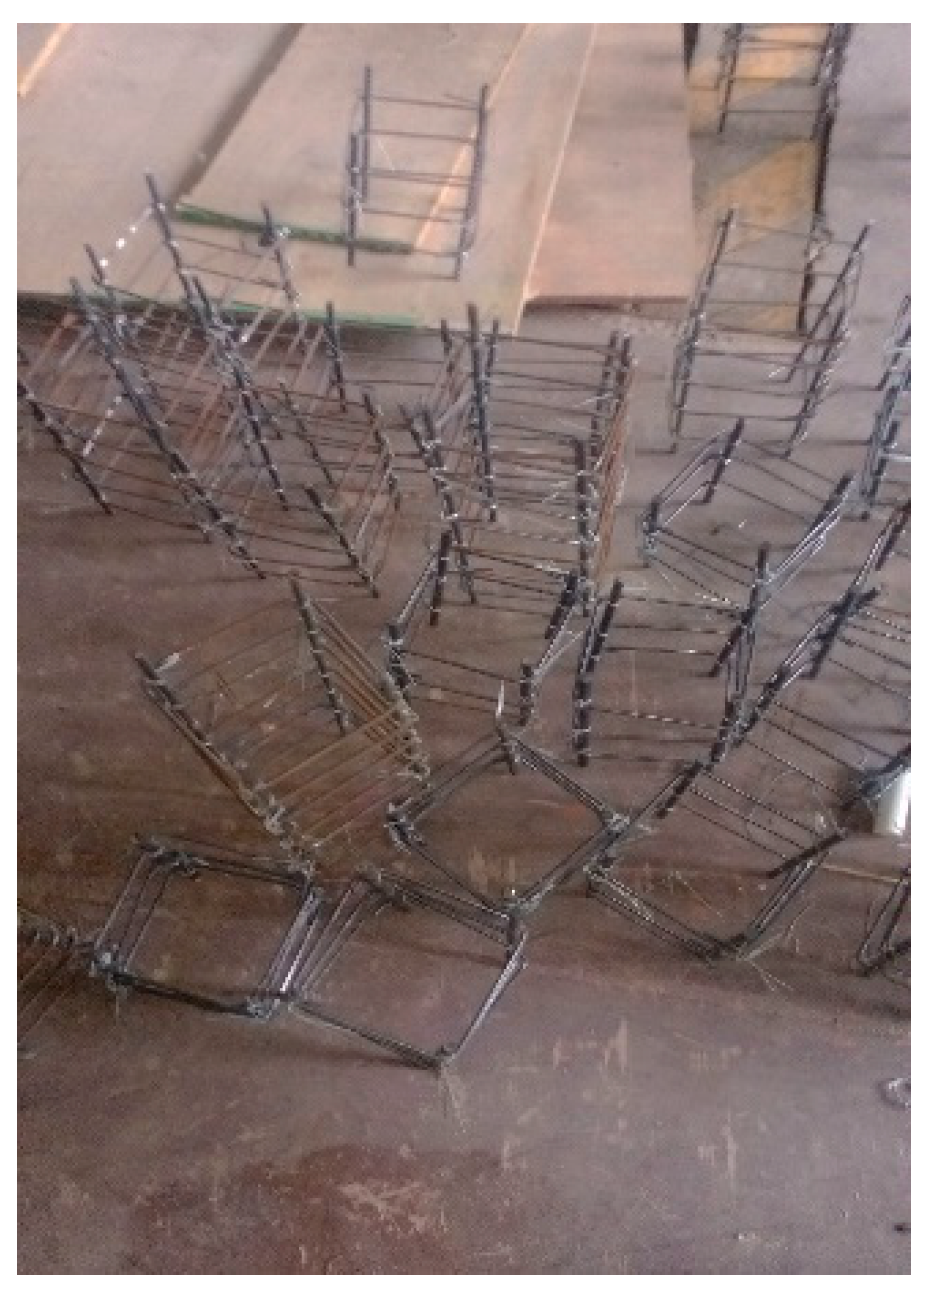
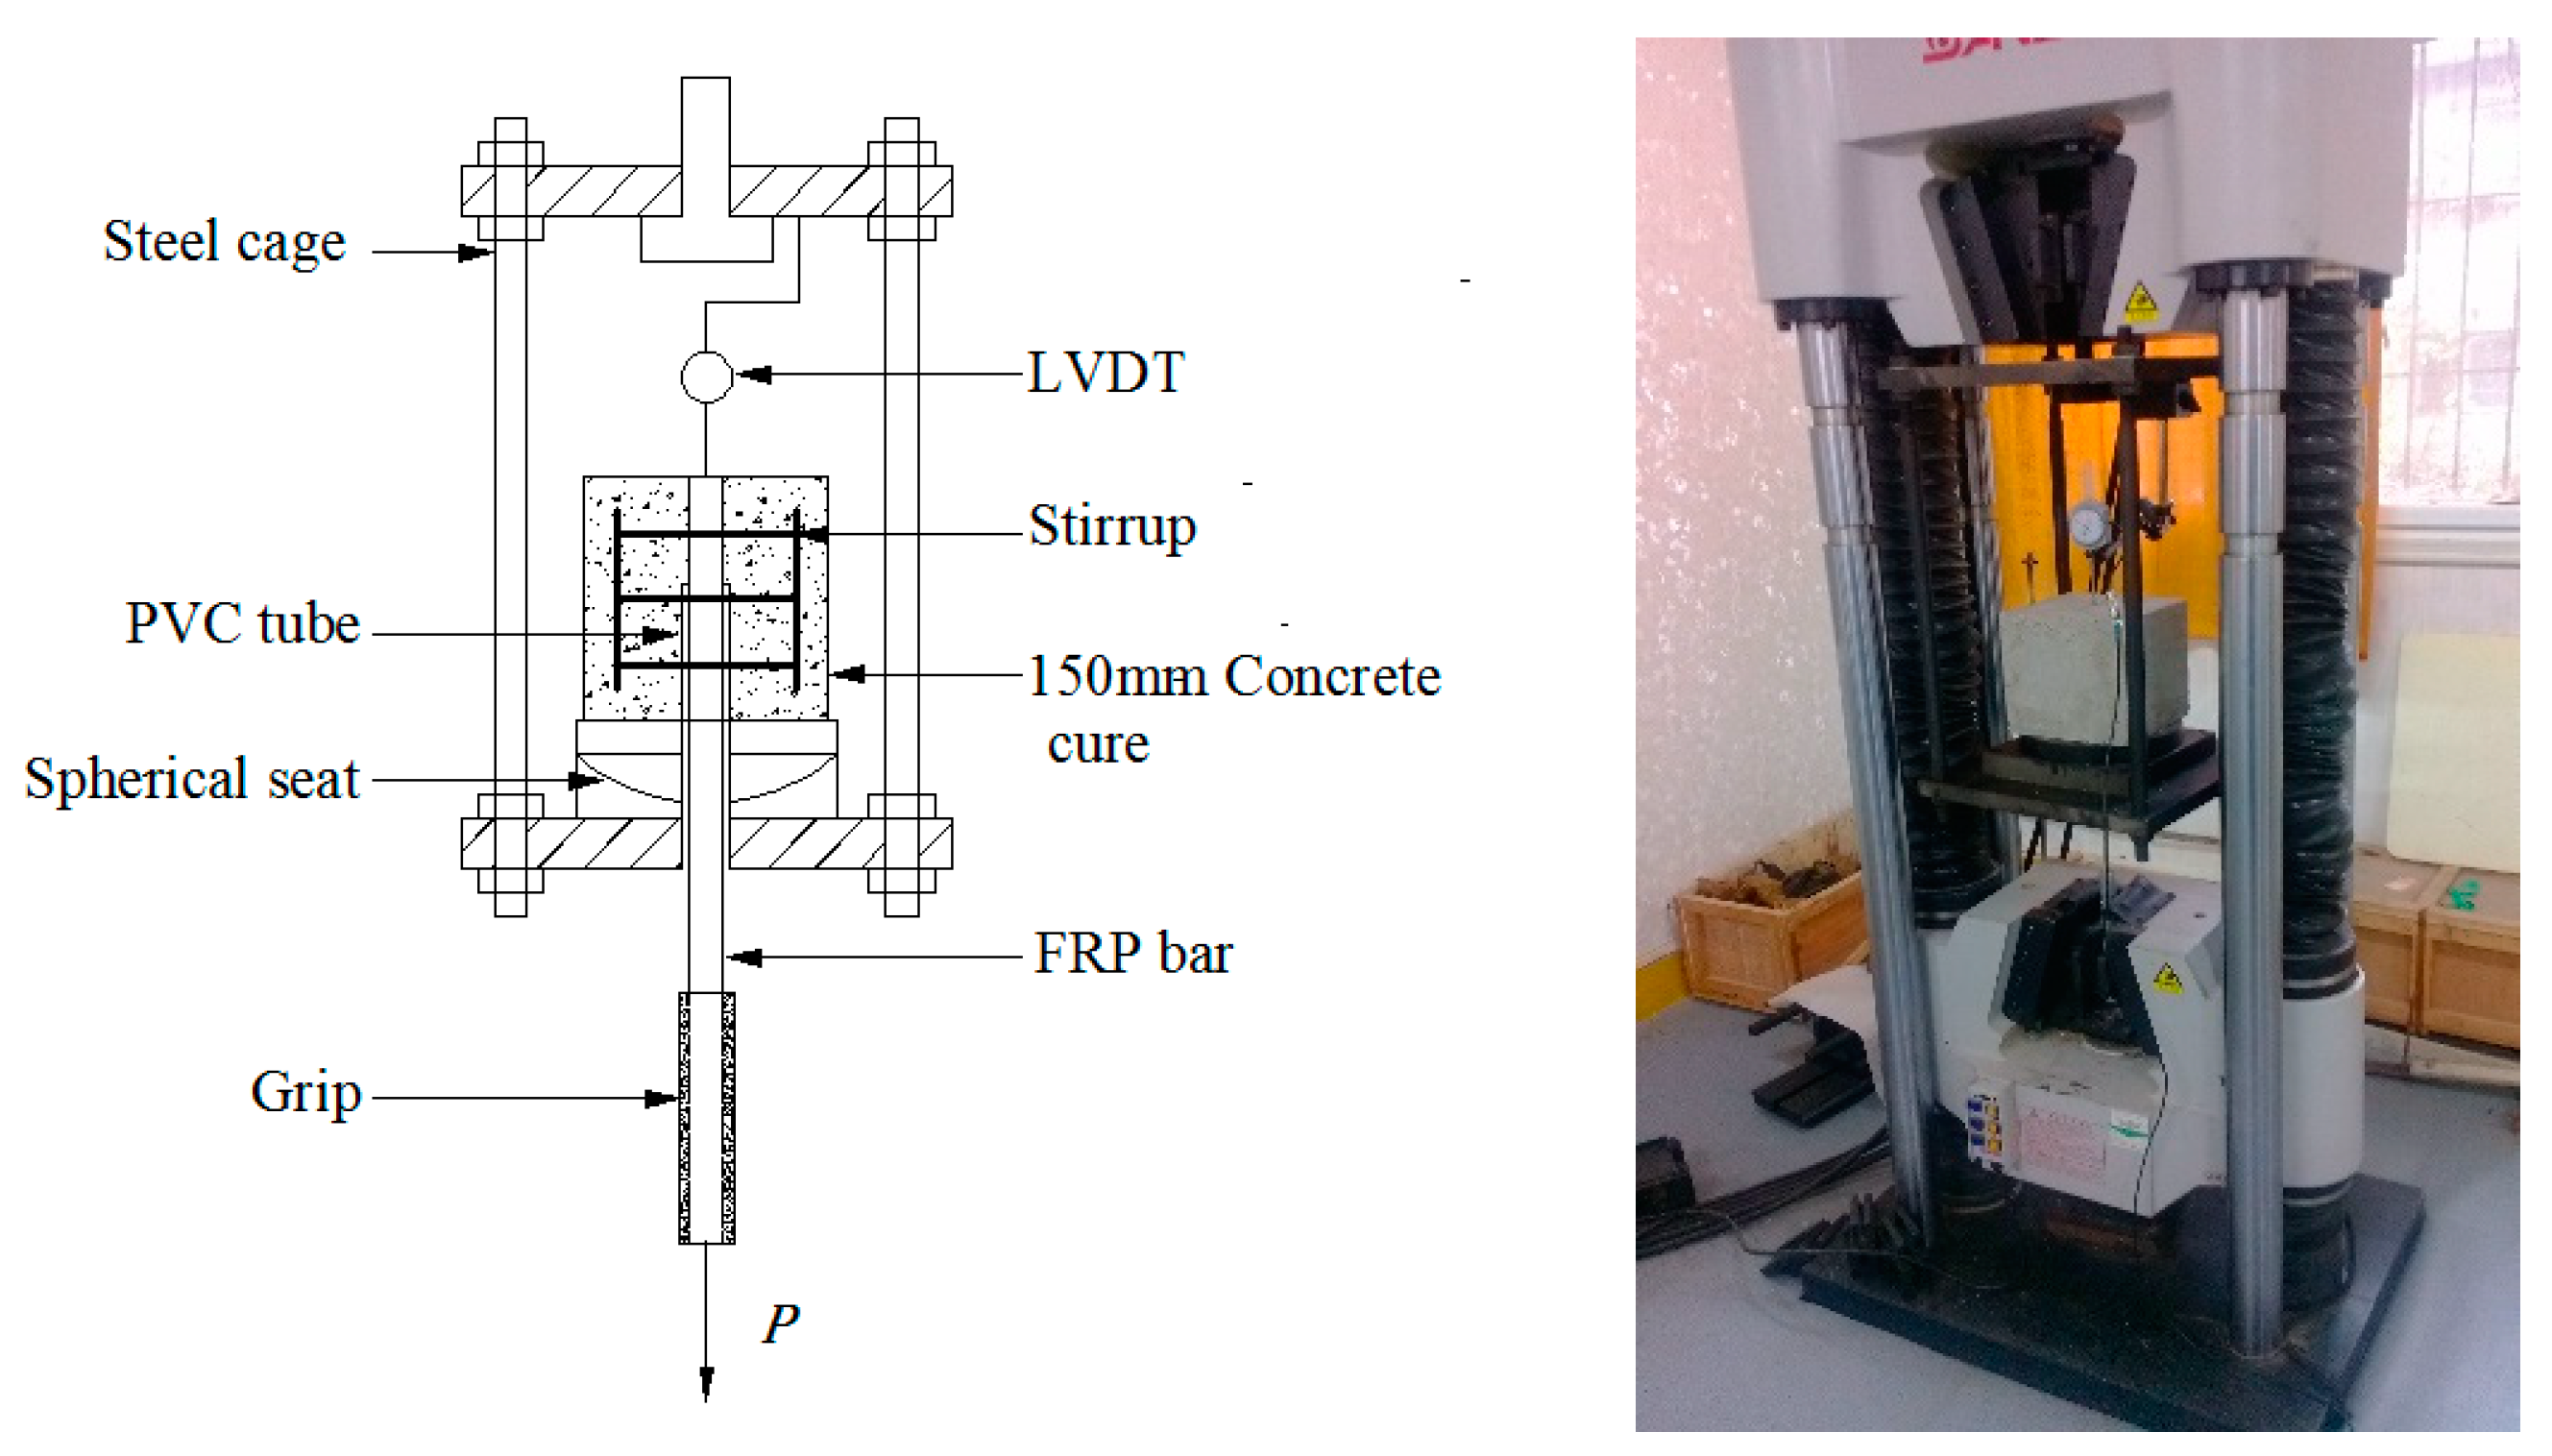
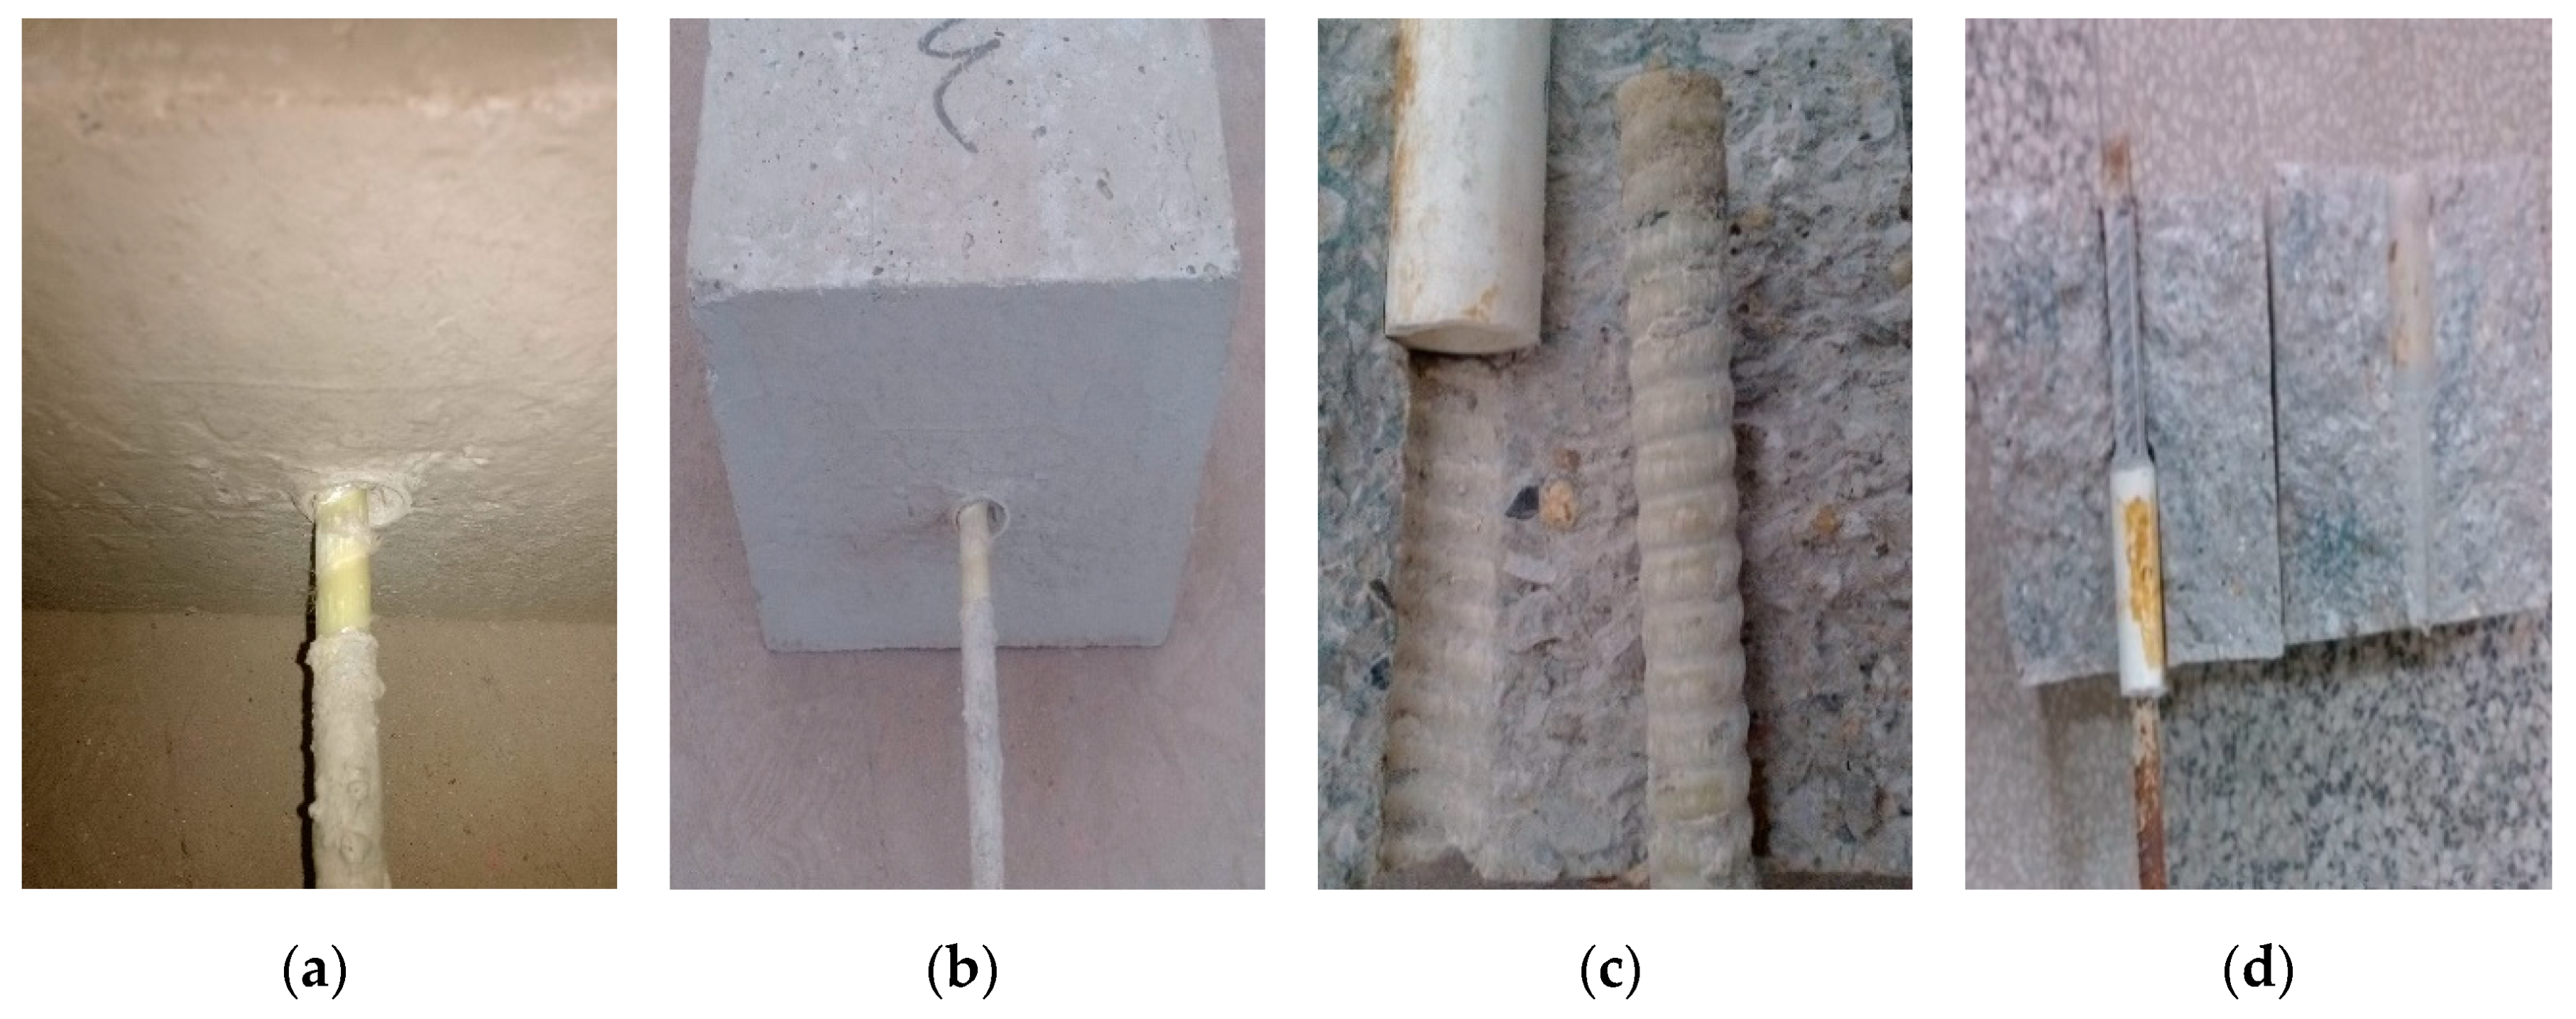
2.2. Specimens, Setup and Testing Equipment

According to CSA S806-02 [29], the bars were pulled from 150 mm concrete cubes. The embedment length was 5d (d is the bar diameter). The diameter of the stirrup was 8 mm and the spacing was 40 mm. In order to be closer to the actual situation in engineering, longitudinal steel bars were configured in concrete cube and then tied with stirrups. The assembled steel cages are shown in Figure 2 and the tested specimens are shown in Figure 3. Two nominally identical specimens without stirrups (N) and three nominally identical specimens with stirrups (Y) were tested for each specimen type to obtain some measure of uncertainty. Each specimen has been identified with a five-part code. For instance, R1-C1-8-N-1 indicates the surface characteristic of GFRP in the specimen is helical wrapping, concrete strength is C1, the bar diameter is 8 mm, no stirrup is configured in the concrete cube, and the specimen is numbered as 1 in the identical specimens.
A pullout load was applied using a servo-hydraulic testing machine (1000KN/SHT4106-G) with displacement control with the loading speed set at 1.0 mm/min, as shown in Figure 4. Contact between the concrete and the bar along the debonded length was broken using a Polyvinyl chloride (PVC) tube to minimize the stress concentration that is near the loaded end. A spherical seat was installed between the steel plate and the base plate at the bottom of the steel frame of the fixed concrete specimen. This enabled the specimen to spin freely within a narrow range during the loading process in order to prevent the GFRP bar or the steel bar from bending and torsion due to the load. The free (unload) end slips of the bar relative to concrete were measured with two linear variable differential transformers (LVDTs) that were fixed on the surface of the bar. Outputs from the servo-hydraulic testing machine and the LVDTs were recorded while using an automatic data acquisition system.

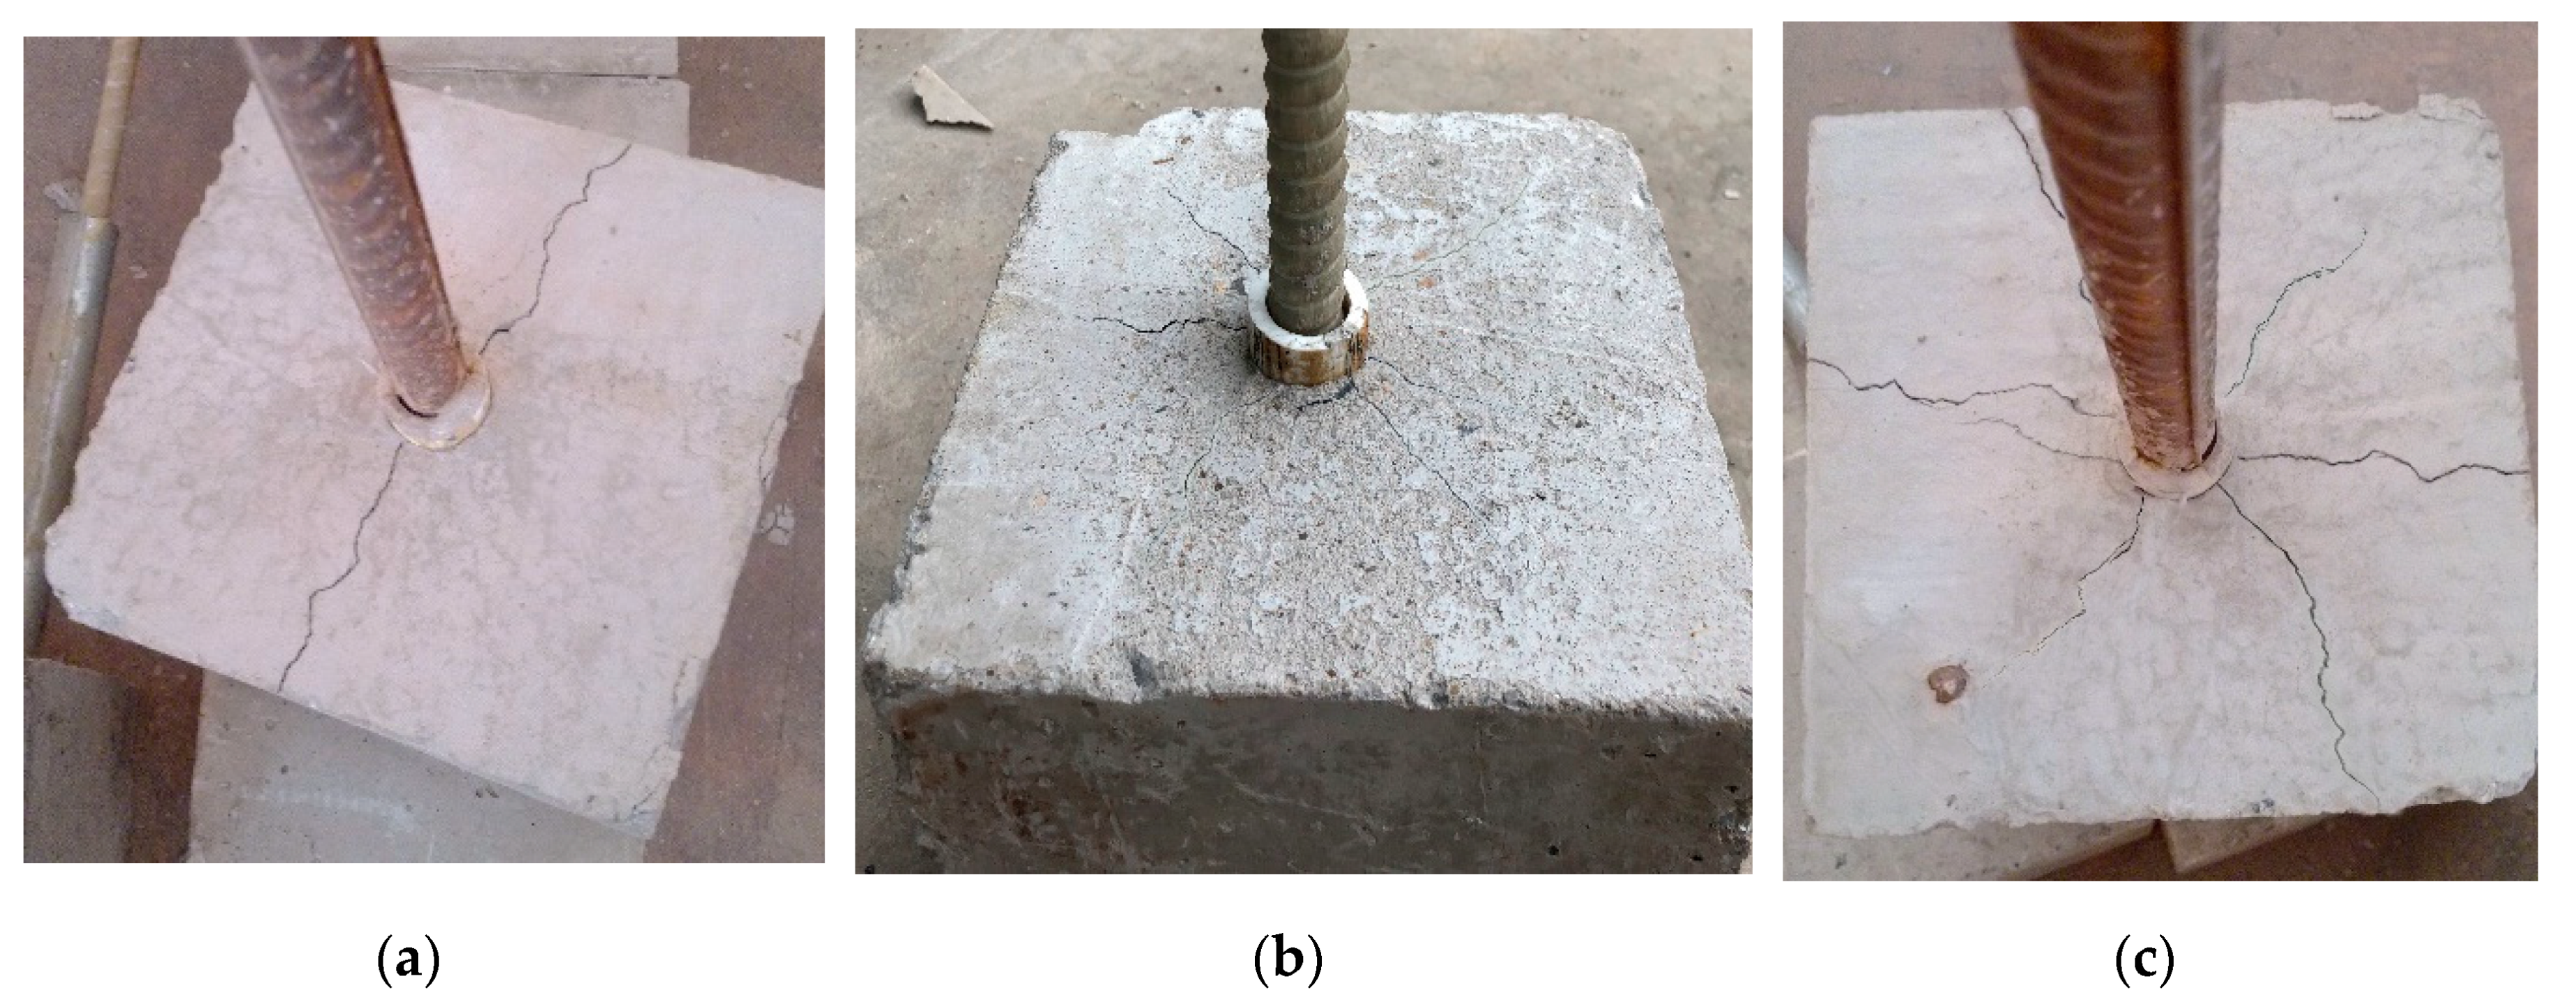
3. Experimental Result

In the pullout tests, the pullout load and the displacement values were used to calculate the corresponding average bond stress and slip. The average bond stress were calculated as the pullout force divided by the surface area of the bar that is embedded in the concrete with the assumption of uniform bond stress distribution along the embedment length:
τ = P π d l
where τ is the average bond stress; P is the imposed force; d is bar diameter; and, l is the embedment length. Due to the low elastic modulus of the GFRP bar, a significant degree of elastic deformation occurs at its loading end, resulting in deviations in the calculation of slip at the loading end, which influence the accuracy of the τ-s relationship [24]. Nevertheless, measuring of the slip at the free end enables the accurate reflection of the actual slippage of the GFRP bar in the concrete. Consequently, in this study, the slips corresponding to average bond stress are derived from the free of slip. Table 3 depicts the test results, in which τmax is representative of the maximum average bond stress (bond strength), and sm is the free end slip corresponding to the maximum average bond stress; τ* is the average bond strength that is obtained by calculating mean value of bond strength for identical specimens. s* is the average free end slip corresponding to τ*; P represents pullout failure; and, S represents concrete splitting failure. Figure 5, Figure 6, Figure 7, Figure 8 and Figure 9 shows the τ-s curves of the different specimens. Due to the results of the identical specimens being basically the same, one curve was chosen for each specimen type in Figure 5, Figure 6, Figure 7, Figure 8 and Figure 9. It is apparent that the τ-s curves of the specimens exhibit distinctive features with different surface characteristics of the bar. Section 4 discusses this phenomenon.

4. Parameterization Analysis

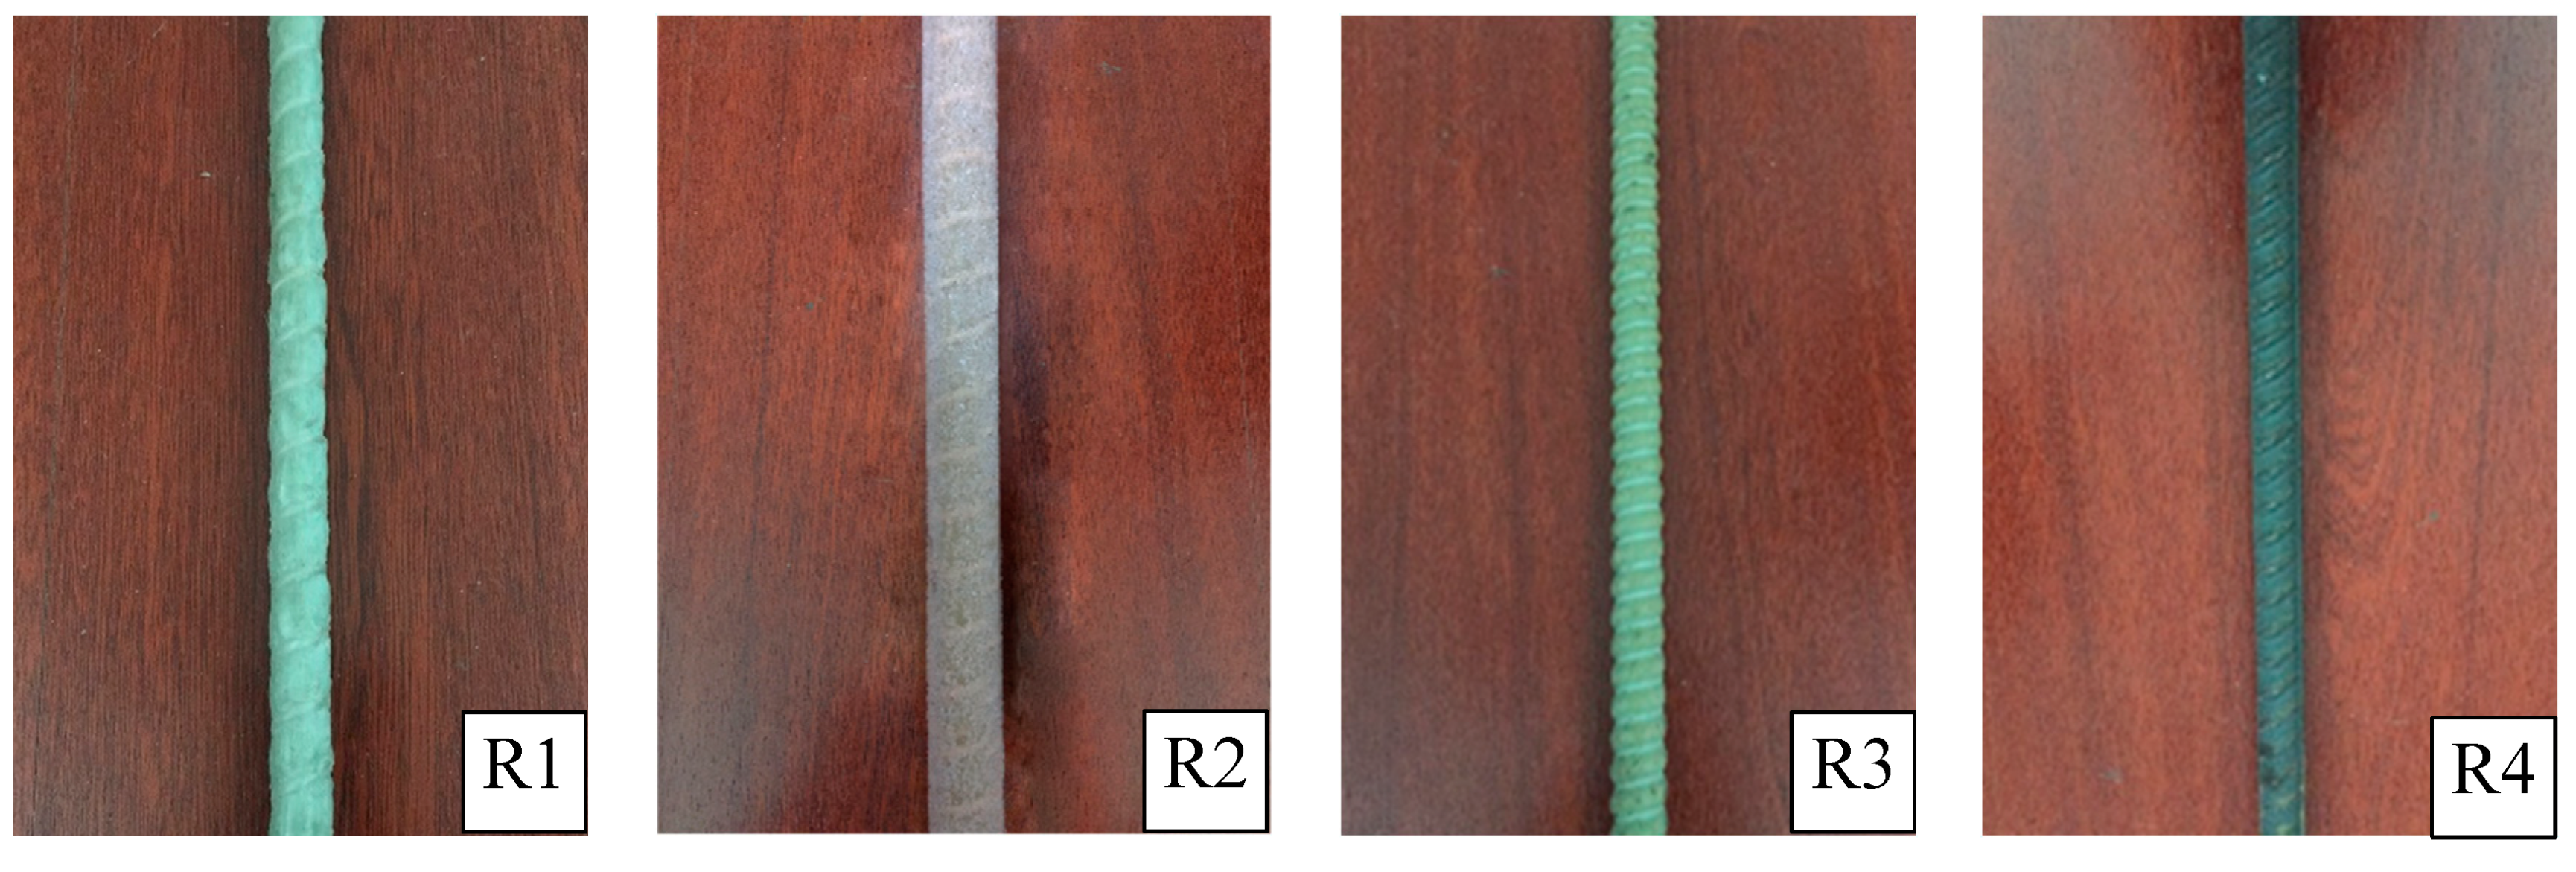
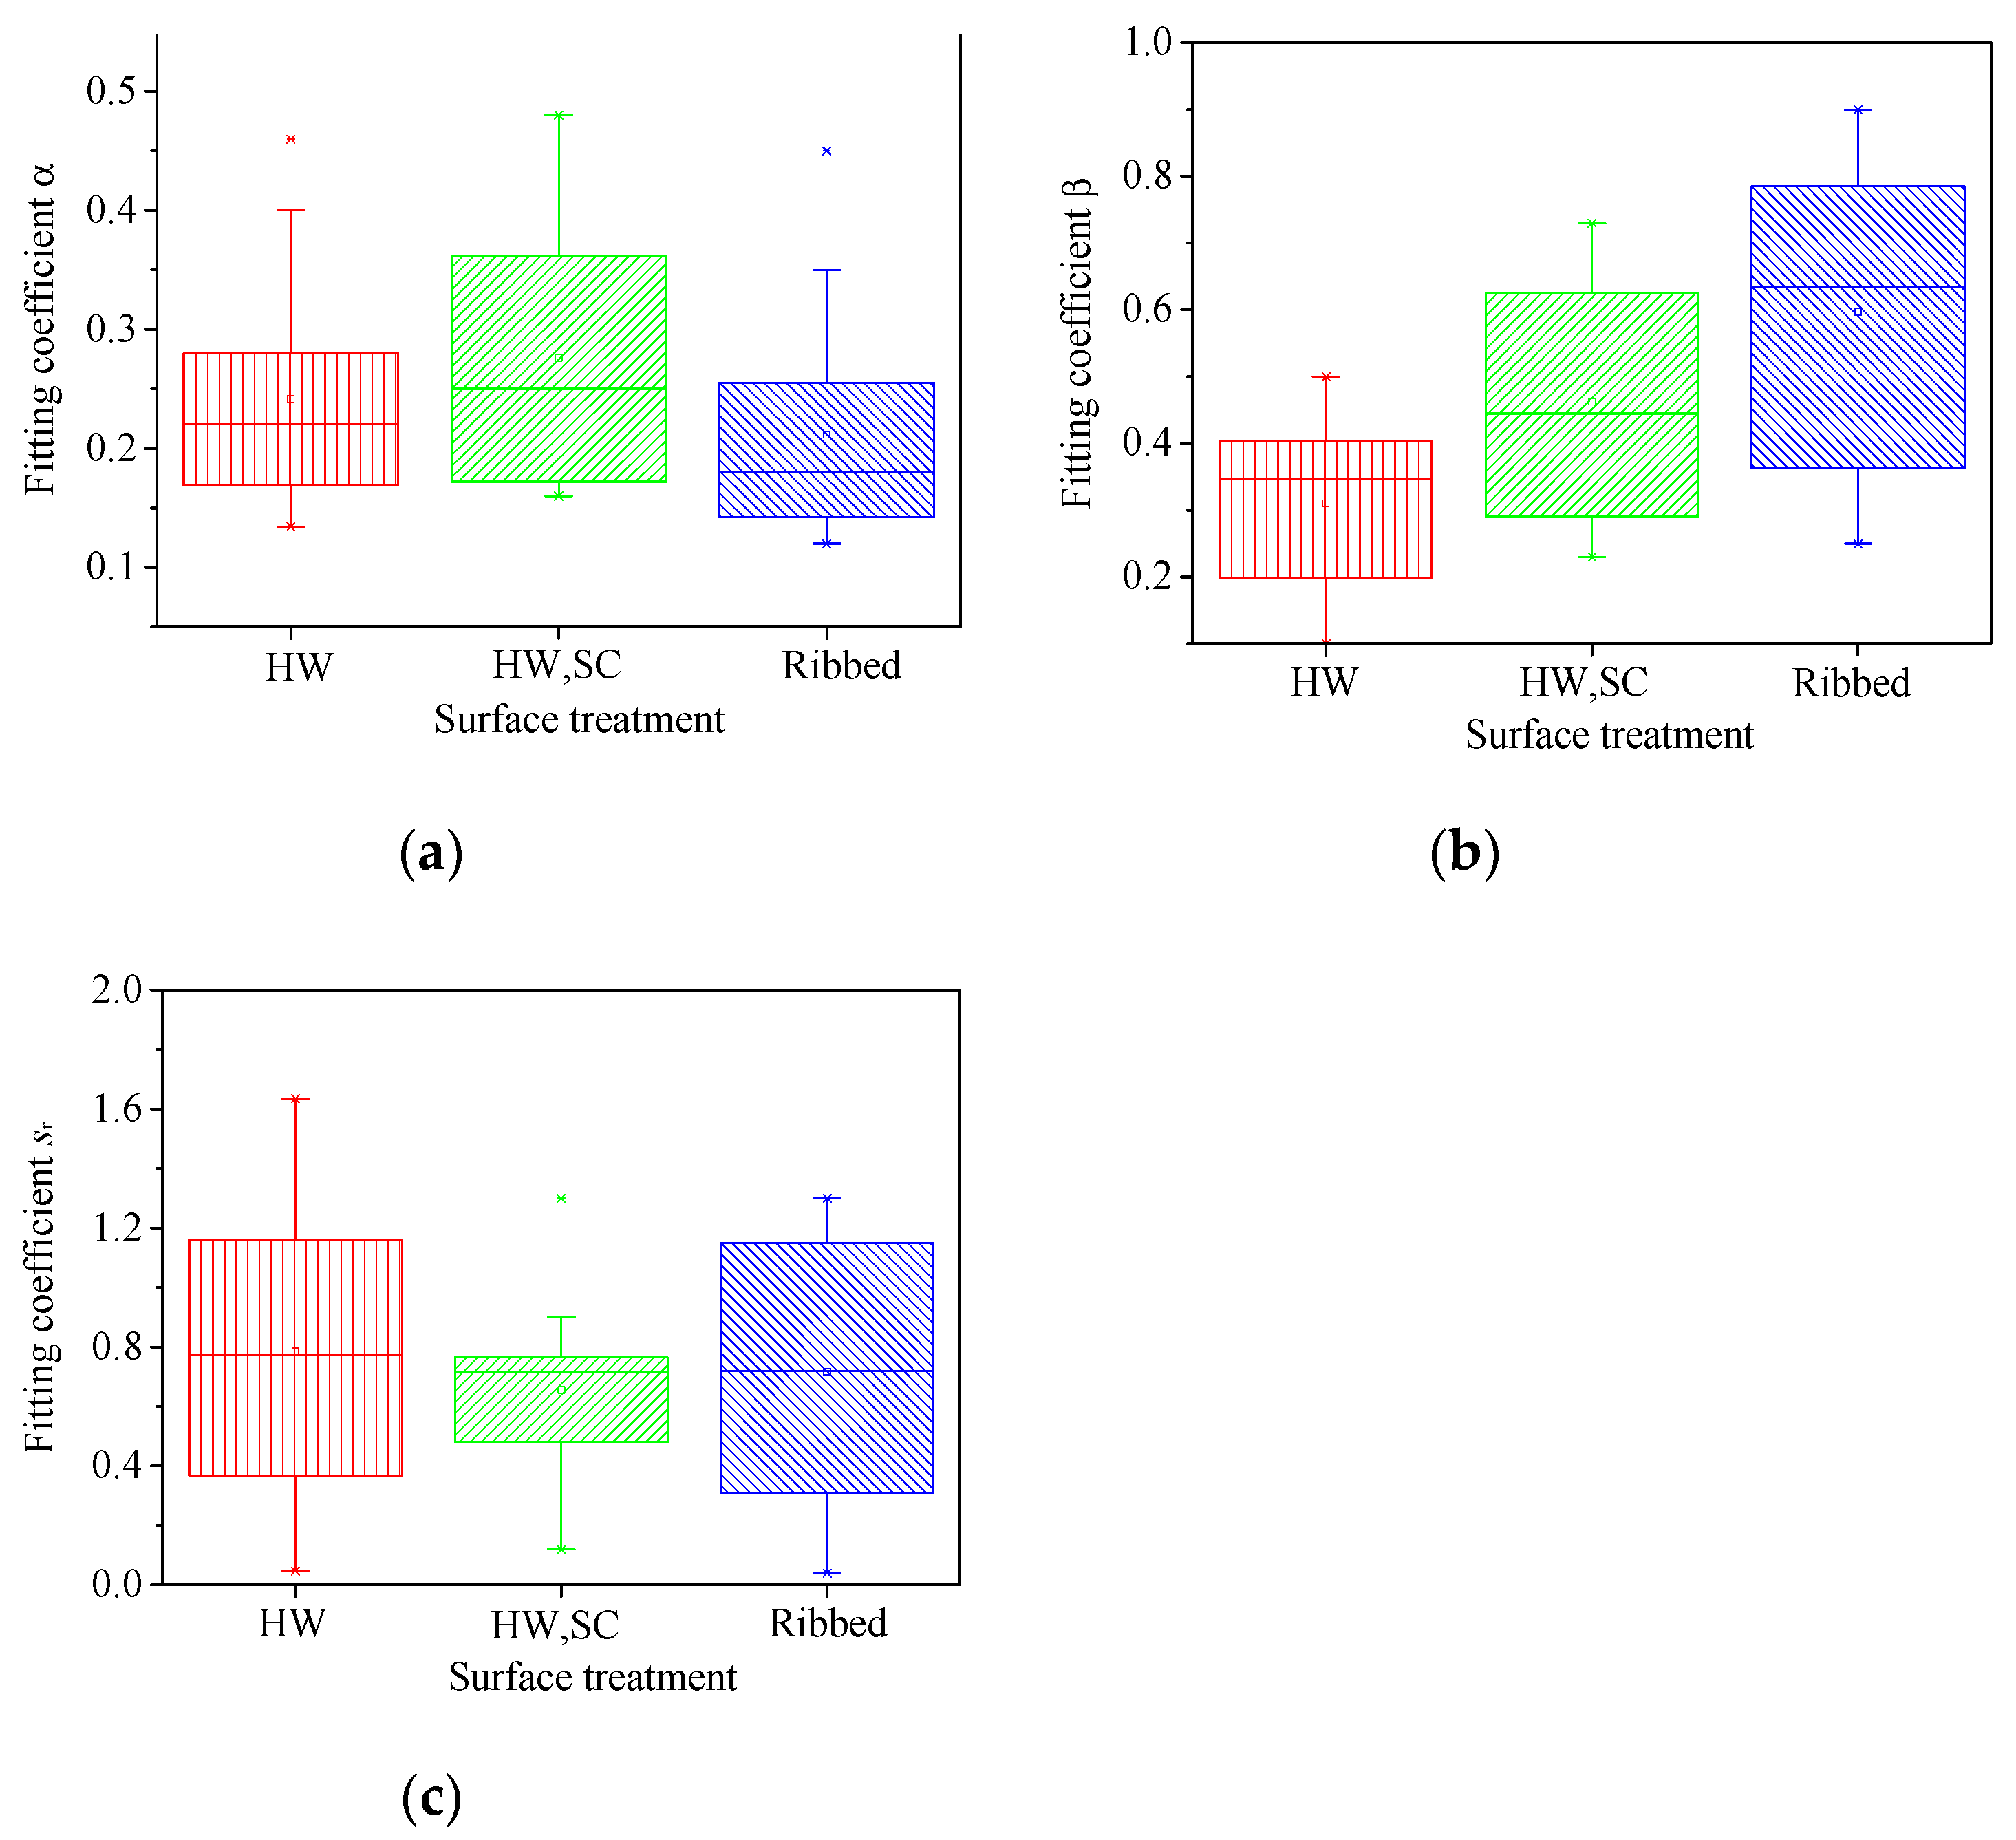
4.1. Influence of Bar Surface Characteristics

In this paper, the tests compare the bond behavior of three types of surface characteristics that are observable in GFRP bars, R1/helical wrapping, R2/helical wrapping and sand coating, and R3/Ribbed.
Figure 10 shows the typical failure modes of GFRP bars that are exhibited by specimens with pullout failure. Close examination of the surface of GFRP bars indicated that the bond stress collapse of the GFRP bar was primarily due to the detachment of the fiber spirals and resin layer, for R1 bars (Figure 10a), and sand grains for R2 (Figure 10b) bars, while the concrete surface remained damaged. It was evident that a friction-resistant type mechanism had been activated via this failure mode. The bond stress was predominantly dependent upon chemical adhesion and after slip upon friction. Furthermore, sanding provides many small anchoring points that are distributed over the surface, leading to an increase of friction between GFRP bar and concrete, thereby increasing bond strength. Table 3 shows that the average bond strength of R2 bars is 1.2–1.35 times that of R1 bars with the same diameter. This is also reflected in the experiments by Zhang et al. [42]. Subsequent to pullout failure, the R1 bars exhibited a constant residual bond stress that is caused by the friction between the bar and concrete, whereas the R2 bars exhibited a small amount of oscillating residual bond stress due to the existence of mechanical interlocks between the shallow sand coating and the concrete (Figure 5 and Figure 6). Close examination the interface between the R3 and R4 bars and the concrete revealed that the bond stress collapse of R3 bar was a consequence of the crushing of concrete and the shearing off of ribs (Figure 10c), whilst the failure of R4 bars was solely due to the crushing of concrete (Figure 10d). This failure mode verified that a bearing type mechanism was activated. The bond stress was primarily dependent on the interlocking interaction between ribs and concrete. Therefore, R3 and R4 bars exhibited a higher bond strength than friction-resistant type bars (R1, R2). The average bond strength of R3 bar manifested as 1.3–1.5 times that of R1 bar; that of R4 bar manifested as 1.75 times that of R1 bar with the same diameter (Table 3). After pullout failure, R3 exhibited a large oscillating residual bond stress due to the existence of interlocking between the residual ribs and the concrete (Figure 7).
When concrete splitting failure became apparent in the specimen, the bond stress-slip curves (Figure 5, Figure 6, Figure 7 and Figure 8) and the bond strength of the GFRP bars or steel bars with the same diameter were similar. The average bond strength of specimens R2-C1-16-N, R3-C1-16-N, and R4-C1-16-N is 10.32 MPa, 10.44 MPa, and 11.3 MPa, and that of specimens R1-C1-20-N, R2-C1-20-N, R3-C1-20-N, R4-C1-20-N is 7.42 MPa, 7.11 MPa, 6.9 MPa, and 7.14 MPa, which is in line with the results by Darwin and Graham [32] on bond behavior of steel bar. When the specimen exhibited splitting failure, the bond strength of the steel bar was not reliant on surface characteristics. The principal reason behind the failure of specimens was that the strain of concrete loop tensile stress direction around the bar exceeded the tensile strain limit of the concrete, causing the internal creation of cracks that were rapidly transmitted to the surface of the concrete, culminating in splitting failure.

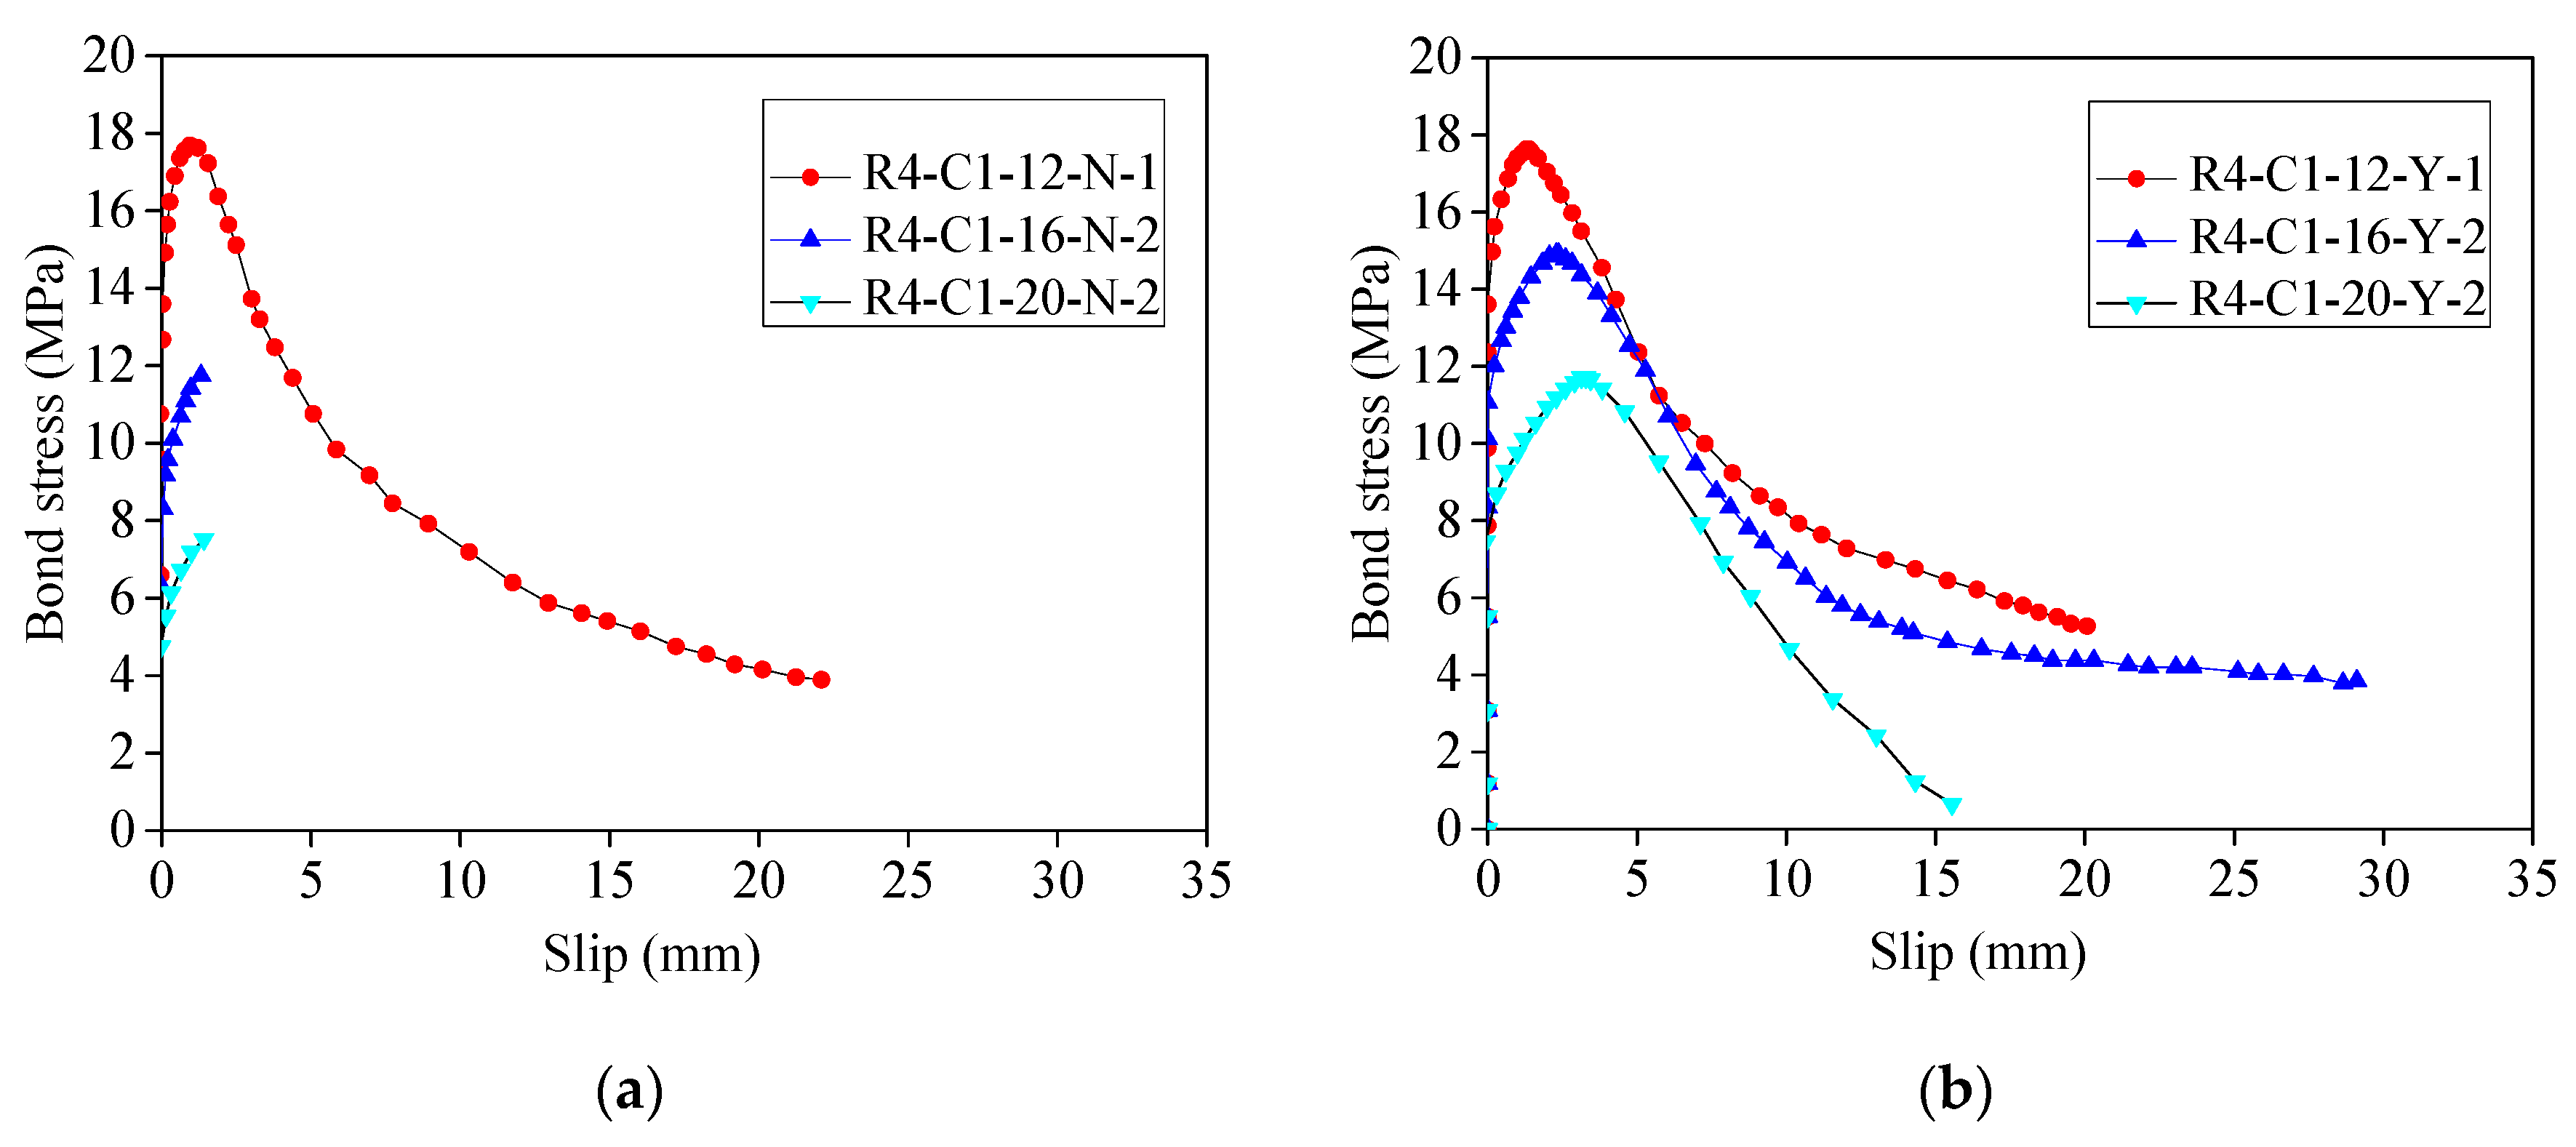
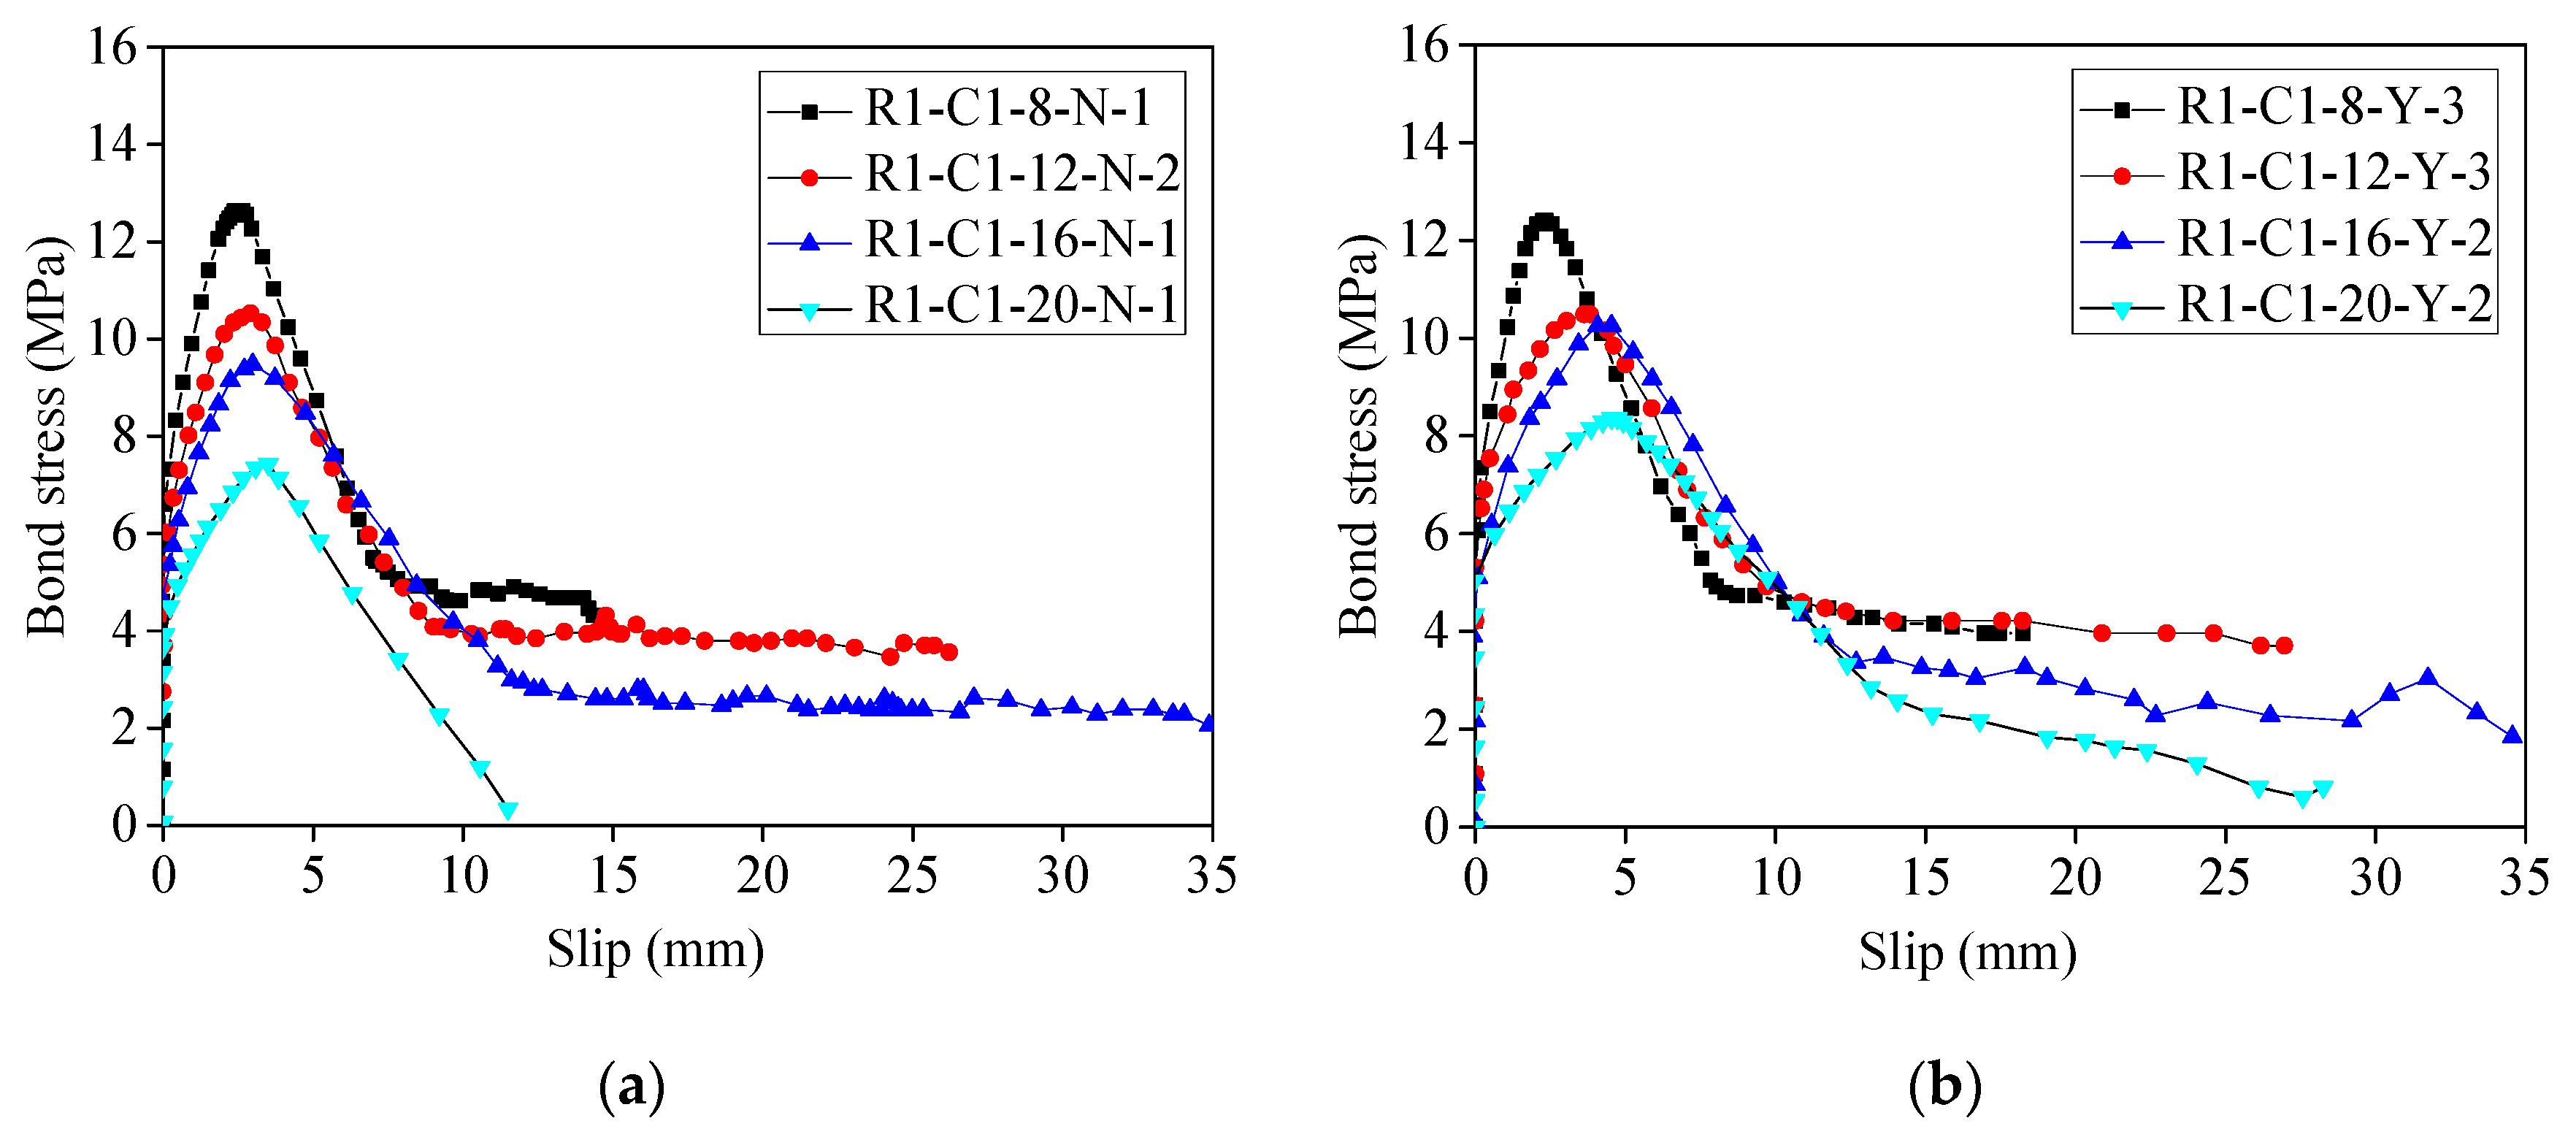
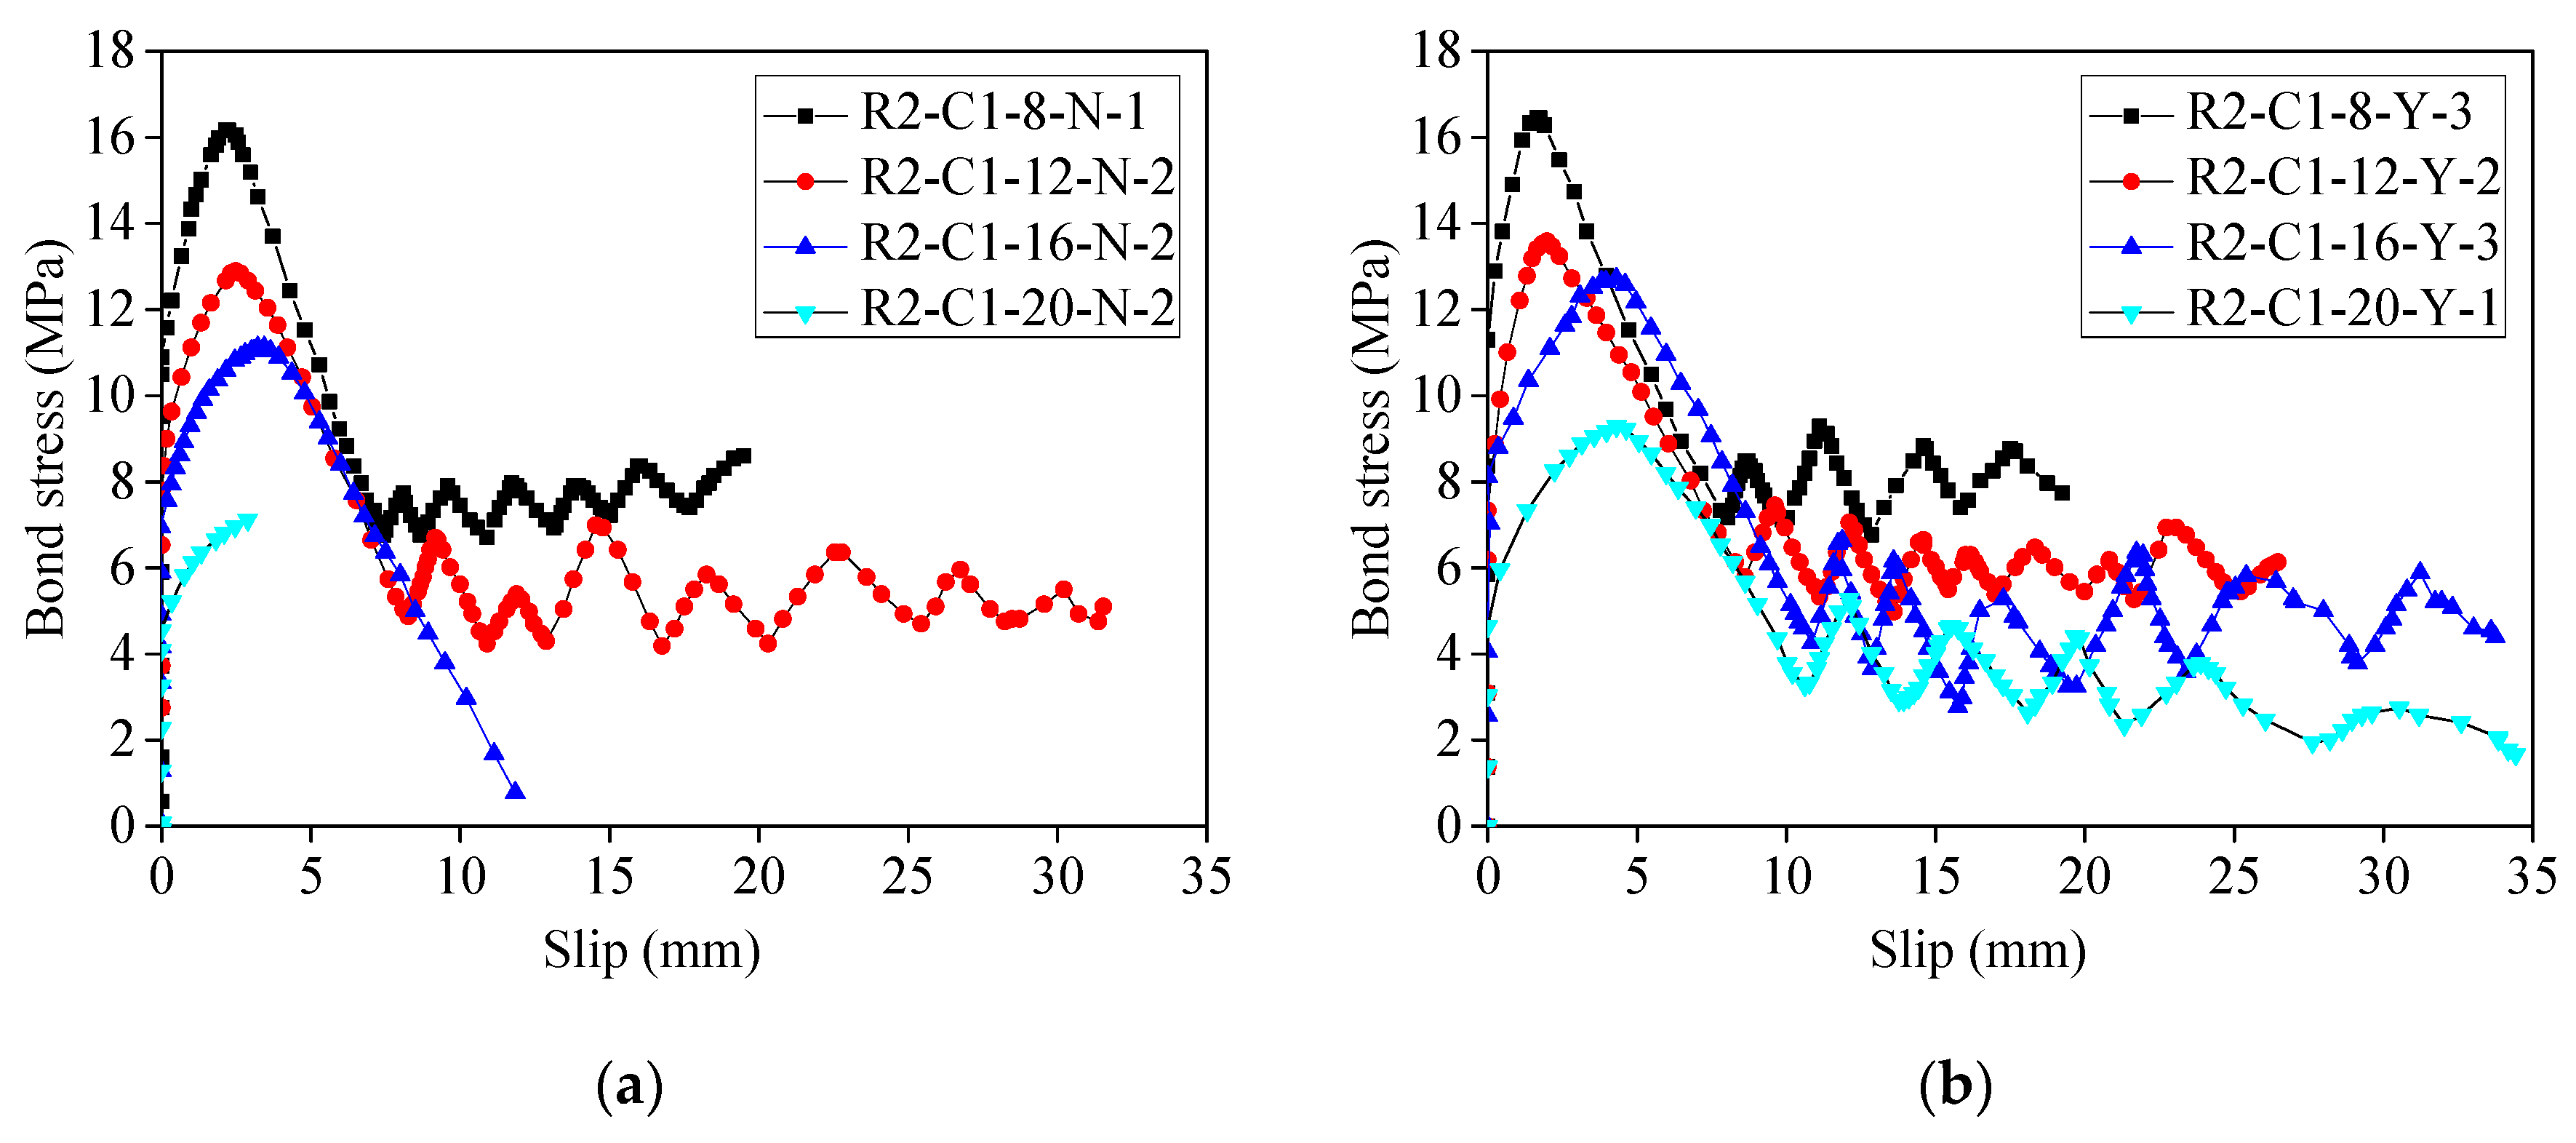
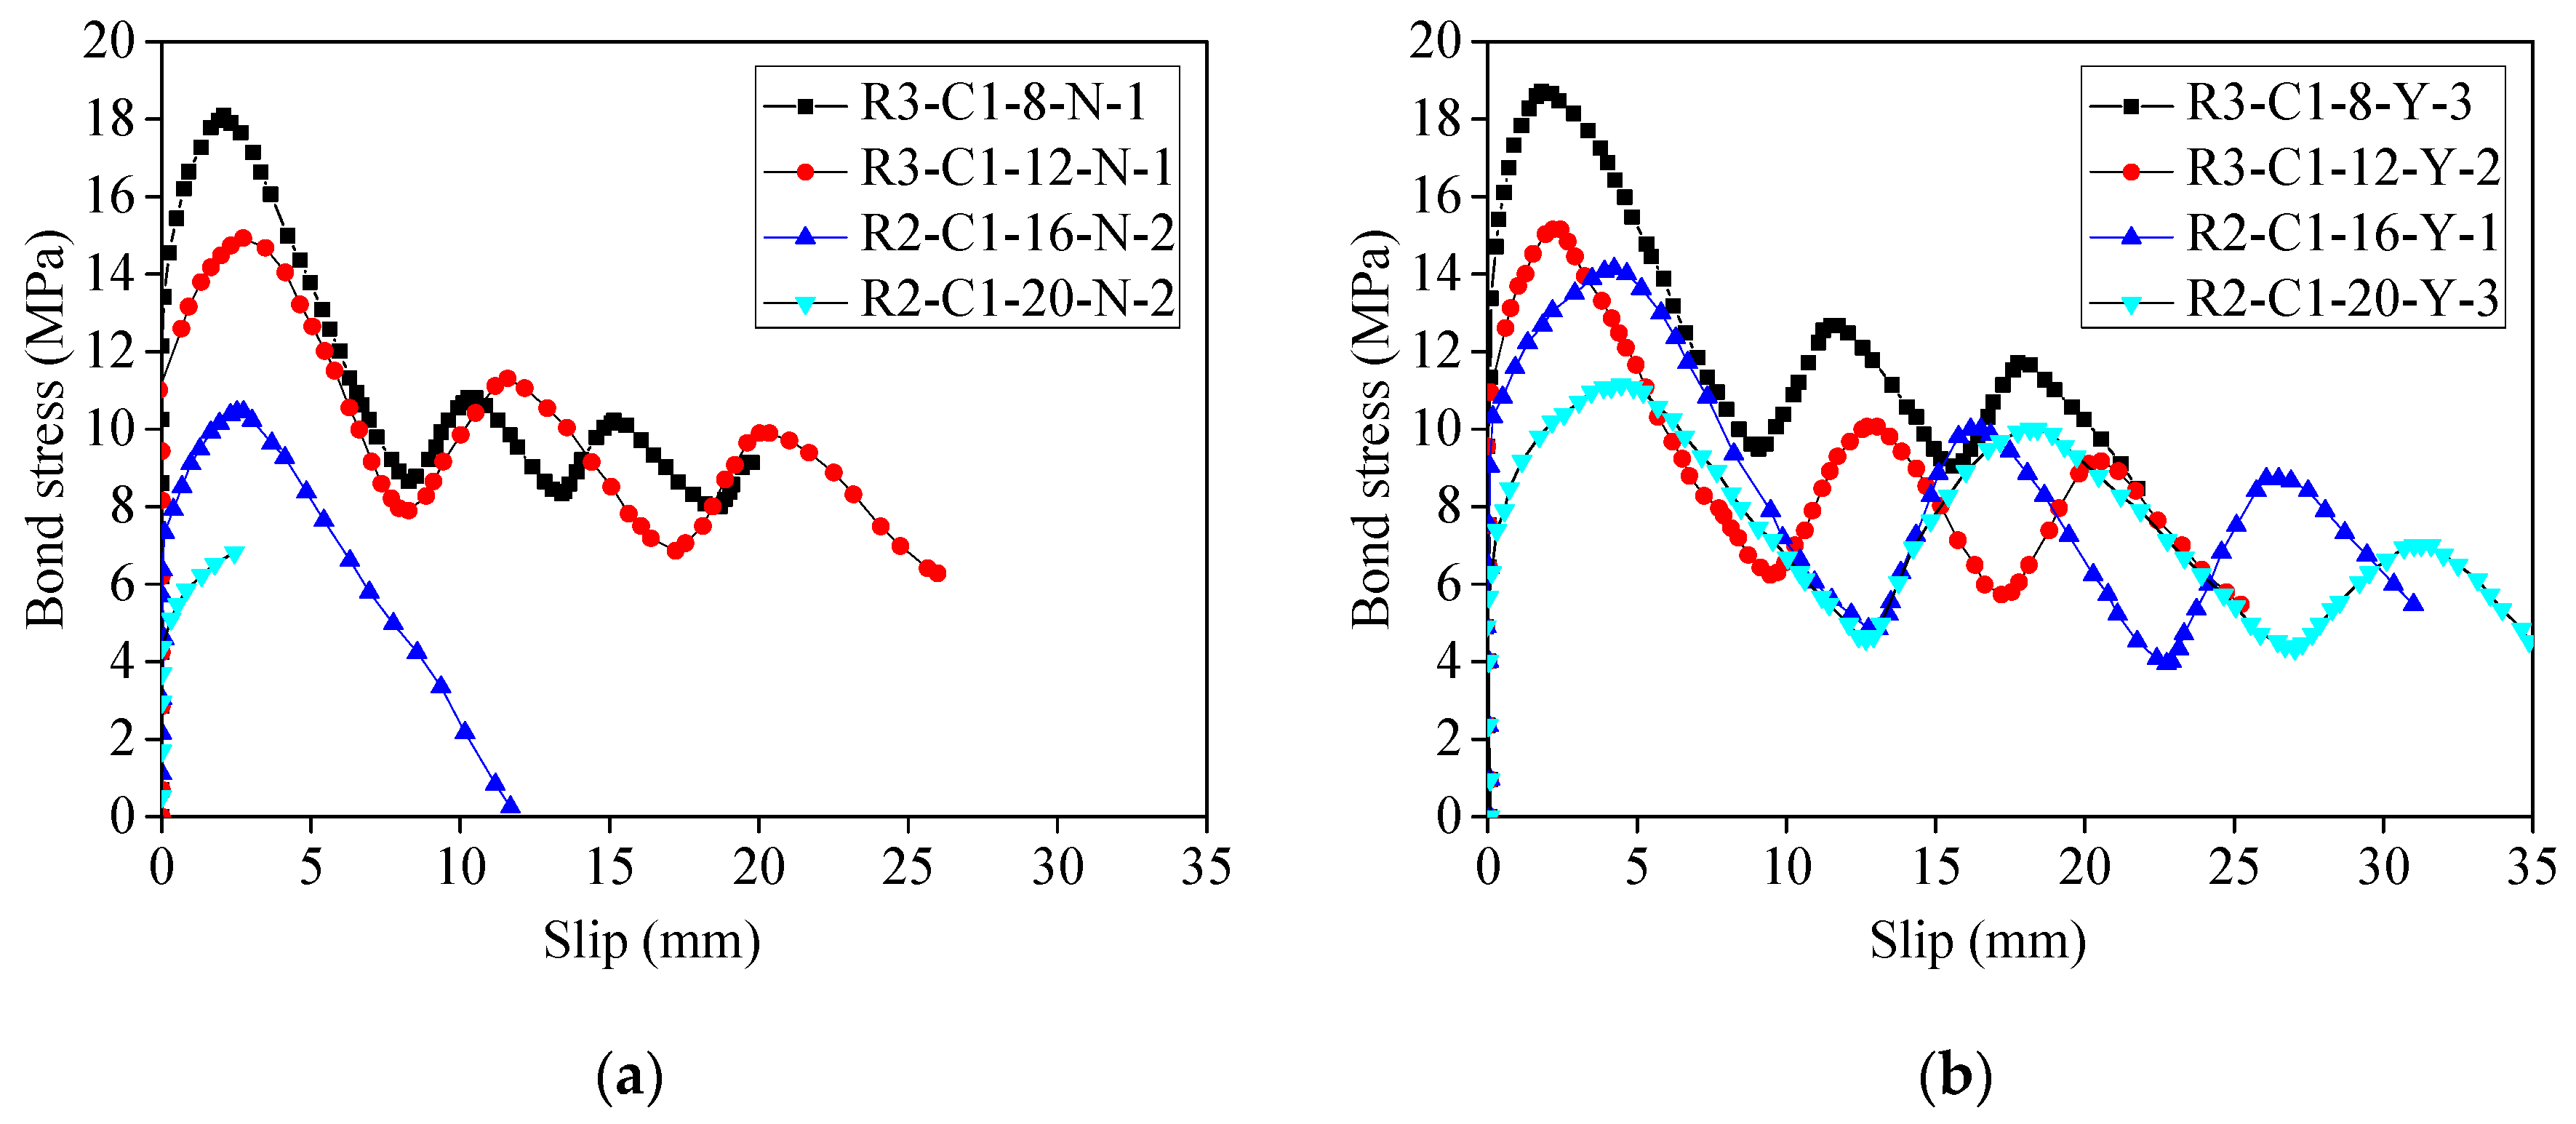
4.2. Influence of Bar Diameter

As has been indicated in prior literature [6,9,11,12,13], the larger the bar diameter, the smaller its bond strength. Two widely recognized viewpoints can explain this phenomenon. The former reasoning stating that bars with a larger diameter require longer embedment length in order to develop the same normal bond stress; larger embedment lengths reduce the average bond strength, as confirmed by the references [6,13]. As the latter reasoning states, Poisson’s effect [9,13] can lead to a slight reduction in bar diameter as a result of longitudinal stress. This bar reduction increases with bar diameter, which can lead to reduced frictional/mechanical locking stresses. This conclusion has been confirmed by experiments that were conducted previously; this tendency is not affected by the failure mode, concrete strength, the confined effect of stirrups, or the surface characteristics of GFRP bars (Figure 5, Figure 6, Figure 7 and Figure 8). Additionally, with an increase of GFRP bar diameter, there was an increased likelihood of concrete splitting in specimens (Table 3).

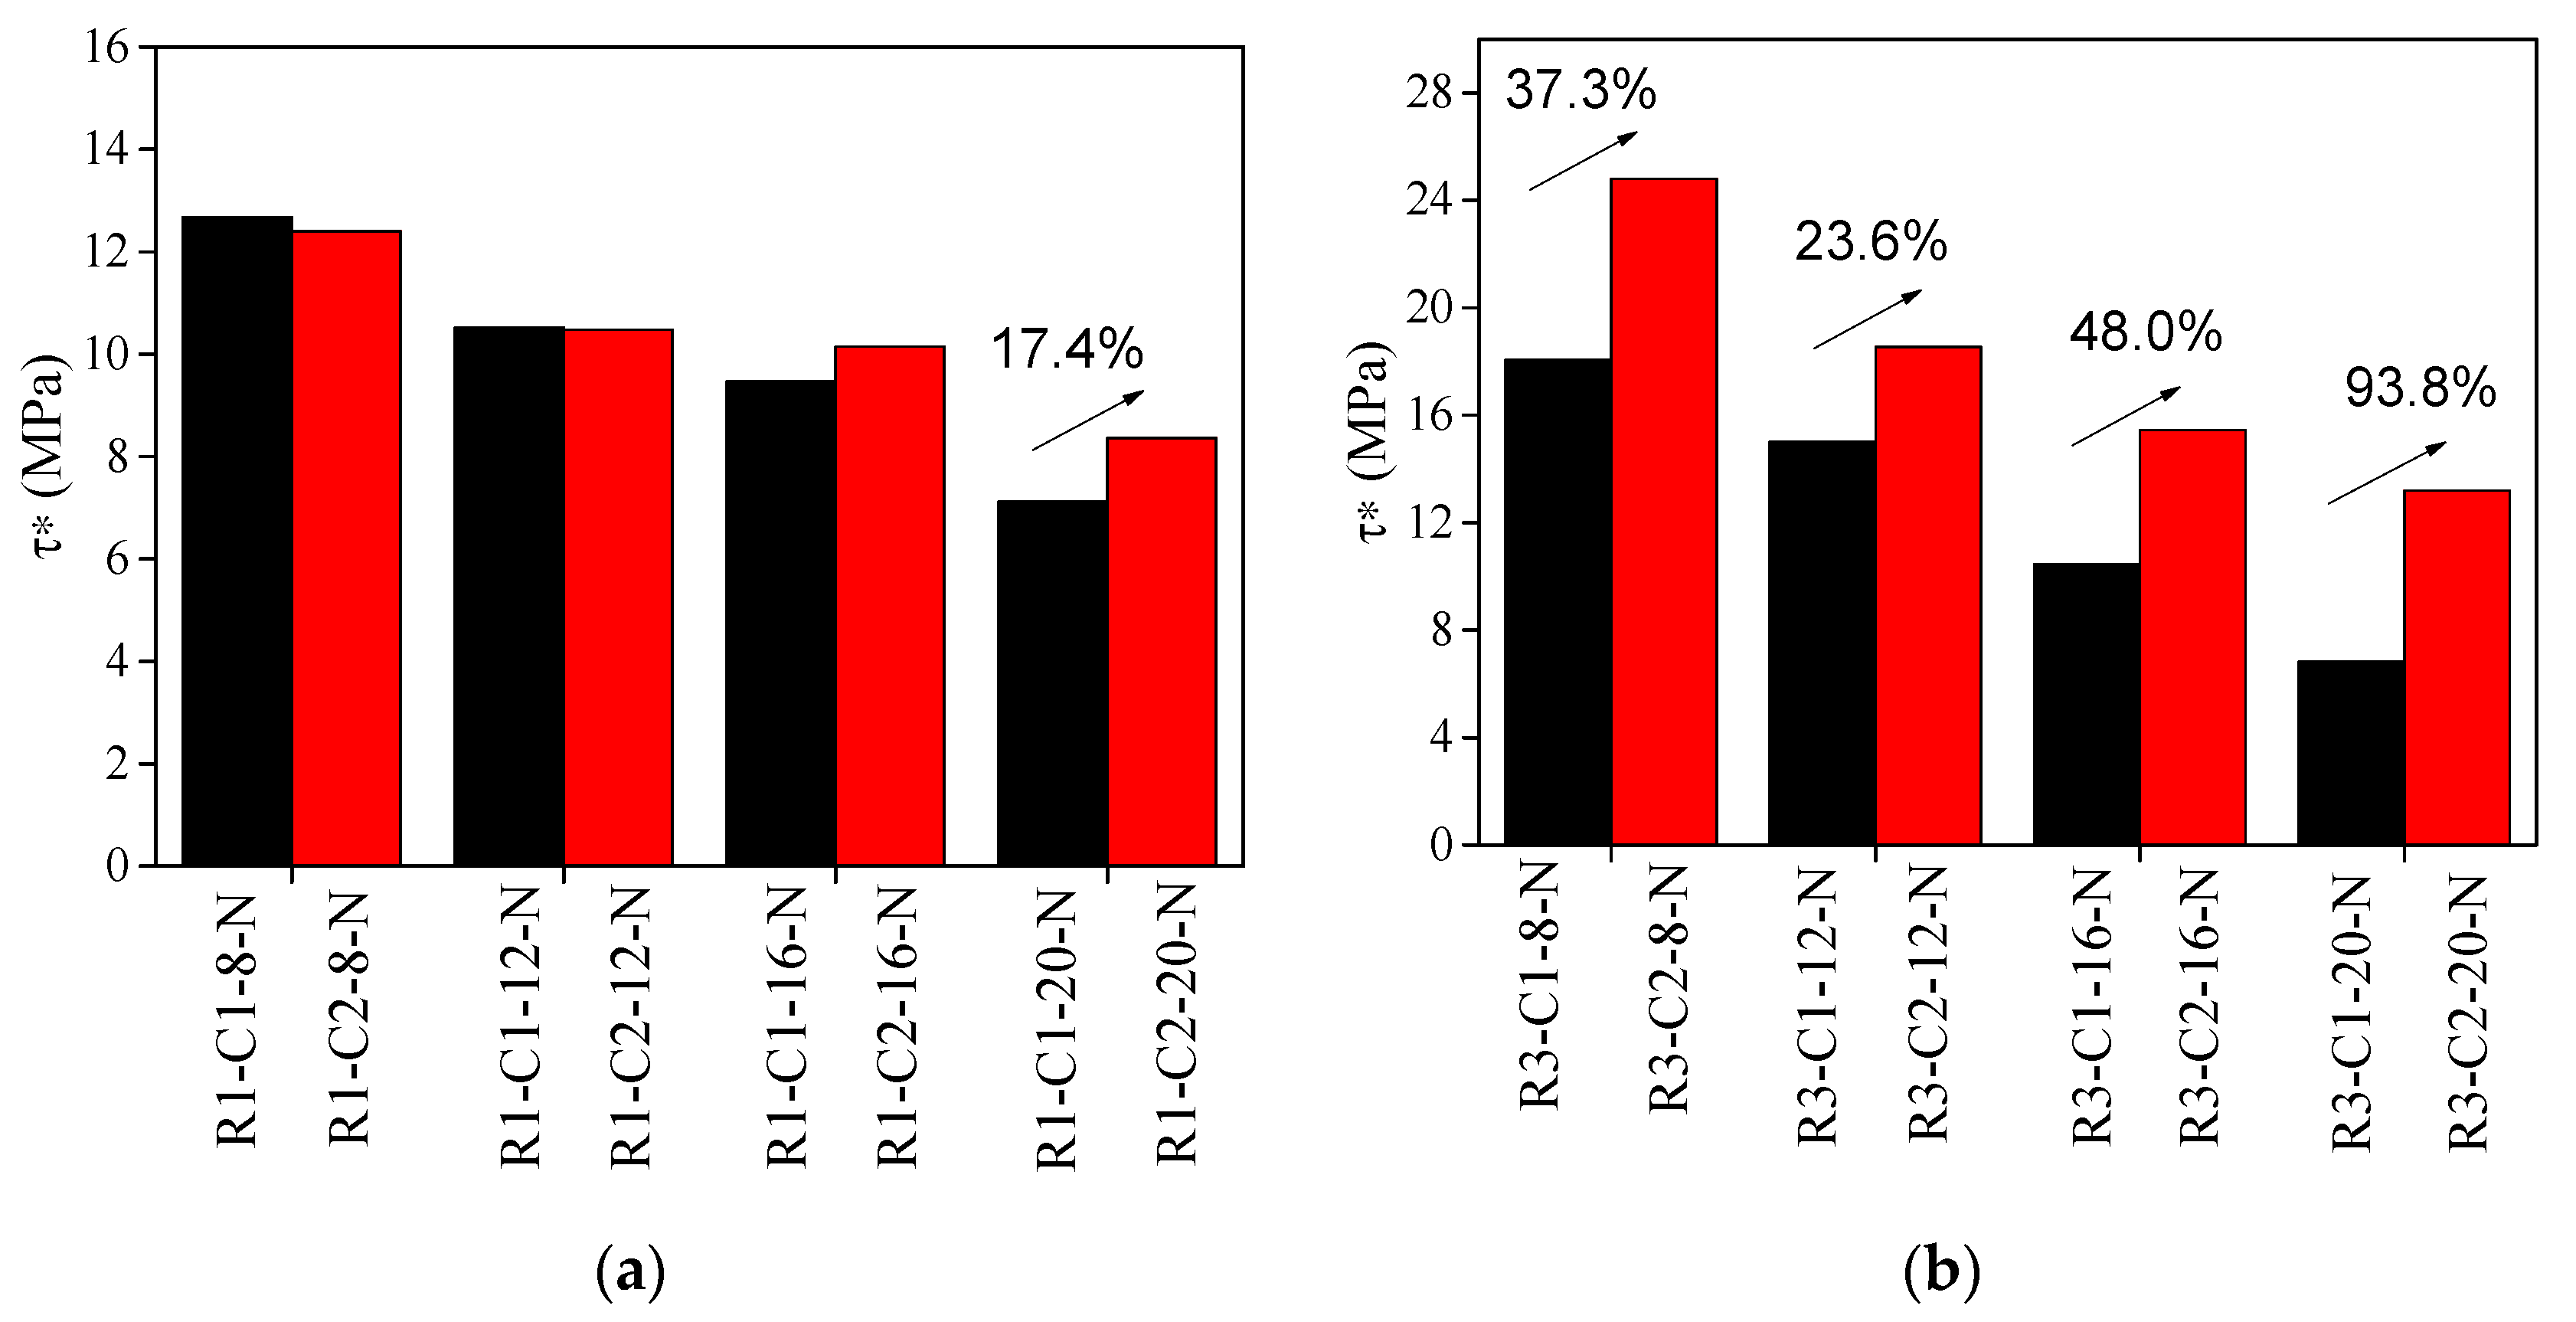
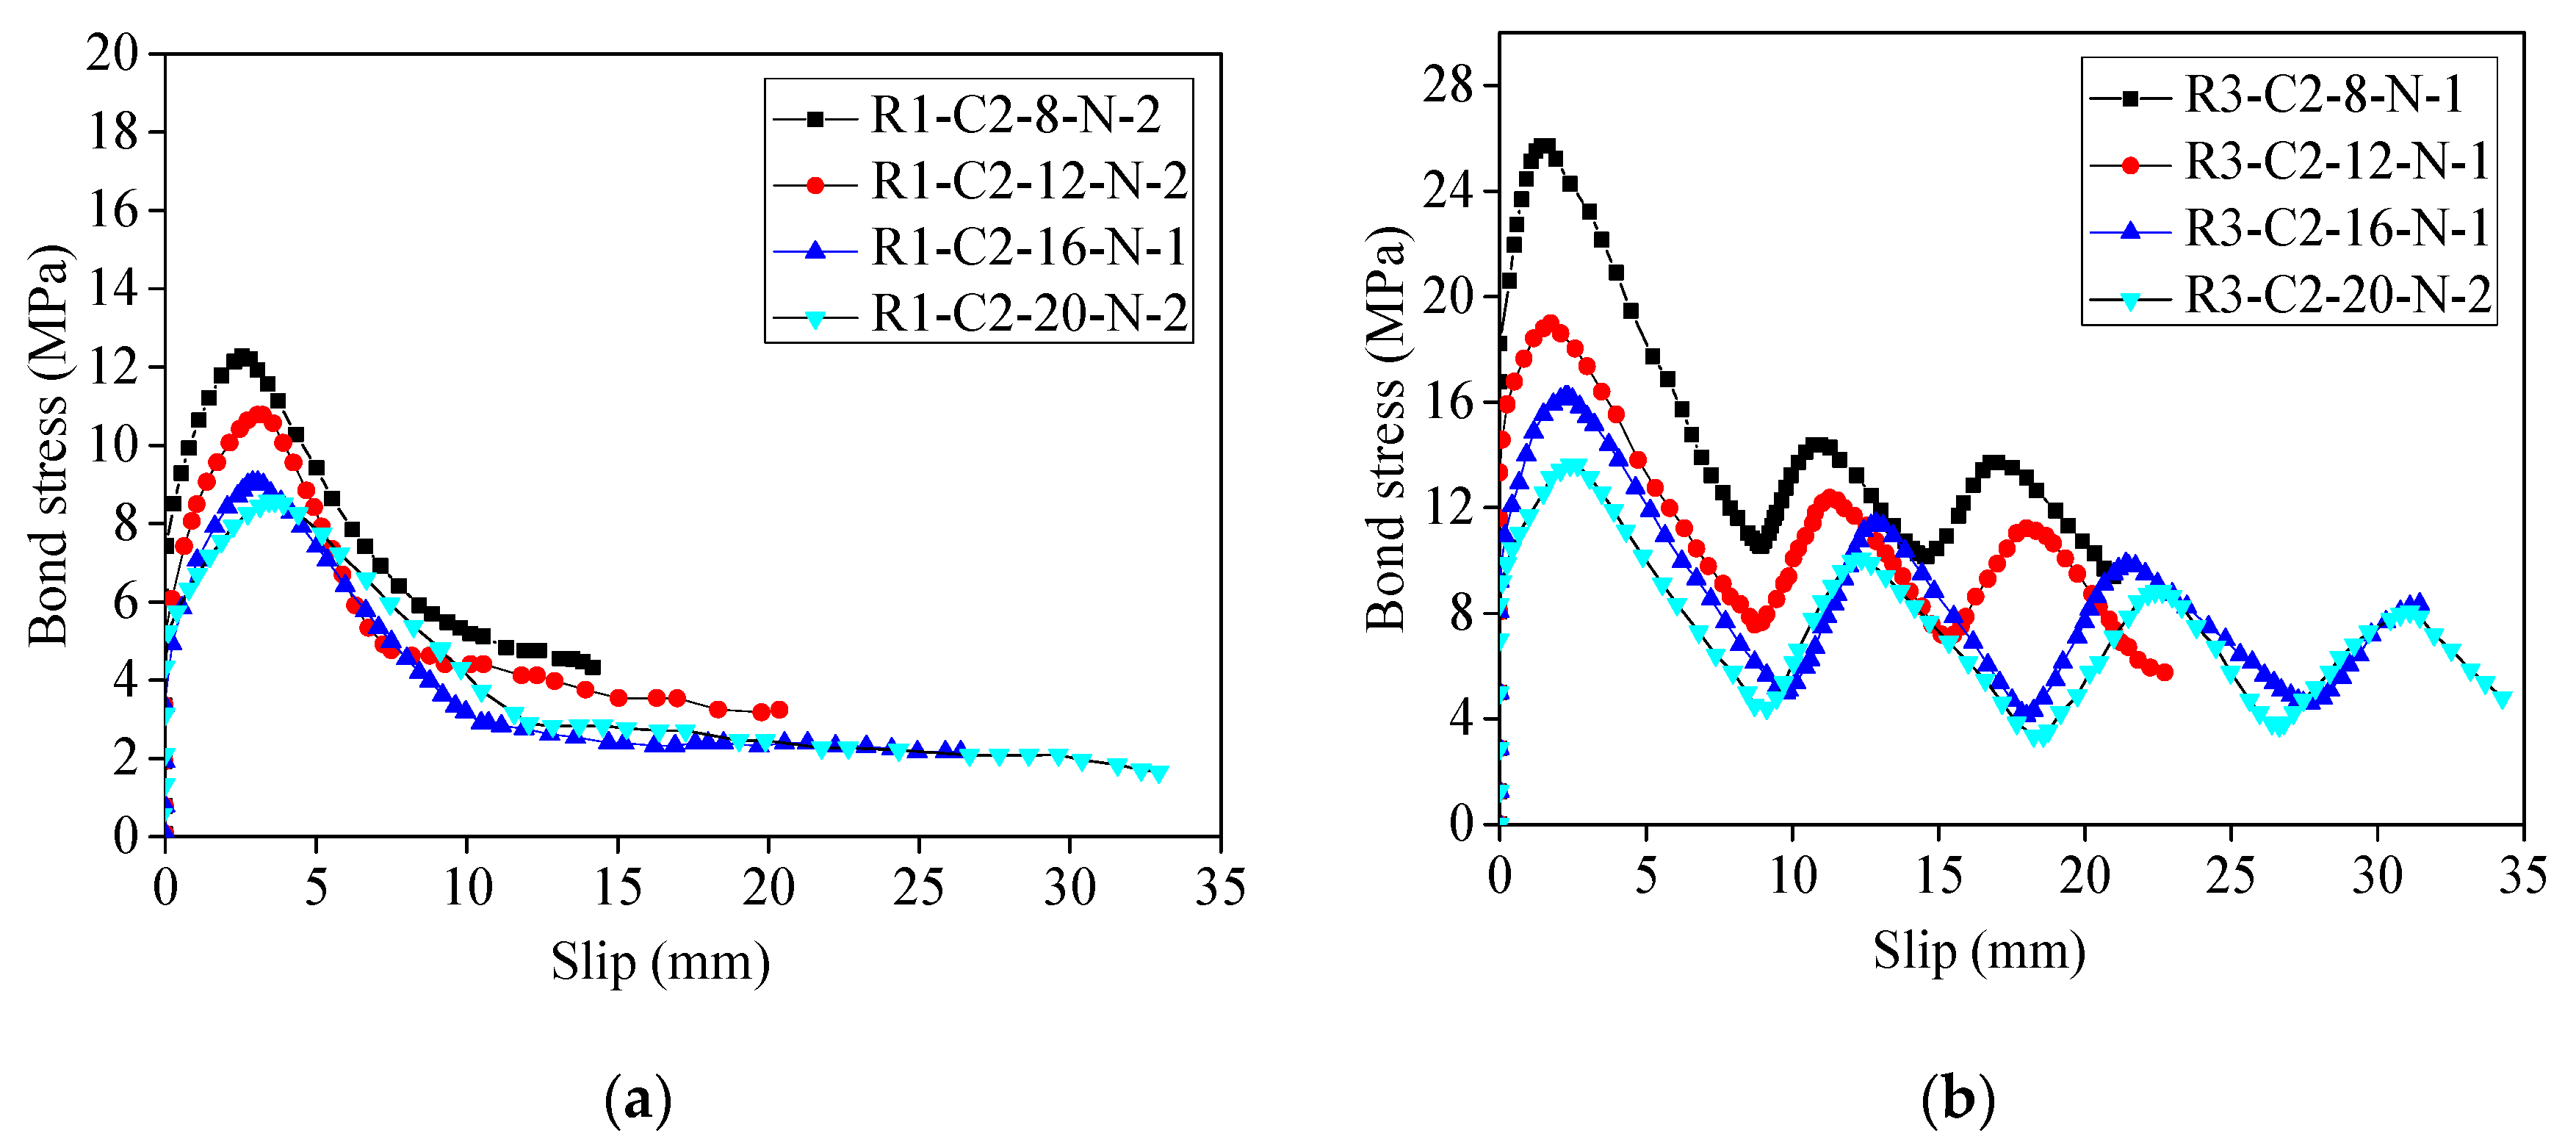
4.3. Influence of Concrete Strength

Research on the bond behavior of steel bars has indicated that, when pullout failure occurs, there is an increase in bond strength of steel bars, along with an enlargement of concrete strength. However, this conclusion is not always applicable in the case of GFRP bars. Figure 11 shows a comparison between the average bond strength of R1 and R3 bars in C1 and C2 concrete without stirrups. With the occurrence of pullout failure, the bond failure interface only transpires at the surface of the R1 bar. When the concrete strength increases from C1 to C2, the average bond strength of specimens R1-C1-8-N, R1-C1-12-N, and R1-C1-16-N becomes essentially akin to that of specimens R1-C2-8-N, R1-C2-12-N, and R1-C2-16-N (Figure 11); the shape of the τ-s curves also appear to be similar (Figure 5a and Figure 9a), which is concordant with the research that was noted in the references [7,9,42,43]. However, the bond failure interface occurs at the surfaces of both the R3 bar and concrete. When the concrete strength increases from C1 to C2, the τ-s curves of specimens R3-C1-8-N and R3-C1-12-N (Figure 7a) appear similar in shape to those that are evident in specimens R3-C2-8-N and R3-C2-12-N (Figure 9b). However, the average bond strength (τ*) increases by 37.3% and 23.6%, respectively (Figure 11). It can be concluded that the bond failure interface takes place in the concrete, and the bond strength of the GFRP bar is directly related to concrete strength. The conclusion is unaffected by stirrups (Figure 5, Figure 7 and Figure 9).
Furthermore, improving the concrete strength can alter the bond failure mode of the GFRP bars. Concrete splitting failure occurred in specimens R1-C1-20-N, R3-C2-16-N, and R3-C2-20-N (Figure 5a and Figure 7a). However, when the concrete strength increased to C2, their failure mode changed into that of a pullout failure (Table 3 and Figure 9), and there were average bond strength increases of 17.4%, 48%, and 93.8%, respectively (Figure 11).

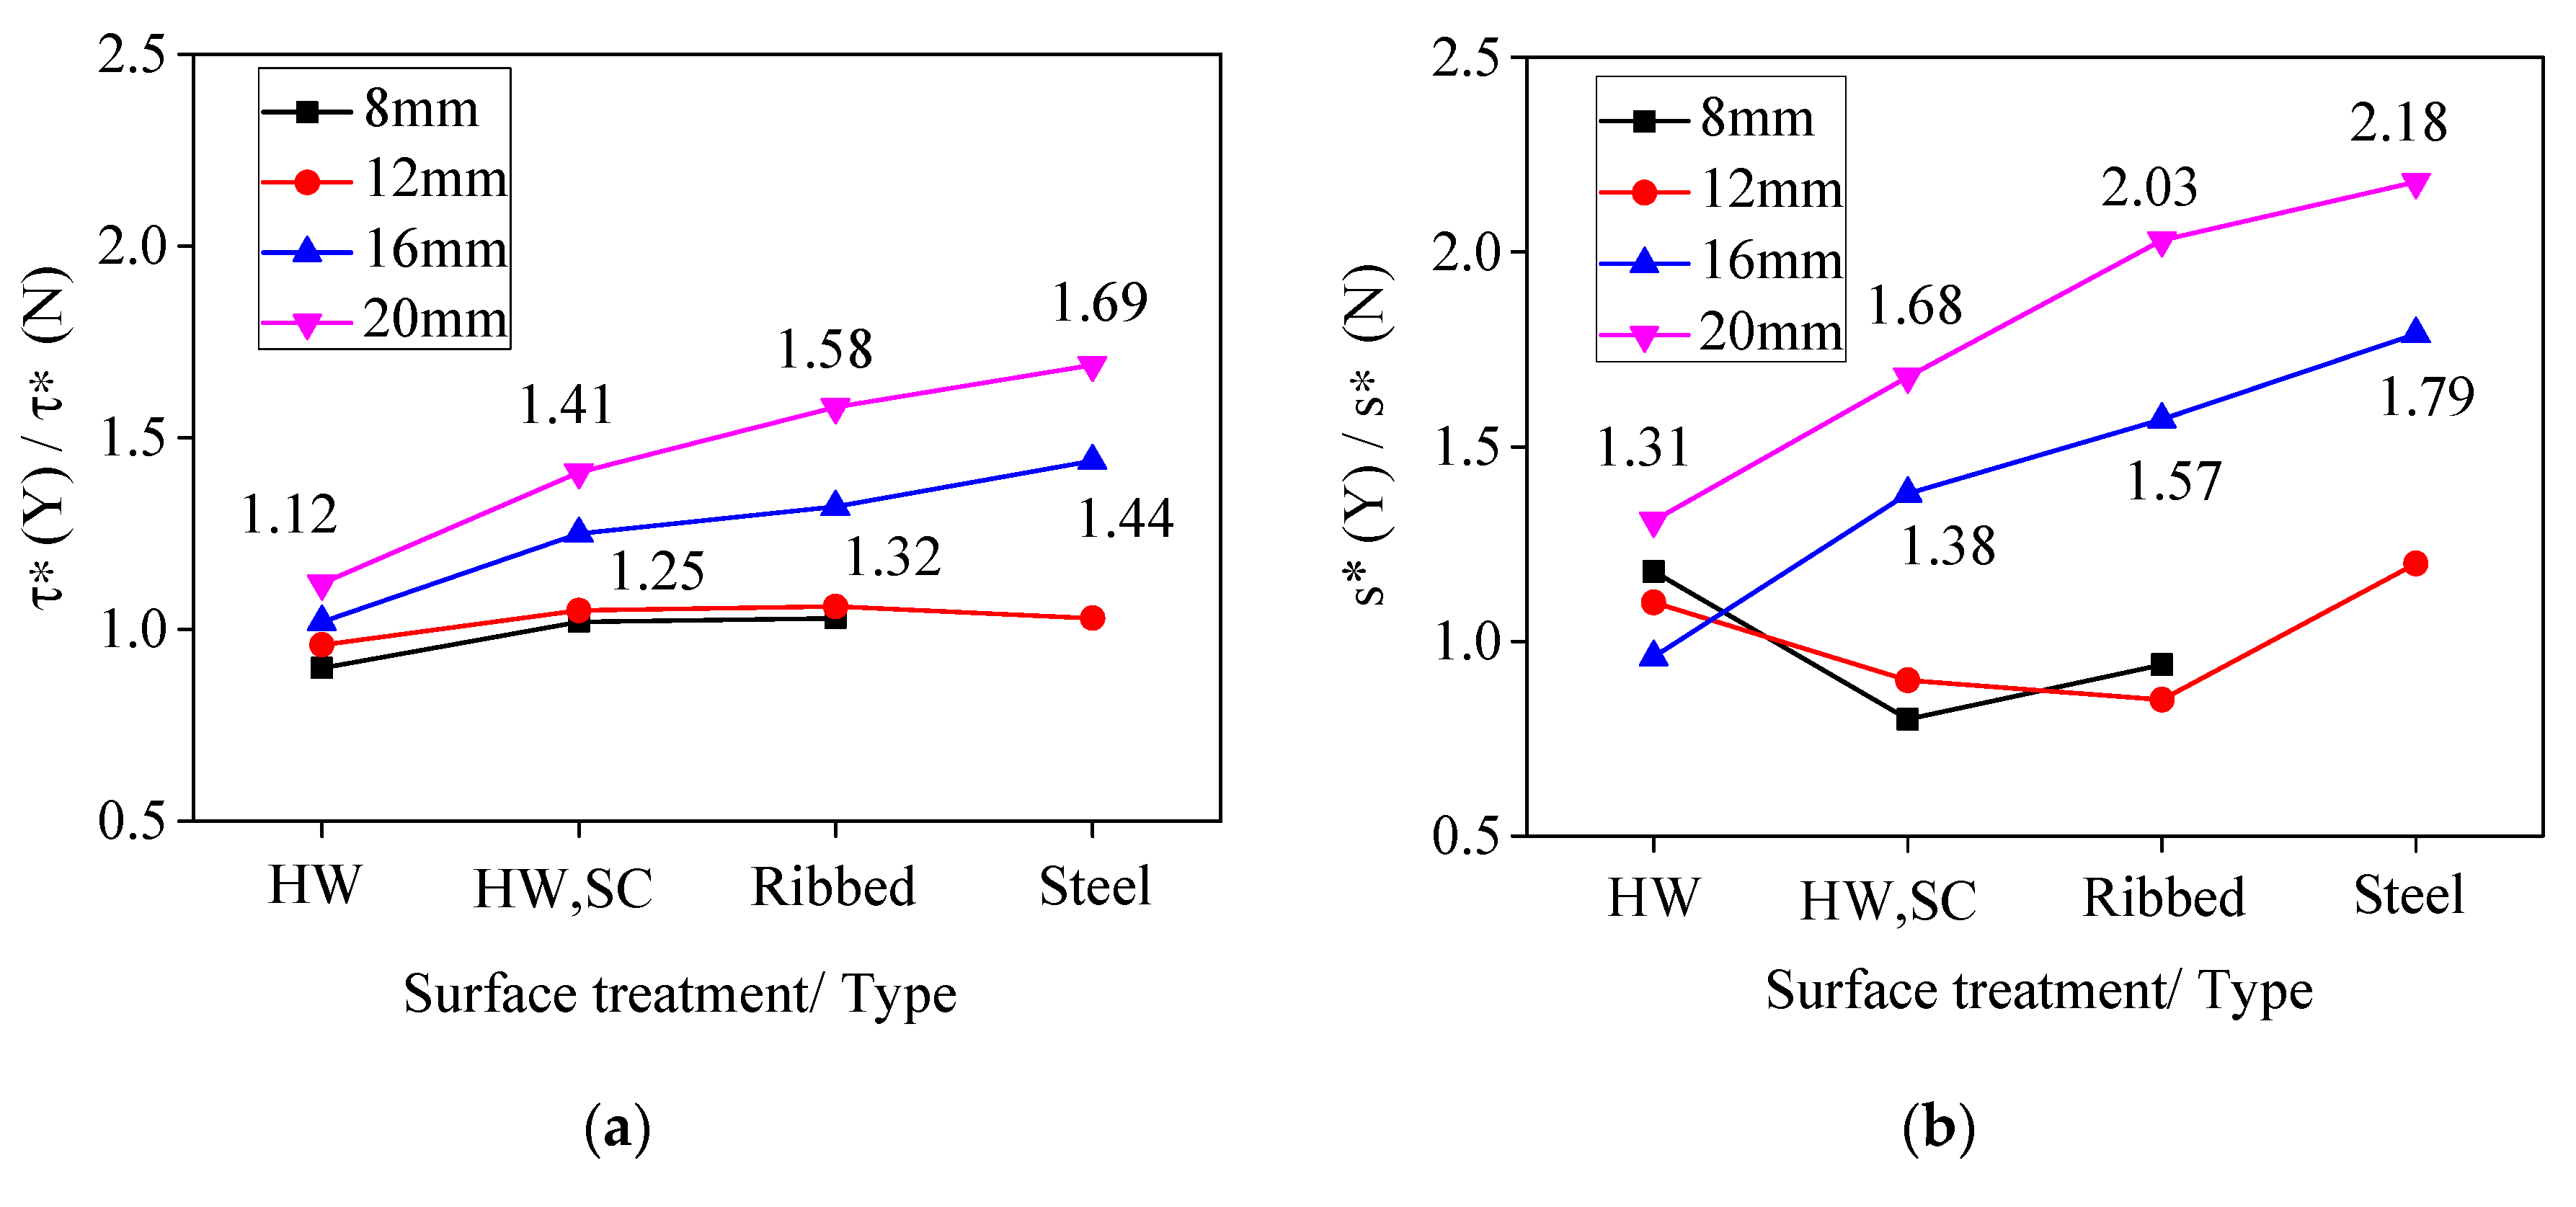
4.4. Influence of the Confined Effect of Stirrups

ACI 408R-03 [35] specifies that stirrups provide confinement to concrete, which not only helps to curtail the occurrence of splitting cracks, but also changes the failure modes and the τ-s relationship, culminating in a relatively higher ductile performance. This thereby increases the bond strength and corresponding slip of steel bars to concrete. This viewpoint is also applicable to the GFRP bars. Figure 12 shows the typical cracking behavior of the specimens. Concrete splitting failure occurred in specimens without stirrups R1-C1-20-N, R2-C1-16-N, R2-C1-20-N, R3-C1-16-N, R3-C1-20-N, R4-C1-16-N, and R4-C1-20-N (Table 3). At the failure point, an abrupt explosive noise was heard, and a penetrating crack appeared on concrete surface at the loading end of these specimens, e.g., R4-C1-20-N-1 (Figure 12a). The average bond strength of these specimens is only related to the diameter, as shown in Table 3. However, the failure modes of their stirrup-containing counterparts changed into pullout failure with many micro-cracks appears on the concrete surface at the loading end e.g., R3-C1-20-Y-2 (Figure 12b). This is with the exception of specimen R4-C1-20-Y. Despite the concrete splitting failure on specimen R4-C1-20-Y, unlike specimen R4-C1-20-N, many penetrating and non-penetrating cracks appeared on the concrete surface at its loaded end, e.g., R4-C1-20-Y-2 (Figure 12c). This phenomenon is also reflected in the research by Darwin and Graham [32] on the bond behavior of steel bars. Largely due to the existence of stirrups, the circumferential pressure of the steel bar to concrete becomes more uniform, resulting in the appearance of more cracks on the concrete surface.
Figure 13 shows the ratio of the average bond strength (τ* (Y) / τ* (N)) and the corresponding average slip (s* (Y) / s* (N)) of the specimens with and without stirrups. It is evident that the τ* and s* of specimens that contain stirrups will be increased if their stirrup-lacking counterparts undergo concrete splitting failure. The larger the diameter of the similar bars, the more evident was the improvement in its performance. Different types of bars ranged in the amount of ostensible improvement, from R1, R2, R3, and R4 bars with same diameter. The τ* (Y) / τ*(N) and s* (Y) / s* (N) values of R2, R3, and R4 bar of the 16mm diameter were 1.25, 1.32, 1.44 and 1.38, 1.57, 1.79, respectively; while the values of R1, R2, R3, and R4 bar of 20mm diameter were 1.12, 1.41, 1.58, 1.69 and 1.31, 1.68, 2.03, 2.18, respectively. This may be because the larger the diameter and bond stress between the bar and concrete, the higher the likelihood of the occurrence of concrete splitting failure, which in turn renders an increase in the confinement of stirrups on concrete.
In addition, no splitting cracks were apparent in specimens that underwent pullout failure. The τ-s curves of specimens with and without stirrups were basically identical (Figure 5, Figure 6, Figure 7 and Figure 8), and the values of τ* (Y) / τ*(N) and s* (Y) / s* (N) are close to 1 (Figure 13). This observation can be reckoned to the work by Malvar [18], who imposed different circumferential constraining forces onto the concrete surface of the pullout specimens. If there was no apparent cracking to the concrete with the GFRP bar pulled out, the different circumferential constraint force did not bear influence upon the bond stress-slip process of the GFRP bar. The same phenomenon was observable in the pullout testing of the R1 and R3 bar in concrete C2, hence Figure 9 only lists τ-s curves of R1 and R3 bars in concrete C2 without stirrups

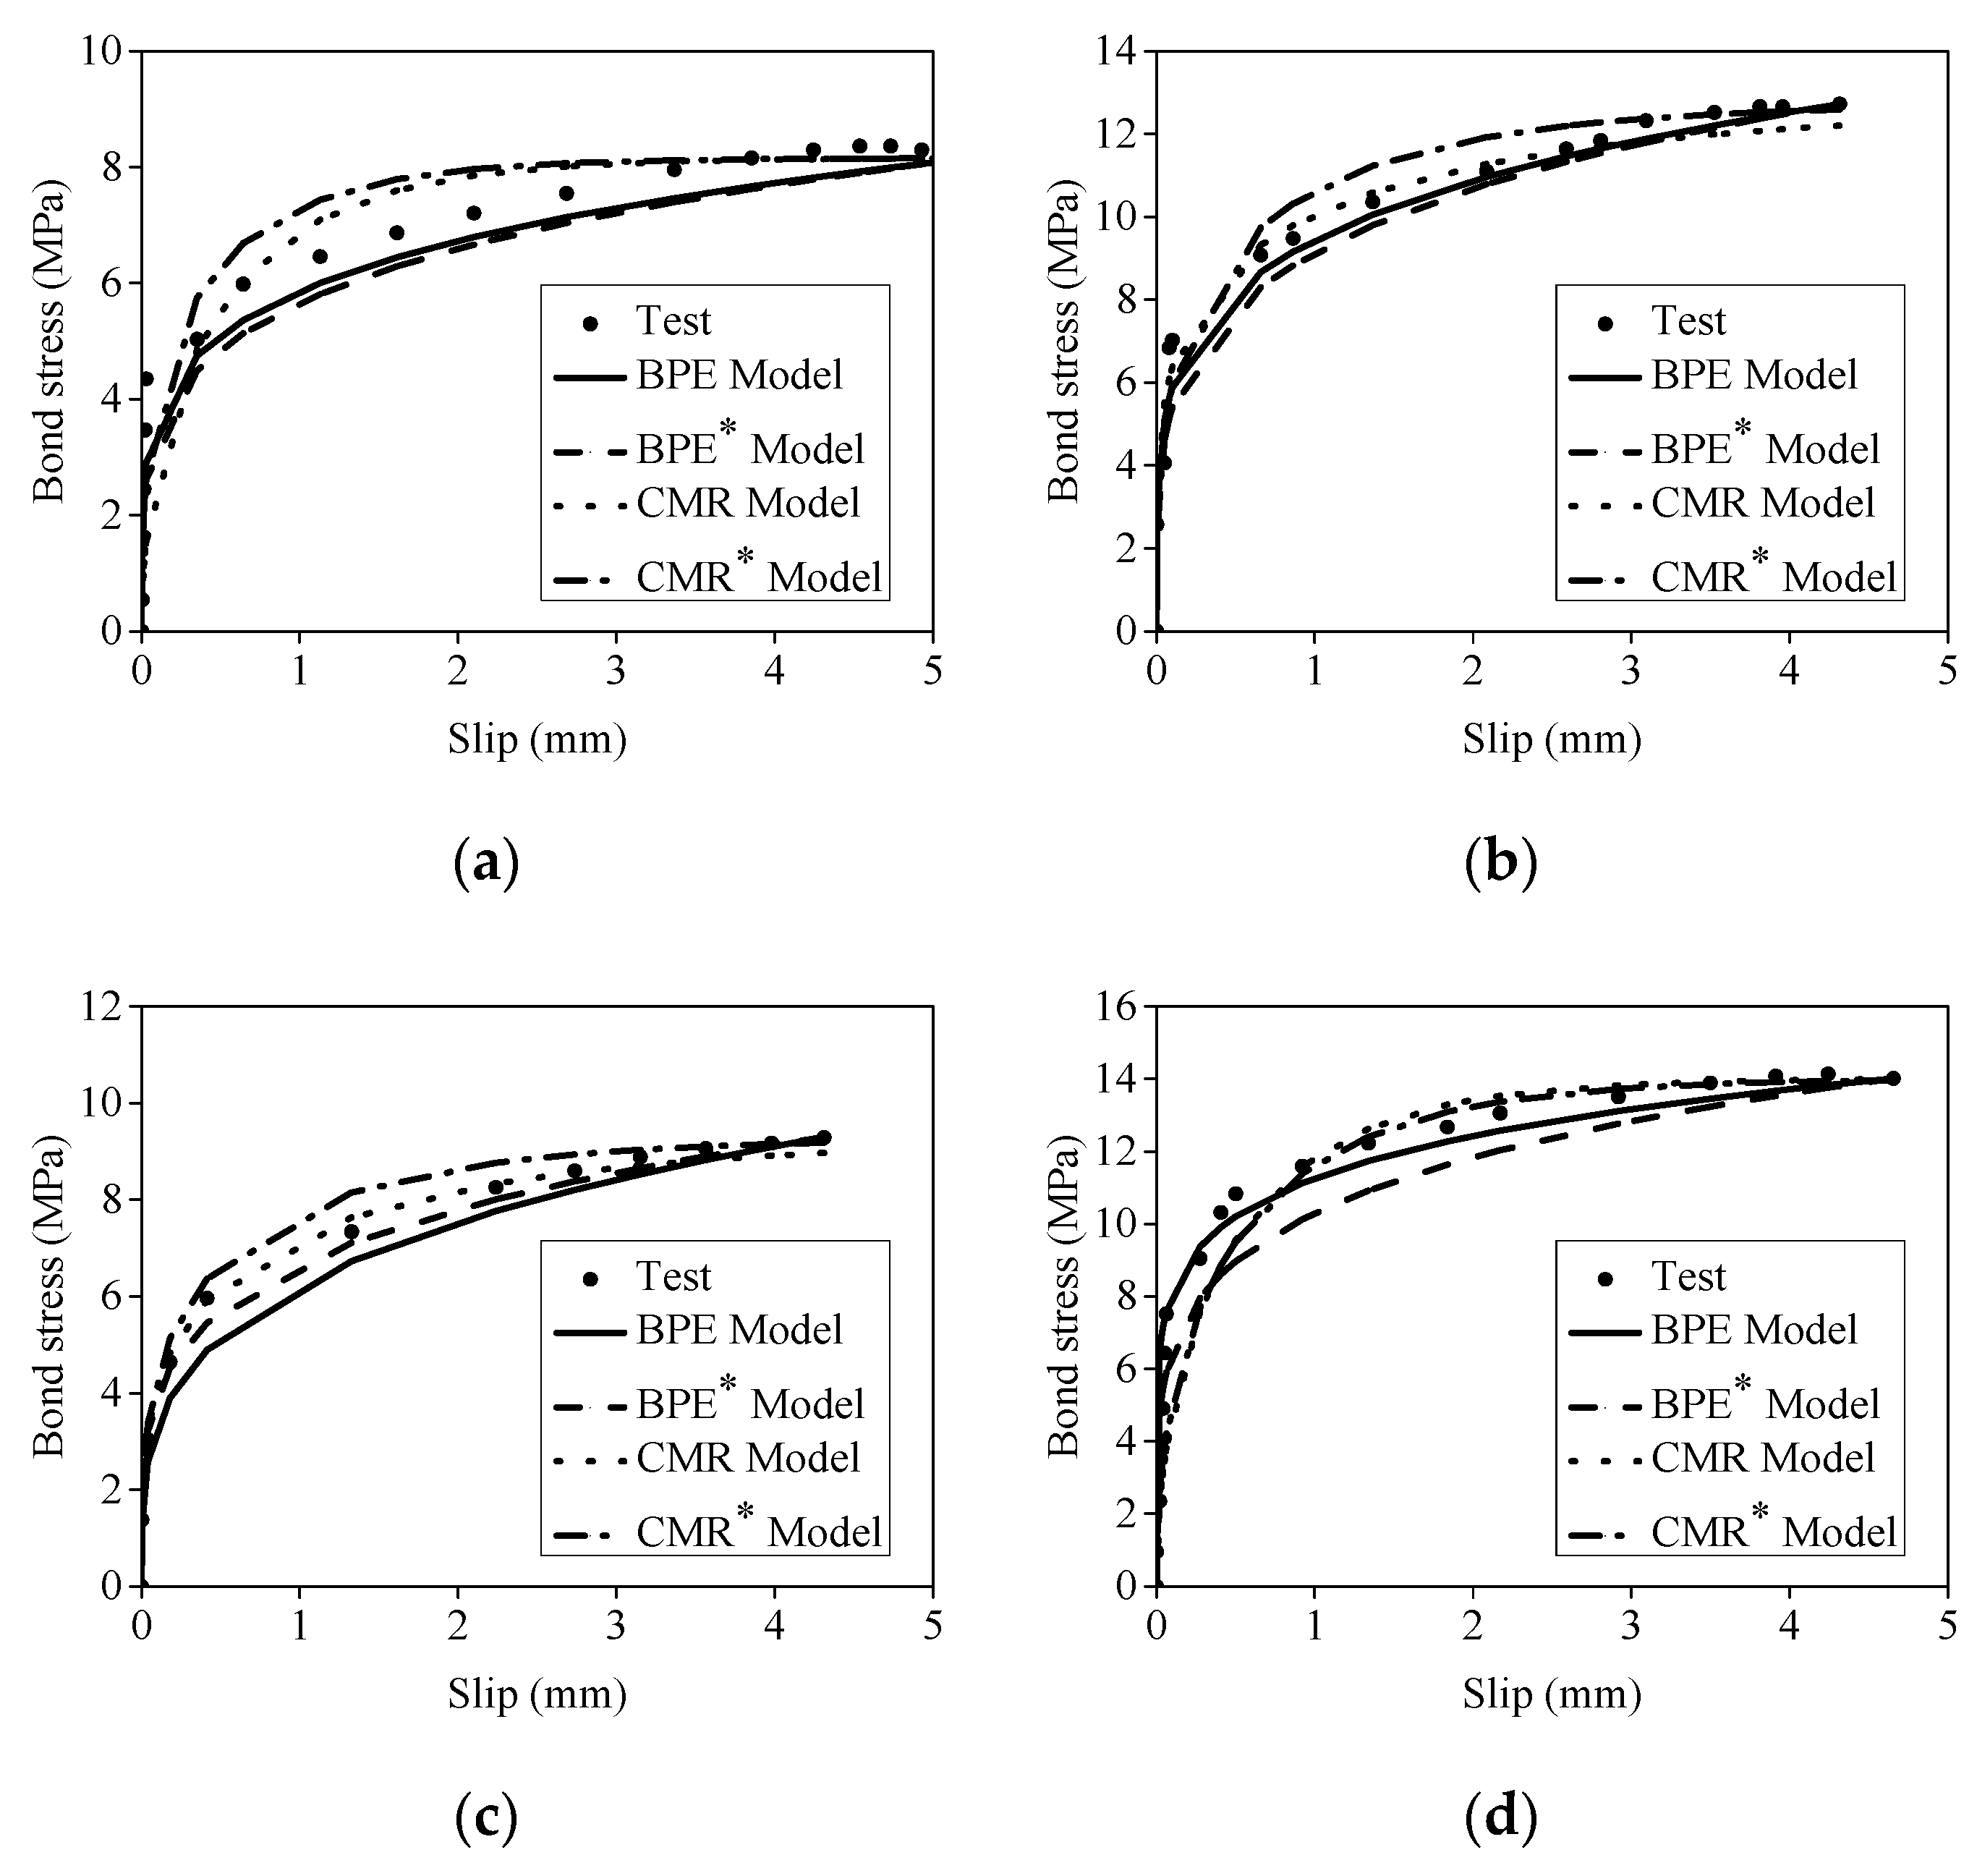
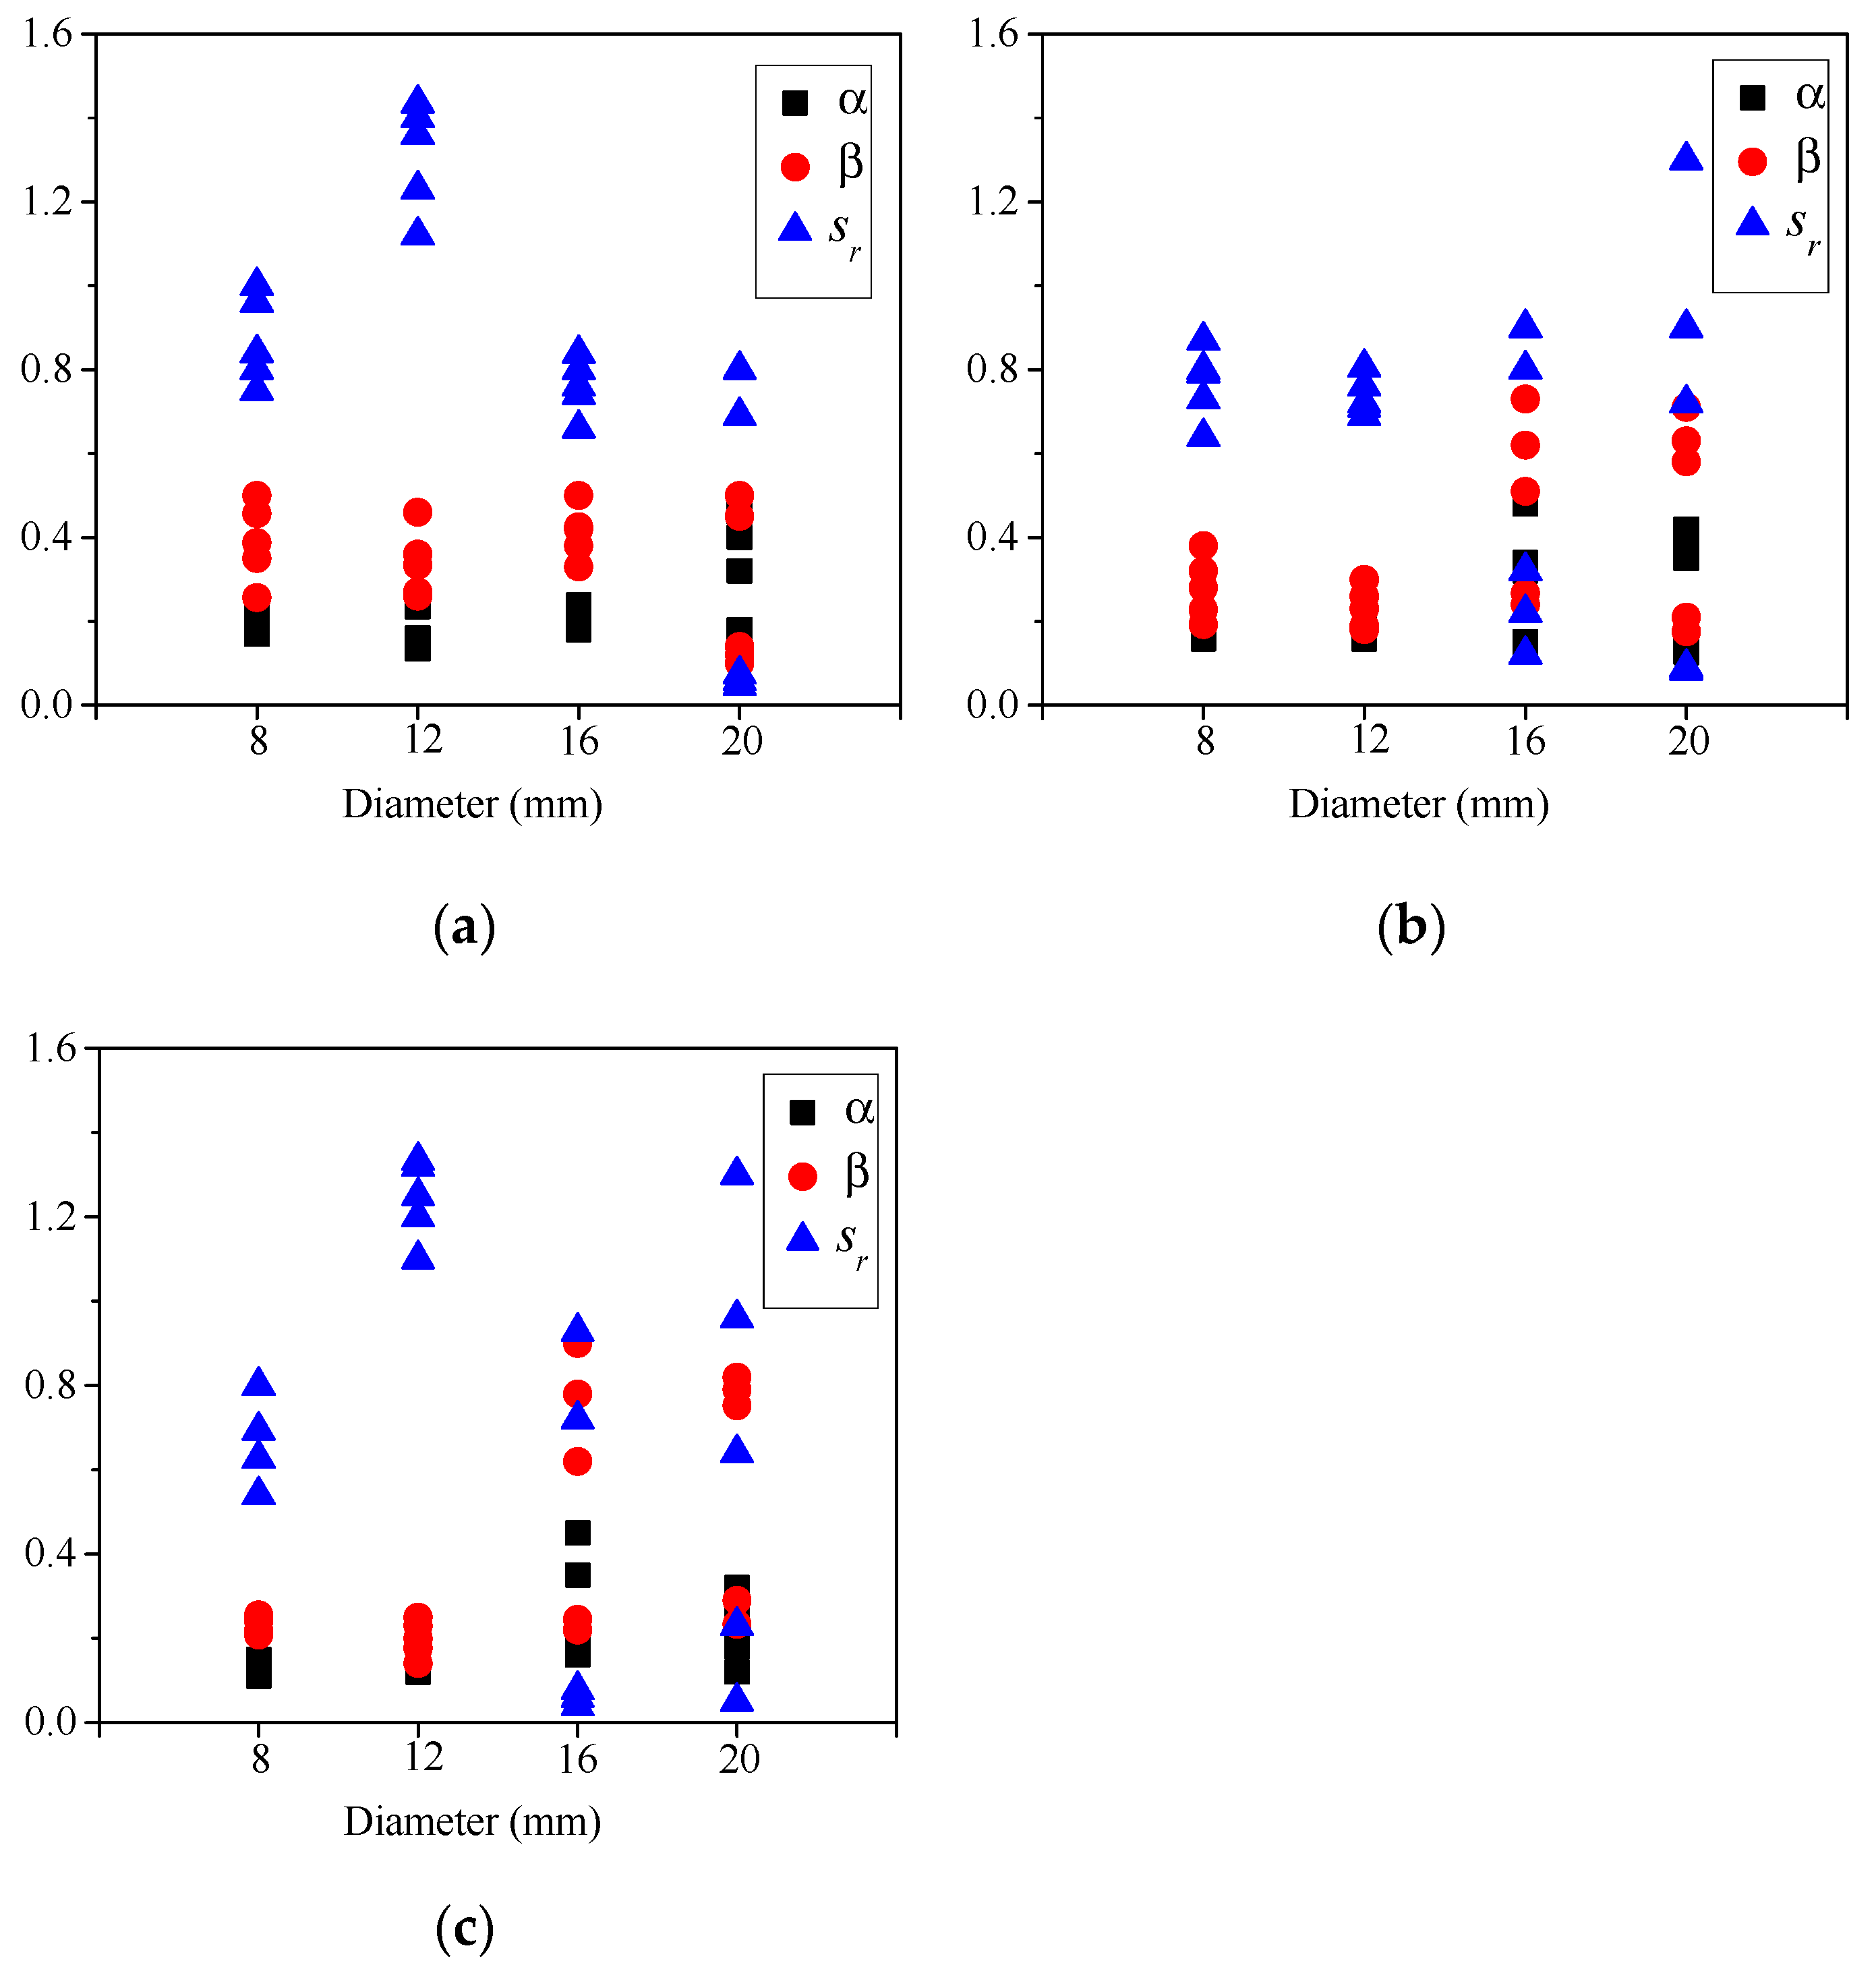
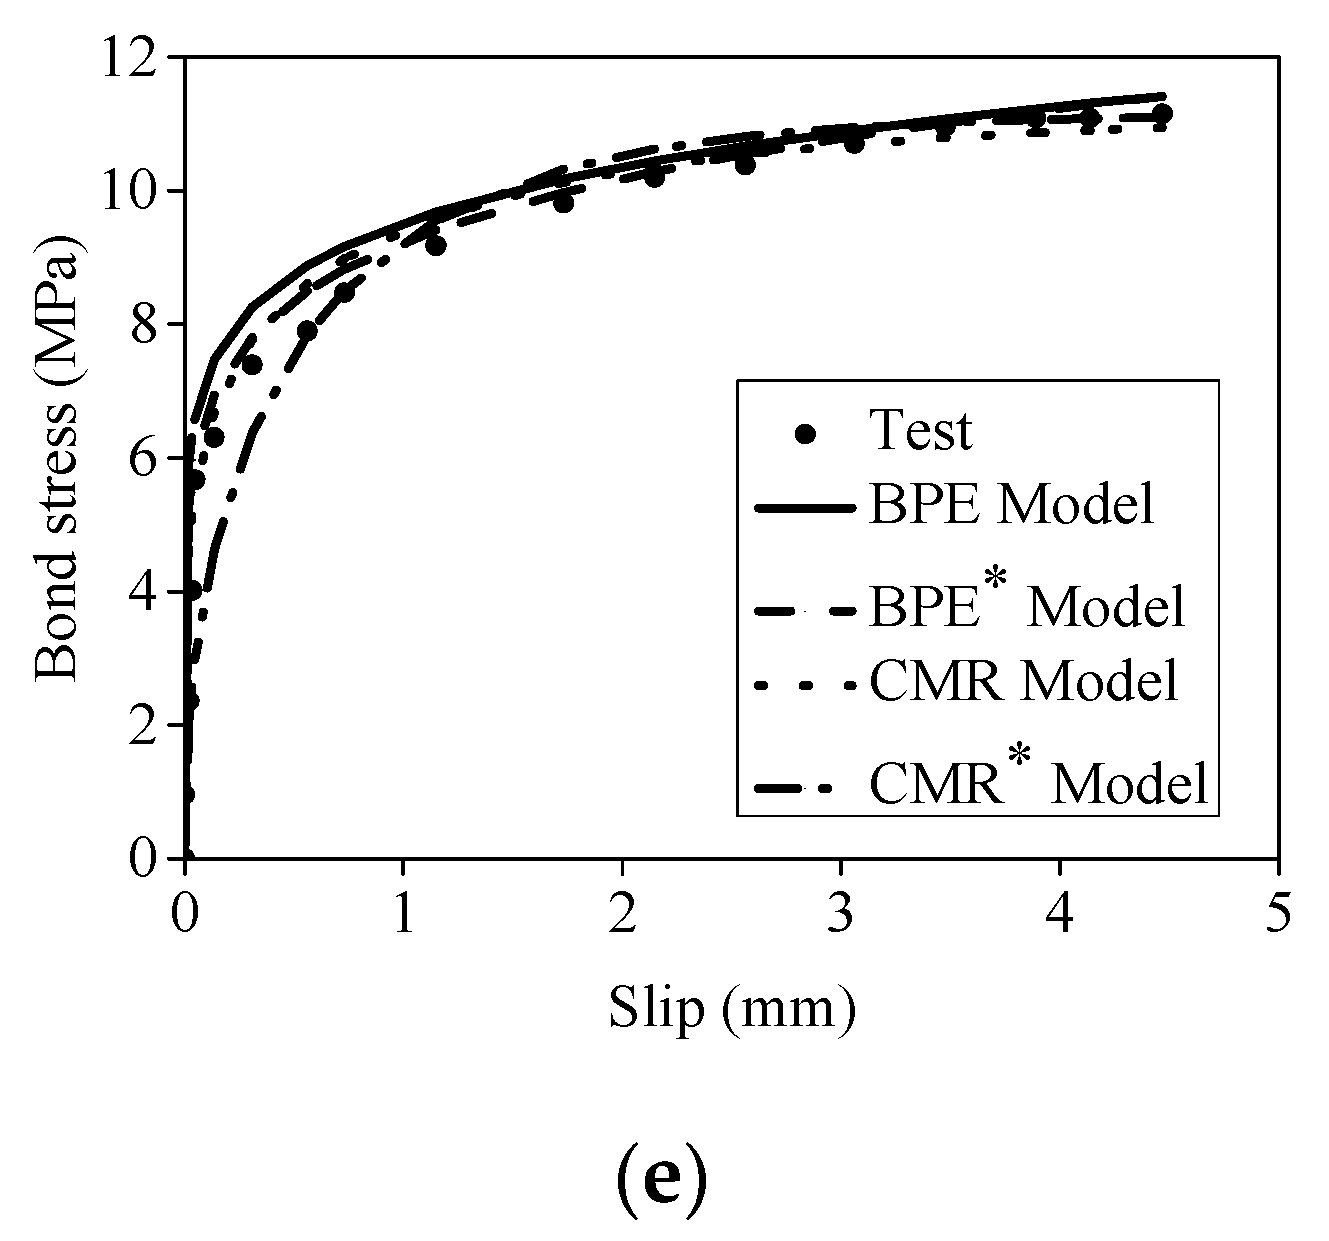
5. Bond Stress-Slip Relationship Model Between GFRP Bar and Stirrup-Confined Concrete

The cracking behavior of RC structures under tension is mainly governed by the relative slip relationship between the bar and the concrete. Moreover, most of structural problems are dealt with at the serviceability limit state. Thus, a refined modeling of the τ-s curve is only needed for the ascending branch (i.e., for slip less than sm) [21]. In previous research, primarily the Malvar model [18], BPE, and CMR models [19,20] are used for the analysis of the bond behavior of FRP bars. When compared with the Malvar model, the BPE model and CMR models are simple and convenient for application [44], thus these two models will be the primary focus in this paper. Equation (2) describes the ascending branch of of the BPE model and the same branch of the CMR model by Equation (3).
τ τ max = ( s s m ) α
τ τ max = ( 1 exp ( s s r ) ) β
where α is the parameter for the BPE model and β sr are the parameters for CMR model, which can be determined from curve fitting of test results.
Many studies indicate that the parameters that were outlined in the BPE and CMR models, as obtained from curve fitting based on experimental data, are affected by the surface characteristics of GFRP bars. Table 4 shows the values of BPE and CMR models parameters that are based on surface characteristics. The values reported in Table 4 also confirm that the trend of the τ-s constitutive law is strongly dependent on the surface characteristics of GFRP bars.
At present, no scholar in this field is yet to study the τ-s model between the GFRP bar and the stirrup-confined concrete. With the results of the pullout tests that were obtained from specimens with C1 strength, curve fitting has been performed utilizing the BPE and CMR models. Figure 14 shows the distribution of fitting parameters α β sr based on different surface characteristics. The high variation in Figure 14 revealed that the values of these parameters in the BPE and CMR models are highly affected by both failure mode and stirrups. The parameters α β sr which were obtained from specimens with stirrups (R1-C1-20-Y, R2-C1-16-Y, R2-C1-20-Y, R3-C1-16-Y, R3-C1-20-Y, R4-C1-16-Y, and R4-C1-20-Y) are ostensibly different to those that were obtained from specimens without stirrups (R1-C1-20-N, R2-C1-16-N, R2-C1-20-N, R3-C1-16-N, R3-C1-20-N, R4-C1-16-N, and R4-C1-20-N) and the specimens that underwent pullout failure (R1-C1-8-N, R1-C1-12-N, R1-C1-16-N, R2-C1-8-N, R2-C1-12-N, R3-C1-8-N, R3-C1-12-N, and R4-C1-12-N).
Figure 15 shows the box plots for parameters α β sr fitted by stirrup-containing specimens test results with regard to specific surface characteristics. Medians of α β sr were obtained as 0.2205, 0.3468, and 0.775 for R1bars, 0.2501, 0.445, 0.715 for R2 bars, 0.18, 0.635, 0.72 for R3 bars. Comparisons between the experimental and analytical τ-s curves are shown in Figure 16. The analytical curves that were obtained by using the parameters fitted to its experimental counterpart are represented by BPE and CMR models, and the analytical curves obtained by using the medians of parameter are represented by BPE* and CMR* Models. It is clear that the curves of the BPE and CMR models fitted to their experimental counterpart are in good agreement with the experimental curve, whereas the curve that was obtained via the obtained medians indicates slightly lower bond stress than the experimental results for the BPE model, and a slightly higher bond stress for CMR model, as shown Figure 16. This is indicative that the BPE model and CMR model can be used to investigated the τ-s process of GFRP bar and stirrups-confined concrete, and furthermore that the obtained medians α β sr are able to serve as the proposed values for engineering design. Certainly, without experimental data, it is necessary to have methods of theoretical derivation for the calculation of bond strength and the corresponding slip, in order to obtain the complete τ-s relationship curve between the GFRP bar and stirrups-confined concrete.

6. Conclusions

A total of 100 pullout tests were carried out in this paper in order to examine the bond behavior of the GFRP bars in concrete. Based on the results of this experimental and analytical study, the following conclusions may be drawn:
(1) The surface characteristics of the bar influence the bond behavior of GFRP bars. In the tests, the bond stress collapse of GFRP bars with surface of helical wrapping (R1) and helical wrapping and sand coating (R2) was due to the detachment of fiber spirals, the resin layer, and sand grains; the bond strength of these GFRP bars was governed by the fiction between the GFRP bar and the concrete. However, the bond stress collapse that is evident in the GFRP bars with a ribbed surface (R3) was due to the crushing of concrete and the shearing off of ribs. The bond strength of these GFRP bars was governed by the interlocking interaction between the GFRP bar and the concrete. Therefore, the R3 bars exhibit higher bond strength than that of both the R1 and R3 bars. The average bond strength of R3 bars is 1.3–1.5 times that of R1 bars and 1.2–1.36 times that of R2 bars. However, it is notable that the bond strength of the specimens that displayed concrete splitting failure is not affected by the surface characteristics of the GFRP bar.
(2) The test results confirmed the notion that larger bar diameters develop lower bond strength. This tendency is not influenced by the surface characteristics of the GFRP bar, concrete strength, or the confined effect of stirrups.
(3) The improvement of concrete strength does not necessarily render an increase in the bond strength of the GFRP bars. When bond failure interface only occurs on the surface of a GFRP bar, the bond strength of a GFRP bar is not dependent upon the concrete strength. However, when a bond failure interface coexists on the surface of a GFRP bar and the concrete, an enhancement of concrete strength is able to effectively increase the bond strength of a GFRP bar. As a result, in the design of a GFRP-RC structure, an appropriate concrete strength should be selected according to the surface of the GFRP bar.
(4) Stirrups provide confinement to concrete, which in turn changes the failure modes and the τ-s relationship of the pullout specimens. If concrete splitting failure occurs in specimens without stirrups, their stirrup-containing counterparts have a tendency to exhibit pullout failure, leading to an increase in the bond strength and the corresponding slip observable in the specimens. The level of improvement ranges depending on the amount of increase of the diameter of the GFRP bar, and the bond stress between the GFRP bar and the concrete. As opposed to the beam test, the concrete was not subjected to bending stress during the pullout testing. No sign of splitting cracks was evident on these specimens due to the relatively small diameter of the bars in comparison to the dimensions of the specimens or the relatively high concrete strength. The bond behavior of these specimens was almost completely unaffected by the presence of stirrups. As a result, further research into the subject of the beam testing of GFRP bars should be taken into consideration in the presence of stirrups.
(5) The BPE model and the CMR model have relatively simple form and reliable results that can be applied to investigate τ-s relationship of GFRP bars to stirrups-confined concrete. The fitting parameters, α β sr, specified in these two models, were generated based on the test results of this paper, and the suggested parameter values that were classified based on surface characteristics were proposed. However, there are no universal analytical models that can be applicable to the general τ-s relationship of GFRP bar to stirrups-confined concrete. As a result, the universal analytical τ-s model of GFRP bar to stirrups-confined concrete should be further studied based on more test data.

Author Contributions

J.T. and K.G. conceived and designed the experiments; K.G., Z.L., J.Z. performed the experiments; X.L. is in charge of project administration; All authors participated in data analysis and paper writing.

Funding

The research presented in this paper is part of Project (2016CFA020) supported by Natural Science Foundation of Hubei Province, Project (2014BAB15B01) supported by National Twelfth Five-Year’ Plan for Science & Technology Support Development Programme of China, and the Project (DQJJ201707) supported by programme of Hubei Key Laboratory of Roadway Bridge and Structure Engineering in Wuhan University of Technology

Acknowledgments

Thank you to the teachers in Hubei Key Laboratory of Roadway Bridge & Structure Engineering, Wuhan University of Technology for their help in our experiments.

Conflicts of Interest

The authors declare no conflict of interest.

References

  1. Kassem, C.; Farghaly, A.S.; Benmokrane, B. Evaluation of flexural behavior and serviceability performance of concrete beams reinforced with frp bars. J. Compos. Constr. 2011, 15, 682–695. [Google Scholar] [CrossRef]
  2. Ali, M.A.; El-Salakawy, E. Seismic Performance of GFRP-Reinforced Concrete Rectangular Columns. J. Compos. Constr. 2016, 20, 04015074. [Google Scholar] [CrossRef]
  3. Mady, M.; El-Ragaby, A.; El-Salakawy, E. Seismic behavior of beam-column joints reinforced with gfrp bars and stirrups. J. Compos. Constr. 2011, 15, 875–886. [Google Scholar] [CrossRef]
  4. Sebastian, W.M.; Vincent, J.; Starkey, S. Experimental characterization of load responses to failure of a RC frame and an NSM CFRP RC frame. Constr. Build. Mater. 2013, 49, 962–973. [Google Scholar] [CrossRef]
  5. Achillides, Z.; Pilakoutas, K. Bond behavior of fiber reinforced polymer bars under direct pullout conditions. J. Compos. Constr. 2004, 8, 173–181. [Google Scholar] [CrossRef]
  6. Okelo, R.; Yuan, R.L. Bond strength of fiber reinforced polymer rebars in normal strength concrete. J. Compos. Constr. 2005, 9, 203–213. [Google Scholar] [CrossRef]
  7. Lee, J.Y.; Kim, T.Y.; Kim, T.J.; Yi, C.K.; Park, J.S.; You, Y.C.; Park, Y.H. Interfacial bond strength of glass fiber reinforced polymer bars in high-strength concrete. Compos. Part B Eng. 2008, 39, 258–270. [Google Scholar] [CrossRef]
  8. Aiello, M.A.; Leone, M.; Pecce, M. Bond performances of frp rebars-reinforced concrete. J. Mater. Civ. Eng. 2007, 19, 205–213. [Google Scholar] [CrossRef]
  9. Baena, M.; Torres, L.; Turon, A.; Barris, C. Experimental study of bond behavior between concrete and FRP bars using a pull-out test. Compos. Part B Eng. 2009, 40, 784–797. [Google Scholar] [CrossRef]
  10. Hao, Q.; Wang, Y.; He, Z.; Ou, J. Bond strength of glass fiber reinforced polymer ribbed rebars in normal strength concrete. Constr. Build. Mater. 2009, 23, 865–871. [Google Scholar] [CrossRef]
  11. Davalos, J.F.; Chen, Y.; Ray, I. Effect of frp bar degradation on interface bond with high strength concrete. Cement Concrete Compos. 2008, 30, 722–730. [Google Scholar] [CrossRef]
  12. Fava, G.; Carvelli, V.; Pisani, M.A. Remarks on bond of GFRP rebars and concrete. Compos. Part B Eng. 2016, 93, 210–220. [Google Scholar] [CrossRef]
  13. Kim, B.; Doh, J.H.; Yi, C.K.; Lee, J.Y. Effects of structural fibers on bonding mechanism changes in interface between GFRP bar and concrete. Compos. Part B Eng. 2013, 45, 768–779. [Google Scholar] [CrossRef]
  14. Li, W.; Ho, S.C.M.; Patil, D.; Song, G. Acoustic emission monitoring and finite element analysis of debonding in fiber-reinforced polymer rebar reinforced concrete. Struct. Health Monit. 2017, 16, 674–681. [Google Scholar] [CrossRef]
  15. Kai, X.; Changchun, R.; Qingshan, D.; Qingping, J.; Xuemin, C. Real-time monitoring of bond slip between gfrp bar and concrete structure using piezoceramic transducer-enabled active sensing. Sensors 2018, 18, 2653. [Google Scholar]
  16. Li, W.; Fan, S.; Ho, S.C.M.; Wu, J.; Song, G. Interfacial debonding detection in fiber-reinforced polymer rebar–reinforced concrete using electro-mechanical impedance technique. Struct. Health Monit. 2018, 17, 461–471. [Google Scholar] [CrossRef]
  17. Jiang, T.; Kong, Q.; Patil, D.; Luo, Z.; Huo, L.; Song, G. Detection of debonding between fiber reinforced polymer bar and concrete structure using piezoceramic transducers and wavelet packet analysis. IEEE Sens. J. 2017, 17, 1992–1998. [Google Scholar] [CrossRef]
  18. Malvar, L.J. Bond Stress-Slip Characteristics of FRP Rebars; (No. NFESC-TR-2013-SHR); Naval Facilities Engineering Service Center: Port Hueneme, CA, USA, 1994. [Google Scholar]
  19. Eligehausen, R.; Popov, E.P.; Bertero, V.V. Local Bond Stress-Slip Relationships of Deformed Bars under Generalized Excitations; Report No. 83/23; Earthquake Engineering Service Center, University of California: Berkeley, CA, USA, 1983. [Google Scholar]
  20. Cosenza, E.; Manfredi, G.; Realfonzo, R. Analytical modelling of bond between frp reinforcing bars and concrete. In Non-Metallic (FRP) Reinforcement for Concrete Structures: Proceedings of the Second International RILEM Symposium; RC Press: London, England, 1995; Volume 29, p. 164. [Google Scholar]
  21. Cosenza, E.; Manfredi, G.; Realfonzo, R. Behavior and modeling of bond of FRP rebars to concrete. J. Compos. Constr. 1997, 1, 40–51. [Google Scholar] [CrossRef]
  22. Lin, X.; Zhang, Y.X. Evaluation of bond stress-slip models for FRP reinforcing bars in concrete. Comput. Struct. 2014, 107, 131–141. [Google Scholar] [CrossRef]
  23. Pepe, M.; Mazaheripour, H.; Barros, J.; Sena-Cruz, J.; Martinelli, E. Numerical calibration of bond law for gfrp bars embedded in steel fibre-reinforced self-compacting concrete. Compos. Part B Eng. 2013, 50, 403–412. [Google Scholar] [CrossRef]
  24. Yoo, D.Y.; Kwon, K.Y.; Park, J.J.; Yoon, Y.S. Local bond-slip response of GFRP rebar in ultra-high-performance fiber-reinforced concrete. Comput. Struct. 2015, 120, 53–64. [Google Scholar] [CrossRef]
  25. Masmoudi, A.; Masmoudi, R.; Ouezdou, M.B. Thermal effects on gfrp rebars experimental study and analytical analysis. Mater. Struct. 2010, 43, 775–788. [Google Scholar] [CrossRef]
  26. Long, W.J.; Khayat, K.; Lemieux, G.; Hwang, S.D.; Xing, F. Pull-out strength and bond behavior of prestressing strands in prestressed self-consolidating concrete. Materials 2014, 7, 6930–6946. [Google Scholar] [CrossRef]
  27. Zhang, H.; Yu, R. Inclined fiber pullout from a cementitious matrix: A numerical study. Materials 2016, 9, 800. [Google Scholar] [CrossRef] [PubMed]
  28. ACI 440.1R-06. Guide for the Design and Construction of Concrete Reinforced with FRP Bars; ACI Committee 440, American Concrete Institute: Farmington Hills, MI, USA, 2006. [Google Scholar]
  29. CAN/CSA S806-02. Design and Construction of Building Components with Fibre-Reinforced Polymers; Canadian Standards Association: Rexdale, ON, Canada, 2002. [Google Scholar]
  30. CSA S6-06. Canadian Highway Bridge Design Code; Canadian Standards Association: Rexdale, ON, Canada, 2006. [Google Scholar]
  31. Machida, A.; Uomoto, T. Recommendation for design and construction of concrete structures using continuous fiber reinforcing materials. In Research Committee on Continuous Fiber Reinforcing Materials; Japan Society of Civil Engineers: JSCE, Japan, 1997; Volume 23. [Google Scholar]
  32. Darwin, D.; Graham, E.K. Effect of Deformation Height and Spacing on Bond Strength of Reinforcing Bars; University of Kansas Center for Research, Inc.: Lawrence, KS, USA, 1993. [Google Scholar]
  33. Darwin, D.; Graham, E.K. Effect of deformation height and spacing on bond strength of reinforcing bars. ACI Struct. J. 1993, 90, 646–657. [Google Scholar]
  34. Darwin, D.; Zuo, J.; Tholen, M.L.; Idun, E.K. Development length criteria for conventional and high relative rib area reinforcing bars. ACI Struct. J. 1996, 93, 347–359. [Google Scholar]
  35. ACI 408R-03. Bond and Development of Straight Reinforcing Bars in Tension; ACI 408R-03, ACI Committee 408, American Concrete Institute: Farmington Hills, MI, USA, 2003. [Google Scholar]
  36. Shield, C.K.; Wambeke, B.W. Development Length of Glass Fiber-Reinforced Polymer Bars in Concrete. ACI Struct. J. 2006, 103, 11–17. [Google Scholar]
  37. Mohamed, H.M.; Afifi, M.Z.; Benmokrane, B. Performance evaluation of concrete columns reinforced longitudinally with frp bars and confined with frp hoops and spirals under axial load. J. Bridge Eng. 2014, 19, 04014020. [Google Scholar] [CrossRef]
  38. Maranan, G.B.; Manalo, A.C.; Benmokrane, B.; Karunasena, W.; Mendis, P. Behavior of concentrically loaded geopolymer-concrete circular columns reinforced longitudinally and transversely with gfrp bars. Eng. Struct. 2016, 117, 422–436. [Google Scholar] [CrossRef]
  39. Woraphot, P.; Sitthichai, P.; Athawit, S.; Suchart, L. Behavior and performance of gfrp reinforced concrete columns with various types of stirrups. Int. J. Polym. Sci. 2015, 2015, 1–9. [Google Scholar]
  40. Sonobe, Y.; Fukuyama, H.; Okamoto, T.; Kani, N.; Kimura, K.; Kobayashi, K.; Masuda, Y.; Matsuzaki, Y.; Mochizuki, S.; Nagasaka, T.; et al. Design guidelines of frp reinforced concrete building structures. J. Compos. Constr. 1997, 1, 90–115. [Google Scholar] [CrossRef]
  41. ACI 440.3R-04. Guide Test Methods for Fiber-Reinforced Polymers (FRPs) for Reinforcing or Strengthening Concrete Structures; ACI Committee 440, American Concrete Institute: Farmington Hills, MI, USA, 2004. [Google Scholar]
  42. Zhang, B.; Benmokrane, B. Pullout bond properties of fiber-reinforced polymer tendons to grout. J. Mater. Civ. Eng. 2002, 14, 399–408. [Google Scholar] [CrossRef]
  43. Tepfers, R. Bond clause proposal for FRP-bars/rods in concrete based on CEB/FIP Model Code 90. Part 1: Design bond stress for FRP reinforcing bars. Struct. Concrete 2006, 7, 47–55. [Google Scholar] [CrossRef]
  44. Yan, F.; Lin, Z.; Yang, M. Bond mechanism and bond strength of GFRP bars to concrete: A review. Compos. Part B Eng. 2016, 98, 56–69. [Google Scholar] [CrossRef]
Figure 1. Surface deformations and characteristics of bars (R1–R4).
Applsci 09 01340 g001
Figure 2. Assembled steel cages.
Applsci 09 01340 g002
Figure 3. Pullout specimens.
Applsci 09 01340 g003
Figure 4. Pullout test setup.
Applsci 09 01340 g004
Figure 5. Representative τ-s curves for R1 bars for the (a) without and (b) with stirrups.
Applsci 09 01340 g005
Figure 6. Representative τ-s curves for R2 bars for the (a) without and (b) with stirrups.
Applsci 09 01340 g006
Figure 7. Representative τ-s curves for R3 bars for the (a) without and (b) with stirrups.
Applsci 09 01340 g007
Figure 8. Representative τ-s curves for R4 bars for the (a) without and (b) with stirrups.
Applsci 09 01340 g008
Figure 9. Representative τ-s curves for C2 concrete for the (a) R1 bar (b) R3 bars.
Applsci 09 01340 g009
Figure 10. Typical failure modes of glass fibre-reinforced polymer (GFRP) bars exhibited by specimens with pullout failure: (a) R1, (b) R2, (c) R3, and (d) R4.
Applsci 09 01340 g010
Figure 11. Comparison of average bond strength of R1 and R3 bars in C1 and C2 concrete without stirrups. (a) R1 bars (b) R3 bars.
Applsci 09 01340 g011
Figure 12. Typical cracking behavior of specimens (a) R4-C1-20-N-1, (b) R3-C1-20-Y-2, and (c) R4-C1-20-Y-2.
Applsci 09 01340 g012
Figure 13. The ratio of average bond strength and corresponding average slip of specimens with and without stirrups (a) t* (Y) / t* (N); and, (b) s* (Y) / s* (N).
Applsci 09 01340 g013
Figure 14. Distribution of fitting parameters α β sr based on surface characteristics (a) R1/HW; (b) R2/ HW, SC; and,(c) R3/Ribbed.
Applsci 09 01340 g014
Figure 15. The box plots for parameters fitted by stirrup-containing specimens test results with regard to specific surface characteristics (a) α; (b) β; and, (c) sr.
Applsci 09 01340 g015
Figure 16. Comparisons between experimental and analytical τ-s curves: (a) R1-C1-20-Y-2; (b) R2-C1-16-Y-3; (c) R2-C1-20-Y-1; (d) R3-C1-16-Y-1; and, (e) R3-C1-20-Y-3.
Applsci 09 01340 g016aApplsci 09 01340 g016b
Table 1. Geometrical and mechanical properties of the bars.
1GroupBar TypeNominal Bar Diameter (mm)Experimental Bar Diameter (mm) aSurface Treatment bTensile Strength (MPa)Elastic Modulus (GPa)
R1GFRP88.22HW82848.90
GFRP1213.12HW66044.25
GFRP1615.68HW57840.69
GFRP2019.21HW52039.00
R2GFRP88.58HW,SC87649.5
GFRP1212.62HW,SC63443.80
GFRP1615.53HW,SC56941.5
GFRP2021.21HW,SC54440.82
R3GFRP89.14Ribbed89050.21
GFRP1211.45Ribbed73246.12
GFRP1616.84Ribbed62042.32
GFRP2021.13Ribbed57041.57
R4steel87.86-->500210
steel1212.22-->500210
steel1615.85-->500210
steel2020.07-->500210
a According to ACI 440.3R-04 (for FRP bars) and standardised (for steel bars). b HW = helical wrapping, HW, SC = helical wrapping and sand coating.
Table 2. Composition and characteristics of concrete.
Concrete MixC1C2
Water (kg/m3)185195
Cement (kg/m3)429542
Coarse aggregate (kg/m3) a12501164
Fine aggregate (kg/m3) b536499
Air content (%)2.52.5
a Maximum aggregate size was 16.2 mm. b Size interval was 0.15–4.75 mm
Table 3. Experimental results for specimens.
Specimenτmax (MPa)τ* (MPa)sm (mm)s* (mm)Failure Mode aSpecimenτmax (MPa)τ* (MPa)sm (mm)s* (mm)Failure Mode a
R1-C1- 8-N-112.6213.512.372.245PR1-C1- 8-Y-112.4012.032.122.51P
R1-C1- 8-N-213.402.12PR1-C1- 8-Y-211.82.25P
R1-C1- 8-Y-311.93.17P
R1-C1- 12-N-110.5210.322.912.82PR1-C1- 12-Y-19.5410.012.903.11P
R1-C1- 12-N-210.112.73PR1-C1- 12- Y-210.483.12P
R1-C1- 12- Y-310.023.32P
R1-C1- 16-N-19.479.793.03.10PR1-C1- 16-Y-110.2510.023.183.50P
R1-C1- 16-N-210.13.2PR1-C1- 16-Y-29.483.20P
R1-C1- 16-Y-310.344.11P
R1-C1- 20-N-17.227.423.233.30SR1-C1- 20-Y-19.08.834.724.50P
R1-C1- 20-N-27.623.37SR1-C1- 20-Y-29.34.67P
R1-C1- 20-Y-38.24.11P
R2-C1- 8-N-115.8916.191.892.10PR2-C1- 8-Y-116.2016.491.631.66P
R2-C1- 8-N-216.492.31PR2-C1- 8-Y-217.011.57P
R2-C1- 8-Y-316.271.78P
R2-C1- 12-N-112.8312.942.362.50PR2-C1- 12-Y-113.1113.581.982.24P
R2-C1- 12-N-213.052.64PR2-C1- 12- Y-214.022.3P
R2-C1- 12- Y-313.612.43P
R2-C1- 16-N-110.2410.322.963.20SR2-C1- 16-Y-111.812.904.624.48P
R2-C1- 16-N-210.403.44SR2-C1- 16-Y-213.74.24P
R2-C1- 16-Y-313.24.58P
R2-C1- 20-N-16.727.112.853.00SR2-C1- 20-Y-19.279.954.885.00P
R2-C1- 20-N-27.503.15SR2-C1- 20-Y-210.465.14P
R2-C1- 20-Y-310.124.98P
R3-C1- 8-N-117.8418.061.962.10PR3-C1- 8-Y-118.818.641.981.97P
R3-C1- 8-N-218.282.24PR3-C1- 8-Y-219.12.13P
PR3-C1- 8-Y-318.021.80P
R3-C1- 12-N-114.2214.672.572.81PR3-C1- 12-Y-114.8315.622.622.38P
R3-C1- 12-N-215.123.14PR3-C1- 12- Y -215.212.14P
R3-C1- 12- Y -316.822.38P
R3-C1- 16-N-110.6610.442.312.50SR3-C1- 16-Y-113.2213.784.324.00P
R3-C1- 16-N-210.222.69SR3-C1- 16-Y-214.163.86P
R3-C1- 16-Y-313.963.82P
R3-C1- 20-N-16.807.012.192.30SR3-C1- 20-Y-111.0711.234.454.60P
R3-C1- 20-N-27.222.41SR3-C1- 20-Y-211.274.78P
R3-C1- 20-Y-311.354.57P
R4-C1- 8-N-1/ / /R4-C1- 8-Y-1/ / /
R4-C1- 8-N-2/ / /R4-C1- 8-Y-2/ / /
R4-C1- 8-Y-3/ / /
R4-C1- 12-N-118.2017.50.980.90PR4-C1- 12-Y-118.5181.121.1P
R4-C1- 12-N-216.801.32PR4-C1- 12- Y -217.81.48P
R4-C1- 12- Y -317.71.53P
R4-C1- 16-N-110.9811.31.981.21SR4-C1- 16-Y-115.9115.824.02.16P
R4-C1- 16-N-211.622.42SR4-C1- 16-Y-215.173.69P
R4-C1- 16-Y-316.384.19P
R4-C1- 20-N-16.967.141.981.43SR4-C1- 20-Y-111.9810.784.623.08S
R4-C1- 20-N-27.322.22SR4-C1- 20-Y-210.363.96S
R4-C1- 20-Y-310.04.65S
R1-C2- 8-N-112.3812.162.532.73PR1-C2- 8-Y-112.5412.282.782.54P
R1-C2- 8-N-211.942.93PR1-C2- 8-Y-211.942.39P
PR1-C2- 8-Y-312.362.45P
R1-C2- 12-N-111.0210.733.343.27PR1-C2- 12-Y-110.5710.783.03.10P
R1-C2- 12-N-210.443.20PR1-C2- 12- Y -210.113.12P
PR1-C2- 12- Y -311.653.18P
R1-C2- 16-N-19.789.632.072.11PR1-C2- 16-Y-19.349.062.683.06P
R1-C2- 16-N-29.482.15PR1-C2- 16-Y-28.782.4P
R1-C2- 16-Y-39.064.11P
R1-C2- 20-N-18.078.212.492.70PR1-C2- 20-Y-18.828.573.123.23P
R1-C2- 20-N-28.352.91PR1-C2- 20-Y-28.132.94P
R1-C2- 20-Y-38.763.63P
R3-C2- 8-N-125.224.81.741.87PR3-C1- 8-Y-126.2125.741.561.44P
R3-C2- 8-N-224.42.0PR3-C1- 8-Y-224.841.42P
R3-C1- 8-Y-326.171.34P
R3-C2- 12-N-117.8618.542.022.19PR3-C1- 12-Y-119.3418.901.591.72P
R3-C2- 12-N-219.222.36PR3-C1- 12- Y -218.741.82P
R3-C1- 12- Y -318.621.75P
R3-C2- 16-N-114.4815.543.112.80PR3-C1- 16-Y-115.0216.102.232.40P
R3-C2- 16-N-216.602.49PR3-C1- 16-Y-217.242.57P
R3-C1- 16-Y-316.042.40P
R3-C2- 20-N-112.8713.23.143.30PR3-C1- 20-Y-114.2813.752.963.16P
R3-C2- 20-N-213.533.46PR3-C1- 20-Y-214.213.31P
R3-C1- 20-Y-312.753.21P
“/”, In pullout tests, the steel bar with nominal diameter of 8 mm was ruptured. a P = Pullout failure, S = Concrete splitting failure.
Table 4. Values of parameters based on surface characteristics.
ReferenceSurface CharacteristicNumber of TestsBMPCMR
αβsr
Mean ValueMedian ValueMean ValueMedian ValueMean ValueMedian Value
Cosenza et al. [21]HW,SC100.251 0.559 0.41
ribbed270.283 0.575 0.45
Yan et al. [44]HW,SC21 0.31 0.51 0.73
ribbed34 0.38 0.62 0.65

