Abstract
Tensile strength and fracture toughness are two essential material parameters for the study of concrete fracture. The experimental procedures to measure these two fracture parameters might be complicated due to their dependence on the specimen size or test method. Alternatively, based on the fracture test results only, size and boundary effect models can determine both parameters simultaneously. In this study, different versions of boundary effect models developed by Hu et al. were summarized, and a modified Hu-Guan’s boundary effect model with a more appropriate equivalent crack length definition is proposed. The proposed model can correctly combine the contributions of material strength and linear elastic fracture mechanics on the failure of concrete material with any maximum aggregate size. Another size and boundary model developed based on the local energy concept is also introduced, and its capability to predict the fracture parameters from the fracture test results of wedge-splitting and compact tension specimens is first validated. In addition, the classical Bažant’s Type 2 size effect law is transformed to its boundary effect shape with the same equivalent crack length as Koval-Gao’s size and boundary effect model. This improvement could extend the applicability of the model to infer the material parameters from the test results of different types of specimens, including the geometrically similar specimens with constant crack-length-to-height ratios and specimens with different initial crack-length-to-height ratios. The test results of different types of specimens are adopted to verify the applicability of different size and boundary effect models for the determination of fracture toughness and tensile strength of concrete material. The quality of the extrapolated fracture parameters of the different models are compared and discussed in detail, and the corresponding recommendations for predicting the fracture parameters for dam concrete are proposed.
1. Introduction
At present, several super-high arch dams have been constructed or are under construction in Southwest China [1,2,3]. To ensure the good working performance of concrete dams, one of the prerequisites is to prevent and control the formation and propagation of concrete cracks that may appear during the construction and operation periods. In fact, cracking is a very common, classical, but also complicated problem in concrete structures in real-life service conditions [4], which has been studied comprehensively from different perspectives by many researchers [5,6,7,8,9]. In terms of cracking risk analysis, the true fracture toughness and tensile strength of the concrete are the key material parameters that should be provided. The improper fracture properties may lead to a result with great deviation from the reality. Many test results showed that the fracture toughness of concrete has obvious size effect, and tensile strength usually depends on the specimen size and test method. To overcome the problem of size effect in fracture properties, it is often necessary to pour different sizes of concrete specimens to obtain the stable material parameter values. Thus, the test process is often complicated, especially for dam concrete, and the stable material parameters can only be measured from huge specimens [1,10]. In addition, the experimentally measured tensile strength of concrete varies for different test methods (uni-axial tension test, splitting test, flexure test, etc.) [11,12] due to the different fracture mechanisms. These size- or test method-dependent fracture parameters increase the difficulty of structure design and cracking risk analysis. Hence, it is crucial to find out a simple and relatively more accurate way to measure or predict the real fracture parameters of dam concrete.
Size effect laws (SEL) [13,14,15,16,17] and boundary effect models (BEM) [18,19] are two main asymptotic approaches to capture the size effect of concrete fracture. With these two kinds of models, the failure stress of structure with any specimen size or any crack size can be estimated, if the model parameters are fully known. On the contrary, if the test results of geometrically similar specimens with constant crack-length-to-height ratios or specimens with different crack to width ratios are available, size and boundary effect models can predict the material tensile strength and fracture toughness . The applicability of the different size and boundary effect models on the determination of fracture toughness and tensile strength have been carefully examined with many test results in the literature [20,21,22,23]. It is widely accepted that the size effect laws can provide the fracture toughness directly based on the geometrically similar fracture tests; however, in order to estimate the tensile strength, a material characteristic length must be assumed in advance [20]. The different versions of boundary effect models proposed by Hu et al. [19,21,23,24,25] can directly determine the tensile strength and fracture toughness. These models can be classified as the local and non-local models, according to the stress value adopted in the models to predict the failure due to the strength of material. The local models only use the point stress information at the crack tip, while an average stress information along a certain length emanated from the crack tip is needed for the non-local boundary effect models. The Koval-Gao’s size and boundary effect model developed by Gao et al. [26,27] is also a local model, which adopts the derivative of energy release rate evaluated locally at the crack tip as the parameter for the study of fracture dominated by the strength of material. The Koval-Gao’s size and boundary effect model can also predict simultaneously the fracture parameters from the fracture test results.
In this study, the local and non-local versions of boundary effect models developed by Hu et al. [19,21,23,24,25] are summarized, and a modified Hu-Guan’s boundary effect model with a more appropriate equivalent crack length definition is proposed. The proposed modified Hu-Guan’s boundary effect model considers the effect of maximum aggregate size on the equivalent crack length, thus changes the contributions of strength of material and linear elastic fracture mechanics (LEFM) on the specimen failure. This improvement is anticipated to be important when the maximum aggregate size of concrete getting larger. Another size and boundary effect model developed based on a local concept is also introduced [26,27], and its capability to predict the fracture parameters from the fracture test results of wedge-splitting and compact tension specimens is firstly validated. Besides, the classical Bažant’s Type 2 size effect law is transformed to a shape similar to the boundary effect model by the authors, which could be easier to be used to determine the fracture parameters from fracture tests on specimens with any sample size or crack size . The test results of geometrically similar wedge-splitting and compact tension specimens with constant crack-length-to-height ratios [28,29,30] and specimens with different initial crack-length-to-height ratios [31,32,33] are adopted, to verify the applicability of the different boundary effect models on the determination of fracture toughness and tensile strength for concrete material.
2. Size and Boundary Effect Models
The size and boundary effects of quasi-brittle fracture have been studied systematically in recent decades [13,18,19,26,27], and some progresses have been achieved in recent years by considering the effect of aggregate size on the fracture behavior [21,22,23,24,34]. These models were developed initially for the nominal strength prediction of samples with various specimen size and crack size, and later have been extended to the determination of the real fracture parameters from fracture test results.
In this section, the local and non-local versions of boundary effect models developed by Hu et al. [19,21,23,24,25] are summarized. Then, a modified Hu-Guan’s boundary effect model with a new equivalent crack length definition is proposed. Following by the brief introductions of Koval-Gao’s size and boundary effect models and Bažant’s Type 2 size effect law. All the models are written as their own linear forms, which can be used directly to extrapolate experimental results obtained from laboratory size specimens. The equivalent crack lengths of different models are compared in detail and the method for the determination of fracture parameters is presented at the end of this section.
2.1. Hu et al. Boundary Effect Models
2.1.1. Hu-Duan’s Boundary Effect Model
The boundary effect models can characterize the effect of crack length on the failure load. Figure 1a shows a wedge-splitting (or compact tension) specimen with an initial crack length under its failure load , and Figure 1b presents the two nominal stresses in the fracture analysis. The nominal strength of the specimen is defined without considering the existence of the initial crack , which can be calculated by the equilibrium conditions of the forces and moments [23]:
where W is the sample size, t is the thickness of the specimen.
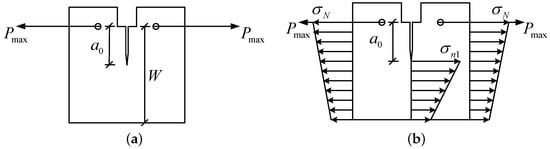
Figure 1.
(a) A wedge-splitting specimen under its peak load and (b) the definition of two nominal stresses in Hu-Duan’s boundary effect model.
in Figure 1b represents the stress at the crack tip without considering the stress singularity, and assuming a linear distribution along the ligament, which reads [23]:
where is the initial crack length.
In Hu-Duan’s boundary effect model, the ratio of two nominal stresses and is a dimensionless factor depending only on the initial crack length to sample size ratio (). For wedge-splitting (compact tension) specimen, can be calculated by relating Equations (1) and (2).
The stress criterion adopted in Hu-Duan’s boundary effect model assumes failure happens when reaches its critical value, the material tensile strength . Thus, one can obtain the nominal strength predicted by the stress criterion by the following expression:
The criterion of LEFM is directly adopted as the energy part of Hu-Duan’s boundary effect model. The nominal strength predicted by the LEFM criterion can be written as a function of crack length :
where is a geometrical factor. For wedge-splitting and compact tension specimen, the expression of is identical [35]. This is because the geometry and loading conditions are the same for compact tension and wedge-splitting fracture tests [36]. It is given by:
To link Equations (4) and (5), a transition (or reference) crack length needs to be introduced, which reads:
The transition crack length is a material constant proportional to material’s characteristic length [37]. Thus, Equation (5) can be rewritten as:
The Hu-Duan’s boundary effect model for the nominal strength prediction of structure with any crack length, can be obtained by relating Equations (4) and (8):
or
where is the equivalent crack length and depends purely on the geometrical information of the specimen, which can be calculated by:
Equation (10) can be further rearranged as follows:
Once the peak loads are recorded after the fracture tests, the equivalent crack length and nominal strength are known accordingly. hence, the tensile strength and fracture toughness can be calculated from the intercept and slope of the linear regression.
2.1.2. Hu-Guan’s (Hu-Wang’s) Boundary Effect Model
The Hu-Guan’s and Hu-Wang’s boundary effect models [21,23,34] are developed for wedge-splitting and three-point bending tests respectively, which all assume a constant crack-bridging stress within the partially developed fracture process zone or (see Figure 2a). In contrast to the local point stress value (see Figure 1b) defined in Hu-Duan’s boundary effect model, (see Figure 2a) is associated with the fictitious crack length , and its value is affected by the choice of this length, thus becomes a non-local stress parameter. The strain condition along the crack plane, the equilibrium conditions of bending stress and bending moment were considered to determine this constant stress [21,34]. It is given by [23]:
with and .
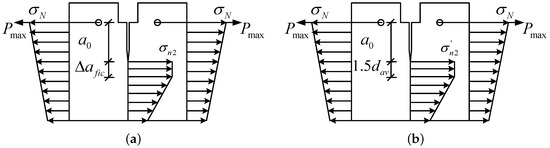
Figure 2.
The definition of two nominal stresses in (a) Hu-Guan’s boundary effect model and (b) Hu-Zhang’s boundary effect model.
The advancement from Hu-Duan’s boundary effect model to Hu-Guan’s boundary effect model is the non-local nominal stress used in the stress criterion. Thus, the local version of the boundary effect model was improved as a non-local version. Following the same idea of Hu-Duan’s boundary effect model, Guan et al. proposed in [23] the way of calculating the tensile strength and fracture toughness by the following linear relation:
The local stress is replaced by the non-local stress , and is the same as the one in Hu-Duan’s boundary effect model. It is admitted that Hu-Duan’s boundary effect model () may overestimate the tensile strength of the material, and Hu-Guan’s boundary effect model can lower the predicted tensile strength when increases [22]. This fictitious crack length was assumed to be proportional to the maximum aggregate size of concrete [23]:
It is concluded in [23] that is a good approximation when the maximum aggregate size is the dominant aggregate size of a concrete mix and the ratio is below 20 (or even 50).
2.1.3. Hu-Zhang’s Boundary Effect Model
Hu-Zhang’s boundary effect model [24,25] added two more assumptions about the length scale than Hu-Guan’s boundary effect model. That are, the fictitious crack length (see Figure 2b, is the average aggregate size) is accurate enough when the ratio of the sample size and the average aggregate size varies in a certain range, and the transition crack length is appropriate to consider the micro-structure influence of granite and fine-grained polycrystalline ceramics studied in [24,25]. Based on these two assumptions, if the average aggregate size (transition crack length ) and tensile strength are decided, then one can directly estimate the fracture toughness by Equation (7).
Since the average aggregate sizes are not known for the concrete fracture tests adopted in this study, the Hu-Zhang’s boundary effect model will not be used to estimate the tensile strength and fracture toughness in the next sections.
2.1.4. Proposed Modified Hu-Guan’s Boundary Effect Model
Based on Equation (1) and Equation (13) in Hu-Guan’s boundary effect model, the nominal strength can be rewritten as a function of :
with
Unlike in Equation (3), is no longer just geometry-related, but also material-related by the fictitious crack length , which is assumed to be proportional to the maximum aggregate size . In the equivalent crack length calculation, to be more appropriate, it is recommended in this study to use instead of , thus, the modified equivalent crack length would be:
In the linear regression of tensile strength and fracture toughness calculation, should be replaced by in this modified Hu-Guan’s boundary effect model:
2.2. Koval-Gao’s Size and Boundary Effect Model
The Koval-Gao’s size and boundary effect model [26,27,38] has two different forms. The second form is similar to the traditional Type 2 size effect law [14], which can be used to predict the size effect induced by the specimen size. The first form is close to the boundary effect model proposed by Hu et al., which can predict simultaneously the tensile strength and fracture toughness from the fracture test results. The Koval-Gao’s size and boundary effect model was developed initially for cracked samples [26] by relating the contribution of the tensile strength and fracture energy. The contribution of the tensile strength is obtained from the derivative of the energy release rate, which is evaluated locally at the crack tip. While the contribution of the fracture energy is simply quantified by the LEFM criterion, same as the boundary effect models developed by Hu et al. The Koval-Gao’s size and boundary effect model was further improved as a local fracture criterion in [27,38], which can be easily applied for any geometry. The first form of Koval-Gao’s size and boundary effect model reads:
where , and the equivalent crack length is defined as:
This model can also be written as a linear form:
with
So, the material tensile strength and fracture toughness can be calculated from the intercept and slope of the linear regression.
2.3. Bažant’s Type 2 Size Effect Law
Bažant’s Type 2 size effect law was originally developed for the size effect study of geometrically similar specimens [13]. The law reads
where is a geometrical dimensionless constant; is a material constant proportional to . and were given as follows in [15]:
where is defined as the dimensionless energy release function of LEFM; the length parameter is proportional to , which is the effective size of fracture process zone [15]. can be written as a function of the geometrical correction factor presented in Equation (20):
After the substitution of Equations (7), (25)–(27) into Equation (24), the type 2 size effect law can be finally transformed to a shape similar to the boundary effect model:
where shares the same definition as the one presented in Koval-Gao’s size and boundary effect model. This form of the Bažant’s Type 2 size effect law can be further written as:
with
Thus, the fracture toughness and the effective size of the fracture process zone can be identified from the size effect or boundary effect fracture test results. To obtain the tensile strength of the material, a ratio () between and the material characteristic length should be assumed. It is reported in [20,39,40] that can be or for concrete material. Since , another ratio can also be obtained, which is close to 1 when (), means the effective size of the fracture process zone may be roughly equal to the transition crack size.
It is interesting to notice that the effective size of the fracture process zone in Bažant’s Type 2 size effect law might be able to link to the fictitious crack length proposed in Hu-Guan’ (Hu-Wang’) boundary effect model (see Section 2.1.2). A reasonable choice of or would provide a better estimation of material tensile strength . The theoretical and experimental studies can be done in the future work to find out the approximate relation between and maximum aggregate size or average aggregate size .
2.4. Comparison of Different Equivalent Crack Lengths
Different size and boundary effect models have adopted different expressions for the calculation of equivalent crack lengths. (Equation (11)) in Hu-Guan’s boundary effect model depends only on the crack-length-to-height ratio , while (Equation (18)) proposed in modified Hu-Guan’s boundary effect model believes the equivalent crack length depends on both the crack-length-to-height ratio and fictitious crack-length-to-height ratio , thus becomes geometry- and material-related. The expression (Equation (21)) in Koval-Gao’s size and boundary effect model, and Bažant’s Type 2 size effect law is identical, which is only geometry-dependent. To better compare the different equivalent crack lengths, a wedge-splitting specimen with mm (see Figure 1a) is taken as an example, and its initial crack length varies from mm to mm. The variations of the equivalent crack length for different maximum aggregate size with fixed discrete number , and variable with fixed are plotted respectively in Figure 3 and Figure 4.
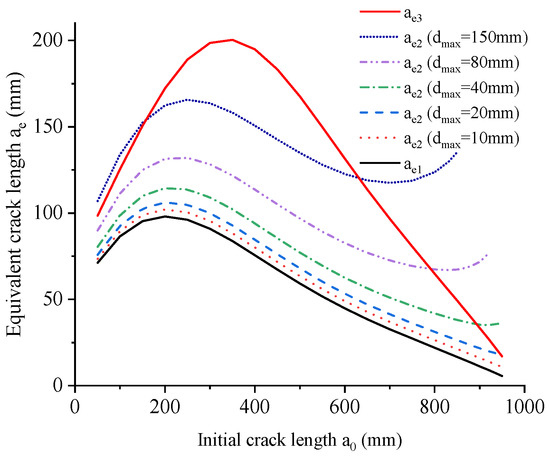
Figure 3.
Equivalent crack length versus initial crack length for different maximum aggregate size when .
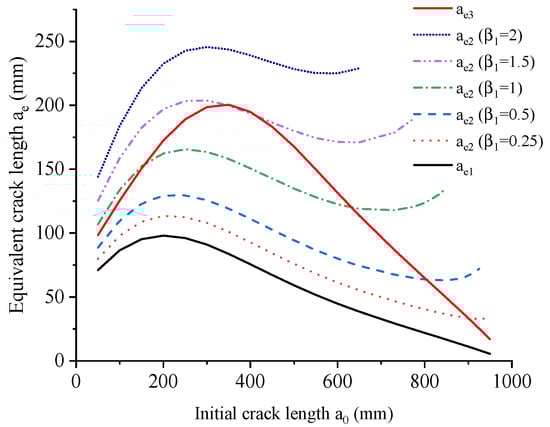
Figure 4.
Equivalent crack length versus initial crack length for different discrete number when mm.
In different constructions, the maximum aggregate size can be very different. For concrete used in Wudongde and Baihetan super-high arch dams, mm, mm or mm for different parts of the dam. Meanwhile for the relatively smaller structures such as piers or beams, the frequently used is only mm or mm. These possible are all considered in this section, and the corresponding are plotted in Figure 3, together with the material () independent equivalent crack lengths and . For the original Hu-Guan’s boundary effect model, reaches its maximum value for any when the crack-length-to-height ratio is around , means for this ratio, the LEFM contributes the most to the failure of the specimen, thus should be recommended as the initial ratio for the fracture test on wedge-splitting specimen. This recommended ratio for Koval-Gao’s size and boundary effect model, and Bažant’s Type 2 size effect law is to , which is closer to the usual initial crack-length-to-height ratio reported in the references [1,10]. In terms of proposed in this study, it is obvious that it is different from , and this difference becomes larger as the increase of . Hence, the proposed modified Hu-Guan’s boundary effect model would be more appropriate than its original version, due to the fact that the two failure mechanisms are correctly combined even for the fracture analysis of dam concrete with maximum aggregate size reaches mm. However, it should be admitted that for such as mm or mm, the difference in and may has neglectable effect on the fracture properties estimated by the original and modified Hu-Guan’s boundary effect model. In addition, the increase of at the tail part can be observed in Figure 3. This trend appears naturally due to its definition. An increase could maintain the validity of the failure mechanism of LEFM for all the possible crack-length-to-height ratios.
Figure 4 shows the equivalent crack length versus initial crack length for different discrete number when mm. and are the same as the ones plotted in Figure 3 since they are independent on the fictitious crack length. ranges from to 2 is considered, which is a reasonable range for concrete material [23]. As shown in Figure 4, is strongly affected by the choice of when mm, thus may provide very different fracture parameters for different boundary effect models. It should be noted that according to the definition of (see Figure 2a) in original and modified Hu-Guan’s boundary effect model, the fictitious crack length should be smaller than the length of the ligament, so the Hu-Guan’s boundary effect model cannot be applied directly to some special cases (the tail part of in Figure 4) when the ligament is not enough to distribute the stress. This might be a shortcoming of the non-local models, but in fact, can be rarely encountered in the analysis of usual fracture test results.
2.5. Method for the Determination of Fracture Parameters
The fracture tests on geometrically similar specimens with constant crack-length-to-height ratios, and specimens with different initial crack-length-to-height ratios are frequently performed to study the dependence of fracture behaviors on specimen sizes and initial crack lengths. The test results obtained from these two types of specimens can be used to extrapolate the tensile strength and fracture toughness by the size and boundary effect models.
The linear forms of original Hu-Guan’s boundary effect model (Equation (14)), modified Hu-Guan’s boundary effect model (Equation (19)), Koval-Gao’s size and boundary effect model (Equation (22)), and Bažant’s Type 2 size effect law (Equation (29)) have presented previously in this section. Only the maximum loads and geometrical information of the tested specimens are needed for the linear regression analysis. The nominal stresses in the different linear models can be calculated by Equation (13) (original and modified Hu-Guan’s boundary effect model), Equation (23) (Koval-Gao’s size and boundary effect model), and Equation (30) (Bažant’s Type 2 size effect law). In addition, the different equivalent crack lengths can be calculated by Equation (11) (original Hu-Guan’s boundary effect model), Equation (18) (modified Hu-Guan’s boundary effect model), and Equation (21) (Koval-Gao’s size and boundary effect model and Bažant’s Type 2 size effect law). With these two known values from the test results and specimens’ geometrical information, one can do the linear regression analysis by the different models. Thus, the intercept and slope obtained from the best linear fit can be used to predict the material properties.
It should be noted that for the original and modified Hu-Guan’s boundary effect models, the extrapolated fracture parameters vary together as the adjustment of the discrete number . Thus, special attention should be paid to the regression analysis, to ensure the predicted tensile strength and fracture toughness are all acceptable. For Bažant’s Type 2 size effect law, as introduced in Section 2.3, only the fracture toughness and the effective size of the fracture process zone can be obtained from the linear fit. To estimate the tensile strength of the material, a ratio () between and the material characteristic length should be assumed. Then can be calculated as follows:
Koval-Gao’s size and boundary effect model is less flexible than the other two models, because the liner fit is unique for one set of the test results, and one can calculate the tensile strength from the intercept and fracture toughness from the slope, respectively.
3. Model Verification and Comparison
The test results of geometrically similar wedge-splitting [28,29] and compact tension specimens [30] with constant crack-length-to-height ratios, and wedge-splitting specimens with different initial crack-length-to-height ratios [31,32,33] are adopted, to verify the applicability of the different size and boundary effect models on the determination of fracture properties for concrete material.
3.1. Tests of Geometrically Similar Specimens with Constant Crack-Length-to-Height Ratios
3.1.1. Zhang’s Experiments
Zhang et al. [28,29] carried out a series of experiments with geometrically similar wedge-splitting specimens, to investigate the size effects of concrete with small aggregate size. The height of the specimens ranges from mm to mm, with the maximum aggregate size of mm. There were 24 specimens in total, which were divided into 7 groups according to their heights, and each group had at least 3 samples. The compressive strength at 60 days was MPa.
The sample dimensions, test results, equivalent crack lengths and nominal stresses in different boundary effect models are listed in Table 1. It should be noted that the dimensions of different samples in one group were slightly different due to the size deviations of the molds.

Table 1.
Geometry, test results and equivalent crack length of wedge-splitting specimens [28,29].
To obtain simultaneously the tensile strength and fracture toughness, the linear regressions of original Hu-Guan’s boundary effect model (), modified Hu-Guan’s boundary effect model (), Koval-Gao’s size and boundary effect model, and Bažant’s Type 2 size effect law are plotted respectively in Figure 5. The estimated materials parameters (see Figure 5a) for original Hu-Guan’s boundary effect model () are: MPa, , mm and mm. It should be noticed that the results of Hu-Guan’s boundary effect model are slightly different from the results presented in [23], because in this analysis, the more accurate sample dimensions and peak loads are adopted from [28,29]. For modified Hu-Guan’s boundary effect model (see Figure 5b), when (), one can obtain MPa, , mm and mm. For Koval-Gao’s size and boundary effect model, MPa, , mm and mm can be calculated from the intercept and slope shown in Figure 5c. Bažant’s Type 2 size effect law (see Figure 5d) gives and mm (Equation (29)). As already introduced previously in Section 2.3 and Section 2.5, in order to obtain the tensile strength of the material, a ratio should be assumed, then can be calculated by Equation (31). It is obvious that mathematically would increase monotonically as the increase of . For the test results analyzed in this section, and 1 gives MPa and MPa, respectively. If , the corresponding , which is close to the estimation of Koval-Gao’s size and boundary effect model. The transition crack length mm and material characteristic length mm can also be calculated for the chosen .
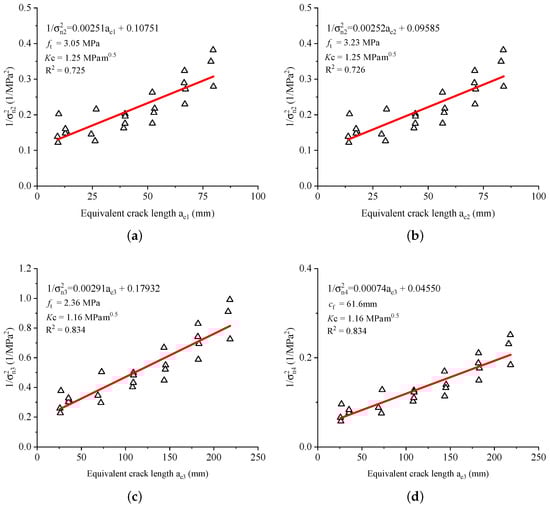
Figure 5.
Test results in [28,29] and the corresponding fitted curves of (a) Hu-Guan’s boundary effect model with , (b) modified Hu-Guan’s boundary effect model with , (c) Koval-Gao’s size and boundary effect model and (d) Bažant’s Type 2 size effect law.
The tensile strength was not measured in [29], alternatively, we can estimate it from the measured compressive strength by MPa [31], which is only difference with the estimation of Koval-Gao’s size and boundary effect model. The Hu-Guan’s boundary effect model and its modified version still somehow overestimate the material tensile strength with . However, as the increase of , the estimated would decrease accordingly, as what has done in [23], to test the effect of different on the predicted tensile strength.
For fracture toughness , when the sample size is larger than mm, the nominal fracture toughness tends to be stable, and its value ranges from to , hence, estimated by the Koval-Gao’s model and Bažant model is acceptable. While for the original Hu-Guan model and its modified version, the estimated when seems slightly higher, since the largest measured is only for the largest specimen with mm, whose failure can be assumed as totally LEFM control. Nevertheless, as the variation of the value of (or ), the best estimations of and given by Hu-Guan’s boundary effect model can be achieved.
It is worthwhile to mention that the adjustment of in original and modified Hu-Guan’s boundary effect models would alter the predicted and values simultaneously, to be more exact, as the increase of , the estimated would decrease and would increase. This is simply due to the model assumption about the competition between two failure mechanisms (strength of material and LEFM). A larger fictitious crack length gives a lower non-local stress (see Figure 2a) distributed along the fictitious crack, thus reduces the contribution of strength of material on the specimen failure, and finally leads to the different combination of predicted fracture parameters. This feature may introduce some difficulties to directly adopt the extrapolated fracture parameters to the numerical simulation of a real structure, since one may suspend the veracity of the estimated parameters. Therefore, before using the Hu-Guan’s boundary effect model to extrapolate the fracture parameters, it is recommended to fix one parameter by tests or give a narrow range to it in advance. In this way, the other parameter can be more reliable, and a reasonable is naturally obtained.
In terms of fracture parameters extrapolation, Bažant’s Type 2 size effect law is also aided by a length assumption (). However, the different choice of would change the prediction of only. It is reported in [20,39,40] that is about for concrete material, but as the increase of maximum aggregate size, especially for the dam concrete with mm, should be better verified by more experiential results. The third model, Koval-Gao’s size and boundary effect model only provides one set of fracture parameters, which seems to be less flexible than the other models, but its estimated parameters are acceptable for this case.
3.1.2. Wittmann’s Experiments
Wittmann et al. [30] performed the fracture tests on geometrically similar compact tension specimens. The heights of the specimens were mm, mm and mm, with 6 samples for each specimen size and the maximum aggregate size was mm. The measured compressive strength at 28 days was MPa. The sample dimensions, test results and model parameters are listed in Table 2. Only the mean value of the maximum loads of each group (6 samples) has been reported in [30].
Table 2.
Geometry, test results and equivalent crack length of compact tension specimens [30].
The linear regressions of different size and boundary effect models are plotted in Figure 6. When , the estimated materials parameters (see Figure 6a) for original Hu-Guan’s boundary effect model are: MPa, , mm, mm, and for modified Hu-Guan’s boundary effect model (see Figure 6b), the extrapolated parameters are: MPa, , mm and mm. Koval-Gao’s size and boundary effect model gives MPa, , mm and mm (see Figure 6c). Bažant’s Type 2 size effect law (see Figure 6d) gives and mm. In addition, the tensile strength MPa is obtained for .
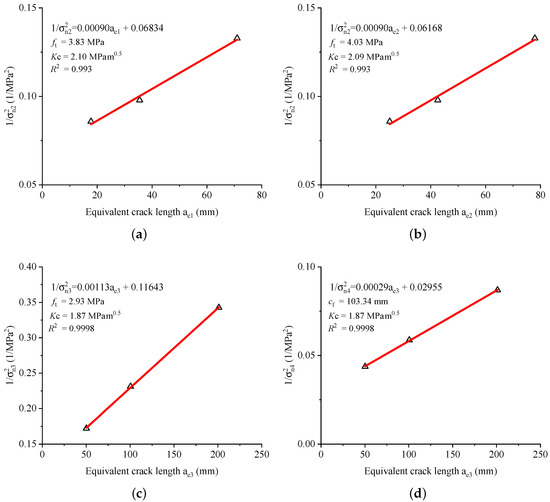
Figure 6.
Test results in [30] and the corresponding fitted curves of (a) Hu-Guan’s boundary effect model with , (b) modified Hu-Guan’s boundary effect model with , (c) Koval-Gao’s size and boundary effect model and (d) Bažant’s Type 2 size effect law.
The tensile strength can be estimated from the compressive strength by MPa [31]. Similar to the estimated results of Zhang’s experiments (see Section 3.1.1), the extrapolated tensile strengths of Koval-Gao’s model and Bažant’s model seem to be more reasonable than the values given by the original and modified Hu-Guan’s boundary effect models. In terms of fracture toughness, the difference of the values given by the different models is within , therefore, the model predictions are all acceptable. However, for the largest tested specimen (mm), the measured is only . According to the experimental size effect study [1,10], for such a relatively huge specimen with ligament length () to maximum aggregate size () ratio equals , the measured fracture toughness should be close to the real material fracture toughness already. Therefore, the lower fracture toughness prediction given by Koval-Gao’s model and Bažant’s model might be more appropriate. As already mentioned in Section 3.1.1, a choice of a smaller could lower the prediction of fracture toughness given by the Hu-Guan’s model, but at the same time, an unrealistic larger tensile strength would be obtained. This issue of the Hu-Guan’s boundary effect model should be further studied.
3.2. Tests of Specimens with Different Initial Crack-Length-to-Height Ratios
3.2.1. Xu’s Experiments
Xu et al. [31] performed the wedge-splitting tests made of concrete with different initial crack-length-to-height ratios. The maximum aggregate size used was mm. The height and thickness were fixed for all the specimens (mm, mm). There were three different initial crack lengths , which were mm, mm and mm, respectively. The measured compressive strength is MPa, and the tensile strength was estimated as MPa by Xu et al. [31]. Details of the specimen dimensions, test results and equivalent crack lengths are listed in Table 3.
Table 3.
Geometry, test results and equivalent crack length of wedge-splitting specimens [31].
Figure 7 presents the test results in [31] and the fitted curves of the different size and boundary effect models. It should be noted that the low coefficients of determination () are simply due to the fluctuation of the test results. As shown in Figure 7, the linear trend of the test results is very clear and therefore, can be used to the prediction of fracture properties. For the original Hu-Guan’s boundary effect model (see Figure 7a), it is provided in [23] that MPa, , mm and mm when . The modified Hu-Guan’s boundary effect model (see Figure 7b) gives MPa, , mm and mm when . For Koval-Gao’s size and boundary effect model, as shown in Figure 7c, one can obtain MPa, , mm and mm. The estimated values for Bažant’s Type 2 size effect law (see Figure 7d) are: and mm. When , the material tensile strength MPa can be obtained by Equation (31), and the corresponding mm and mm.
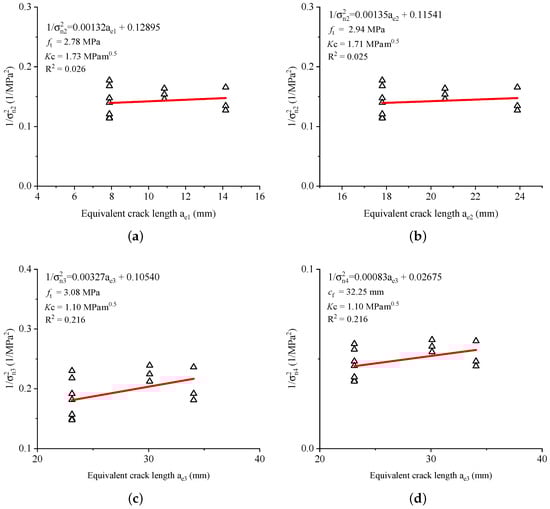
Figure 7.
Test results in [31] and the corresponding fitted curves of (a) Hu-Guan’s boundary effect model with , (b) modified Hu-Guan’s boundary effect model with , (c) Koval-Gao’s size and boundary effect model and (d) Bažant’s Type 2 size effect law.
The tensile strength calculated by Koval-Gao’s size and boundary effect model is again within difference with the estimated tensile strength MPa by Xu et al. [31]. With the same discrete number , the original Hu-Guan’s boundary effect model gives a lower tensile strength than its modified one. In terms of fracture toughness, the estimation of Koval-Gao’s size and boundary effect model is the same as the Bažant’s Type 2 size effect law, and lower than the values given by the original and modified Hu-Guan’s boundary effect models. However, under current conditions, it is difficult to decide which model provides the more appropriate fracture toughness. This is because the tested specimen size mm, which is only times bigger than the maximum aggregate size. For such a ratio, the failure of the pre-cracked specimen is certainly controlled by the non-LEFM, and the real fracture toughness of the material should be evaluated by a larger specimen or estimated by the size and boundary effect models.
3.2.2. Wu’s Experiments
Another series of wedge-splitting tests with different initial crack-length-to-height ratios were carried out by Wu et al. [32,33]. The maximum aggregate size was mm. The height and thickness of the specimens were mm and mm, respectively. The samples were classified as 5 groups according to the different initial crack-length-to-height ratios ranging from to . The measured compressive strength was MPa, and splitting tensile strength was MPa. Details of the tests are listed in Table 4, the failure loads were the mean values of the different groups provided in [32,33].
Table 4.
Geometry, test results and equivalent crack length of wedge-splitting specimens [32,33].
The linear regressions of different models are plotted in Figure 8. When , the estimated materials parameters (see Figure 8a) for original Hu-Guan’s boundary effect model are: MPa, , mm, mm, and for modified Hu-Guan’s boundary effect model (see Figure 6b), the extrapolated parameters are: MPa, , mm and mm. Koval-Gao’s size and boundary effect model gives MPa, , mm and mm (see Figure 6c). Bažant’s Type 2 size effect law (see Figure 6d) gives and mm. In addition, the tensile strength MPa is obtained for .
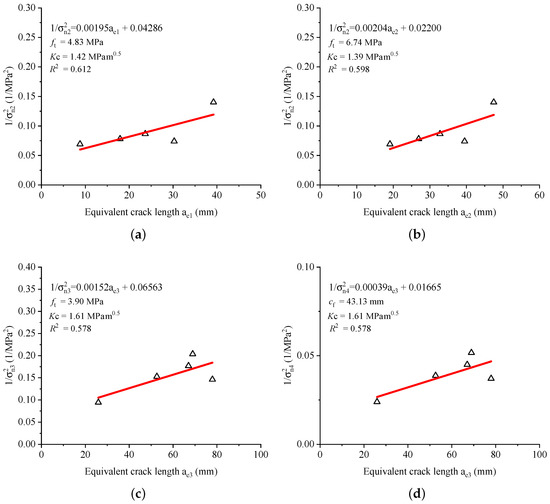
Figure 8.
Test results in [32,33] and the corresponding fitted curves of (a) Hu-Guan’s boundary effect model with , (b) modified Hu-Guan’s boundary effect model with , (c) Koval-Gao’s size and boundary effect model and (d) Bažant’s Type 2 size effect law.
For this example, the extrapolated tensile strengths of all the models are larger than the measured splitting tensile strength (MPa), this is because the different fracture mechanisms of the splitting and wedge-splitting tests. The latter one’s failure mechanism is close to the flexure test. Therefore, the extrapolated tensile strength from the wedge-splitting tests should be close to the tensile strength measured by the flexure test. Raphael [11,12] concluded from plenty of the experimental results that the tensile strength measured by the flexure test is around higher than the one measured by the splitting test. Hence, the extrapolated tensile strengths by the different models are still reasonable.
The fracture toughness values given by the Koval-Gao’s model and Bažant’s model () are higher than the values obtained from the Hu-Guan’s boundary effect model () when . Since the measured nominal fracture toughness for the specimen with initial crack-length-to-height ratio equals to was , it is recommended that a larger value of should be adopted, to obtain a more realistic fracture toughness. For instance, one can get MPa and by Hu-Guan’s boundary effect model when . This set of parameters is close to Koval-Gao’s and Bažant’s models.
4. Conclusions
The local and non-local versions of boundary effect models developed by Hu et al., the modified Hu-Guan’s boundary effect model proposed in this study, the Koval-Gao’s size and boundary model, and Bažant’s Type 2 size effect law are all able to capture the effects of crack length and sample size on the fracture behavior of wedge-splitting and compact tension specimens. The proposed modified Hu-Guan’s boundary effect model provides a more appropriate definition of equivalent crack length. This proposed model can correctly combine the contributions of strength of material and LEFM on the material failure for concrete with any maximum aggregate size. The boundary effect shape of Bažant’s Type 2 size effect law shares the same equivalent crack length as Koval-Gao’s size and boundary effect model. This improvement could extend the applicability of the model to extrapolate the material parameters by the test results obtained from both the geometrically similar specimens with constant crack-length-to-height ratios and specimens with different initial crack-length-to-height ratios.
The applicability of the different size and boundary effect models on the determination of fracture toughness and tensile strength for concrete material are verified and compared by test results reported in the literature. The original and modified Hu-Guan’s boundary effect model is more flexible, because the two fracture parameters vary together as the adjustment of the discrete number . However, there exists the risk that the reasonable fracture parameters cannot be obtained with one single . Therefore, before using the Hu-Guan’s boundary effect model to extrapolate the fracture parameters, it is recommended to fix one parameter by tests or give a narrow range to it in advance. In this way, the other parameter can be more reliable, and a reasonable is naturally obtained. Besides, the proposed modified Hu-Guan’s boundary effect model would be more appropriate than its original version, due to the fact that the two failure mechanisms are correctly combined even for the fracture analysis of dam concrete with maximum aggregate size reaches mm. Nevertheless, for such as mm or mm, this improvement is neglectable. Bažant’s Type 2 size effect law is less flexible than Hu-Guan’s boundary effect model, because once the test results are given, the estimated fracture toughness is decided. The variation of the length scale or would change the estimated value of tensile strength only. In terms of Koval-Gao’s size and boundary effect model, only one set of fracture parameters can be extrapolated from the test results. However, for the test results adopted in this study, the predictions of the fracture properties given by Koval-Gao’s size and boundary effect model are all acceptable.
For dam concrete, the specimen size needed to measure the stable tensile strength and fracture toughness can be huge. Hence, it is recommended to use the size and boundary effect to determine the two fracture parameters simultaneously. The fracture tests on at least three different sizes of geometrically similar specimens (e.g., mm with ) and one specimen size with three different initial crack-length-to-height ratios (e.g., mm with ) are encouraged to be performed, for the purpose of the extrapolation of fracture parameters by the theoretical models. More experimental findings will be reported in the authors’ further coming publications. Comprehensive experimental studies on the wedge-splitting specimens made of fully graded concrete are currently undergoing. All the specimens are casted in the same time at the construction sites of Wudongde and Baihetan super-high arch dams. The mechanical and fracture tests are performed simultaneously, to obtain the reliable and comprehensive test results for the dam concrete. The further coming experimental evidence will improve the capability of the different size and boundary effect models on the determination of fracture toughness and tensile strength for concrete material, especially the fully graded concrete, whose fracture parameters are crucial to the dam construction and operation, but not easy to be obtained.
Author Contributions
Conceptualization, X.G.; Formal analysis, X.G., Y.H., Q.L. and G.K.; Funding acquisition, Q.L. and X.G.; Supervision, Y.H., Q.L., G.K. and C.C.; Validation, Y.T., N.Y., Y.Q., C.L. and C.C.; Writing—original draft, X.G.; Writing—review and editing, X.G., Y.H., Q.L., Y.T., N.Y., Y.Q., C.L., G.K. and C.C.
Funding
This research was funded by the Research Projects of China Three Gorges Corporation (Contract numbers: BHT/0806 and WDD/0427) and China Postdoctoral Science Foundation grant number 2018M631478.
Conflicts of Interest
The authors declare no conflict of interest.
Abbreviations
The following abbreviations are used in this manuscript:
| BEM | Boundary effect model |
| SEL | Size effect law |
| LEFM | Linear elastic fracture mechanics |
References
- Li, Q.; Guan, J.; Wu, Z.; Dong, W.; Zhou, S. Fracture Behavior of Site-Casting Dam Concrete. ACI Mater. J. 2015, 112, 11–20. [Google Scholar] [CrossRef]
- Hu, Y.; Liang, G.; Li, Q.; Zuo, Z. A monitoring-mining-modeling system and its application to the temperature status of the Xiluodu arch dam. Adv. Struct. Eng. 2017, 20, 235–244. [Google Scholar] [CrossRef]
- Lin, P.; Wei, P.; Wang, W.; Huang, H. Cracking Risk and Overall Stability Analysis of Xulong High Arch Dam: A Case Study. Appl. Sci. 2018, 8, 2555. [Google Scholar] [CrossRef]
- Safiuddin, M.; Kaish, A.; Woon, C.; Raman, S. Early-Age Cracking in Concrete: Causes, Consequences, Remedial Measures, and Recommendations. Appl. Sci. 2018, 8, 1730. [Google Scholar] [CrossRef]
- Mi, Z.; Hu, Y.; Li, Q.; An, Z. Effect of curing humidity on the fracture properties of concrete. Constr. Build. Mater. 2018, 169, 403–413. [Google Scholar] [CrossRef]
- Mi, Z.; Hu, Y.; Li, Q.; Zhu, H. Elevated temperature inversion phenomenon in fracture properties of concrete and its application to maturity model. Eng. Fract. Mech. 2018, 199, 294–307. [Google Scholar] [CrossRef]
- Liu, L.; Ouyang, J.; Li, F.; Xin, J.; Huang, D.; Gao, S. Research on the Crack Risk of Early-Age Concrete under the Temperature Stress Test Machine. Materials 2018, 11, 1822. [Google Scholar] [CrossRef] [PubMed]
- Mi, Z.; Hu, Y.; Li, Q.; Gao, X.; Yin, T. Maturity model for fracture properties of concrete considering coupling effect of curing temperature and humidity. Constr. Build. Mater. 2019, 196, 1–13. [Google Scholar] [CrossRef]
- Li, J.; Gao, X.; Fu, X.; Wu, C.; Lin, G. A Nonlinear Crack Model for Concrete Structure Based on an Extended Scaled Boundary Finite Element Method. Appl. Sci. 2018, 8, 1067. [Google Scholar] [CrossRef]
- Guan, J.; Li, Q.; Wu, Z.; Zhao, S.; Dong, W.; Zhou, S. Minimum specimen size for fracture parameters of site-casting dam concrete. Constr. Build. Mater. 2015, 93, 973–982. [Google Scholar] [CrossRef]
- Raphael, J. Tensile Strength of Concrete. J. Am. Concrete Inst. 1984, 81, 158–165. [Google Scholar]
- Wu, M.; Zang, C.; Chen, Z. Study on the direct tensile, splitting and flexure strengths of concrete. J. Hydraul. Eng. 2015, 46, 981–988. [Google Scholar]
- Bažant, Z. Size effect in blunt fracture: Concrete, rock, metal. J. Eng. Mech. 1984, 110, 518–535. [Google Scholar] [CrossRef]
- Bažant, Z. Scaling theory for quasibrittle structural failure. Proc. Natl. Acad. Sci. USA 2004, 101, 13400–13407. [Google Scholar] [CrossRef]
- Bažant, Z. Scaling of Structural Strength; Butterworth-Heinemann: Oxford, UK, 2005. [Google Scholar]
- Bažant, Z.; Kazemi, M. Size dependence of concrete fracture energy determined by RILEM work-of-fracture method. Int. J. Fract. 1991, 51, 121–138. [Google Scholar]
- Maimí, P.; González, E.; Gascons, N.; Ripoll, L. Size effect law and critical distance theories to predict the nominal strength of quasibrittle structures. Appl. Mech. Rev. 2013, 65, 020803. [Google Scholar] [CrossRef]
- Hu, X. An asymptotic approach to size effect on fracture toughness and fracture energy of composites. Eng. Fract. Mech. 2002, 69, 555–564. [Google Scholar] [CrossRef]
- Duan, K.; Hu, X.; Wittmann, F. Scaling of quasi-brittle fracture: Boundary and size effect. Mech. Mater. 2006, 38, 128–141. [Google Scholar] [CrossRef]
- Hoover, C.; Bažant, Z. Comparison of the Hu-Duan boundary effect model with the size-shape effect law for quasi-brittle fracture based on new comprehensive fracture tests. J. Eng. Mech. 2014, 140, 480–486. [Google Scholar] [CrossRef]
- Wang, Y.; Hu, X. Determination of tensile strength and fracture toughness of granite using notched three-point-bend samples. Rock Mech. Rock Eng. 2017, 50, 17–28. [Google Scholar] [CrossRef]
- Hu, X.; Guan, J.; Wang, Y.; Keating, A.; Yang, S. Comparison of boundary and size effect models based on new developments. Eng. Fract. Mech. 2017, 175, 146–167. [Google Scholar] [CrossRef]
- Guan, J.; Hu, X.; Xie, C.; Li, Q.; Wu, Z. Wedge-splitting tests for tensile strength and fracture toughness of concrete. Theor. Appl. Fract. Mech. 2018, 93, 263–275. [Google Scholar] [CrossRef]
- Zhang, C.; Hu, X.; Wu, Z.; Li, Q. Influence of grain size on granite strength and toughness with reliability specified by normal distribution. Theor. Appl. Fract. Mech. 2018, 96, 534–544. [Google Scholar] [CrossRef]
- Zhang, C.; Hu, X.; Sercombe, T.; Li, Q.; Wu, Z.; Lu, P. Prediction of ceramic fracture with normal distribution pertinent to grain size. Acta Mater. 2018, 145, 41–48. [Google Scholar] [CrossRef]
- Gao, X.; Koval, G.; Chazallon, C. A Size and Boundary Effects Model for Quasi-Brittle Fracture. Materials 2016, 9, 1030. [Google Scholar] [CrossRef]
- Gao, X.; Koval, G.; Chazallon, C. Energetical formulation of size effect law for quasi-brittle fracture. Eng. Fract. Mech. 2017, 175, 279–292. [Google Scholar] [CrossRef]
- Zhang, X.; Xu, S.; Gao, H. Superposition calculation of double-K fracture parameters of concrete using wedge splitting geometry and boundary effect. J. Dalian Univ. Technol. 2006, 46, 868–874. [Google Scholar]
- Zhang, X.; Xu, S.; Zheng, S. Experimental measurement of double-K fracture parameters of concrete with small-size aggregates. Front. Archit. Civ. Eng. China 2007, 1, 448–457. [Google Scholar] [CrossRef]
- Wittmann, F.; Rokugo, K.; Brühwiler, E.; Mihashi, H.; Simonin, P. Fracture energy and strain softening of concrete as determined by means of compact tension specimens. Mater. Struct. 1988, 21, 21–32. [Google Scholar] [CrossRef]
- Xu, S.; Zhao, Y.; Wu, Z. Study on the average fracture energy for crack propagation in concrete. J. Mater. Civ. Eng. 2006, 18, 817–824. [Google Scholar] [CrossRef]
- Wu, Z.; Zhao, G. Influences of relative crack length a0/h of concrete specimens on crack propagation process and fracture toughness. J. Basic Sci. Eng. 1995, 3, 126–130. [Google Scholar]
- Wu, Z.; Xu, S.; Lu, J.; Liu, Y. Influence of specimen initial crack length on double-K fracture parameter of concrete. J. Hydraul. Eng. 2000, 31, 35–39. [Google Scholar]
- Wang, Y.; Hu, X.; Liang, L.; Zhu, W. Determination of tensile strength and fracture toughness of concrete using notched 3-p-b specimens. Eng. Fract. Mech. 2016, 160, 67–77. [Google Scholar] [CrossRef]
- Tada, H.; Paris, P.; Irwin, G. The Stress Analysis of Cracks Handbook; Wiley: Hoboken, NJ, USA, 2000. [Google Scholar]
- Xu, S.; Reinhardt, H. Determination of double-K criterion for crack propagation in quasi-brittle fracture, Part III: Compact tension specimens and wedge splitting specimens. Int. J. Fract. 1999, 98, 179–193. [Google Scholar] [CrossRef]
- Irwin, G. Analysis of stresses and strains near the end of a crack traversing a plate. J. Appl. Mech. 1957, 24, 361–364. [Google Scholar]
- Gao, X. Modelling of Nominal Strength Prediction for Quasi-Brittle Materials. Application to Discrete Element Modelling of Damage and Fracture of Asphalt Concrete Under Fatigue Loading. Ph.D. Thesis, Université de Strasbourg, Strasbourg, France, 2017. [Google Scholar]
- Cusatis, G.; Schauffert, E. Cohesive crack analysis of size effect. Eng. Fract. Mech. 2009, 76, 2163–2173. [Google Scholar] [CrossRef]
- Yu, Q.; Le, J.; Hoover, C.; Bažant, Z. Problems with Hu-Duan boundary effect model and its comparison to size-shape effect law for quasi-brittle fracture. J. Eng. Mech. 2009, 136, 40–50. [Google Scholar] [CrossRef]
© 2019 by the authors. Licensee MDPI, Basel, Switzerland. This article is an open access article distributed under the terms and conditions of the Creative Commons Attribution (CC BY) license (http://creativecommons.org/licenses/by/4.0/).