1. Introduction
Non-destructive thickness measurements [
1] play an increasingly important role in industrial quality control, cost management and process monitoring. In automotive manufacturing, the correct structure of paint and coating layers determines not only the overall aesthetics, but also resistance to UV radiation damage and corrosion. In pharmaceuticals, tablet coatings regulate the release of the drug inside the body. In polymer extrusion, precise thickness measurements can reduce costs while ensuring an uncompromised product quality. All of these industrial applications require a measurement technique that is intrinsically safe, accurate to the micrometer level, and capable of resolving multi-layered samples. Above all, the gauging system needs to be inherently fast, providing at least 1000 thickness readings per second, to match the standard set by alternative methods such as eddy current devices [
2].
Initial work on terahertz-based thickness measurements dates back to the 1990s [
3,
4], when Duvillaret et al. investigated methods for the extraction of optical constants (i.e., the complex refractive index of samples) via thickness assessments. Subsequent works focused on introducing new algorithms for the extraction of material parameters [
5,
6,
7], on paint thickness [
8,
9,
10] and coating layer [
11,
12] gauging, and on the identification of concealed defects [
13].
Most of the work accomplished to-date made use of conventional terahertz TDS systems [
14]. A standard TDS system employs a femtosecond laser, with the laser beam being split in two paths. The first pulse train illuminates the emitter—usually a photoconductive antenna—and generates terahertz radiation. The terahertz pulses interact with the sample and arrive at the receiver side, where they are superimposed with the second laser pulse train. In order to “readout” the terahertz pulses, the second laser pulse train is time-shifted with the help of a mechanical delay stage.
For a delay length of several 100 picoseconds, the measurement speed of conventional systems ranges from a few to few 100 terahertz pulse traces per second [
15,
16,
17], and thus falls short of the requirements for high-speed monitoring.
In order to overcome the bottleneck in terms of measurement speed, two faster terahertz TDS concepts have been proposed: asynchronous optical sampling (ASOPS) [
18,
19,
20] and, more recently, ECOPS [
21,
22,
23]. Both techniques operate without a mechanical delay, and have proven capable of recording more than 1000 terahertz pulse traces per second.
ASOPS, in brief, employs two pulsed lasers with fixed, albeit slightly different repetition rates. The time delay between the two lasers varies periodically between zero and the inverse repetition rate. Consequently, the time needed to acquire a complete terahertz trace depends on the difference between the two repetition rates. If a sufficiently large difference is chosen, the measurement speed can amount to several thousand scans per second. However, there are several limitations for the use of ASPOS in ”real-world” applications. First, femtosecond fiber lasers in the telecom wavelength regime of 1.5 µm—the workhorses in most of today’s terahertz TDS systems [
15,
24]—have typical repetition rates between 250 MHz and 40 MHz. Using these lasers for ASOPS would lead to unnecessarily long scan ranges from 4 ns to 25 ns, i.e., most of the measurement time would be wasted. Lasers with GHz repetition rates can, in principle, reduce the amount of “dead time”, yet these repetition rates call for more complex Ti:sapphire systems [
20,
25]. The use of Ti:sapphire lasers, in turn, changes the optical wavelength to ~0.8 µm, which complicates pulse transmission through optical fibers. Either way, any ASOPS system that measures 1000 (or more) traces per second with nanosecond scan ranges requires transimpedance amplifiers and data acquisition electronics of an extremely high bandwidth (hundreds of MHz to several GHz). Not only does this bandwidth range have detrimental effects on the SNR, but it also drives the size and price of the system.
ECOPS, likewise, employs two femtosecond lasers. In contrast to ASOPS, however, only one laser has a fixed repetition rate. The repetition rate of the second laser is tunable, and is modulated around that of the first laser. The net effect is equal to a mechanical delay, just significantly faster, with data acquisition rates well in the kHz range [
23]. Scan range and scanning speed can be selected according to the requirement of the experiment. Kim et al. demonstrated that ECOPS achieved a better dynamic range than ASOPS at the same measurement speed, or vice versa, a drastically (~50x) higher measurement speed for the same dynamic range [
22]. Recently, the same group applied an ECOPS system to three-dimensional terahertz imaging [
26]. In this work, we demonstrate the usage of ECOPS for terahertz-based thickness measurements at unprecedented speed.
In the following sections of this paper, we first describe the ECOPS setup and its main components. We then discuss the system performance in terms of time-domain dynamic range, signal-to-noise ratio and terahertz bandwidth, including the effect of pulse-trace averaging and the interplay between measurement speed and scan range. Finally, we apply our ECOPS instrument to thickness measurements of a piece of a silicon wafer, and compare the results to values obtained with a conventional TDS system and with a mechanical micrometer gauge. Simulating the scenario of an industrial production line, we examine the aforementioned wafer with the sample itself moving at 700 mm/s.
2. Instrumentation
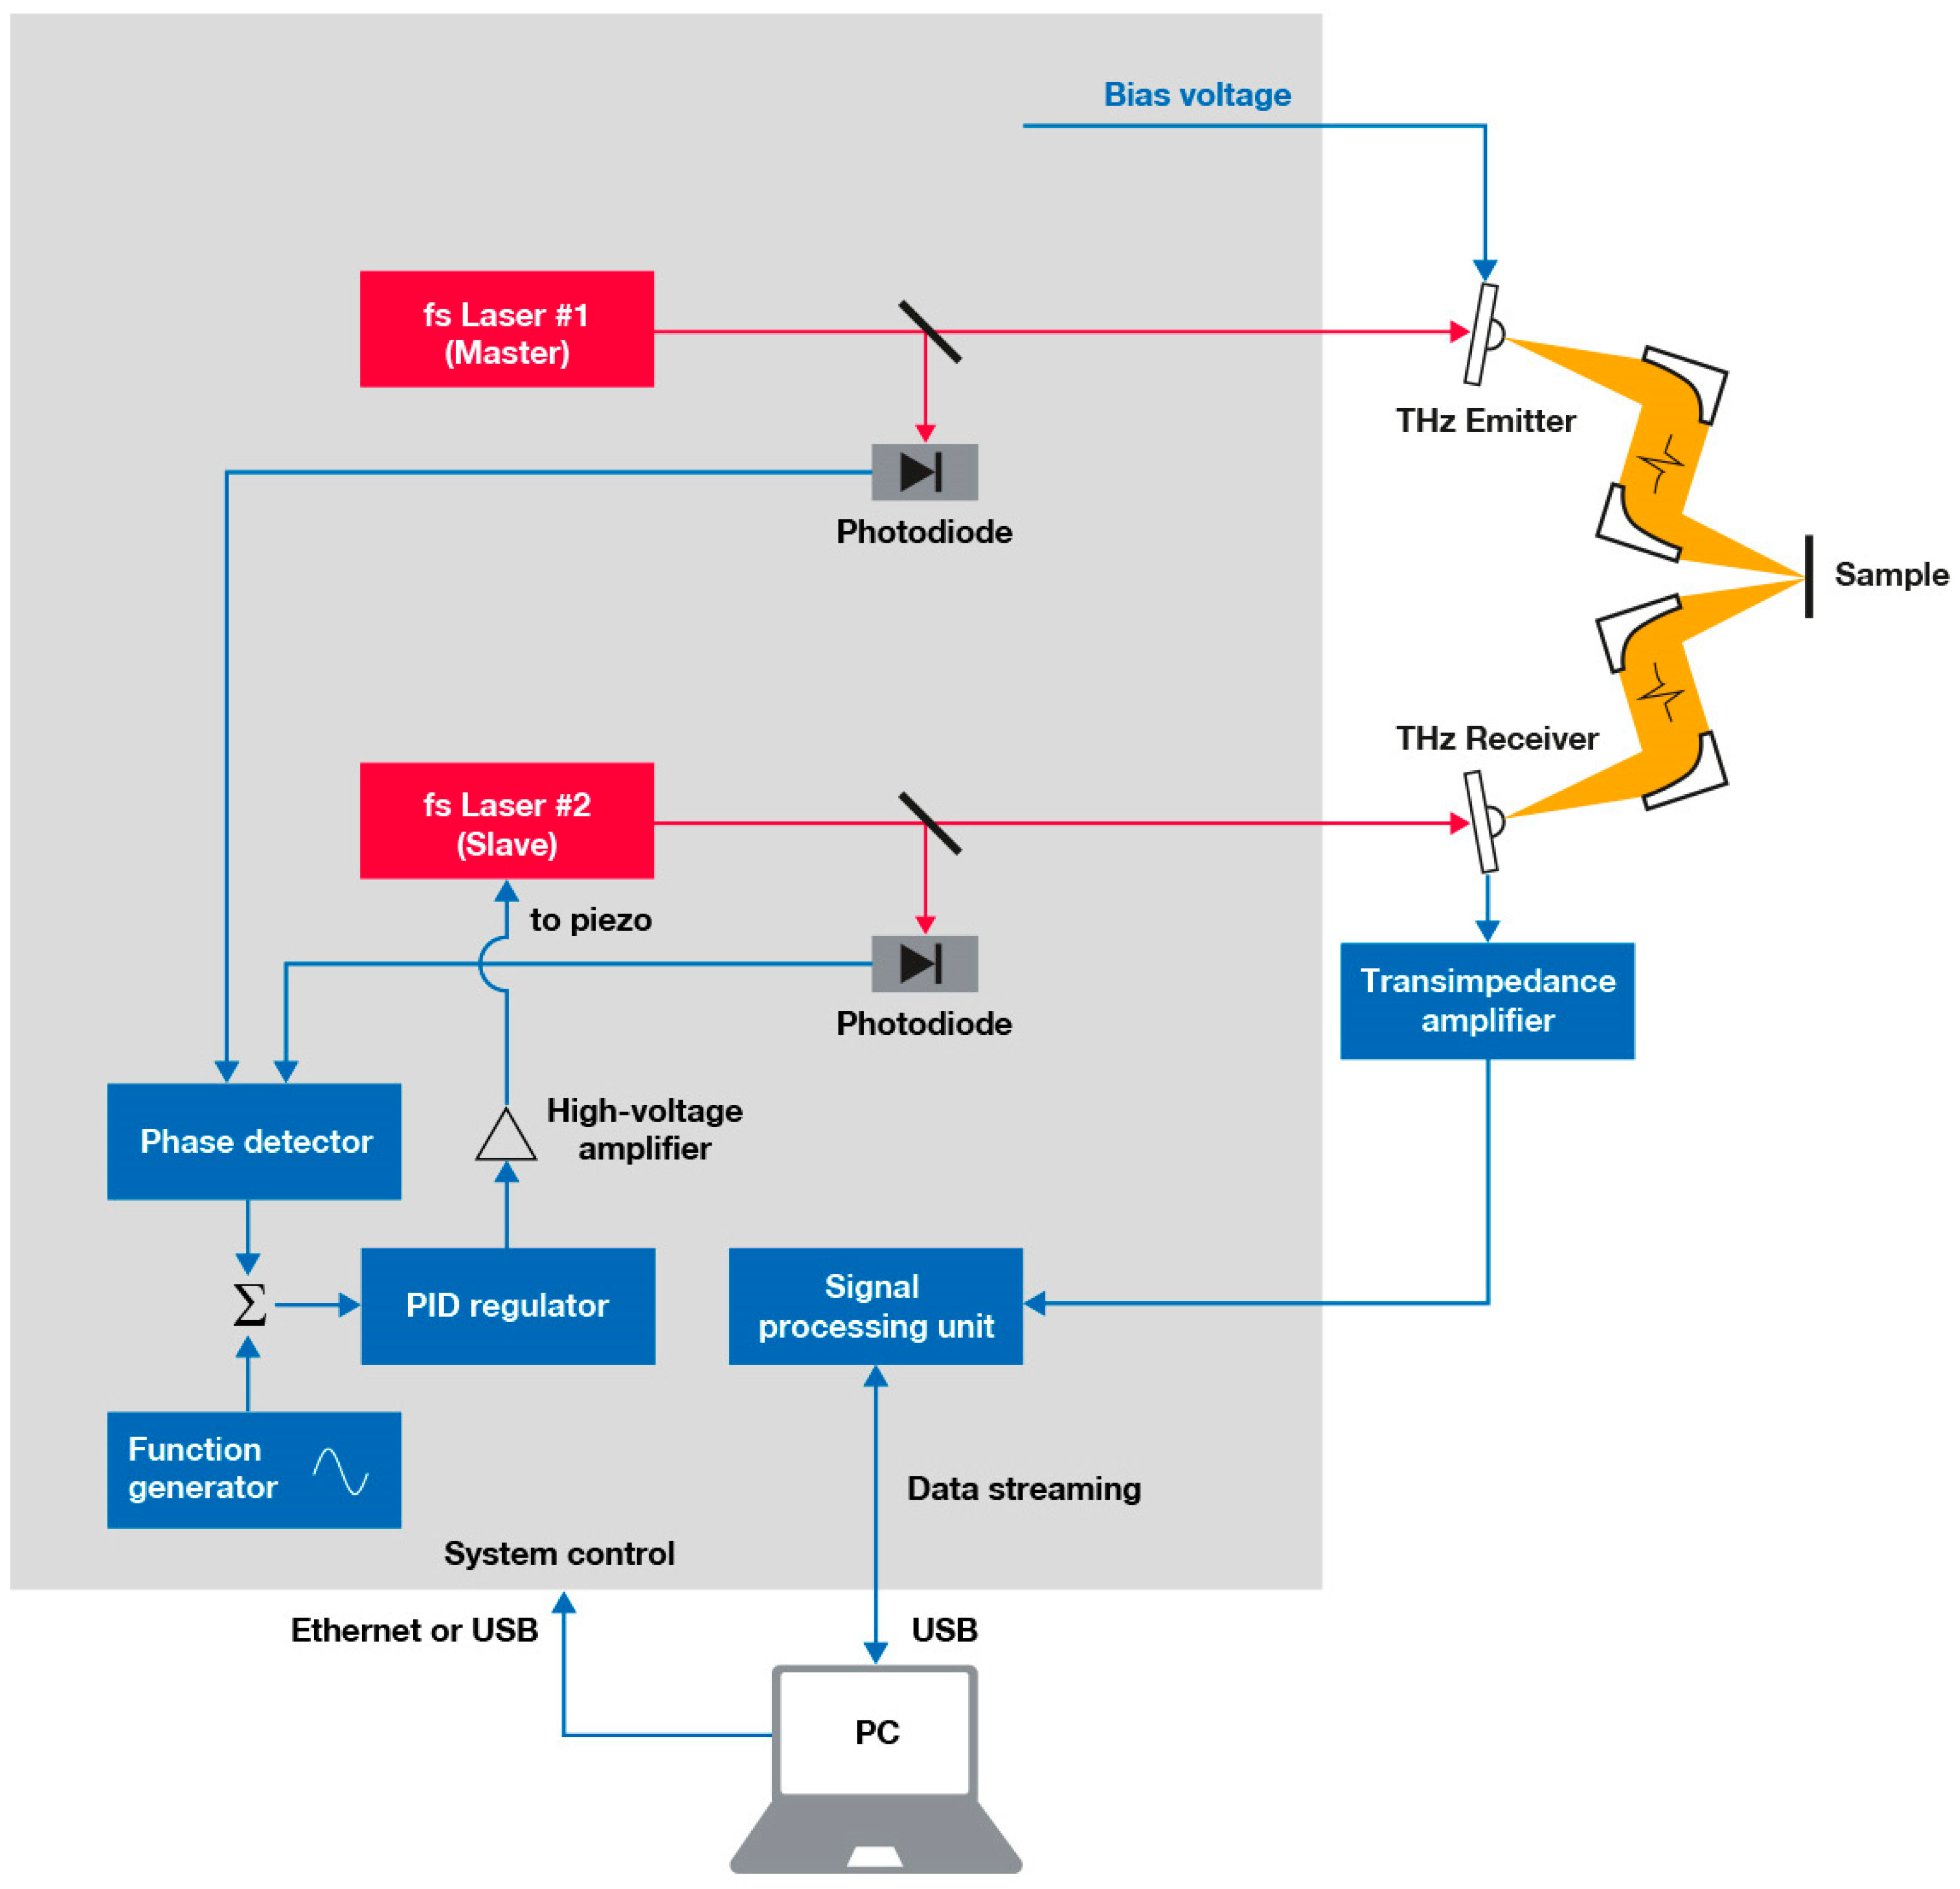
Figure 1 illustrates the measurement scheme of our ECOPS system. The setup employs two passively mode-locked femtosecond lasers with an emission wavelength around 1560 nm, a repetition rate of 80 MHz and a pulse width of less than 80 fs. The incident power on the terahertz antennas is about 25 mW.
One of the lasers (“Master”) has a fixed cavity length and therefore a fixed repetition rate. The other laser (“Slave”) has a tunable repetition rate, realized by including a short free-space path in the cavity, where light is coupled out of the fiber and back-reflected by a mirror attached to a piezo actuator. Each laser features a photodiode, which converts a fraction of the optical pulses to electronic signals. These signals are further processed in a phase detector, which generates a voltage output proportional to the phase difference between the pulse trains of master and slave. A proportional-integral-derivative (PID) controller regulates this voltage signal to zero by acting on the piezo in the slave cavity. In this way, the pulse train of the slave laser is phase-locked to that of the master laser. An additional modulation signal introduces a sinusoidal variation of the phase difference between the two pulse trains and thus generates the intended “delay-stage” effect.
The system further includes photoconductive switches (Fraunhofer Heinrich-Hertz-Institute, Berlin, Germany) for terahertz generation and detection. Their semiconductor composition is based on an InAlAs/InGaAs heterostructure [
27,
28], with the emitter being iron doped [
29]. The emitter features a strip-line antenna geometry with a 25 µm gap; the receiver incorporates a 25 µm dipole antenna with a 10 µm gap. The antennas are packaged in compact housings (25 mm diameter), which include a silicon lens on the output side, as well as SM/PM fiber pigtails for the laser light.
For signal readout and data acquisition, we use a transimpedance amplifier with a bandwidth of 3.5 MHz and gain of 106 V/A (model DHPCA-100, Femto Messtechnik, Berlin, Germany), and a digital oscilloscope (Picoscope 4262, Pico Technology, St. Neots, UK).
All of the thickness measurements described in this work utilize a reflection setup, with the sample placed at the focus of the terahertz beam. The angle of incidence is 8° and the terahertz spot size is approximately 2.5 mm.
3. System Characterization
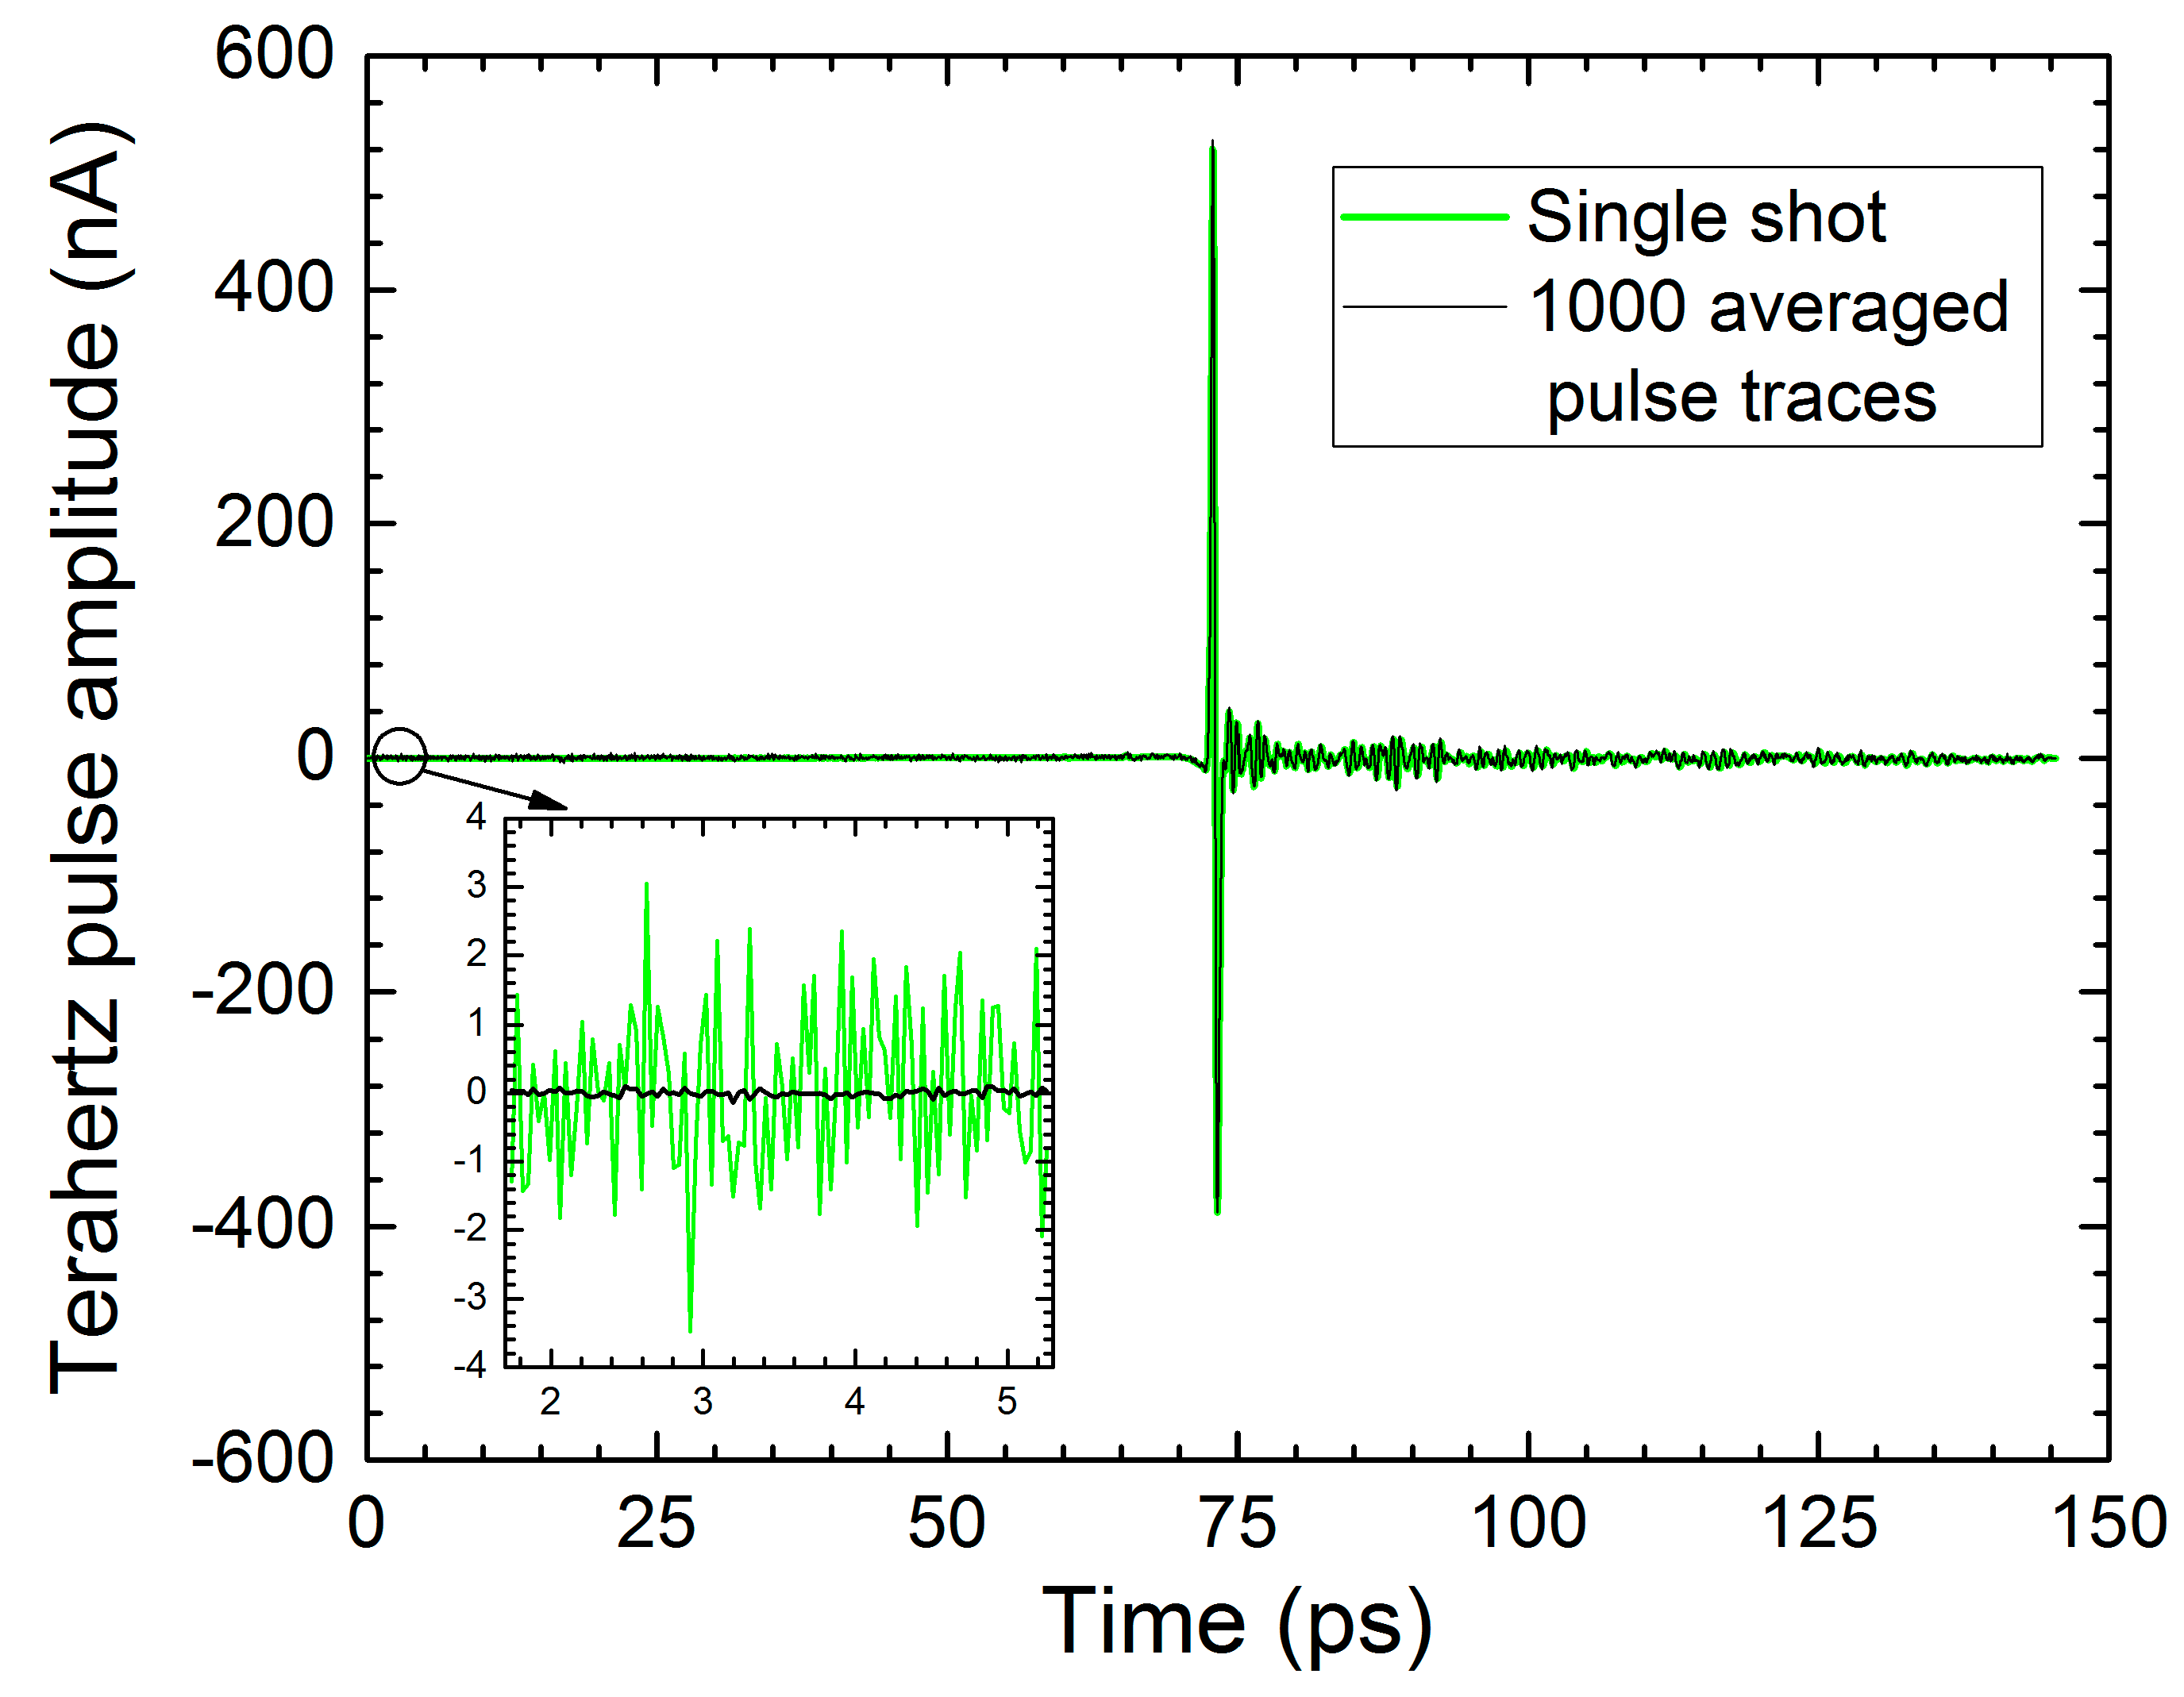
Figure 2 depicts the time-domain trace of a single-shot measurement acquired at maximum speed, i.e., completed within 625 µs (green curve), together with an average of 1000 pulse traces (black). While the main pulses appear virtually indistinguishable, the averaged trace exhibits a significantly reduced noise floor, which is particularly evident in the pre-pulse background signal (inset).
Terahertz-based thickness gauging almost always relies on an evaluation of time-domain traces. A crucial parameter to quantify system performance is thus the time-domain dynamic range (TD-DR), defined as the maximum peak-to-peak amplitude of the pulse trace divided by the root mean square (RMS) of the noise floor [
30,
31,
32]:
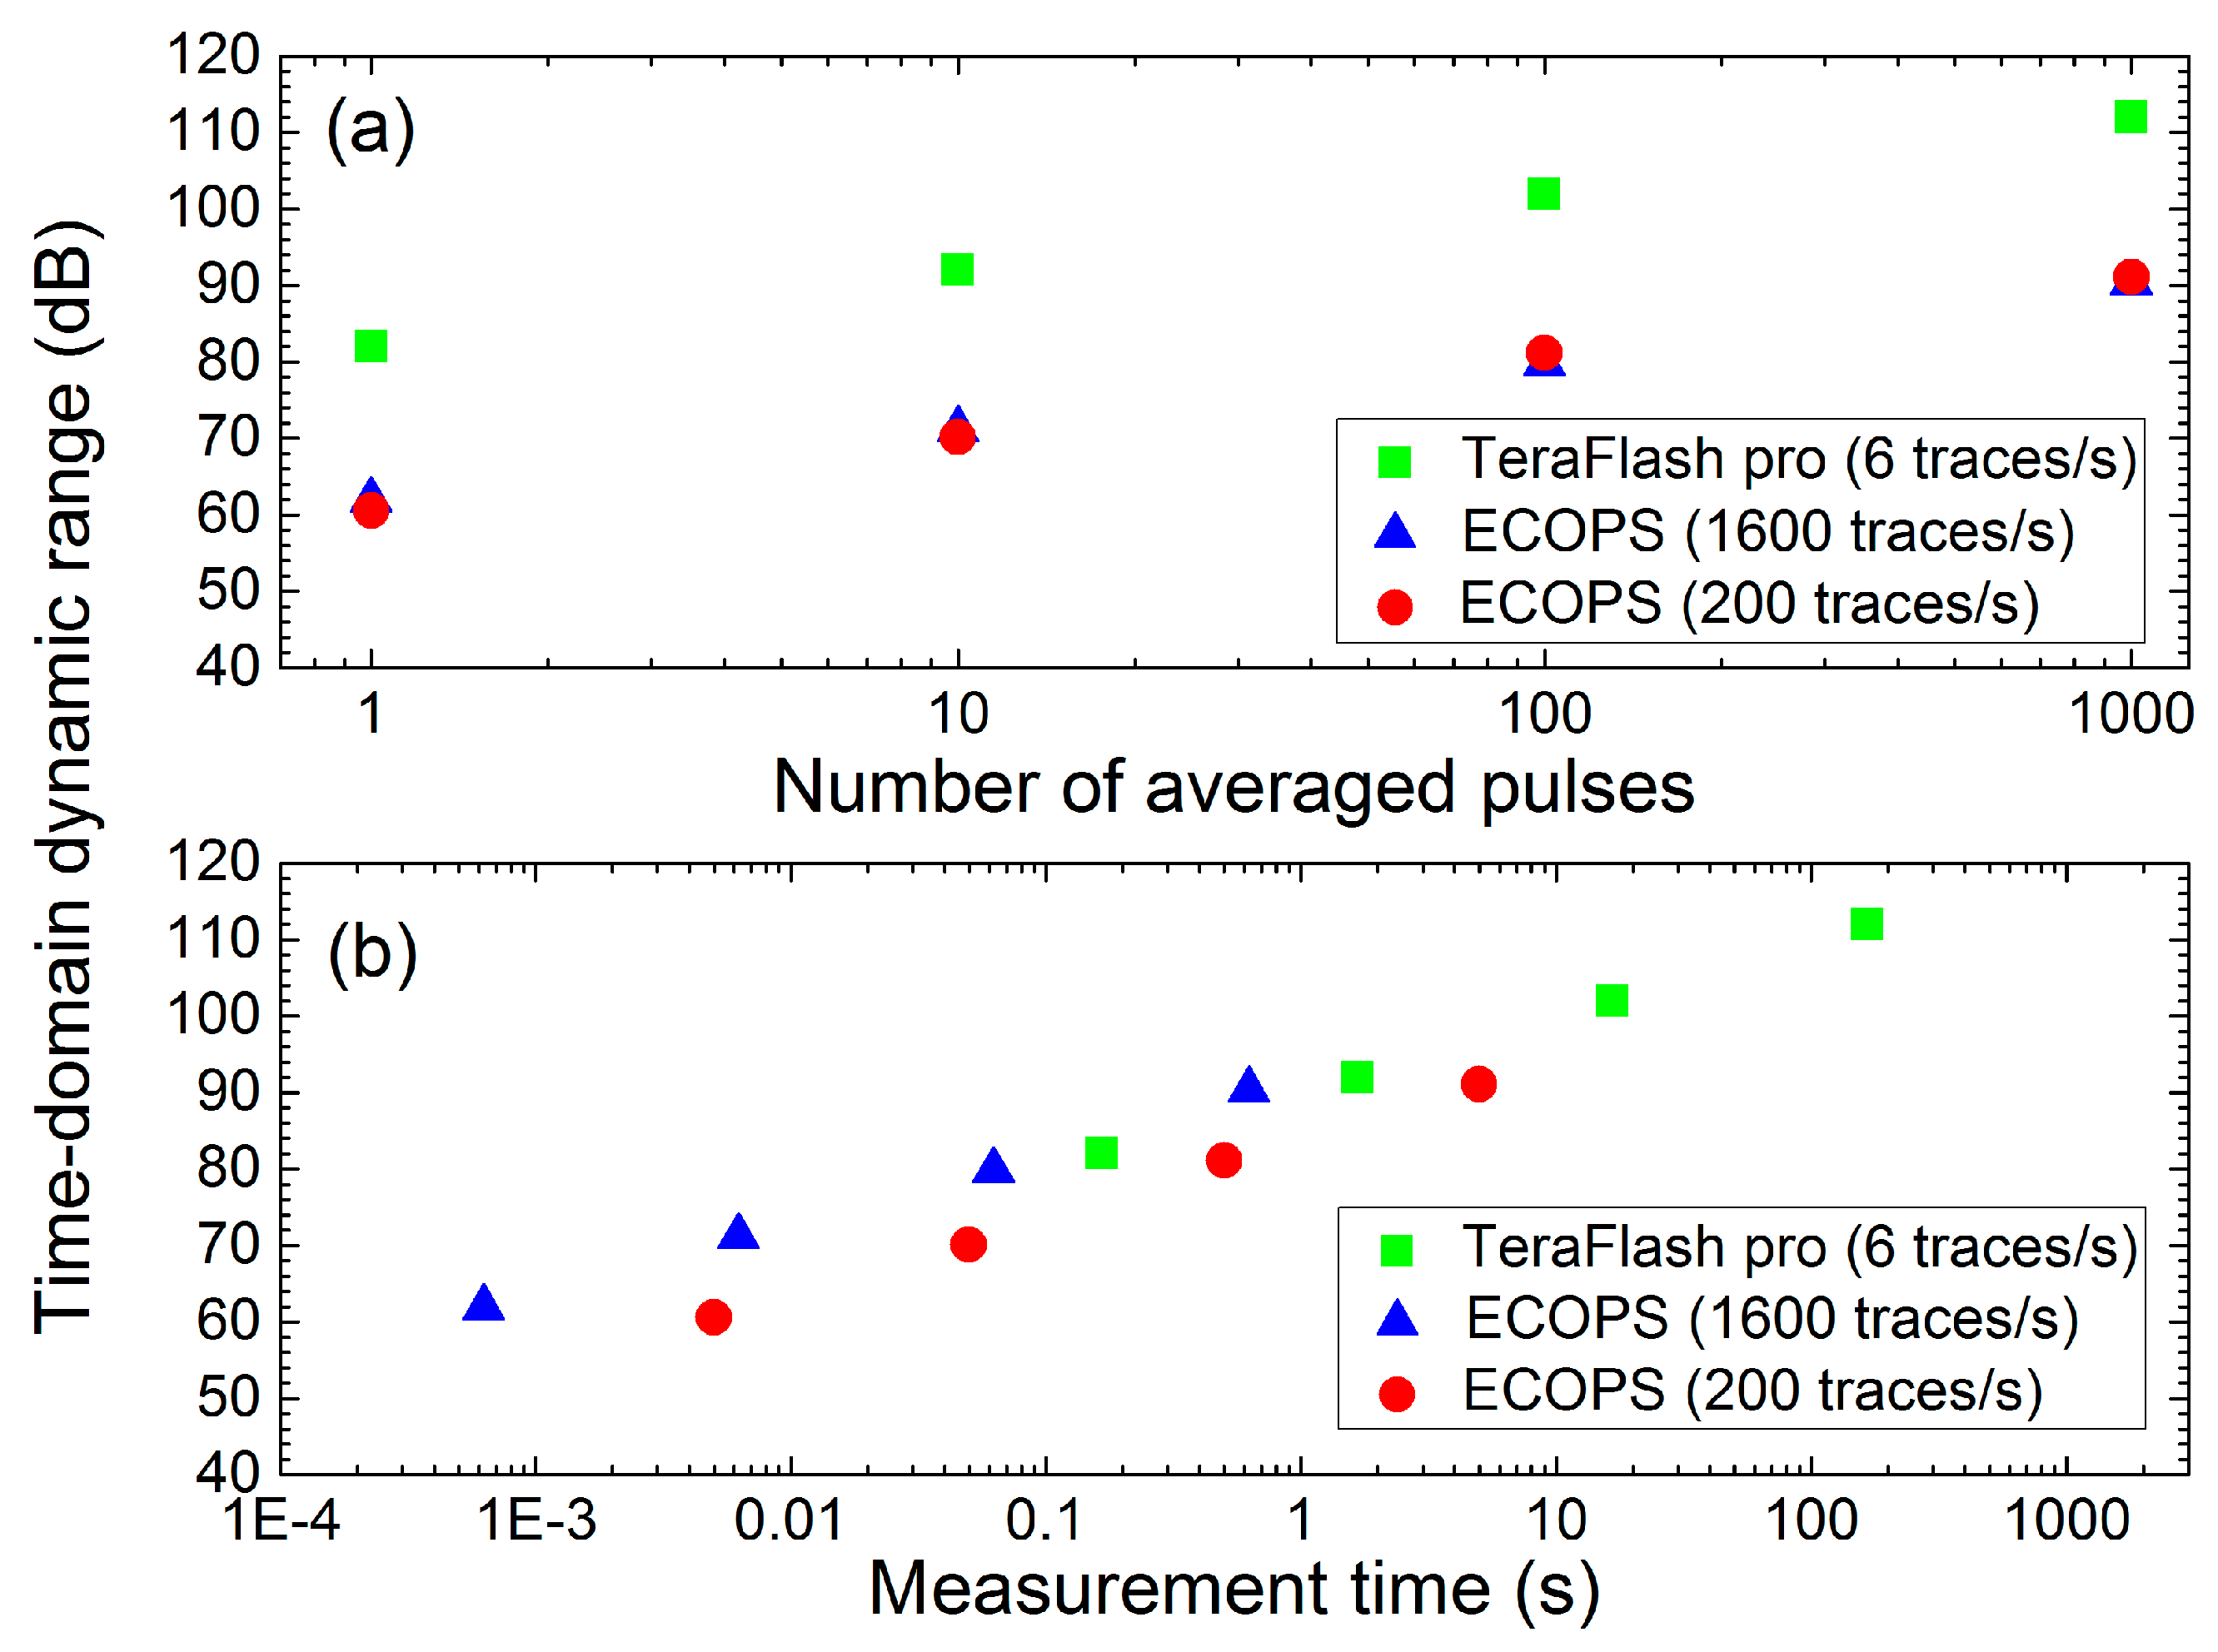
Figure 3a shows the TD-DR of the ECOPS instrument at its maximum measurement speed (200 ps scan range @ 1600 Hz, blue triangles) and for the slowest setting (700 ps @ 200 Hz, red circles). As a benchmark, we have included values obtained with a state-of-the-art terahertz TDS system (“TeraFlash pro”, TOPTICA Photonics AG), with its mechanical delay adjusted to a comparable scan range (200 ps @ 6 Hz, green squares). For each setting, we have evaluated both single-shot measurements as well as 10, 100 and 1000 trace averages. The single-shot TD-DR of the ECOPS system amounts to 61 dB (=20 × log (TD-DR)), independent of the measurement speed. This agreement is expected, since the slower measurement covers a larger scan range (see below) and consequently, overall data rates and thus, electrical bandwidth requirements are comparable. By contrast, the TeraFlash pro achieves a TD-DR of 82 dB, significantly higher than that of the ECOPS system. We attribute this difference to two decisive characteristics of the design: First, the TeraFlash pro benefits from an extremely precise mechanical delay [
15], the low timing jitter of which translates into an excellent signal quality. Even more important, the slower measurement speed of the TeraFlash pro permits the use of (comparatively) low-bandwidth—and hence, low-noise—electronics for signal readout. Both effects contribute to the high TD-DR, as evident from
Figure 3a.
Averaging multiple time traces, the TD-DR is expected to scale with the number of averages
Nave according to:
Indeed, we find that averages of 10, 100, and 1000 terahertz pulse traces increase the TD-DR of the ECOPS system by approximately 10 dB, 20 dB and 30 dB, respectively. A similar signal gain is observed for the TeraFlash pro, too.
Figure 3b rearranges the same data as a function of the measurement time. In this regard, the ECOPS setup actually outperforms the TeraFlash pro, achieving a TD-DR of 91 dB in less than one second. We will return to the trade-off between signal quality and measurement speed in
Section 4.
A complementary parameter in practical applications is the time-domain signal-to-noise ratio (TD-SNR), which characterizes the minimum signal change that can still be quantified. The TD-SNR is defined as the ratio of the mean peak-to-peak amplitude and its standard deviation [
30,
31,
32]:
Figure 4a compares TD-SNR values of the ECOPS system at 1600 Hz and 200 Hz to values obtained with the TeraFlash pro. As before, we present values for single-shot measurements and 10, 100 and 1000 averages. Since a single measurement does not have any standard deviation, we calculate the TD-SNR from 10 consecutive runs, and apply the same method to the averaged data (for instance, the TD-SNR value for 100 averages is calculated from 10 runs, each run comprising 100 averaged time traces). We find that TD-SNR values from 10 single-shot runs amount to 50 dB and 55 dB for ECOPS at 1600 Hz and 200 Hz, respectively, and 74 dB for the TeraFlash pro. Akin to the TD-DR, we find that a factor of 10 in the number of averages improves the TD-SNR by ~10 dB, in agreement with refs [
30,
31,
32]. Whilst the higher TD-SNR values of the TeraFlash pro are expected, the difference between the two datasets obtained with ECOPS is still subject to further investigation. Tentatively, the higher measurement speed (1600 Hz as compared to 200 Hz) results in an increased timing jitter, which has no effect on the background noise (cf.
Figure 3) but on the reproducibility of the signal amplitude and consequently, the TD-SNR.
Figure 4b depicts the same TD-SNR data as a function of the measurement time. Viewed that way, the performance of the different systems is comparable: they all achieve similar TD-SNR values in the same measurement time.
Yet another relevant parameter for terahertz TDS systems is the spectral bandwidth.
Figure 5 shows terahertz power spectra, calculated by a fast Fourier transform of time traces obtained with our ECOPS setup at 1600 Hz. In a single-shot measurement, the system achieves a peak dynamic range (PDR) of 38 dB and the signal reaches the noise floor at 3.4 THz. All of the dips observed in the spectrum correspond to literature values of water vapor absorption lines, as documented in the HITRAN database [
33]. With 1000 averages, the PDR increases to 68 dB and the detectable signal extends to ~4.8 THz, still within a measurement time of only 0.6 s. Please note that the number of averages affects the spectral bandwidth but not the resolution, which only depends on the scan range.
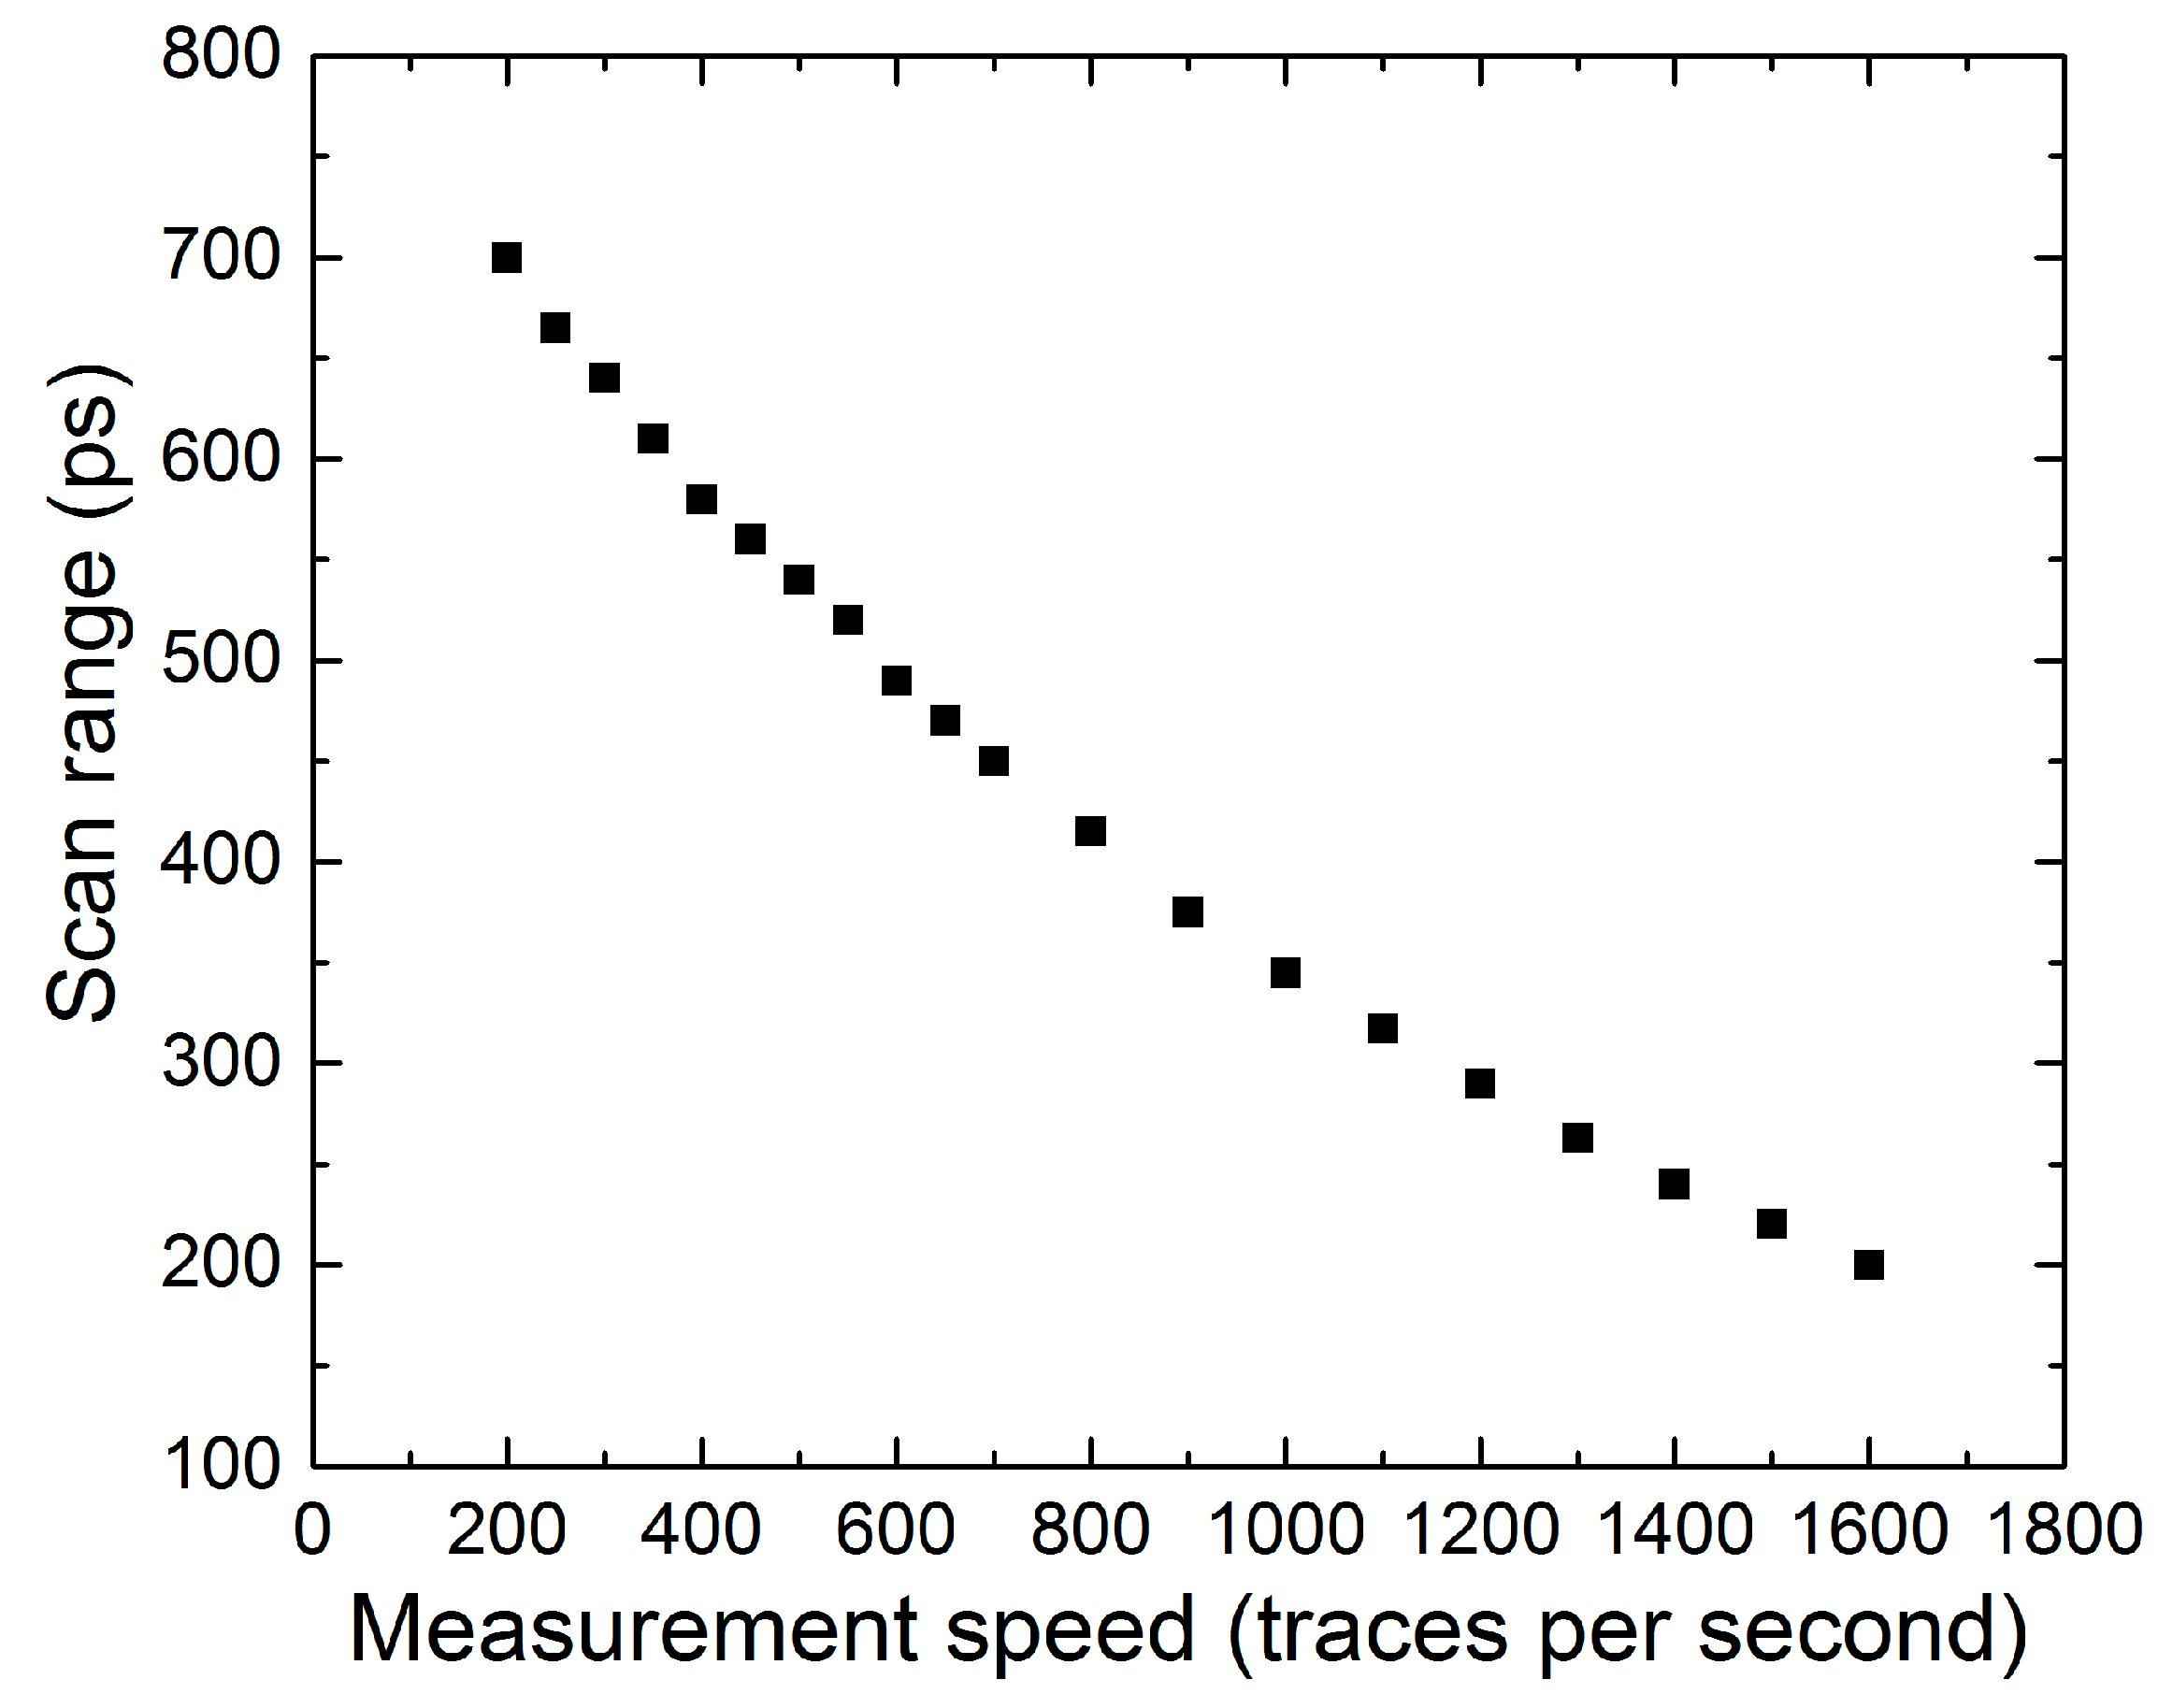
Figure 6 illustrates the interplay between the scan range and the measurement speed of our ECOPS instrument. Depending on the experimental requirements, the measurement speed can be flexibly selected between 200 and 1600 terahertz pulse traces per second. The increase in measurement speed is achieved by reducing the travel of the piezo in the slave-laser cavity, corresponding to a reduction of the scan range. Set to the lowest speed, the ECOPS system achieves a scan range of about 700 ps. This large range enables the assessment of thick structures (~7 cm in reflection, assuming a double pass through a sample with refractive index of 1.5), or spectroscopic measurements with high resolution (~1.4 GHz). Even at this speed, the system still exceeds the limits of our conventional TDS system by a factor of ~5. Vice versa, at maximum speed, the scan range of the ECOPS system amounts to 200 ps. The ECOPS technology is then ~40 times faster than our state-of-the-art TDS unit with mechanical delay.
4. Thickness Gauging
In order to investigate the precision of the ECOPS TDS system in thickness measurements, we chose a piece of an un-doped wafer of high-resistivity silicon (CrysTec GmbH, Berlin, Germany) as our sample. The silicon wafer has negligible dispersion, negligible absorption [
34] and two plane-parallel surfaces. Owing to the high refractive index of the material (
n ~ 3.4), both the front and the back surface of the wafer strongly reflect the incident terahertz pulses. We extract the sample thickness via time-of-flight measurements, i.e., from the time difference between the zero-crossings of the pulse “echoes” from either side.
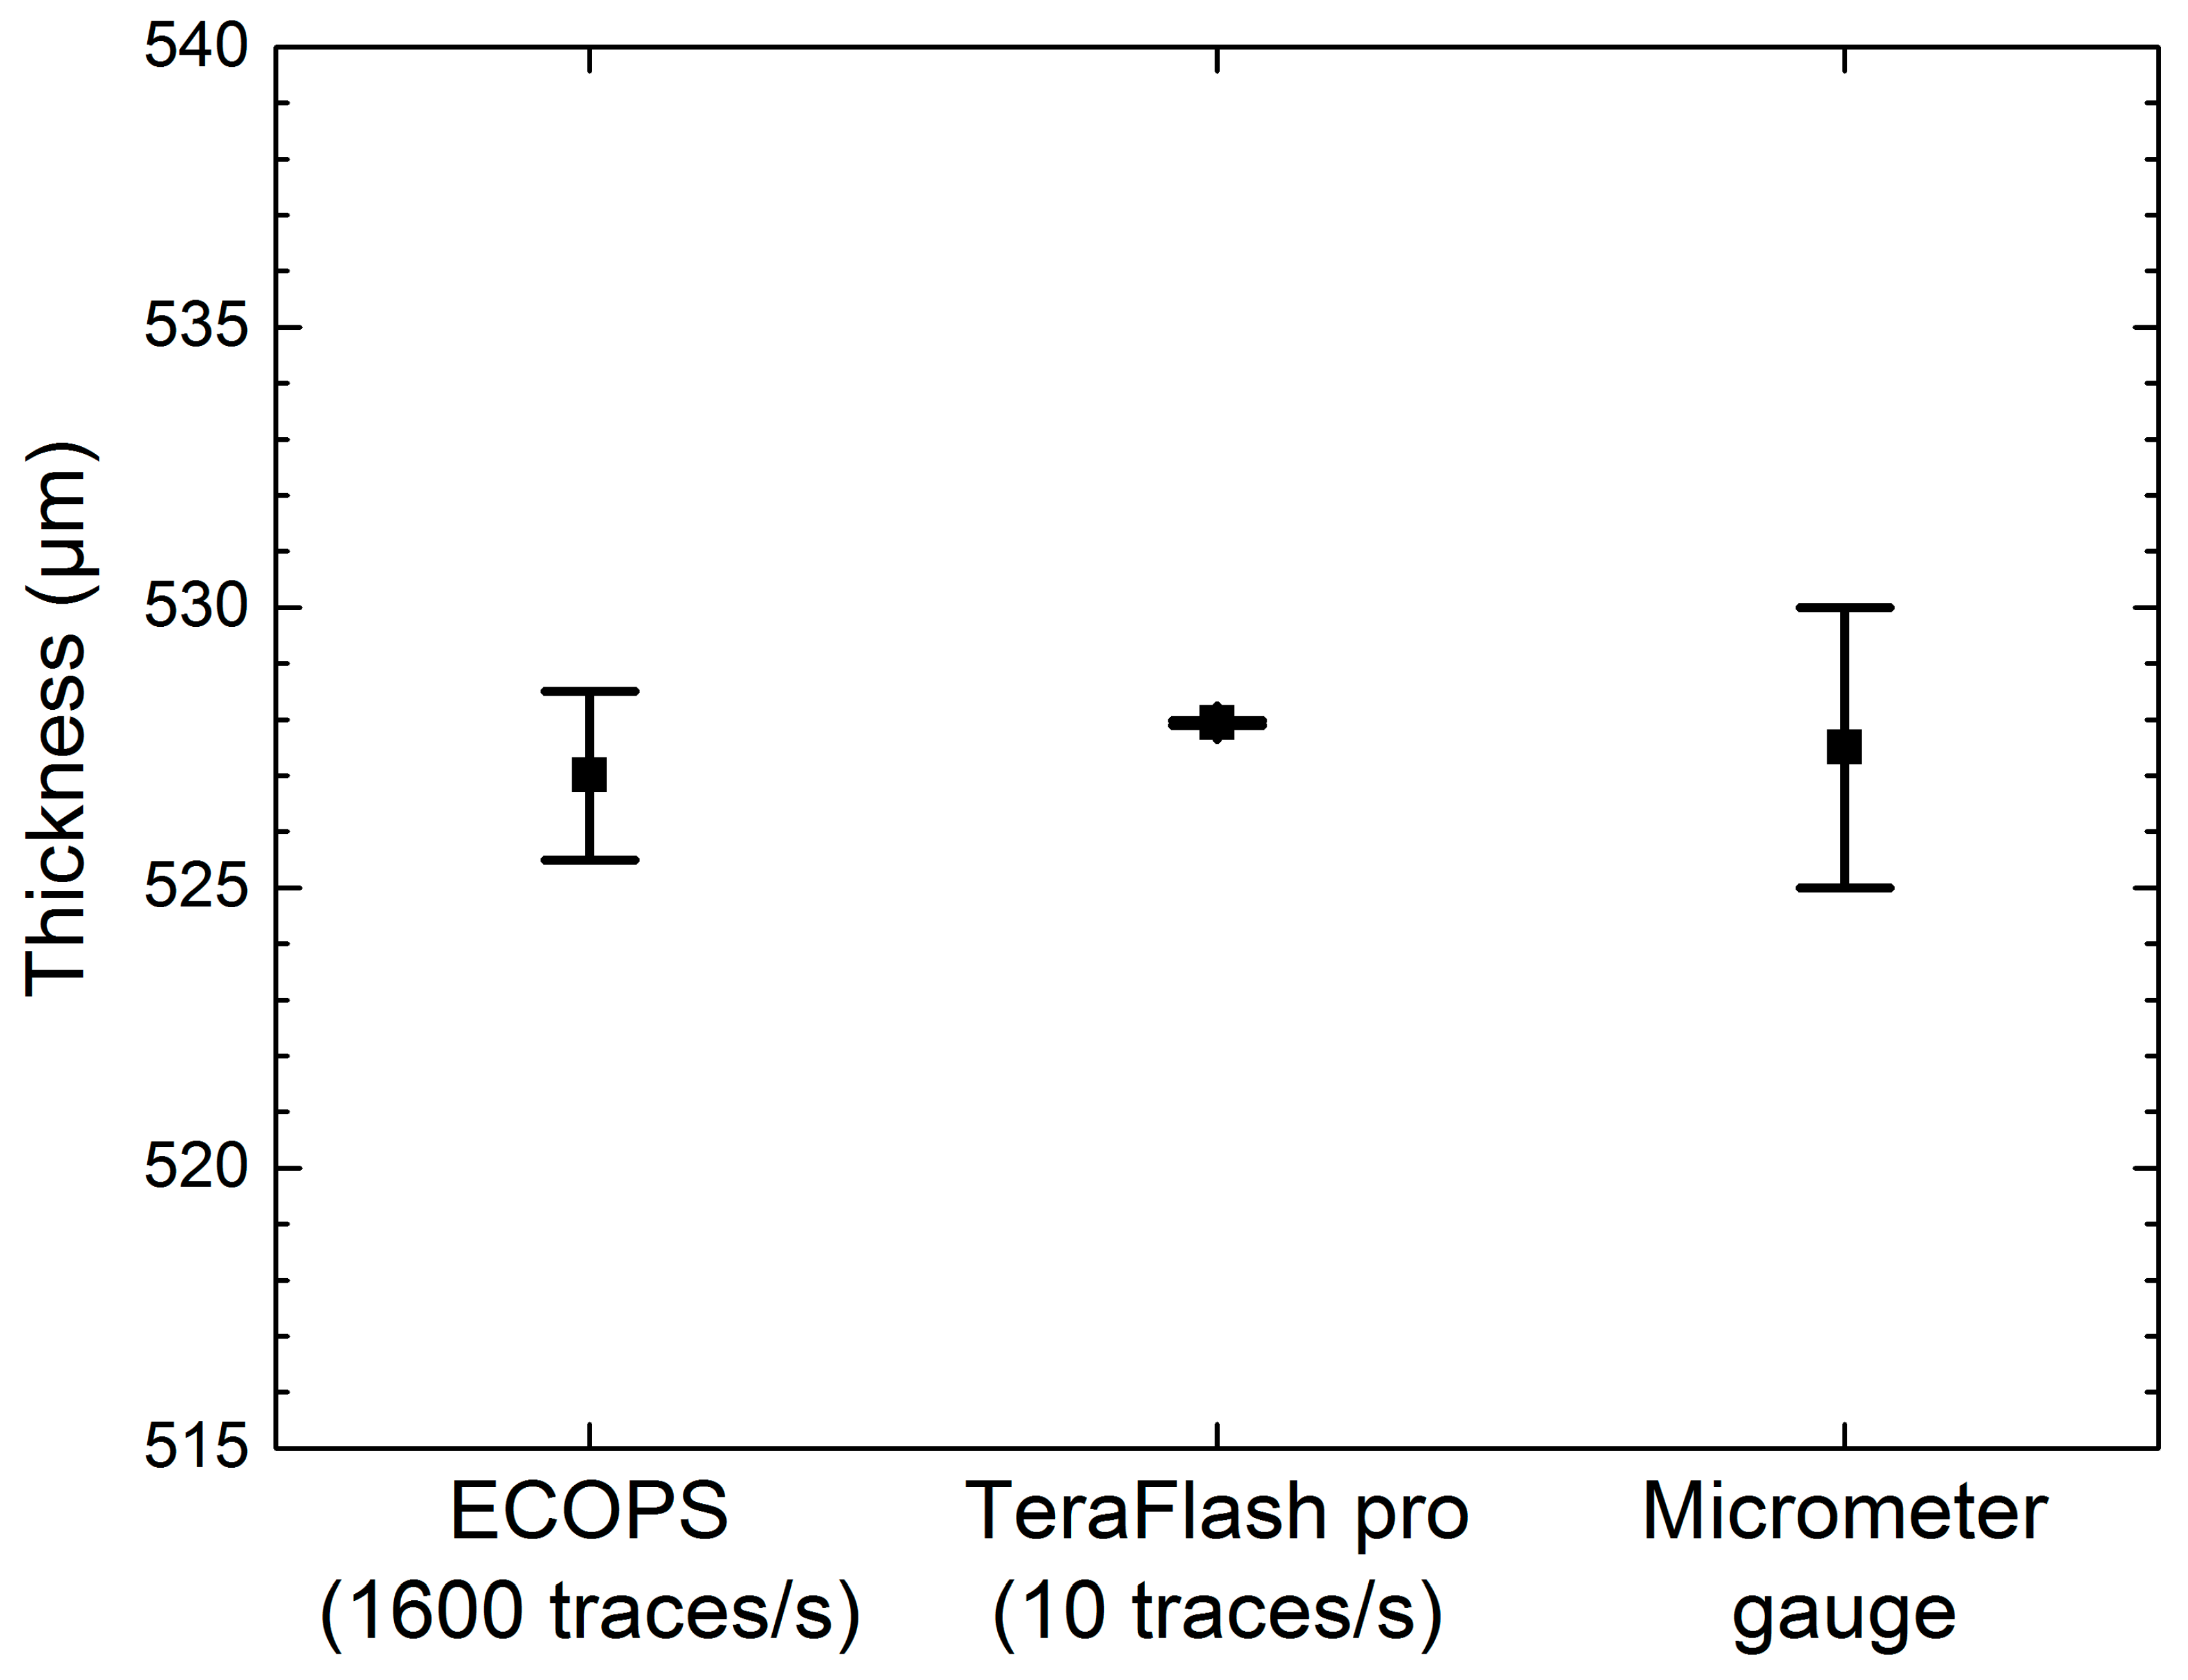
Figure 7 presents the results of thickness measurements carried out with the ECOPS TDS system (at 1600 pulse traces per second), the TeraFlash pro (measurement speed 10 traces per second), and a manual micrometer gauge (Holex 421505, Hoffmann GmbH, Munich, Germany).
In order to quantify the reproducibility of the thickness readings, we repeated the terahertz-based measurements 10,000 times both with ECOPS and the TeraFlash pro, and 50 times with the micrometer gauge. The error bars in
Figure 7 denote the standard deviation of the results. With ECOPS, the TeraFlash pro, and the micrometer gauge, we obtain thickness values of 527 ± 1.5 µm, 527.94 ± 0.04 µm, and 527.5 ± 2.5 µm, respectively. We find that all three methods yield consistent results within a 1-sigma error margin. Note, however, that the scatter of the TeraFlash pro results is approx. 40 times smaller than that of the ECOPS measurement. We attribute this to the difference in measurement speed between the two systems: the ECOPS system is 160 times faster, which comes at a cost in measurement accuracy. On the other hand, a repeatability on the 1 µm level is sufficient for the majority of industrial applications. Moreover, as shown in the previous section, averaging successive pulse traces offers a trade-off between measurement speed and accuracy. For instance, extracting thickness data from 10 averaged traces reduces the standard deviation to ~0.5 µm (corresponding to an increase in the TD-SNR by a factor of 3 ≈ 10 dB, see
Figure 4), yet the ECOPS system remains 16 times faster than the TeraFlash pro.
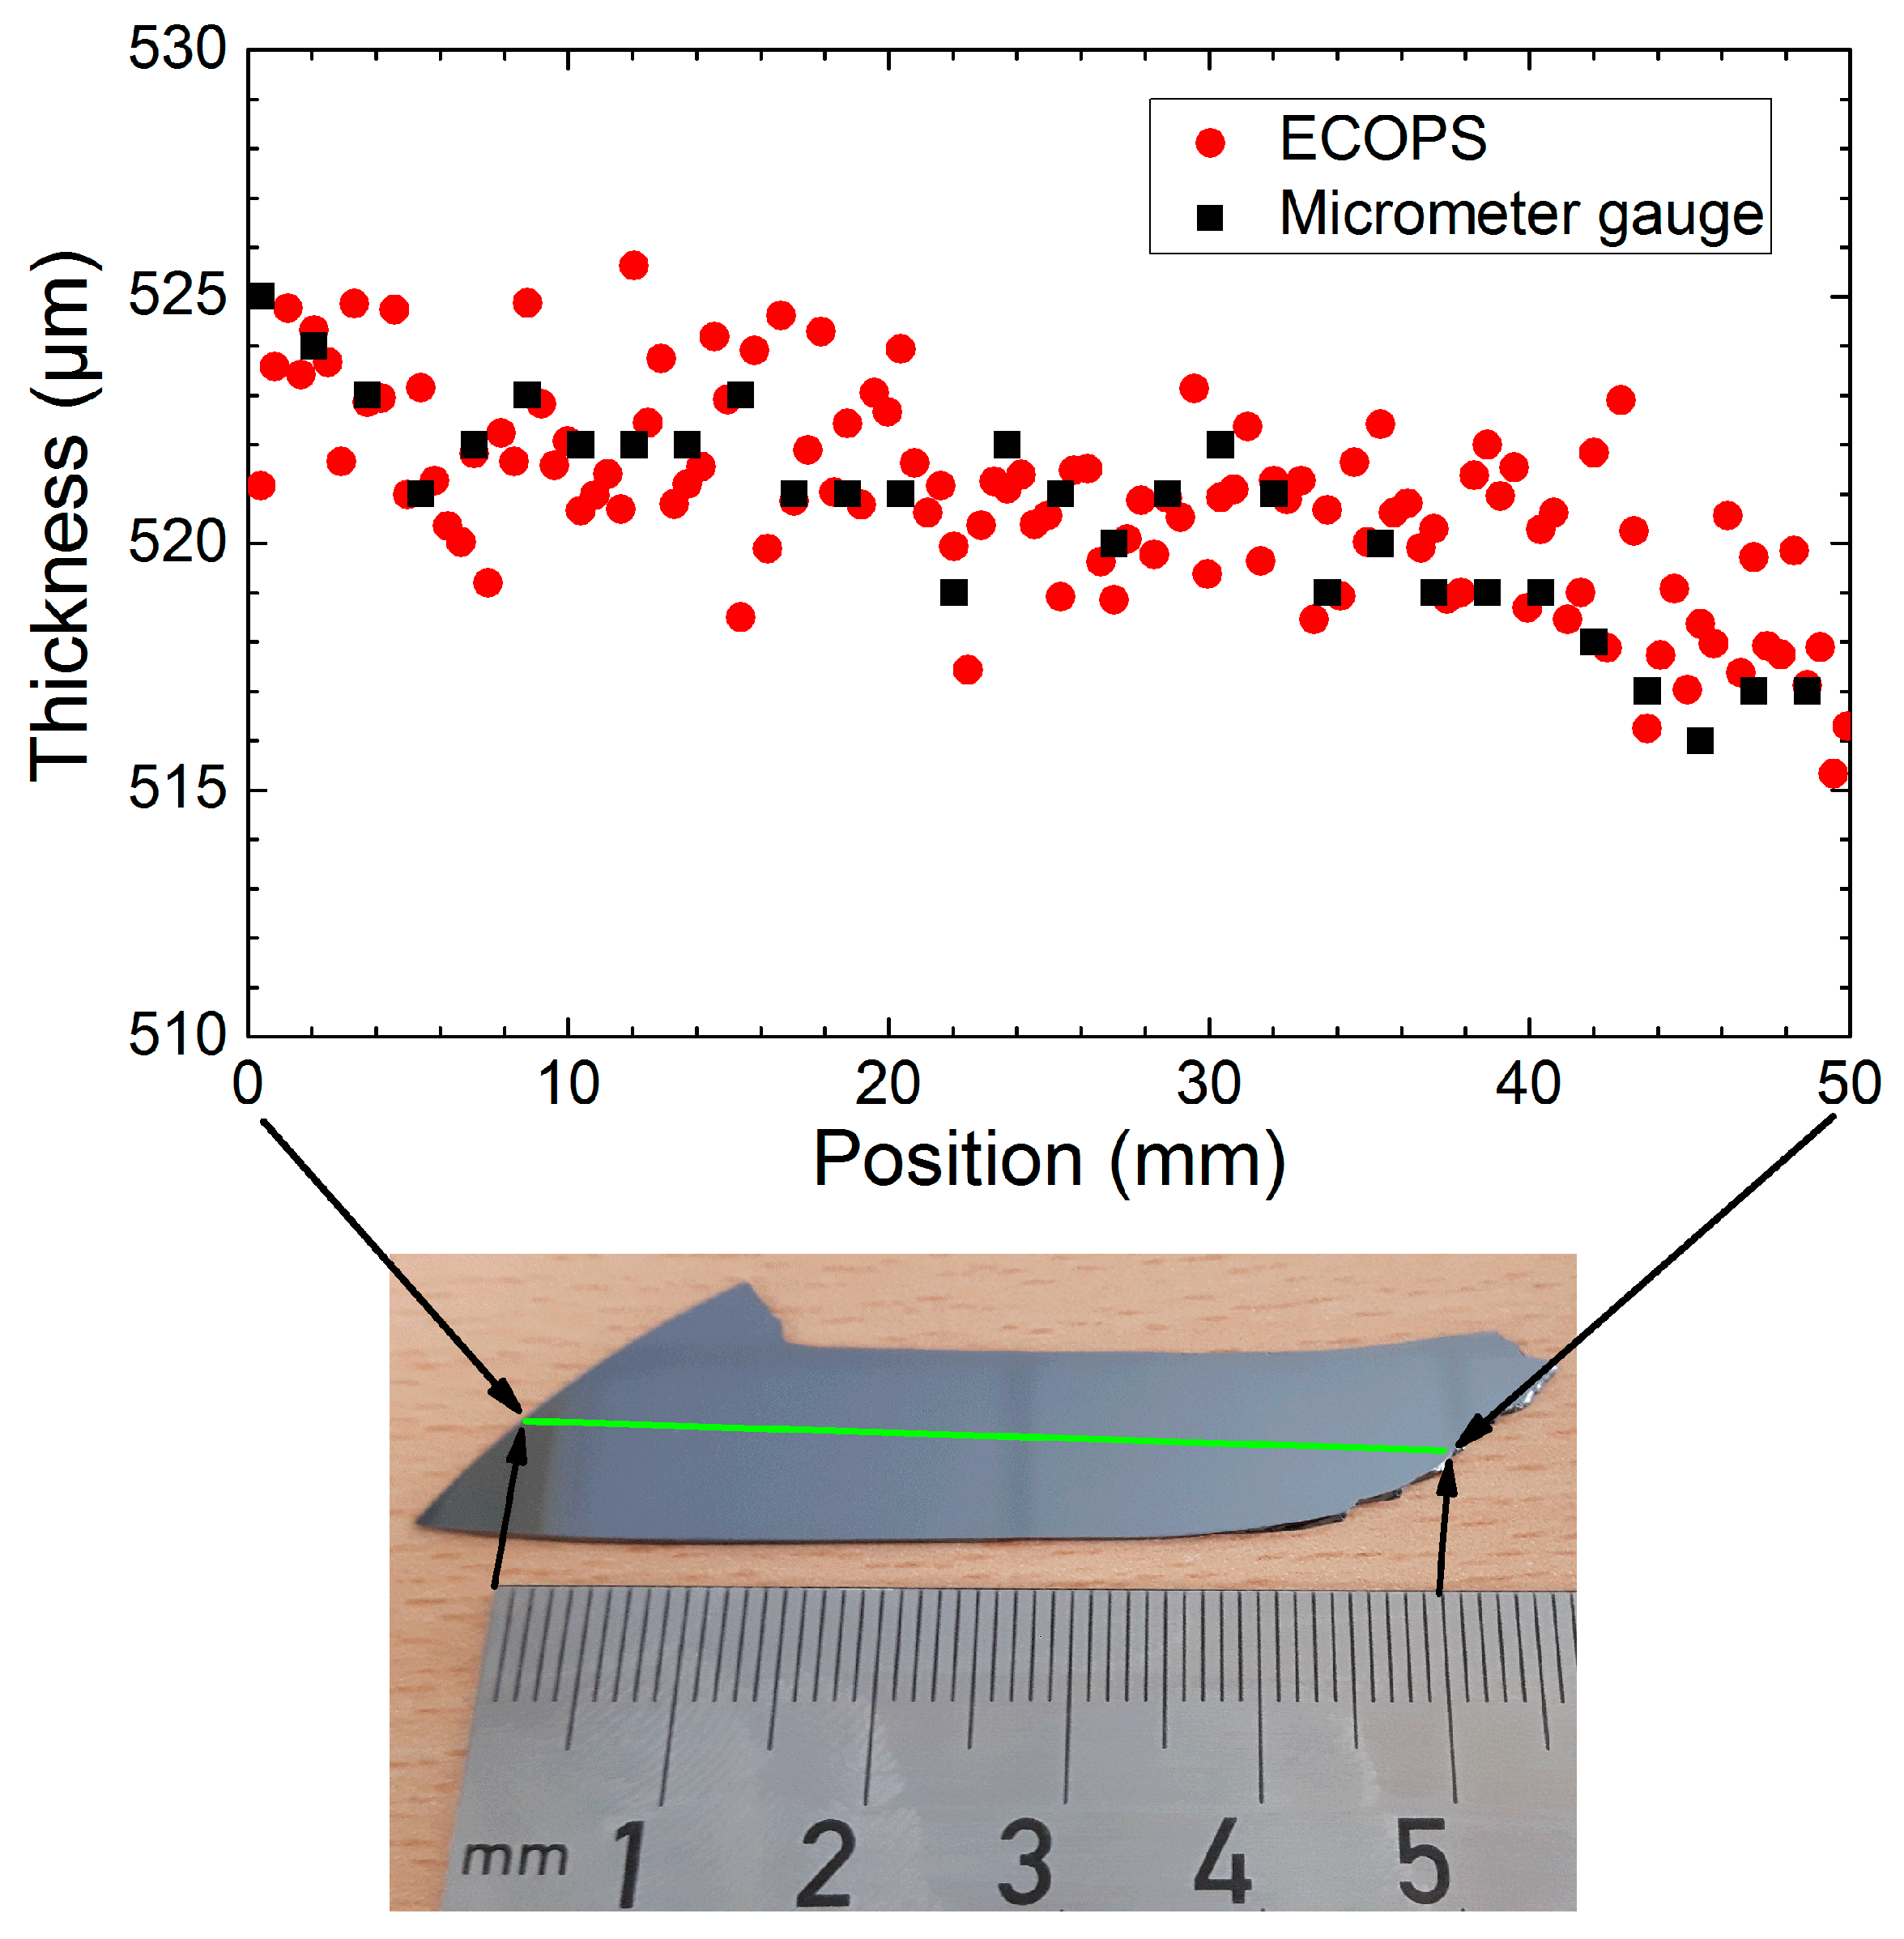
In order to validate the suitability of the system for a fast “real-world” thickness measurement, we moved the silicon sample at speeds similar to that of actual production lines. Our mock-up conveyor belt consisted of a vinyl-record player, on which the wafer was placed. The rotation speed of 45 rpm translates into a lateral velocity of about 700 mm/sec. The ECOPS measurement speed enables us to evaluate the thickness of the wafer with a spatial resolution of about 0.4 mm (not considering the actual focus size).
Figure 8 depicts the ECOPS-based thickness readings across the wafer (red dots). The ruler shown in the photograph illustrates the horizontal axis. For comparison, we also examined selected locations on the same sample with the manual micrometer gauge. We note that the thickness varies along the sample by as much as 10 µm, with ECOPS and micrometer-gauge results being in good agreement.
We note that besides measurement speed, another important performance parameter is the minimum layer thickness an instrument can resolve. Preliminary results (not shown here) indicate that the thickness of layers as thin as ~30 µm can still be accurately determined. We surmise that even thinner layers can be characterized using more sophisticated data post-processing algorithms.
5. Conclusions
We characterized a fast terahertz TDS system with respect to signal quality and measurement speed, and applied the system to non-contact thickness measurements of a piece of high-resistivity silicon. Employing two synchronized femtosecond lasers rather than a mechanical delay stage, the ECOPS system achieves a maximum measurement speed of 1600 pulse traces per second, at a scan range of 200 ps. With the scan range extended to 700 ps, the system still maintains a measurement speed of 200 traces per second. This is one to two orders of magnitude faster than state-of-the-art TDS systems with mechanical delay.
Set to a measurement speed of 1600 traces per second, the ECOPS system achieves a time-domain dynamic range of about 60 dB for a single-shot measurement, and ~90 dB with 1000 trace averages, still within a measurement time of less than one second. The time-domain signal-to-noise ratio amounts to ~50 dB and ~80 dB for 1 and 1000 averages, respectively.
In the frequency-domain, the ECOPS setup produces spectra with a frequency range of 3.4 THz within 625 µs, and 4.8 THz within 625 ms.
Thickness measurements performed with ECOPS agreed well with results obtained with both a conventional TDS system and a micrometer gauge. Mounting the sample on a record player, we demonstrated the suitability of the system for continuous thickness monitoring in an industrial production line. To the best of our knowledge, our work represents the fastest thickness measurements accomplished with terahertz pulses so far.

 ,
, 