1. Introduction
Optical coherence tomography (OCT) is a noninvasive, high-resolution optical imaging technique that can provide a cross-sectional and three-dimensional structure of biological tissues in micrometer scale [
1]. There are two kinds of OCT technologies including time domain OCT (TDOCT) and Fourier domain OCT (FDOCT). TDOCT acquires interference signal based on mechanical scanning of reference arm, hence the scanning rate is limited by the hardware. FDOCT that obtains the structural information by evaluation of the interference spectrum is capable of a much higher scan rate since no scanning of the reference arm is needed. It has been reported that a multi-MHz scan rate can be achieved in a swept source OCT (SSOCT) system by using an ultra-high-speed Fourier domain mode-locked laser [
2].
Despite the achievement of scan rate, the bottleneck of imaging display is the mass data processing. The signal processing of OCT includes data transfer, background subtraction, data resampling, Fourier transformation, and logarithmic transformation in which logarithmic-scaling takes a high proportion of total processing time. Due to strong absorption of light in biological tissues, the intensity of OCT signal from superficial and deep layers of tissue varies by several orders of magnitude. By mapping logarithmically transformed raw data to a series of fixed gray values to adapt the psychological properties of the human eyes, weak backscattered signals can be visualized more clearly with a compressed dynamic range [
3]. For this reason, logarithmic transformation has become a standard procedure for OCT signal processing.
In FDOCT, the use of a logarithmic amplifier after the photodetector to save logarithmic calculation time as in TDOCT [
4] is inappropriate since Fourier transformation of the signal in log scale would distort imaging and degrade resolution [
5]. Alternative methods of compressing the dynamic range to accelerate processing in OCT have been demonstrated. For example, a truncation logarithm method was adopted to achieve a predetermined dynamic range by selecting an appropriate threshold in logarithmic calculation, however at a cost of degraded imaging quality [
6]. Parallel computing accelerated algorithms based on graphics processing units (GPU) can be used for real-time OCT data processing and imaging display [
7,
8]. However, high-performance GPUs are limited in the market and costly. Therefore, a low cost and less complex technique to accelerate OCT signal processing, especially logarithmic calculation for real-time display, is attractive. In this paper, a lookup table method is proposed to improve the processing speed of logarithmic transformation in FDOCT.
2. Materials and Methods
2.1. OCT System
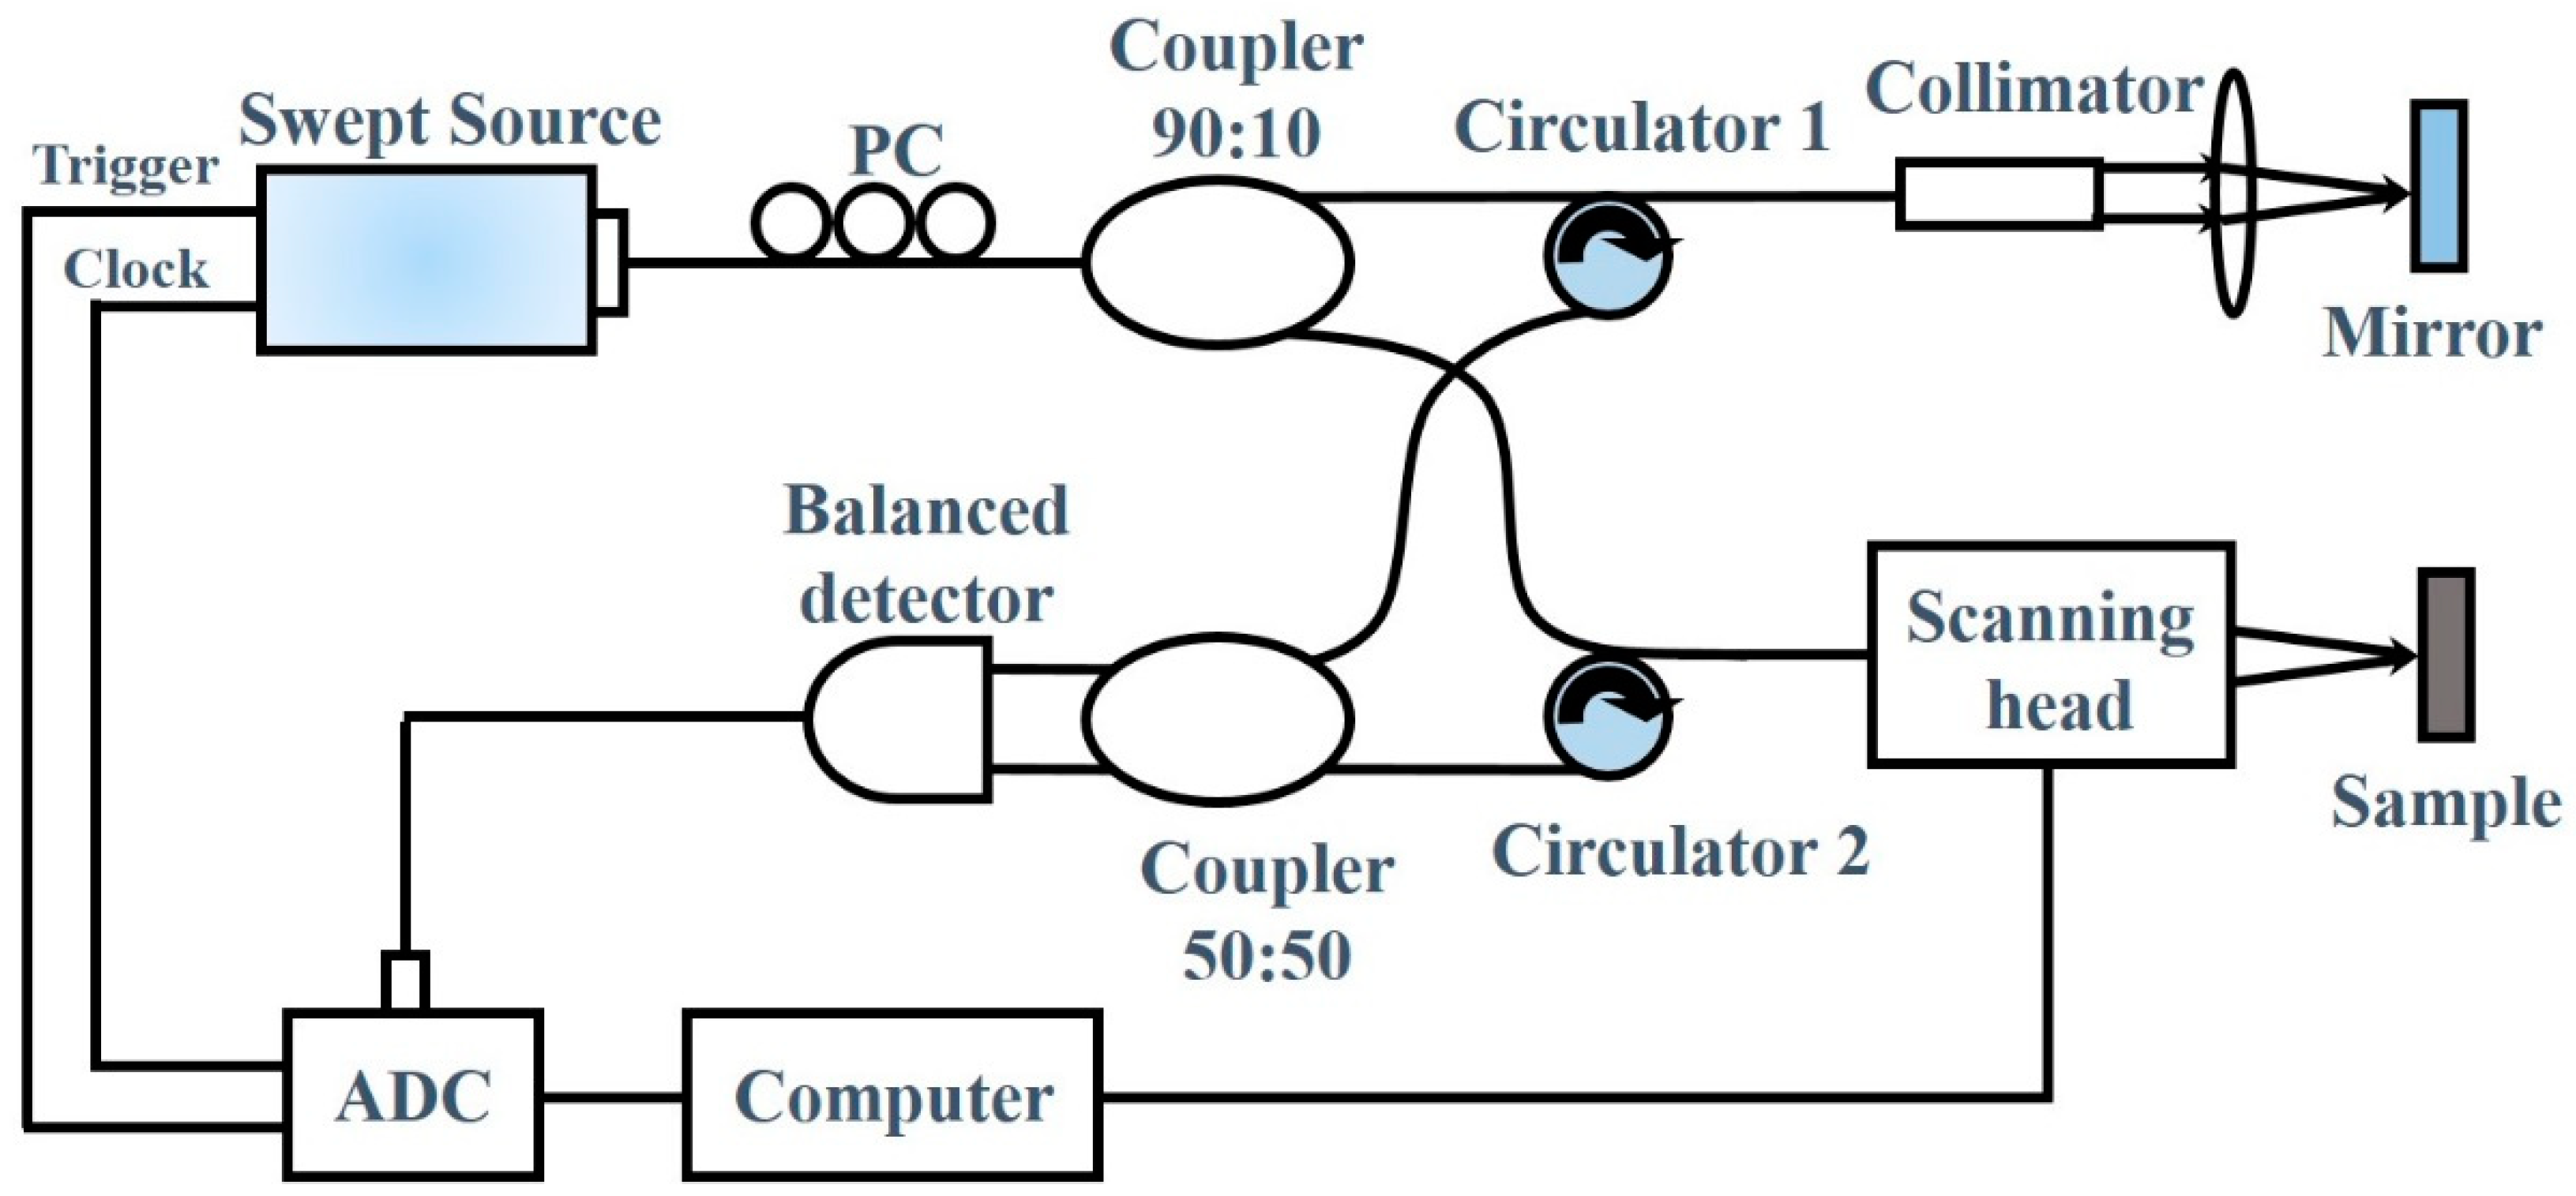
A swept source OCT system shown in
Figure 1 was built to demonstrate the capacity of the proposed technique. Output light from a 1310 nm swept source laser (87 nm bandwidth, 20 mW average power, 100 kHz A-scan rate, Santec Corporation, Japan) was split by a coupler with 90% of the light into the sample arm and 10% into the reference arm, respectively. Two circulators were used to redirect the back-reflected light to a 2 × 2 fiber coupler for balanced detection. In the detection arm, the signal detected by the photodetectors was recorded by an analog to digital converter (ATS9360, Alazar). The entire OCT was controlled and processed on a personal computer (CPU: Intel i7-6700K@4GHz, RAM: 32GB, operating system: Window 7, 64 bit).
2.2. Lookup Table Method
In our experiment, the structural signal after Fourier transformation varies in a range of 80 dB. Logarithmic transformation of the signal in such a large range based on the conventional calculation is time-consuming. In current system, it takes 13.3 ms to perform logarithmic transformation in a frame with 1024 × 1000 pixels, which occupies more than 60 percent of total processing time. Since an excessive precision of logarithmic calculation is not necessary in grayscale imaging, a lookup table consisting of pre-calculated logarithmic values can be used to perform logarithmic transform.
The recorded raw data
Y can be expressed in scientific notation as
Y =
X × 10
n, in which the significand
X is a decimal less than 10 and the integer
n is the order of magnitude. Based on the properties of logarithmic calculation, the logarithmic value of
Y =
X × 10
n can be expressed as:
If the logarithmic value of
X and the order of magnitude
n are known, the logarithmic value of
Y can be calculated by simply adding them together. The calculation accuracy is determined by the number of digits of
X. Considering the precision requirement of logarithmic calculation in OCT data processing is relatively low, the number of digits of
X can be reduced correspondingly.
Figure 2 shows the calculation process of the lookup method based on a table of 1000 components. To calculate the logarithmic value of
Y =
X × 10
n, the order of magnitude
n and significand
X were determined first and then
X was rounded to two decimal places. A table consisting of logarithmic values of integers from 1 to 1000 was built beforehand. Rounding of
X × 100 was used as the address to look up in the pre-calculated table. The corresponding logarithmic value of
Y can be obtained by adding
n-2 to the lookup value.
3. Results
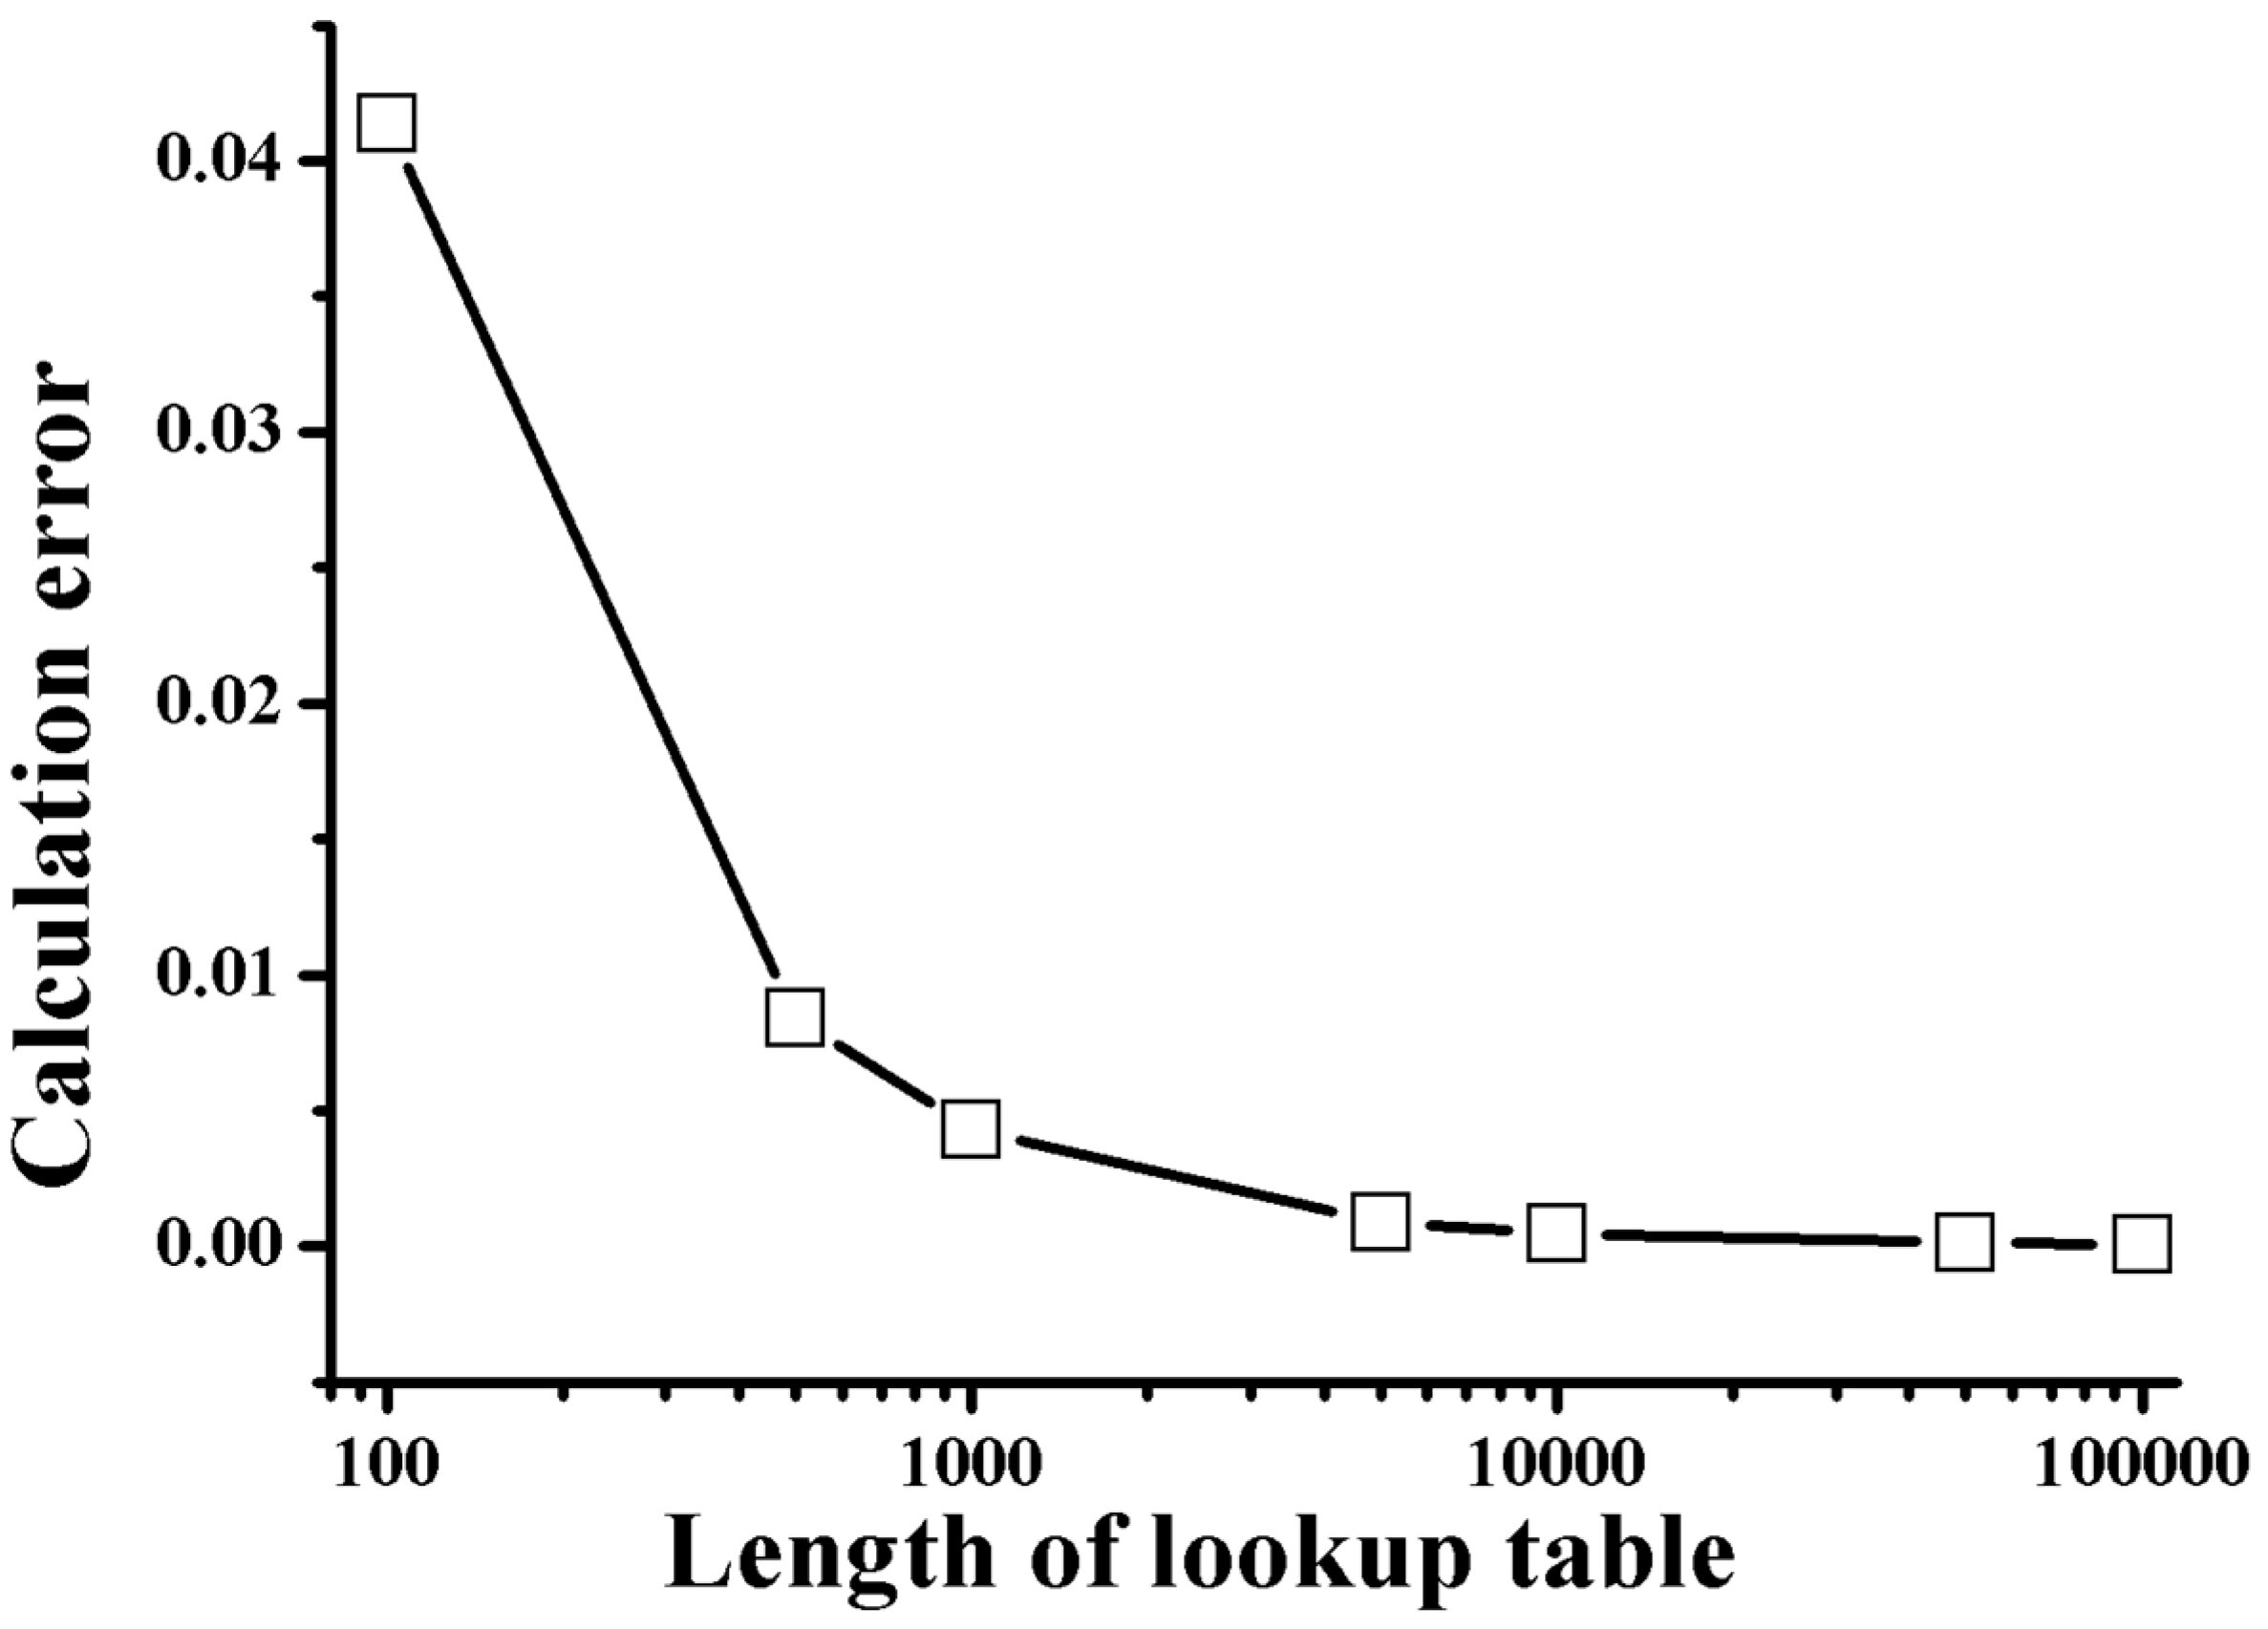
The calculation error with the lookup table method was defined as the maximum difference between the lookup table calculation results and the actual logarithmic values. The calculation error decreased with the size of the lookup table as shown in
Figure 3, however, at the cost of more memory of the computer and more lookup time. Considering a balance between processing time, memory and calculation error, a table of 1000 components was chosen to calculate the logarithmic function with the maximum error of 0.0043.
The processing time of logarithmic transformation for B-scan imaging (1024 × 1000 pixels) was reduced from 13.3 ms to 9.3 ms with the lookup table method. As shown in
Figure 4, the real-time processing A-rate considering the data transferring and FFT processing was improved from 50 kHz to 62 kHz corresponding to a B-scan rate of 62 frames/second. A shorter processing time results in a higher display rate that could help physicians with better diagnosis and treatment.
To test the accuracy of the lookup table method, a mirror was used as a sample. As shown in
Figure 5, the A-line signals that are respectively reconstructed from logarithmic function and lookup table calculation are identical.
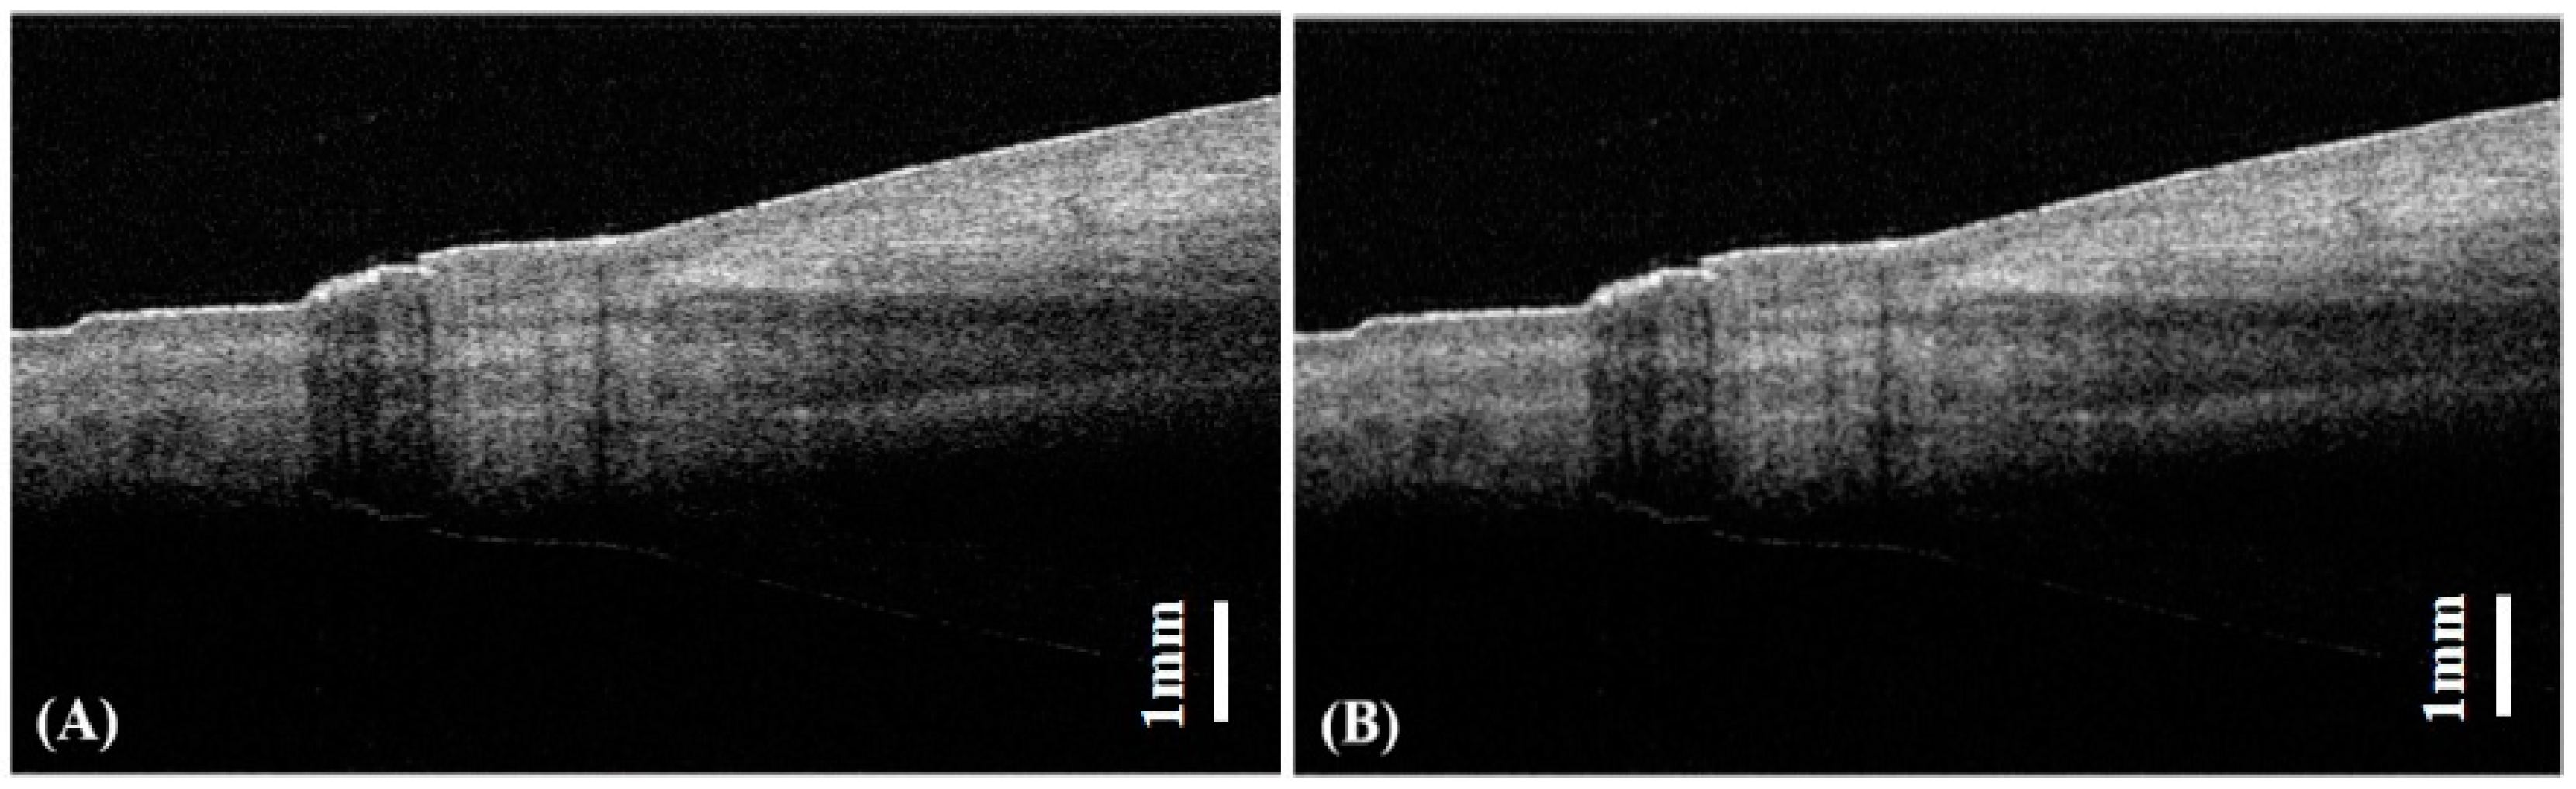
Furthermore, in vivo human fingernail was imaged to demonstrate the lookup table method in real-time processed OCT imaging.
Figure 6A,B illustrate OCT images reconstructed by the logarithmic function calculation and lookup table method, respectively. In order to evaluate the image quality obtained by the lookup table method, the mean square error (MSE) between two images that are reconstructed from logarithmic function and lookup table calculation was calculated. The MSE calculation is widely used in digital image processing for imaging quality evaluation and is defined as:
where
x(
i,
j) and
y(
i,
j) represent the pixel values of the original image and the image that needs to be evaluated, respectively. Considering the pixel values of a grayscale image are from 0 to 255, an MSE of 0.019 between the two images shown in
Figure 6A,B is quite small, demonstrating that our method meets the required accuracy of OCT imaging display.
4. Conclusions
In this paper, a lookup table method was used to improve the processing speed of logarithmic calculation in FDOCT imaging. By replacing the logarithmic transformation with a lookup table, data processing can be accelerated without increasing the cost and complexity of the system.
The performance of lookup table method was tested in SSOCT imaging. Compared with the logarithmic function calculation method, the optimized lookup table method is able to improve the processing rate by 24% with an error of less than 0.0043.
By adjusting the relationship between the values of table components and signal intensity, the contrast of OCT image could also be optimized. Based on the lookup table method, the structural information can be presented in some alternative ways, such as false color imaging, therefore a visual improvement of OCT image can be realized. In future work, we plan to use the lookup table method for improvement of the contrast of OCT image and acceleration of signal processing, such as Fourier transformation, to achieve a high-quality real-time OCT imaging.
Author Contributions
Conceptualization, J.Z. and S.L.; methodology, X.L. and S.L.; software, X.L.; validation, X.L.; Data analysis, X.L. and S.L.; writing, X.L, J.Z. and S.L.; supervision, J.Z. and S.L.
Funding
This research was funded by the National Key R&D Program of China (No. 2017YFC0112401), National Natural Science Foundation of China (No. 61505267) and the Science and Technology Program of Guangzhou (No. 201607010167).
Conflicts of Interest
The authors declare no conflict of interest.
References
- Huang, D.; Swanson, E.A.; Lin, C.P.; Schuman, J.S.; Stinson, W.G.; Chang, W.; Hee, M.R.; Flotte, T.; Gregory, K.; Puliafito, C.A.; et al. Optical coherence tomography. Science 1991, 254, 1178–1181. [Google Scholar] [CrossRef] [PubMed]
- Huo, T.; Wang, C.; Zhang, X.; Chen, T.; Liao, W.; Zhang, W.; Ai, S.; Hsieh, J.C.; Xue, P. Ultrahigh-speed optical coherence tomography utilizing all-optical 40 MHz swept-source.Ultrahigh-speed optical coherence tomography utilizing all-optical 40 MHz swept-source. J. Biomed. Opt. 2015, 20, 030503. [Google Scholar] [CrossRef] [PubMed]
- Castleman, K.R. Digital Image Processing, 1st ed.; Prentice Hall, Inc.: Upper Saddle River, NJ, USA, 1996. [Google Scholar]
- Liu, B.; Brezinski, M.E. Theoretical and practical considerations on detection performance of time domain, Fourier domain, and swept source optical coherence tomography. J. Biomed. Opt. 2007, 12, 044007. [Google Scholar] [CrossRef] [PubMed]
- Liu, B.; Azimi, E.; Brezinski, M.E. Improvement in dynamic range limitation of swept source optical coherence tomography by true logarithmic amplification. J. Opt. Soc. Am. A 2010, 27, 404–414. [Google Scholar] [CrossRef] [PubMed]
- Yu, K.; Ji, L.; Wang, L.; Xue, P. How to optimize OCT image. Opt. Express 2001, 9, 24–35. [Google Scholar] [CrossRef] [PubMed]
- Zhang, K.; Kang, J.U. Real-time 4D signal processing and visualization using graphics processing unit on a regular nonlinear-k Fourier-domain OCT system. Opt. Express 2010, 18, 11772–11784. [Google Scholar] [CrossRef] [PubMed]
- Jian, Y.; Wong, K.; Sarunic, M.V. Graphics processing unit accelerated optical coherence tomography processing at megahertz axial scan rate and high resolution video rate volumetric rendering. J. Biomed. Opt. 2013, 18, 026002. [Google Scholar] [CrossRef] [PubMed]
© 2019 by the authors. Licensee MDPI, Basel, Switzerland. This article is an open access article distributed under the terms and conditions of the Creative Commons Attribution (CC BY) license (http://creativecommons.org/licenses/by/4.0/).


