Article

Chemical Defence of a Seagrass against Microfoulers and Its Seasonal Dynamics

1
GEOMAR Helmholtz-Zentrum für Ozeanforschung Kiel, Düsternbrooker Weg 20, 24105 Kiel, Germany
2
School of Biological Sciences, University of Essex, Colchester CO 43 SQ, UK
3
Marine Ecology and Biodiversity, Plymouth Marine Laboratory, Prospect Place, Plymouth PL 13 DH, UK
*
Author to whom correspondence should be addressed.
Appl. Sci. 2019, 9(6), 1258; https://doi.org/10.3390/app9061258
Submission received: 6 March 2019 / Revised: 22 March 2019 / Accepted: 24 March 2019 / Published: 26 March 2019
(This article belongs to the Special Issue Self-Cleaning and Antifouling Surfaces)

Abstract

:

Featured Application

The development of new antifouling methods gives increasing attention to biomimicry, which could provide nontoxic or less toxic solutions for the deterrence of unwanted settlers. Natural mechanisms against fouling are often highly dynamic and future applications may need to mimic not only defensive compounds, but also their dynamics in order to exploit the full potential of biomimicry. We here explore the seasonal dynamics of chemical defences against microfouling in eelgrass and the drivers of these dynamics.

Abstract

In marine environments bacterial microfoulers are an important determinant for the settlement of algal and animal macrofoulers. At the same time fouling is usually subject to seasonal fluctuation. Additionally, the seagrass Zostera marina is prone to microfouling, although this marine spermatophyte is known to be chemically defended against bacterial settlers. Spermatophytes are often capable of induced or activated defences against biological enemies such as pathogens or herbivores, but it is still unknown whether they can fine-tune their antifouling-defence according to settlement pressure. We therefore assessed the seasonality of bacterial settlement pressure, defence against microsettlers and concentrations of a previously identified defence compound, rosmarinic acid, on surfaces of Z. marina. All examined variables peaked in summer, while they tended to be lower in spring and autumn. The seasonality of defence activity and rosmarinic acid surface concentration was positively correlated with the seasonal fluctuation of fouling pressure, which suggests that Z. marina can adjust its defence level to the relatively high bacterial fouling pressure in summer. Besides of biotic factors the seasonal change of environmental factors, such as nitrogen supply, and in particular temperature, also affected the defence level, either directly or through indirect effects on the microbial settlers.

1. Introduction

Seagrasses, marine flowering plants, are widely distributed across the globe [1]. They are often habitat formers and their roles in the coastal ecosystem are vital [2]. The eelgrass Zostera marina L is one of the most dominant seagrass species in Northern Atlantic coastal areas and also in the Southwest Baltic Sea, where its beds extend from 0.6 to 7.6 m below the mean sea surface level [3]. As marine macrophytes in general, eelgrass provides a substratum for epiphytic organisms and nutrients that can support growth of certain microorganisms. As a consequence settlement of various bacteria on its leaves is facilitated [4,5]. These microorganisms condition the interface for further settlement of micro- and macrocolonizers, such as animals and algae [6,7]. Beneficial effects of epibionts on their hosts have been observed [8,9], but in most cases the negative impact of fouling outweighs the positive impact. Fouled organisms often suffer from increased drag [10], reduced access to nutrients [1,11,12] and reduced photosynthesis [13]. Epibionts on marine macrophytes may also directly damage their hosts if they penetrate into their tissue [14] and in this way they can also increase the susceptibility to infection [15]. Correspondingly, resistance to fouling can be a determinant of the survival of introduced marine macrophytes in new habitats [16].
To cope with epibionts, marine macrophytes have evolved antifouling defences that are often adapted to specific foulers [8,9,17]. Various secondary metabolites with a potential for chemical antifouling defence have already been discovered in marine macrophytes. They can be non-toxic deterrents or compounds that inhibit growth, survival or reproduction of foulers [18,19]. In the tissue of seagrasses, biologically active phenolic metabolites were repeatedly discovered and proposed to be functional in the chemical defence against fouling and microbes [20,21,22]. This view was recently confirmed in a study that exclusively focused on compounds which are present on the surface of Z. marina [23]. Using a bioassay-guided approach, the authors identified rosmarinic acid as an ecologically relevant defence compound that can deter bacterial settlers at its natural concentration on the eelgrass surface.
Phenolic compounds in plants are also considered as carbon storage compounds that may accumulate when plants are photosynthetically active, but nutrient depleted [24]. This corresponds with observations of negative correlations between the concentration of phenolic compounds and the nitrogen content in eelgrass tissues [25]. Other environmental factors that could alter photosynthesis rates, such as light intensity, temperature, salinity, etc., may also affect the concentrations of phenolics in seagrass [26]. As a consequence, the concentration of phenolics in seagrass tissues often varies with season [27,28]. These observations could hint at seasonally variable surface concentrations of phenolic defence metabolites, but so far the dynamics of seagrass antifouling defences have not been investigated. Seasonality of antifouling defences has been observed in brown [29,30] and red [31] macroalgae, that are ecologically, but not evolutionarily related with seagrasses. For instance, the antifouling defence of Fucus vesiculosus exhibited a clear seasonal fluctuating pattern and a higher defence activity was observed in summer than in other seasons [29]. The mechanism behind this pattern was not clearly revealed, but the authors interpreted it as an adaptation to seasonal changes in abiotic factors, which often affect the content of algal tissues in metabolites that have antifouling activity [32,33,34].
In addition to abiotic factors, biological factors could also regulate the antifouling defence of marine plants. From a theoretical viewpoint demand-driven regulation of defences could be beneficial for the host in several respects. For example, it would reduce the metabolic costs of defences [35], and the risk of adaptation of enemies to these defences [36]. Indeed, plants are very often capable of induced or activated defences against herbivores and pathogens [37,38], but their capacity for demand-driven defence against micro- or macrofoulers is virtually unstudied. Furthermore, in algal macrophytes corresponding studies are scarce [39].
In the present study we investigated seasonal fluctuations in the chemical antifouling defence of Zostera marina L. The defence compound rosmarinic acid was also quantified, in order (a) to verify that previously observed seasonal dynamics of within tissue concentrations [28] can also be observed in surface concentrations, and (b) to test the hypothesis that the relative contribution of rosmarinic acid to the overall antifouling defence of Z. marina changes with season. Fluctuations in the abundance of epibacteria on Z. marina and on adhesive glass slides, representing settled bacteria and the bacterial fouling pressure, respectively, were also measured to test the hypotheses that antifouling defence and/or rosmarinic acid excretion of eelgrass correlate with fouling pressure.

2. Materials and Methods

Collection and surface extraction of eelgrass samples. Zostera marina L plants were collected monthly during one growth season from May to November 2015. The sampling site is located in Falckenstein beach at Kiel, Germany (54°38′ N, 10°17′ E) in the Southwest Baltic Sea, an atidal brackish environment with a mean salinity around 16. Eelgrass was collected at four locations that are in 50 m distance from each other in a water depth of 0.6–1.4 m. The plants were transported individually in Ziploc bags in a cooler box to the lab and processed immediately afterwards. Leaves were separated from roots and the wet weight was determined. Leaf surface areas were calculated for all samples from the wet weight, using a factor of 79 cm2·g−1, which was previously identified as the mean surface/wet weight ratio in Z. marina [23]. Surface compounds of Z. marina were extracted using the method described in detail in [23]. Briefly, fresh Z. marina leaves were dipped into propan-2-ol for 5 s, which allows the solvent to dissolve surface compounds without damaging the epidermal cells [23]. The resulting crude extracts were filtered through 0.2 µm glass fibre filters (Carl Roth, Karlsruhe, Germany) and then evaporated in vacuo at 30 °C. Prior to all following steps the Z. marina surface extracts were re-dissolved in methanol (Carl Roth, Karlsruhe, Germany), as described in [23]. Their concentration was related to the extracted leaf surface volume, which was calculated by multiplication of the extracted leaf surface area with the mean thickness of the leaf surface boundary layer of marine plants of 30 µm [40]. All extracts were diluted in a volume of methanol that represented 30% of the extracted leaf surface volume. The resulting stock solutions of 3.33-fold natural concentration were stored in a freezer (−20 °C).
Anti-settlement bioassay. To quantify the antifouling activity of eelgrass surface extracts, we used the anti-bacterial-settlement bioassay described in [41] and [23]. Bacterial isolates applied in these bioassays had been isolated previously from stones of the North Sea and Baltic Sea upper subtidal and lower intertidal zones [42] and had been conserved in −80 °C. Four bacterial isolates were used in the assays. They were Alteromonas stellipolaris (strain AMAN1), Loktanella rosea (strain AFALK1), Polaribacter dokdonensis (strain ANORD1), and Bacillus aquamaris (strain AMAN10) [42]. Prior to bioassays all bacteria were cultivated in liquid medium containing 25 g sea salt, 5 g peptone (Carl Roth, Karlstuhe, Germany), and 3 g yeast extract (Carl Roth, Karlstuhe, Germany) in 1 L deionized water at 25 °C in darkness for 1–2 days. Immediately before use the cells were washed by centrifugation (10 min, 10,000− g) and resuspension of the pellet in autoclaved sea water.
In the assays all extracts were tested at one-fold natural concentration. To do this 30 µL of each extract and 70 µL of pure methanol—for solvent controls, 100 µL of methanol—were added into black 96-well multititer plates (flat bottom, Greiner®) and the solvent was evaporated in a freeze-dryer. Then 100 µL of a bacterial suspension in seawater were added into four of the eight wells and 100 µL of seawater were added into the remaining four wells as a control of extract fluorescence. The wells were incubated for two hours at 25 °C on a shaker at 100 rpm. Then unattached cells were rinsed away with sterile seawater and the remaining bacterial cells were DNA-stained with SYTO 9 (5 µmol·L−1 in sterile sea water, Invitrogen, Waltham, MA. USA) as described in [41]. The resulting fluorescence was measured in a Chameleon V (Hidex, Turku/Finland) plate reader (excitation wavelength: 477–491 nm, emission wavelength: 540 nm).
Quantification of rosmarinic acid. Concentrations of rosmarinic acid in surface extracts were quantified by HPLC as described in detail in [23]. A Varian 940-LC with diode array detection (Varian 940-LC, Agilent Technologies, Palo Alto, California, USA), equipped with semi-preparative LichroCart 250/10 Purospher STAR-rp 18ec column (VWR, Radnor, USA) was used as the HPLC system. The solvents ranged from 0.1% formic acid (Sigma-Aldrich, St. Louis, Missouri, USA) dissolved in acetonitrile (Sigma-Aldrich, St. Louis, Missouri, USA) to 0.1% formic acid dissolved in water. Rosmarinic acid was detected as light absorption at 350 nm, and its concentration was calculated on the base of peak area and calibration of the system with defined quantities of pure rosmarinic acid (Sigma-Aldrich, St. Louis, Missouri, USA).
Estimation of relative epibacterial density on Z. marina. The relative density of bacteria on the surface of eelgrass was estimated for each sampling month. From each of the four plots an individual eelgrass leaf was randomly collected during each sampling and transported to the lab in seawater in individual sterile tubes in a cooling container. Four disks with a diameter of 8 mm and a diameter of 50.3 mm² were cut out of each leaf with a sterilized cork borer from each leaf. Attached bacteria were then swabbed from the disk surface with sterile cotton tips, which were transferred into 1 mL of sterilized seawater in sterile 2 mL Eppendorf vials (Eppendorf-Elkay, Shrewsbury, MA, USA). The bacteria were suspended by vortexing for 30 s and 100 µL of the resulting suspension were transferred into 96 well plates (flat bottom, Greiner®). The bacteria suspended in each well were stained with Syto 9 (Invitrogen, Waltham, MA. USA) as described in [41]. The relative bacterial density was then determined with a plate reader as fluorescence intensity (excitation wavelength: 477–491 nm, emission wavelength: 540 nm).
Estimation of fouling pressure. To estimate the seasonal microfouling pressure, HistoBond® adhesive glass slides (Marienfeld Lauda-Königshofen, Germany) fixed on plastic panels were deployed vertically and horizontally in 1m depth at the sampling points on Falckenstein beach monthly from May–Nov 2015, collected after one month and transported to the lab in a cooler box in Falcon tubes containing seawater. Relative densities of bacteria on these slides were measured using the same methodology as described before, except that bacteria were swabbed from four areas of 50.3 mm² on the glass slides, which were marked with a sterile mask cut out of overhead projector foil.
Measurement of abiotic factors. Data for temperature in 1 m water depth, and salinity in 4 m water depth were constantly measured from May to November 2015 at Kiel light house (distance to the experimental site: 1.5 km) in time intervals of one hour and kindly provided by the German Federal Agency for Ship Traffic and Hydrography (BSH, Hamburg). Radiation between 300 and 3000 nm was constantly logged above the sea surface at Kiel-Düsternbrook (54°19.8′ N, 10°9.0′ E; distance to the experimental site: 7.5 km) in time intervals of 5 min and kindly provided by the meteorological department of GEOMAR (Kiel). Those data were measured as W m−2 and transformed to photosynthetically active radiation measured as µmol photons m−2 s−1, following [43]. Of all these logged data only the mean of the week before eelgrass sampling was used in statistical analyses. Means of temperature peaked in August and those of light intensity in June, while those of salinity fluctuated between 15 and 19 psu (Figure A1(A–C)). Water samples were collected monthly from each sampling point, filtered through 0.2 µm glass fibre filters and analysed for their content of nitrate plus nitrite, nitrite only, ammonium and phosphate by Dr. Rheena Schumann (Biologische Station Zingst, Universisity of Rostock). The monthly mean of ammonium peaked in July, that of nitrate decreased from May to November, that of nitrite showed an opposite trend with a minor peak in July, and that of phosphate was considerably higher in November than in all other months (Figure A1(D–G)).
Statistical analysis. The anti-bacterial-settlement activity of eelgrass surface extracts was calculated as a log effect ratio of bacterial strains settled in the presence of extracts and in presence of the solvent control [41]. Therefore, a value of zero indicates no defence activity, while positive and negative values indicate attracting and repelling effects of surface extracts on bacterial settlers, respectively. The “general effect” of extracts was calculated as the mean of anti-settlement activity against all four tested bacteria. Percentages of bacterial density on eelgrass relative to the bacterial density on glass slides (fouling pressure) were calculated to evaluate the overall resistance of eelgrass to bacterial foulers.
Repeated measures ANOVA was used to analyse the monthly defence activity against bacteria, rosmarinic acid surface concentration and densities of bacteria settled on Z. marina and on glass slides. Shapiro–Wilk’s test and Levene’s test were used to test for normal distribution and homogeneity of variances (p < 0.05), Tukey’s HSD test was used to compare the means of single groups post hoc. Simple linear regression analysis was used to analyse the relationships between rosmarinic acid concentrations, bacterial densities and the general antifouling defence activity (p < 0.05). All before mentioned statistical analyses were conducted using the software Statistica 8.0 (StatSoft, Tulsa, OK, USA) Multiple regression models were developed with R studio (R studio. Inc, Boston, MA, USA), using the STEP procedure implemented in R to analyse the synergistic effects of abiotic factors (including salinity, temperature, four different nutrients and light intensity) on the production of rosmarinic acid in Z. marina and the general defence activity (p < 0.05).
Data accessibility. All the data underlying this publication are available for free download from the PANGAEA repository at doi.org/10.1594/PANGAEA.899567.

3. Results

3.1. Fouling Pressure, Settled Bacteria, on Eelgrass and the Ratio

The fouling pressure by potential bacterial settlers was in this experiment indicated by the abundance of bacteria on glass slides that were exposed in the environment two weeks before each sampling. This fouling pressure exhibited a clear seasonal pattern (Figure 1A), with a significant peak in the mid of summer (July and August; repeated measures ANOVA, Table 1A). A similar seasonal pattern was also detected in the abundance of bacteria that settled on eelgrass leaves (Figure 1B). It increased from May, peaked in July and August and decreased again (repeated measures ANOVA, Table 1B). Corresponding with the overall similarity among the seasonal patterns, the density of bacteria settled on eelgrass relative to the density on glass slides varied not significantly (Table 1C). However, it tended to be lower when fouling pressure was relatively high in August and higher toward the end of the growth season (Figure 1C). Also corresponding with the similarity of both patterns, fouling pressure and numbers of bacteria settled on eelgrass correlated significantly (r = 0.82139, p < 0.0005). In contrast, fouling pressure was not correlated with the numbers of bacteria settled on eelgrass in the following month (r = 0.27068, p = 0.8596).

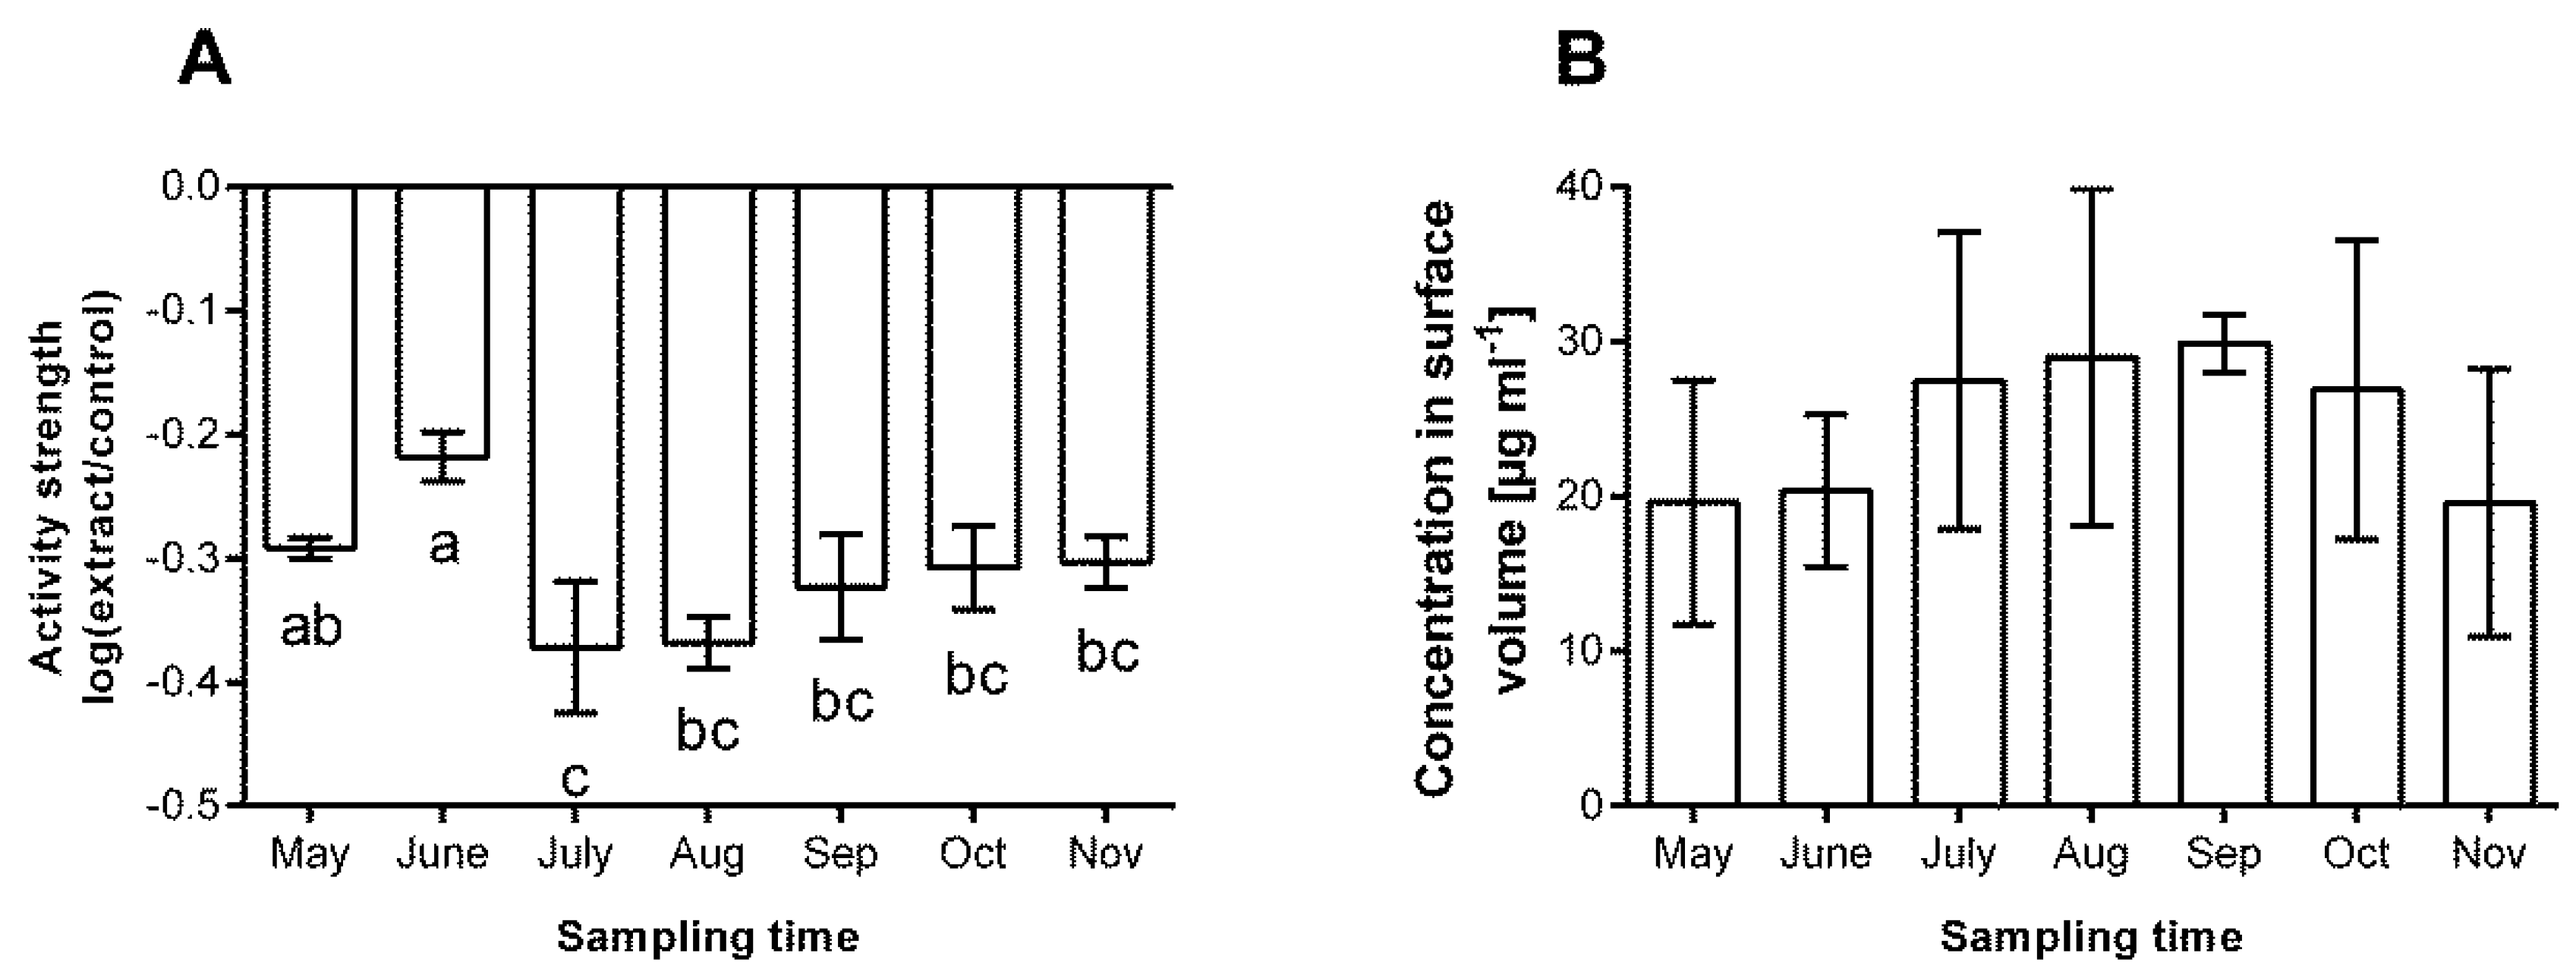
3.2. Chemical Defence

Four bacterial isolates were applied in anti-bacterial settlement inhibition bioassays, in order to quantify antifouling activity on eelgrass. The defence strength against the different isolates varied, but it was always particularly low in May and June (Figure 2) and in the later month P. dokdonensis was even attracted and not deterred (Figure 2D). The defence strength increased in all four cases significantly from June to July and remained stable or decreased non-significantly until November (Repeated measures ANOVA, Table 2A–D). The mean defence activity against all four isolates basically exhibited the same pattern (Repeated measures ANOVA, Table 3A and Figure 3A) and it was significantly lower in May than in July and August and significantly lower in June than in any other month. The mean surface concentrations of rosmarinic acid were highest in September, but differences among months were not significant (Figure 3B, repeated measures ANOVA, Table 3B). Rosmarinic acid concentrations and defence strength were not significantly correlated (r = −0.2967, p = 0.1252).

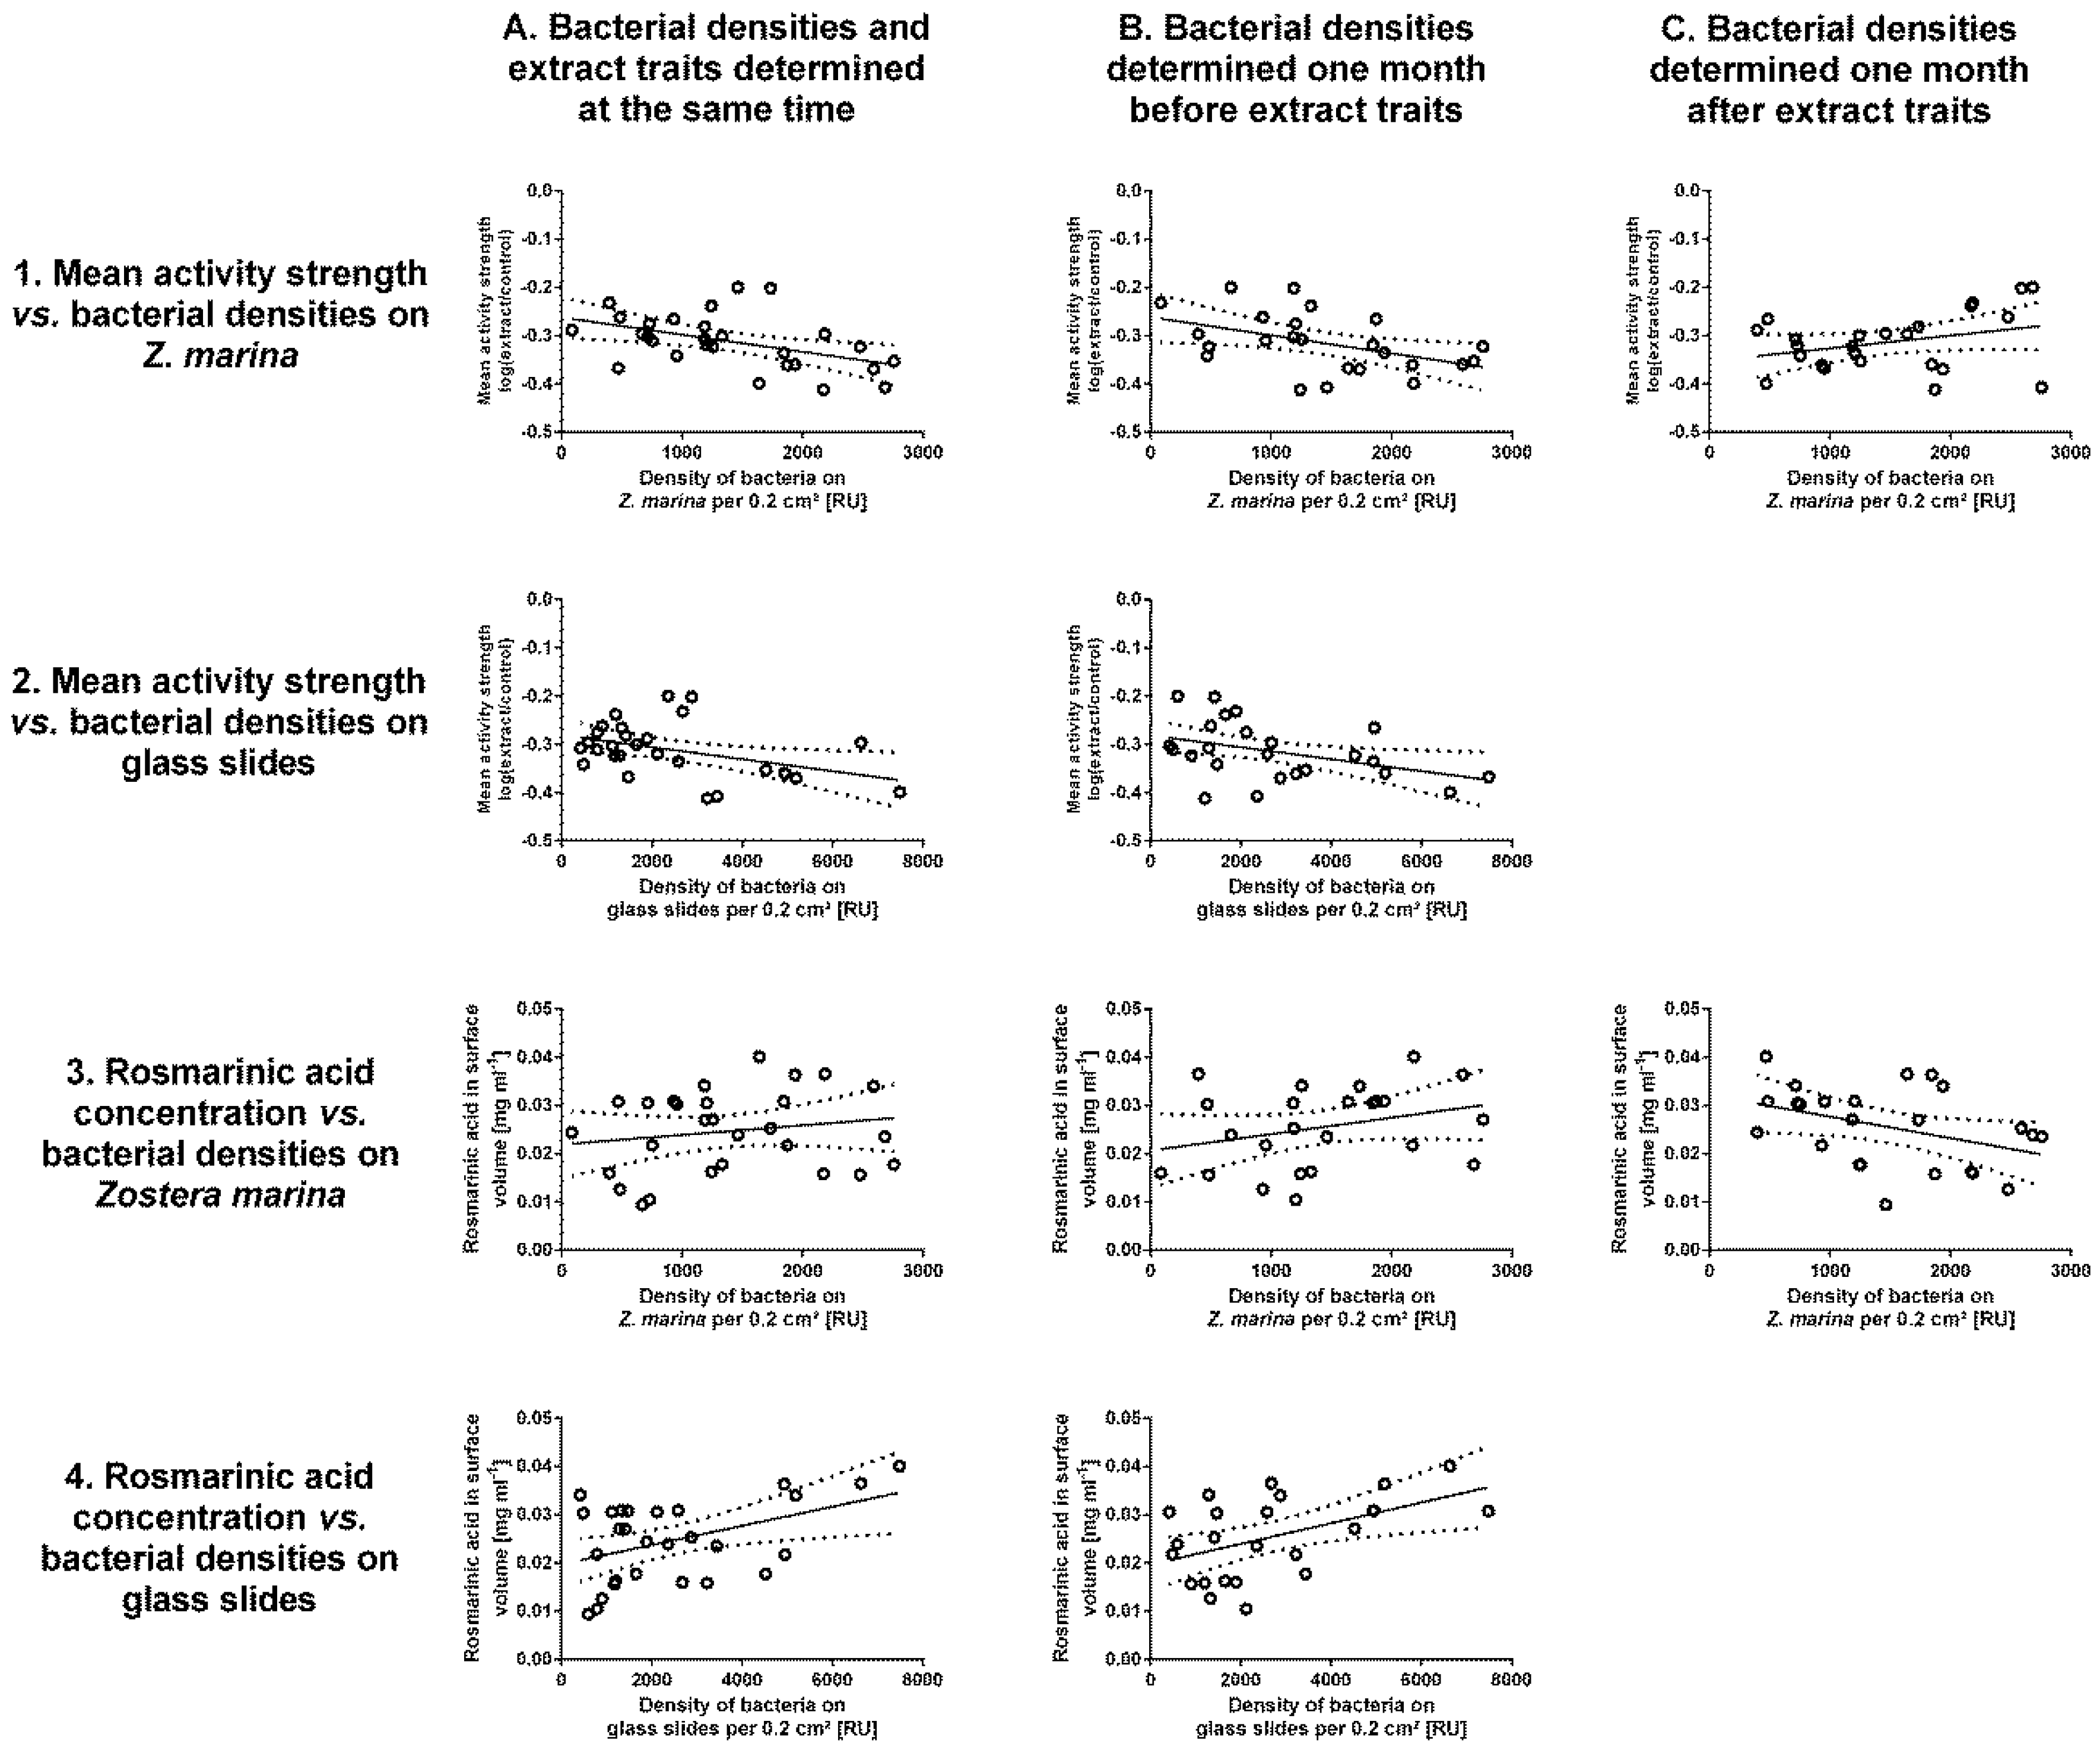
3.3. Correlations between Extract Traits and Bacterial Densities

The density of bacteria settled on eelgrass surfaces was significantly correlated with the mean defence activity against four bacterial isolates, which tended to be higher (= more negative) when the bacterial density was also high (linear regression, p < 0.05, Figure 4, Table 4). A similar correlation between the density of bacteria settled on eelgrass and the mean defence activity one month later was also observed (Figure 4, Table 4). In contrast, the density of bacteria on eelgrass leaves was not significantly correlated with the antifouling defence activity in the preceding month (Figure 4, Table 4). Bacterial fouling pressure also exhibited a significant correlation with the mean antifouling activity strength defence (Figure 4, Table 4). Bacterial fouling pressure was similarly correlated with the lagged mean antifouling defence that was observed one month after the fouling pressure (Figure 4, Table 4). As was to be expected, no significant correlation was detected between the defence activity strength and the density of bacteria on glass slides one month later (data not shown).
The concentration of rosmarinic acid on the surface of eelgrass was positively correlated with fouling pressure in the same month and even stronger with fouling pressure in the preceding month (Figure 4, Table 4). However, it was not significantly correlated with the density of bacteria on the surface of eelgrass in the actual or preceding month (Figure 4, Table 4). Instead, rosmarinic acid concentrations were weakly (p < 0.055) negatively correlated with bacterial densities on eelgrass leaves in the following month.

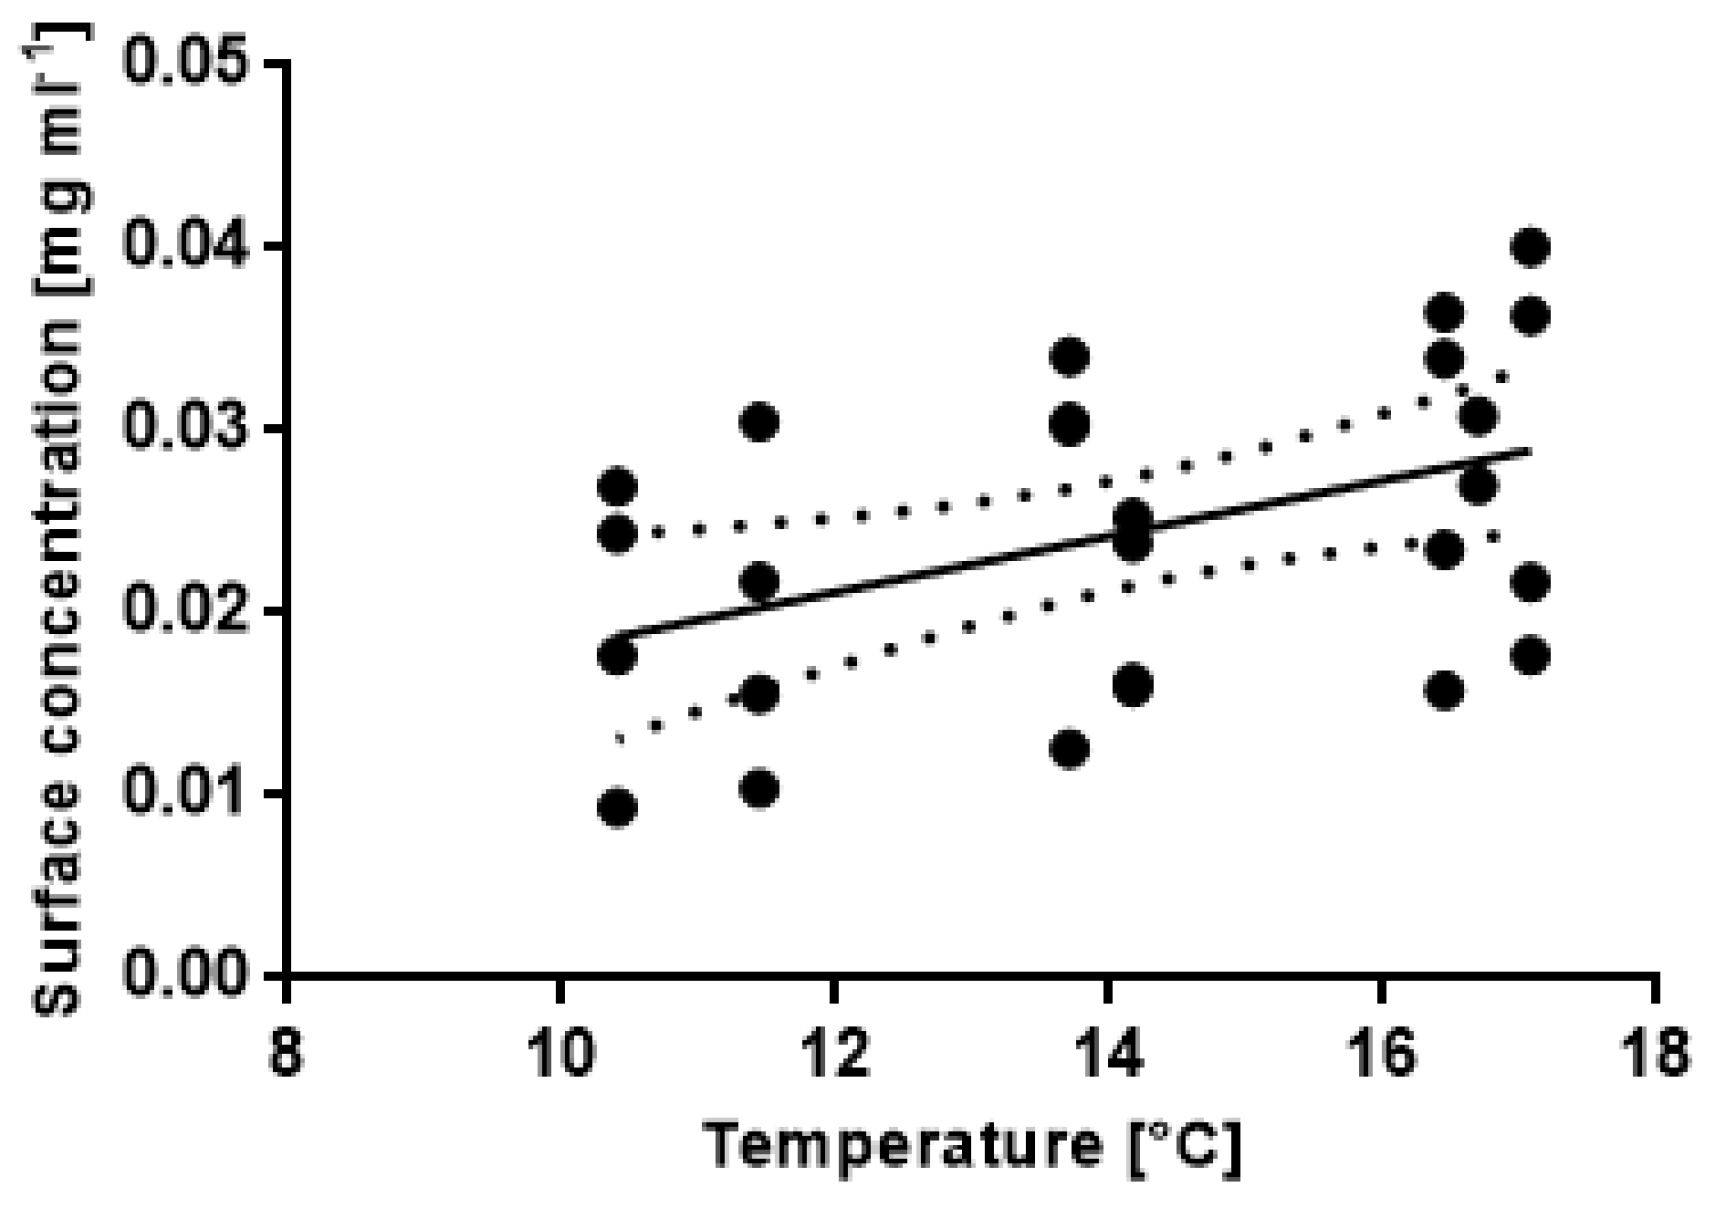
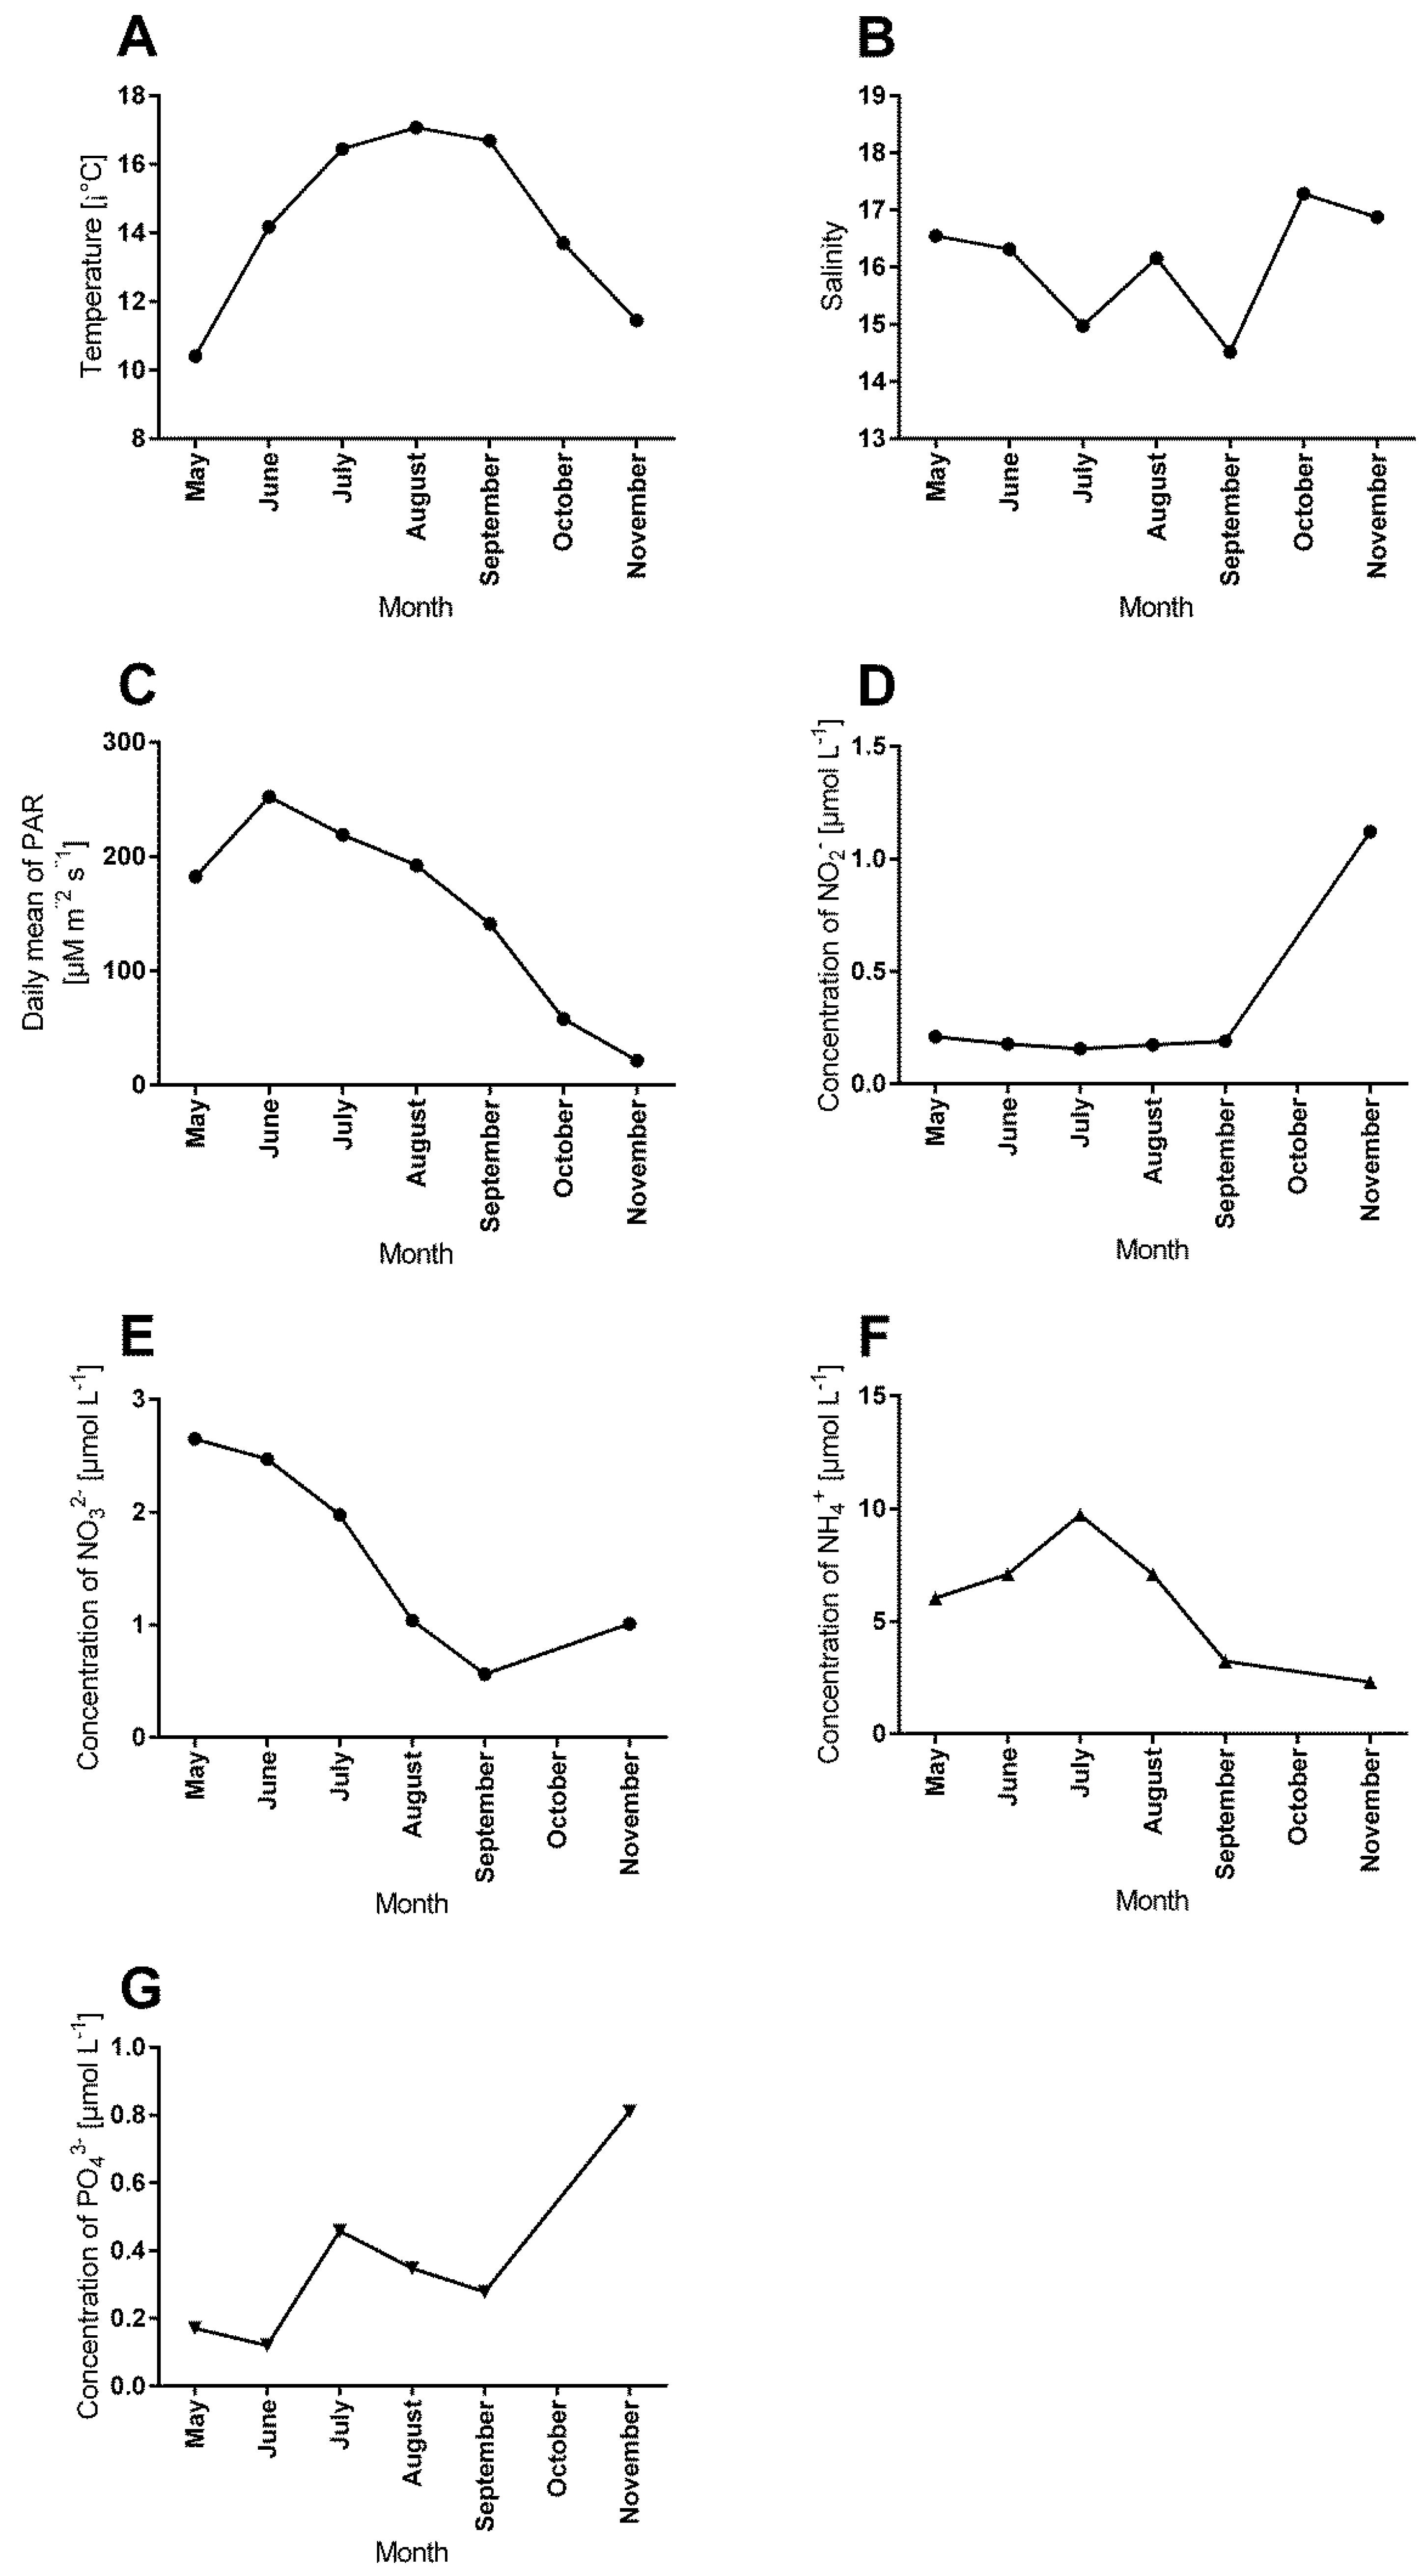
3.4. Correlations between Abiotic Factors and Antifouling Defence Related Variables

Based on the Akaike Information Criterion (AIC) a multiple regression model including the four factors nitrite concentration, nitrate concentration, temperature and ammonium concentration—but not light, salinity and phosphate concentration—was the least complex model that could predict the monthly variation of mean antisettlement defences of Z. marina, although ammonium had no significant impact on the response (p < 0.05; Table 5A). In contrast, temperature was identified as the only of the same seven factors that was needed to predict the monthly variation of rosmarinic acid in these extracts (Table 5B) and the surface concentration increased with increasing temperature (Figure 5).
Two different regression models were developed to predict the bacterial density on Z. marina. One of them included all abiotic environmental factors except temperature, but within this model only light, nitrate concentration and salinity had a significant impact on the density (p < 0.05, Table 5C). The second model included fouling pressure (determined as density of bacteria on glass slides) and the mean antifouling activity of Z. marina surface extracts, but only the first of the two factors had a significant impact (p < 0.05; Table 5D). Altogether, the model based on six abiotic factors was statistically more significant than the model based on two fouling-related factors (p = 0.0018 vs. 0.0047).

4. Discussion

A clear seasonal pattern was observed in almost all the variables that were measured in this study and indicators of microfouling as well as indicators of antimicrofouling defence were overall higher in summer than in winter and spring. For instance, the bacterial fouling pressure on Z. marina increased from May to a peak in August and dropped again afterwards. The reason could be increased bacterial growth in summer, since higher temperatures usually accelerate metabolic activities [44,45] and water temperature also reached its maximum in August. In addition, dissolved organic carbon resources released from macrophytes are also usually higher in summer [46], which typically leads to high cell numbers of bacteria in the marine environment and as a consequence in increased fouling pressure on eelgrass. The seasonal pattern of bacterial densities on the eelgrass surface was largely similar to that of the fouling pressure, although less variable, and both patterns correlated significantly. However, in most months the mean density of settled bacteria was lower on eelgrass plants than on glass slides, which confirms the existence of an antimicrofouling defence in Z. marina plants. Interestingly, the ratio of settled bacteria on eelgrass to settled bacteria on glass slides varied (although non-significantly) with season and lower percentages of the available bacterial settlers settled on eelgrass in summer—when the potential bacterial foulers were most abundant—compared to other seasons. Similarly, the general defence activity of eelgrass surface extracts against four bacterial isolates indicated a stronger deterrent activity in summer.
However, the general defence activity exhibited significant correlations both with the bacterial fouling pressure and the number of bacteria that settled on eelgrass. High defence activity strength was observed when bacterial settlement was high, suggesting that eelgrass adjusts its defence activity to the demand. In addition, high densities of bacteria on eelgrass and high fouling pressure were also correlated with a relatively higher antisettlement activity in the following month, while the density of epiphytic bacteria was not correlated with the antisettlement activity in the preceding month. Thus, the intensity of bacterial settlement possibly influenced the defence activity in the following month, but not vice versa. Both algal macrophytes [47] and terrestrial plants [37,48] are able to recognize bacterial pathogens through relatively unspecific defence elicitors. These are typically constituents of the outer cell envelope of pathogenic and non-pathogenic microbes and activate cellular immune responses when they are recognized. It is not known with certainty whether such an innate immune system also exists in Z. marina, but the eelgrass genome contains candidate receptor genes [49] and the related seagrass Thalassia testudinum is capable to recognize bacterial lipopolysaccharides [50]. Thus, a similar mechanism may also exist in Z. marina and could possibly explain the relation between fouling pressure and defence activity in this experiment: Months with high bacterial settlement were followed by months with high antisettlement activity in eelgrass surface extracts, while months with low antisettlement activity were in tendency followed by months with high bacterial settlement.
As indicated by the multiple regression shown in Table 5D, bacterial fouling pressure nonetheless has a stronger impact on the number of bacteria that settle on eelgrass than the defence activity. The microbial communities on eelgrass leaves generally display high compositional variability and spatial turnover [4,5] and have been suggested to mirror the composition—and thereby the fouling pressure—of adjacent coastal seawater microbiomes [5]. At the same time these leaf surface communities appear also shaped by a filtering mechanism. This mechanism is probably not driven by resource availability [5] and could therefore be driven by the anti-settlement activity investigated in the present study. In conclusion, the effects of eelgrass chemical defence against microsettlers will probably often be blurred, in particular when the fouling pressure is high. This is confirmed by the circumstance that high defence activities correlated only non-significantly with low bacterial densities on the eelgrass surface in the following month.
Although rosmarinic acid was previously identified as the ecologically most relevant defence compound of eelgrass against microfoulers [23] its surface concentration only correlated weakly with defence activity strength in our present study. Thus, the seasonal variation in the general deterrence of bacteria can obviously not be fully explained by seasonal changes of rosmarinic acid concentrations alone and other compounds in addition to rosmarinic acid were also active. However, the surface concentration of rosmarinic acid was correlated with the fouling pressure and eelgrass thus tended to excrete more rosmarinic acid to the surface when the fouling pressure was high. Such a relationship was also detected when the rosmarinic acid concentration was correlated with the fouling pressure in the preceding month, suggesting that eelgrass possibly adapts the surface concentration to the fouling pressure and this adaptation lasts for longer time periods. At the same time, however, rosmarinic acid concentrations correlated quite as well with water temperature and it is not yet possible to decide whether warming drives excretion of rosmarinic acid directly or rather indirectly through acceleration of microfouling.
Our findings of (non-significantly) higher rosmarinic acid surface concentrations in summer and autumn than in spring seem not in agreement with a previous study [28] that reported high rosmarinic acid tissue concentrations in spring and low concentrations during summer and fall. If we ignore the circumstance that the earlier study analysed tissue samples that were dried at temperatures as high as 80 °C—which is not appropriate for phenolic compounds because they become unstable at high temperature and can degrade [51]—the discrepancy could result from the fact that tissue and surface concentrations need not to follow the same dynamics. In fact, the tissue content of phenolic compounds (including rosmarinic acid) in eelgrass is normally much higher than the surface concentration [23] and high surface concentrations could possibly come along with a relative reduction of tissue concentrations, given that all rosmarinic acid on the surface must be excreted from the tissue.
The deterrent activity—but not the concentration of rosmarinic acid—was in addition to temperature also affected by the availability of different forms of inorganic nitrogen (Table 5B) and it increased in tendency when NO2 concentrations were low, NO32− concentrations were intermediate or (non-significantly) NH4+ concentrations were high (data not shown). Given that the different specimens of inorganic nitrogen exhibited very different trends their possible impact on the defensive activity was probably not related with the general supply of inorganic nitrogen and is for this reason difficult to explain. However, the fact that inorganic nitrogen supply only affected the general defence capacity and not the production of rosmarinic acid suggests that it may have mainly influenced the defensive effect contributed by other compounds.
In conclusion, the chemical antifouling defence of eelgrass is obviously subject to seasonal variation. Rosmarinic acid was not significantly correlated with the overall defence activity, except for the activity against L. rosea (data not shown), which suggests that additional defensive compounds may have been involved in the antifouling defence either individually or synergistically. Diosmetin-7-sulphate, luteolin and p-coumaric acid, but also azelaic acid, have been recently identified as other compounds that can under some conditions reach sufficient concentrations on the eelgrass surface to deter microbial settlers [23,52]. Their distribution—as well as that of rosmarinic acid—on the eelgrass surface is extremely inhomogenous and different compounds sometimes reach biologically active concentrations in different sections of the same leaf [52]. As indicated by the present study this distribution in space is also subject to considerable variability over time, which adds complexity to a system that was already known to be highly complex. However, the employment of defence compounds in Z. marina does not appear as chaotic, but rather as finely tuned in space and time. It peaked in summer, when the abundance of both real and potential bacterial foulers was the highest, suggesting that Z. marina perceived the increased abundance of bacteria and reacted with an up-regulation of defence-related compounds. This hypothesis of demand-driven defence activity against microfoulers is also supported by our statistical modelling of bacterial densities on eelgrass surfaces: A model that only used fouling pressure and defence activity strength as predictors explained these densities with similar power as a considerably less parsimonious model that was based upon six different environmental parameters. As a consequence any attempts to exploit natural defence processes against fouling as those of eelgrass for technical solutions might gain in efficiency if they could mimic not only the use of compounds, but also its dynamics.

Author Contributions

Conceptualization: C.G. and F.W.; methodology: C.G., F.W., and M.S.; validation: F.W and C.G.; formal analysis: C.G. and F.W.; investigation: C.G.; resources: F.W.; data curation: C.G.; writing—original draft preparation: C.G.; writing—review and editing: F.W., M.S., and C.G.; visualization: C.G. and F.W.; supervision: F.W.; project administration: F.W. and C.G.; funding acquisition: C.G., F.W., and M.S.

Funding

This research was funded by the Chinese Scholarship Council (CSC), grant number 201206330077 provided to C.G. and by the DFG excellence cluster “Future Ocean”, grant number CP1215 provided to M.S.

Acknowledgments

The authors are thankful to the German Federal Agency for Ship Traffic and Hydrography (BSH, Hamburg) for temperature and salinity measurements, to the meteorology department of GEOMAR (Kiel, Germany) for light measurements and to Dr. Rheena Schumann (Biologische Station Zingst, University of Rostock, Germany) for measurements of nutrients.

Conflicts of Interest

The authors declare no conflict of interest. The funders had no role in the design of the study; in the collection, analyses, or interpretation of data; in the writing of the manuscript, or in the decision to publish the results.

Appendix A

Figure A1. Seasonal change of (A) temperature; (B) salinity; (C) photosynthetically-active radiation (PAR); (D) NO2, (E) NO32−, (F). PO43−; (G) NH4+ in Falckenstein Beach. In (AC) the presented data are means of the week before eelgrass sampling, in (DG) the data are for samples that were collected on the sampling day.
Applsci 09 01258 g0a1

References

  1. Orth, R.J.; Carruthers, T.J.B.; Dennison, W.C.; Duarte, C.M.; Fourqurean, J.W.; Heck, K.L.; Hughes, A.R.; Kendrick, G.A.; Kenworthy, W.J.; Olyarnik, S.; et al. A global crisis for seagrass ecosystems. Bioscience 2006, 56, 987–996. [Google Scholar] [CrossRef]
  2. Duarte, C.; Borum, J.; Short, F.; Walker, D. Seagrass ecosystems: Their global status and prospects. In Aquatic Ecosystems; Polunin, N., Ed.; Cambridge University Press: Cambridge, UK, 2008; pp. 281–294. [Google Scholar]
  3. Schubert, P.R.; Hukriede, W.; Karez, R.; Reusch, T.B.H. Mapping and modeling eelgrass Zostera marina distribution in the western Baltic Sea. Mar. Ecol. Prog. Ser. 2015, 522, 79–95. [Google Scholar] [CrossRef]
  4. Bengtsson, M.M.; Buhler, A.; Brauer, A.; Dahlke, S.; Schubert, H.; Blindow, I. Eelgrass leaf surface microbiomes are locally variable and highly correlated with epibiotic eukaryotes. Front. Microbiol. 2017, 8, 1312. [Google Scholar] [CrossRef]
  5. Fahimipour, A.K.; Kardish, M.R.; Lang, J.M.; Green, J.L.; Eisen, J.A.; Stachowicz, J.J. Global-scale structure of the eelgrass microbiome. Appl. Environ. Microbiol. 2017, 83. [Google Scholar] [CrossRef]
  6. Wahl, M. Epibiosis: Ecology, effects and defences. In Marine Hard Bottom Communities—Patterns, Dynamics, Diversity and Change; Wahl, M., Ed.; Springer: Berlin/Heidelberg, Germany, 2009; pp. 61–72. [Google Scholar]
  7. Harder, T. Marine epibiosis: Concepts, ecological consequences and host defence. In Marine and Industrial Biofouling; Flemming, H.-C., Murthy, P.S., Venkatesan, R., Cooksey, K., Eds.; Springer: Berlin/Heidelberg, Germany, 2009; pp. 219–231. [Google Scholar]
  8. Wahl, M.; Hay, M.E. Associational resistance and shared doom: Effects of epibiosis on herbivory. Oecologia 1995, 102, 329–340. [Google Scholar] [CrossRef]
  9. Barbosa, P.; Hines, J.; Kaplan, I.; Martinson, H.; Szczepaniec, A.; Szendrei, Z. Associational resistance and associational susceptibility: Having right or wrong neighbors. Annu. Rev. Ecol. Evol. Syst. 2009, 40, 1–20. [Google Scholar] [CrossRef]
  10. Bixler, G.D.; Bhushan, B. Biofouling: Lessons from nature. Philos. Trans. R. Soc. A 2011, 370, 2381–2417. [Google Scholar] [CrossRef]
  11. Bryars, S.; Collings, G.; Miller, D. Nutrient exposure causes epiphytic changes and coincident declines in two temperate Australian seagrasses. Mar. Ecol. Prog. Ser. 2011, 441, 89–103. [Google Scholar] [CrossRef] [Green Version]
  12. Romero, J.; Lee, K.-S.; Pérez, M.; Mateo, M.A.; Alcoverro, T. Nutrient dynamics in seagrass ecosystems. In Seagrasses: Biology, Ecology and Conservation; Larkum, A.W.D., Orth, R.J., Duarte, C.M., Eds.; Springer: Dordrecht, The Netherlands, 2006. [Google Scholar]
  13. Munoz, J.; Fotedar, R. Epiphytism of Gracilaria cliftonii (Withell, Millar & Kraft) from Western Australia. J. Appl. Phycol. 2010, 22, 371–379. [Google Scholar]
  14. Michetti, K.M.; Miravalles, A.B.; Hughes, M.H.; Leonardi, P.I. Infection process of Ceramium rubrum (Rhodophyta, Ceramiales) on the agarophyte Gracilaria chilensis (Rhodophyta, Gracilariales). Bot. Mar. 2016, 59. [Google Scholar] [CrossRef]
  15. Goecke, F.; Labes, A.; Wiese, J.; Imhoff, J.F. Chemical interactions between marine macroalgae and bacteria. Mar. Ecol.-Prog. Ser. 2010, 409, 267–299. [Google Scholar] [CrossRef] [Green Version]
  16. Wang, S.; Wang, G.; Weinberger, F.; Bian, D.; Nakaoka, M.; Lenz, M. Anti-epiphyte defences in the red seaweed Gracilaria vermiculophylla: Non-native algae are better defended than their native conspecifics. J. Ecol. 2017, 105, 445–457. [Google Scholar] [CrossRef]
  17. Scardino, A.J.; de Nys, R. Mini review: Biomimetic models and bioinspired surfaces for fouling control. Biofouling 2011, 27, 73–86. [Google Scholar] [CrossRef]
  18. Dobretsov, S.; Abed, R.M.; Teplitski, M. Mini-review: Inhibition of biofouling by marine microorganisms. Biofouling 2013, 29, 423–441. [Google Scholar] [CrossRef] [Green Version]
  19. Wahl, M.; Kroger, K.; Lenz, M. Non-toxic protection against epibiosis. Biofouling 1998, 12, 205–226. [Google Scholar] [CrossRef]
  20. Jensen, P.R.; Jenkins, K.M.; Porter, D.; Fenical, W. Evidence that a new antibiotic flavone glycoside chemically defends the sea grass Thalassia testudinum against zoosporic fungi. Appl. Environ. Microbiol. 1998, 64, 1490–1496. [Google Scholar]
  21. Zidorn, C. Secondary metabolites of seagrasses (Alismatales and Potamogetonales; Alismatidae): Chemical diversity, bioactivity, and ecological function. Phytochemistry 2016, 124, 5–28. [Google Scholar] [CrossRef]
  22. Prabhakaran, S.; Rajaram, R.; Balasubramanian, V.; Mathivanan, K. Antifouling potentials of extracts from seaweeds, seagrasses and mangroves against primary biofilm forming bacteria. Asian Pac. J. Trop. Biomed. 2012, 2, 316–322. [Google Scholar] [CrossRef]
  23. Guan, C.; Parrot, D.; Wiese, J.; Sönnichsen, F.D.; Saha, M.; Tasdemir, D.; Weinberger, F. Identification of rosmarinic acid and sulfated flavonoids as inhibitors of microfouling on the surface of eelgrass Zostera marina. Biofouling 2017, 33, 867–880. [Google Scholar] [CrossRef]
  24. Bryant, J.P.; Chapin, F.S.; Reichardt, P.B.; Clausen, T.P. Response of winter chemical defence in Alaska paper birch and green alder to manipulation of plant carbon/nutrient balance. Oecologia 1987, 72, 510–514. [Google Scholar] [CrossRef]
  25. Vergeer, L.H.T.; Develi, A. Phenolic acids in healthy and infected leaves of Zostera marina and their growth-limiting properties towards Labyrinthula zosterae. Aquat. Bot. 1997, 58, 65–72. [Google Scholar] [CrossRef]
  26. Arnold, T.; Mealey, C.; Leahey, H.; Miller, A.W.; Hall-Spencer, J.M.; Milazzo, M.; Maers, K. Ocean acidification and the loss of phenolic substances in marine plants. PLoS ONE 2012, 7, e35107. [Google Scholar] [CrossRef]
  27. Harrison, P.G.; Durance, C. Seasonal variation in phenolic content of eelgrass shoots. Aquat. Bot. 1989, 35, 409–413. [Google Scholar] [CrossRef]
  28. Ravn, H.; Pedersen, M.F.; Borum, J.; Andary, C.; Anthoni, U.; Christophersen, C.; Nielsen, P.H. Seasonal variation and distribution of two phenolic compounds, rosmarinic acid and caffeic acid, in leaves and roots-rhizomes of eelgrass (Zostera marina L.). Ophelia 1994, 40, 51–61. [Google Scholar] [CrossRef]
  29. Saha, M.; Wahl, M. Seasonal variation in the antifouling defence of the temperate brown alga Fucus vesiculosus. Biofouling 2013, 29, 661–668. [Google Scholar] [CrossRef]
  30. Rickert, E.; Lenz, M.; Barboza, F.R.; Gorb, S.N.; Wahl, M. Seasonally fluctuating chemical microfouling control in Fucus vesiculosus and Fucus serratus from the Baltic Sea. Mar. Biol. 2016, 163. [Google Scholar] [CrossRef]
  31. Wang, S.; Weinberger, F.; Lenz, M. Fluctuations in the strength of chemical antifouling defences in a red macroalga in response to variations in epibiont colonization pressure. Mar. Biol. 2018, 165. [Google Scholar] [CrossRef]
  32. Amade, P.; Lemée, R. Chemical defence of the mediterranean alga Caulerpa taxifolia: Variations in caulerpenyne production. Aquat. Toxicol. 1998, 43, 287–300. [Google Scholar] [CrossRef]
  33. Hellio, C.; Marechal, J.P.; Veron, B.; Bremer, G.; Clare, A.S.; Le Gal, Y. Seasonal variation of antifouling activities of marine algae from the Brittany coast (France). Mar. Biotechnol. 2004, 6, 67–82. [Google Scholar] [CrossRef]
  34. Marechal, J.P.; Culioli, G.; Hellio, C.; Thomas-Guyon, H.; Callow, M.E.; Clare, A.S.; Ortalo-Magne, A. Seasonal variation in antifouling activity of crude extracts of the brown alga Bifurcaria bifurcata (Cystoseiraceae) against cyprids of Balanus amphitrite and the marine bacteria Cobetia marina and Pseudoalteromonas haloplanktis. J. Exp. Mar. Biol. Ecol. 2004, 313, 47–62. [Google Scholar] [CrossRef]
  35. Cronin, G. Resource allocation in seaweeds and marine invertebrates: Chemical defence patterns in relation to defence theories. In Marine Chemical Ecology; McClintock, J., Baker, B., Eds.; CRC Press: Boca Raton, FL, USA, 2001; pp. 325–353. [Google Scholar]
  36. Keen, N.T. Gene-for-gene complementarity in plant-pathogen interactions. Annu. Rev. Genet. 1990, 24, 447–463. [Google Scholar] [CrossRef]
  37. Ponce de León, I.; Montesano, M. Activation of defence mechanisms against pathogens in mosses and flowering plants. Int. J. Mol. Sci. 2013, 14, 3178–3200. [Google Scholar] [CrossRef]
  38. Howe, G.; Schaller, A. Direct defences in plants and their induction by wounding and insect herbivores. In Induced Plant Resistance to Herbivory; Schaller, A., Ed.; Springer: Berlin, Germany, 2008; pp. 7–29. [Google Scholar]
  39. Pereira, R.; da Silva Costa, E.; Sudatti, D.; Da Gama, B. Inducible defences against herbivory and fouling in seaweeds. J. Sea Res. 2017, 122, 25–33. [Google Scholar] [CrossRef]
  40. Wahl, M.; Shahnaz, L.; Dobretsov, S.; Saha, M.; Symanowski, F.; David, K.; Lachnit, T.; Vasel, M.; Weinberger, F. Ecology of antifouling resistance in the bladder wrack Fucus vesiculosus: Patterns of microfouling and antimicrobial protection. Mar. Ecol. Prog. Ser. 2010, 411, 33–48. [Google Scholar] [CrossRef]
  41. Saha, M.; Rempt, M.; Grosser, K.; Pohnert, G.; Weinberger, F. Surface-associated fucoxanthin mediates settlement of bacterial epiphytes on the rockweed Fucus vesiculosus. Biofouling 2011, 27, 423–433. [Google Scholar] [CrossRef]
  42. Saha, M.; Wiese, J.; Weinberger, F.; Wahl, M. Rapid adaptation to controlling new microbial epibionts in the invaded range promotes invasiveness of an exotic seaweed. J. Ecol. 2016, 104, 969–978. [Google Scholar] [CrossRef]
  43. Weinberger, F.; Buchholz, B.; Karez, R.; Wahl, M. The invasive red alga Gracilaria vermiculophylla in the Baltic Sea: Adaptation to brackish water may compensate for light limitation. Aquat. Biol. 2008, 3, 251–264. [Google Scholar] [CrossRef]
  44. Rao, T.S. Comparative effect of temperature on biofilm formation in natural and modified marine environment. Aquat. Ecol. 2010, 44, 463–478. [Google Scholar] [CrossRef]
  45. Zaccone, R.; Azzaro di Rosamarina, M.; Azzaro, F.; Bergamasco, A.; Caruso, G.; Leonardi, M.; La Ferla, R.; Maimone, G.; Mancuso, M.; Monticelli, L.; et al. Seasonal dynamics of prokaryotic abundance and activities in relation to environmental parameters in a transitional aquatic ecosystem (Cape Peloro, Italy). Microb. Ecol. 2014, 67, 45–56. [Google Scholar] [CrossRef]
  46. Barron, C.; Marba, N.; Duarte, C.M.; Pedersen, M.F.; Lindblad, C.; Kersting, K.; Moy, F.; Bokn, T. High organic carbon export precludes eutrophication responses in experimental rocky shore communities. Ecosystems 2003, 6, 144–153. [Google Scholar] [CrossRef]
  47. Weinberger, F. Pathogen-induced defence and innate immunity in macroalgae. Biol. Bull. 2007, 213, 290–302. [Google Scholar] [CrossRef] [PubMed]
  48. Nürnberger, T.; Kemmerling, B. Receptor protein kinases - pattern recognition receptors in plant immunity. Trends Plant Sci. 2006, 11, 519–522. [Google Scholar] [CrossRef] [PubMed]
  49. Olsen, J.L.; Rouze, P.; Verhelst, B.; Lin, Y.C.; Bayer, T.; Collen, J.; Dattolo, E.; De Paoli, E.; Dittami, S.; Maumus, F.; et al. The genome of the seagrass Zostera marina reveals angiosperm adaptation to the sea. Nature 2016, 530, 331–335. [Google Scholar] [CrossRef]
  50. Loucks, K.; Waddell, D.; Ross, C. Lipopolysaccharides elicit an oxidative burst as a component of the innate immune system in the seagrass Thalassia testudinum. Plant Physiol. Biochem. 2013, 70, 295–303. [Google Scholar] [CrossRef] [PubMed]
  51. Palma, M.; Piñeiro, Z.; Barroso, C.G. Stability of phenolic compounds during extraction with superheated solvents. J. Chromatogr. A 2001, 921, 169–174. [Google Scholar] [CrossRef]
  52. Papazian, S.; Parrot, D.; Burýšková, B.; Weinberger, F.; Tasdemir, D. Surface chemical defence of the eelgrass Zostera marina against microbial foulers. Sci. Rep. 2019, 9, 3323. [Google Scholar] [CrossRef]
Figure 1. Seasonal variations of (A) bacterial fouling pressure (measured as bacterial density on glass slides); (B) bacterial density on Z. marina; and (C) bacterial density on Z. marina (shown in B) relative to bacterial fouling pressure (shown in A). In (A)–(C) mean ± SD, n = 4, different letters in single graphs indicate months that are significantly different in Tukey’s post hoc test (p < 0.05).
Applsci 09 01258 g001
Figure 2. Seasonal variation of the antisettlement activity of propan-2-ol surface extract from Z. marina against (A) B. aquimaris; (B) A. stellipolaris; (C) L. rosea, and (D): P. dokdonensis (mean ± SD, n = 4). Increasingly negative values indicate increasing activity strength, positive values indicate attraction. Months that are significantly different (Tukey’s post hoc test, p < 0.05) are marked by different letters.
Applsci 09 01258 g002
Figure 3. Seasonal variation of (A) the mean antisettlement activity of propan-2-ol surface extract from Z. marina against four different bacteria (B. aquimaris, A. stellipolaris, L. rosea, and P. dokdonensis) and (B) rosmarinic acid concentrations on Z. marina surfaces. (Mean ± SD, n = 4). In (A) increasingly negative values indicate increasing activity strength. Months that are significantly different (Tukey’s post hoc test, p < 0.05) are marked by different letters.
Applsci 09 01258 g003
Figure 4. Pearson correlations of bacterial densities on Z. marina (rows 1 and 3) and on glass slides (rows 2 and 4) with the mean activity strength of Z. marina surface extracts against bacterial isolates (rows 1 and 2) and the rosmarinic acid concentration in these extracts (rows 3 and 4). In column (A), bacterial densities were correlated with the traits of extracts sampled in the same month. In (B), bacterial densities were correlated with the traits of extracts sampled one month later (=lagged responses). In (C) bacterial densities were correlated with the traits of extracts sampled one month earlier. Lines represent best fitting linear functions, dotted lines indicate their 95% confidence intervals. For coefficients r of all correlations compare to Table 4.
Applsci 09 01258 g004
Figure 5. Pearson correlation of rosmarinic acid surface concentration and temperature (r = 0.4513; p = 0.0159; Dotted lines represent the 95% CI).
Applsci 09 01258 g005
Table 1. Repeated measures ANOVA of A: bacterial fouling pressure (measured as bacterial density on glass slides; see Figure 1A); B: bacterial density on Z. marina (see Figure 1B); C: bacterial density on Z. marina relative to bacterial fouling pressure (see Figure 1C) in different months.
SSDFMSFp
AIntercept172,931,1511172,931,15181.220.0029
Error6,387,13632,129,045
Month79,883,772613,313,96219.02<0.0001
Error12,596,88718699,827
BIntercept54,269,905154,269,90579.120.0030
Error2,057,8063685,935
Month8,559,98061,426,6635.760.0017
Error4,461,12218247,840
CIntercept177,998.31177,998.346.370.0065
Error11,517.033839.0
Month34,337.665722.91.920.1316
Error53,516.4182973.1
Table 2. Repeated measures ANOVA of chemical defence of Z. marina against A: B. aquamaris; B: A. stellipolaris; C: L. rosea; D: P. dokdonensis. Within-measures factor was the month of sampling.
SSDFMSFp
AIntercept5.771715.77174604.62<0.0001
Error0.003830.0013
Month0.044160.00732.670.0492
Error0.0494180.0027
BIntercept0.450310.45032517.79<0.0001
Error0.000530.0002
Month0.042560.007113.06<0.0001
Error0.0098180.0005
CIntercept7.804617.80467108.19<0.0001
Error0.003330.0011
Month0.093360.01558.930.0001
Error0.0313180.0017
DIntercept0.541910.541968.500.0037
Error0.023730.0079
Month0.295260.04925.970.0014
Error0.1483180.0082
Table 3. Repeated measures ANOVA of (A) the mean antisettlement activity of propan-2-ol surface extract from Z. marina against four different bacteria (B. aquimaris, A. stellipolaris, L. rosea, and P. dokdonensis) and (B) rosmarinic acid concentrations on Z. marina surfaces. Within-measures factor was the month of sampling.
SSDFMSFp
AIntercept0.0860710.086070.210.8885
Error0.0007030.000233
Month0.0653260.010899.77<0.0001
Error0.02005180.001114
BIntercept0.017110.0171118.570.0017
Error0.000430.0001
Month0.00056<0.00011.580.2097
Error0.001018<0.0001
Table 4. Pearson correlations of bacterial densities on Z. marina (BD) and on glass slides (FP) with the mean activity strength of Z. marina surface extracts against bacterial isolates (AS) and the rosmarinic acid concentration (RA) in these extracts. In (A), bacterial densities were correlated with AS and RA in extracts sampled in the same month. In (B), bacterial densities were correlated with AS and RA in extracts sampled one month later (=lagged responses). In (C) BD was the lagged response and correlated with AS and RA in extracts sampled one month earlier. Bold types indicate significant correlations (p < 0.05).
ABC
Parametersrp-ValueRp-ValueRp-Value
BD to AS−0.73950.0116−0.73300.02370.63680.123
FP to AS−0.70750.0256−0.71120.0376
BD to RA0.49890.37090.61950.3021−0.69130.0545
FP to RA0.72720.0160.75800.013
Table 5. Multiple linear regression models to explain (A) the general antisettlement activity of Z. marina surface extracts in different months, (B) the rosmarinic acid content in these extracts and (C, D) the bacterial density on Z. marina leaves in different months. The models were selected with the STEP procedure implemented in R. They are the least complex models without loss of information (based on the Akaike Information Criterion (AIC)) that could be derived from initial models containing seven different abiotic factors in (A) to (C) and the two factors fouling pressure and mean antisettlement activity strength in (D).
A SSDFMSFp
NH4+0.00356410.003564 3.250.0875
NO32−0.03692810.03692833.640.0001
Temperature0.01437410.01437413.100.0018
NO20.00676110.0067616.160.0226
Residuals0.020856190.001098
B SSDFMSFp
Temperature0.000410.00047.540.0118
Residuals0.0012220.0001
C SSDFMSFp
PO43−340,7431340,743 1.290.2721
Salinity1,344,37711,344,3775.080.0376
Light4,942,56314,942,56318.690.0005
NO2828,7751828,775 3.130.0946
NH4+223,2011223,2010.840.3711
NO32−1,686,02611,686,026 6.380.0218
Residuals4,495,25317
D SSDFMSFp
Fouling pressure4,800,25114,800,25112.110.0022
Defence strength734,2421734,2421.850.188
Residuals8,326,44321396,497

