Abstract
Hydrodeoxygenation (HDO) of bio-oil is a method of bio-oil upgrading. In this paper, x%CeO2–Ni–Cu/HZSM-5 (x = 5, 15, and 20) was synthesized as an HDO catalyst by the co-impregnation method. The HDO performances of x%CeO2–Ni–Cu/HZSM-5 (x = 5, 15, and 20) in the reaction process was evaluated and compared with Ni–Cu/HZSM-5 by the property and the yield of upgrading oil. The difference of the chemical composition between bio-oil and upgrading oil was evaluated by GC-MS. The results showed that the addition of CeO2 decreased the water and oxygen contents of upgrading oil, increased the high heating value, reduced acid content, and increased hydrocarbon content. When the CeO2 addition was 15%, the yield of upgrading reached the maximum, from 33.9 wt% (Ni–Cu/HZSM-5) to 47.6 wt% (15%CeO2–Ni–Cu/HZSM-5). The catalytic activities of x%CeO2–Ni–Cu/HZSM-5 (x = 5, 15, and 20) and Ni–Cu/HZSM-5 were characterized by XRD, N2 adsorption–desorption, NH3-Temperature-Programmed Desorption, H2-Temperature-Programmed Reaction, TEM, and XPS. The results showed that the addition of CeO2 increased the dispersion of active metal Ni, reduced the bond between the active metal and the catalyst support, increased the ratio of Bronsted acid to total acids, and decreased the reduction temperature of NiO. When the CeO2 addition was 15%, the activity of catalyst reached the best. Finally, the carbon deposition resistance of deactivated catalysts was investigated by a Thermogravimetric (TG) analysis, and the results showed that the addition of CeO2 could improve the carbon deposition resistance of catalysts. When the CeO2 addition was 15%, the coke deposition decreased from 41 wt% (Ni–Cu/HZSM-5) to 14 wt% (15%CeO2–Ni–Cu/HZSM-5).
1. Introduction
Biomass is one of the most promising renewable energy sources for supplementing traditional fossil fuels; at present, biomass energy accounts for 10–14% of the world’s energy supply [1]. A promising method for producing alternative fuel is to convert biomass into bio-oil. However, bio-oil composition is complex, its chemical properties are unstable, and it requires further modification and upgrades to become a high-quality liquid fuel. Presently, one of the most effective means of upgrading is the catalytic hydrogenation of bio-oil, in which catalyst selection plays a key role.
In recent years, increasing attention has been paid to Ni-based catalysts with a relatively high activity. Zhang et al. [2] prepared a series of catalysts by loading Ni onto molecular sieves (HZSM-5 and Al2O3). Phenol was selected as a model compound to observe the hydrogenation activity of the catalysts. Their results showed that when the Ni loading was 10 wt% and the reaction temperature was 240 °C, the activity of the catalyst was the highest and the conversion efficiency of phenol reached the highest value (91.8%). Zhang et al. [3] used the impregnation method to load different Ni contents on the mixed carriers of Al2O3–SiO2, Al2O3–TiO2, TiO2–SiO2, and TiO2–ZrO2. The catalyst was tested in reaction with guaiacum, a model compound of bio-oil. The experimental results showed that Ni/TiO2–ZrO2 catalysts exhibited a better hydrodeoxygenation (HDO) activity. The conversion of bio-oil was 19.3%, the pH changed from 2.4 to 4.2, and the water content decreased remarkably from 51.4% to 1.5%. In addition, the Ni–Cu bimetallic catalyst was prepared by considering the advantages and disadvantages of various catalysts. The experimental results also showed that the HDO effect of the Ni–Cu bimetallic catalyst was significantly improved. Yao and Goodman [4] loaded Cu onto Ni metal (with hydrogen atoms) and applied the temperature-rising desorption method for catalyst characterization. They found that the hydrogen atoms adsorbed on Ni metal overflowed onto the surface of the Cu atoms, which provided a new idea for the design of catalysts. In particular, a small amount of active metals (i.e., Cu) was added to the transition metals (i.e., Ni) to produce Ni–Cu alloys, which not only improved the dispersion of the active metal Ni but also reduced the binding energy between the active metals and the hydrogen atom. The method allowed the activated hydrogen to easily be desorbed from the catalyst surface and to enter the reaction system, thus effectively improving the hydrogenation activity of the catalyst. A small amount of Cu can serve as hydrogen storage, and it can also decrease the reduction temperature of the metal, thereby laying a foundation for the preparation of an anti-coke catalyst in the hydrogenation and deoxidation of bio-oil. Ardiyant et al. [5] prepared a series of bimetallic catalysts by impregnating different Ni–Cu contents onto δ-Al2O3, in which the total metal content was 20 wt%. The effects of different catalysts on bio-oil HDO were studied in the Ni/Cu mass ratio range of 0.32–8.1. Their results showed that the content of aliphatic hydrocarbons in the products of Ni–Cu bimetallic catalysts was significantly higher than that of single-metal Ni catalysts. When the Ni/Cu ratio reached 8, the yield of the oil phase was 40%, the oxygen removal efficiency was 57%, and the hydrogen consumption of the catalyst was the highest. The catalytic activity was optimal in the process of bio-oil catalytic hydrogenation. However, although Ni–Cu-based catalysts can significantly improve the HDO of bio-oil, the coke deposition on the catalysts remains a difficult problem. Coke deposition is the main cause of catalyst deactivation [6,7,8,9,10]. The bio-oil hydrogenation process involves the polymerization and condensation of unsaturated components, and the macromolecule compounds generated will deposit on the surface and the pore of the catalyst, thus forming a coke deposit. Coke deposits can cover the active sites of catalysts and hinder the contact between the reactants and active sites of catalysts. The catalyst will then be deactivated. Li et al. [11] studied the coke deposition during the HDO process, and the results showed that coke deposits formed at high temperatures were more difficult to be desorbed. Zhang et al. [12] studied the effect of reaction temperature on deoxidation in the HDO process and found that deoxygenation of bio-oil was a function of time and temperature with the increase of temperature resulting in decreasing deoxygenation. Therefore, the reaction temperature of deoxyhydrogenation should be controlled within a suitable range.
Rare earth metal oxides (e.g., CeO2 and LaO3) can significantly improve the activity, stability, and anti-coking ability of nickel-based catalysts. The addition of a small amount of rare earth oxides in the catalyst as a promoter has received considerable attention from different researchers [13,14]. CeO2, as an effective redoxagent, can convert between Ce4+ and Ce3+ to achieve the conversion between oxygen and oxygen vacancies, resulting in a good oxygen storage capacity [15]. Thus, this work explores the effect of dispersion, particle size, and the reduction ability of the active component of Ni with the addition of CeO2 based on Ni–Cu/HZSM-5 (Ni:Cu = 8:1).
2. Materials and Methods
2.1. Materials
All reagents used were of analytical grade. Toluene, n-butyl alcohol, ethanol, nickel nitrate, cupric nitrate, and cerium nitrate were obtained from Sinopharm Chemical Reagent Co. HZSM-5 zeolite (Si/Al = 50) was purchased from Nankai University Catalyst Co. Bio-oil was produced by the fast pyrolysis of rice husk at 500 °C in a self-made fluidized bed reactor at the Institute of Environmental Sciences, Zhengzhou University, China.
2.2. Preparation of Catalyst
The CeO2–Ni–Cu/HZSM-5 catalyst was prepared by the co-impregnation method. First, the load of Ni–Cu (8:1) was 15%. X g of Ce(NO3)2·6H2O (X = 0.5, 1.0, and 1.5), 2.643 g of Ni(NO3)2·6H2O, and 0.2534 g of Cu(NO3)2·3H2O were mixed and stirred with 60 mL of deionized water. Then, 4 g of HZSM-5 was added to the solution, which was then heated in a water bath at 60 °C and evaporated to a paste state. Subsequently, the specimen was dried at 110 °C for 12 h and then calcined at 400 °C for 2 h. Since the decomposition temperature of cerium nitrate is about 200 °C and that of nickel nitrate and cupric nitrate about 300 °C, to ensure a complete decomposition of these compounds into oxides, we used 400 °C for the calcination of our catalyst. This calcination temperature of 400 °C further ensured the stability of the catalyst at our reaction temperature (up to 330 °C). Finally, the catalyst was placed in a quartz tube, was mixed with hydrogen and argon (Ar:H2 = 1) into a quartz tube, was increased to 460 °C at a rate of 5 °C/min, and then was maintained at 460 °C for 2 h. Thus, NiO in the catalyst was reduced to nickel in hydrogen atmosphere. The specimen used in the experiments was Ni–Cu/HZSM-5 with 0%, 5%, 15%, and 20% CeO2 and labeled as Ni–Cu/HZSM-5, 5%CeO2–Ni–Cu/HZSM-5,15%CeO2–Ni–Cu/ HZSM-5, and 20%CeO2–Ni–Cu/HZSM-5, respectively.
2.3. Experimental Device and Process
The catalytic HDO reaction of the bio-oil was conducted in a 500 mL stainless autoclave (Weihai Automatic Control Co.). The temperature control system was composed of an electric heating sleeve and a thermocouple. Adding polar solvents (toluene and n-butanol) and supercritical fluid (n-butanol) to bio-oil can improve the homogenization of bio-oil and can reduce coke deposition in the reaction process [16,17]. Furthermore, using toluene and n-butanol as solvents can enhance the fluidity and thermal conductivity of bio-oil and can reduce the coke deposition of the catalyst in the reaction process [16,17]. Before the reaction, 60 g of bio-oil, 20 g of toluene, 20 g of n-butanol, and 5 g of catalyst were added into the reaction vessel. Then, the air in the reactor was replaced with hydrogen. After the replacement, the initial hydrogen pressure was 2 MPa at room temperature. The heating rate of the reactor was 3 °C/min. After the reaction, the reactor was cooled to room temperature, and the catalyst was filtered from the liquid phase and washed with alcohol for further analysis. The liquid phase was then separated via a separator funnel into two phases (i.e., upgrading oil and water phase). The experiment was repeated three times, and the data were the average of these three runs. The upgrading oil yield (Y) is calculated as follows [18]:
where mproduct and mfeed denote the mass of the upgrading oil and the feed-stock, respectively.
2.4. Analytical Methods
2.4.1. Bio-Oil Analysis
The water content in the sample was determined by using a KF-1A semiautomatic moisture analyzer (Shanghai Baoshan Seiko Electronic Instrument Factory). The heating value of the bio-oil was measured by a ZDHW-6000 automatic calorimeter (Hebi, Henan).
The elemental analysis of the bio-oil was conducted by using a Flash EA 1112 analyzer (Thermo Electron Co.). GC-MS was performed using Agilent 7890A-5975C equipped with a VF-1701ms capillary column (30 m × 0.25 mm × 0.25 μm). The GC split was 1:100, and the injector temperature was set to 250 °C; the injection volume was 1 μL (samples were diluted 10-fold with CH2Cl2). The oven temperature was maintained at 50 °C for 3 min, increased to 200 °C at a rate of 3 °C/min, and then maintained at 200 °C for 50 min.
2.4.2. Catalyst Characterization
XRD was performed by using a D500 powder diffractometer (Siemens, Germany). Cu-Kα was a used as the ray source with a step length of 0.05°, a voltage of 35 kV, a current of 30 mA, and a scanning range of 10° < (2θ) < 90°. TEM was obtained by using a Tecnai G2 20S-TWIN projective electron microscope (FEI Company, Holland) with an acceleration voltage 220 kV.
N2 adsorption-desorption was used to determine the specific surface area and the pore type of the catalyst. The calculation of the specific surface area was based on the Brunauer–Emmett–Teller equation, and the calculation of the pore volume was based on the t-plot method.
NH3-Temperature-Programmed Desorption (TPD) was carried out in a quartz tube reactor with a thermal conductivity detector (TCD). Of the sample, 100 mg was pretreated in a flow of helium (30 mL/min) at 400 °C for 1 h, and after cooling to 100 °C, ammonia adsorption was carried out. Subsequently, excessive physisorbed ammonia was removed by purging with helium at 100 °C for 2 h.
H2-Temperature-Programmed Reaction (TPR) was performed on an Autosorb-iQ/Autosorb-iQ (3P Instruments, Germany) fully automatic gas meter. Of the sample, 70 mg was pretreated in a flow of Ar (20 mL/min) at 200 °C for 30 min and, after cooling to room temperature, was switched to a reducing gas flow of 5% H2–Ar (40 mL/min) with a temperature programmed reduction from room temperature to 950 °C with a 10 °C/min temperature programmed. Measurement of the H2 content changed in the tail gas by TCD after dehydration in a cold trap (−85 °C).
XPS was performed with an ESCALAB 250 spectrometer (Thermo Fisher Scientific, USA) to determine the surface elemental composition and valence of each element.
A TG analysis was performed on an STA 449 PC thermal analyzer (NETZSCH-Gerätebau GmbH, Germany) by using 5 mg of the sample at an air flow rate of 60 mL/min and a ramp rate of 10 °C/min. The instrument used has interchangeable sensors for simultaneous Differential Scanning Calorimetry (DSC) measurements.
3. Results and Discussion
3.1. Effect of CeO2 on the Catalytic Yield
The CeO2 content of Ni–Cu/HZSM-5 is not the only important factor affecting the HDO process. The reaction temperature also has a significant effect on the catalytic activity. Here, we describe the HDO effect of catalysts with different amounts of CeO2 and the HDO effect with specific CeO2 contents under different reaction temperatures.
3.1.1. Upgrading Oil Yield
Figure 1 shows the yield (Y) change of upgrading oil at 270 °C for 1 h with different catalysts. Y is higher with the addition of CeO2 than that without CeO2, and Y increases first and then decreases with increasing CeO2 added content. With 15% CeO2–Ni–Cu/HZSM-5, Y can reach the highest value, accounting for 47.6 wt%.
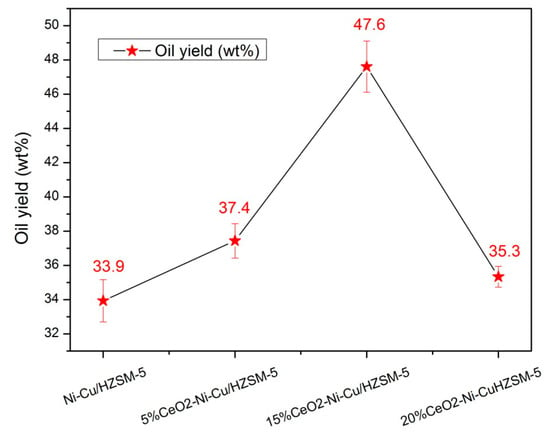
Figure 1.
The yield (Y) with different catalysts at 270 °C for 1 h.
To further explore the effect of reaction temperature of the Ni-based catalysts with 15% CeO2 for the HDO of bio-oil, we used 15%CeO2–Ni–Cu/HZSM-5 at different temperatures. As shown in Figure 2, Y starts to decrease with the increase of reaction temperature, and Y declines rapidly when the temperature is between 270 and 300 °C.
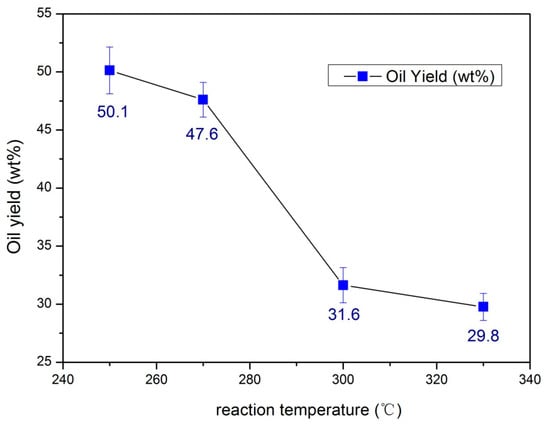
Figure 2.
The yield (Y) of 15%CeO2–Ni–Cu/HZSM-5 under different reaction temperatures.
3.1.2. Main property of bio-oil
The property of bio-oil after HDO is an important index for evaluating catalytic activity. Table 1 lists the main properties of bio-oil and upgrading oil at 270 °C for 1 h with different catalysts. Compared with those of the bio-oil, the main properties of the upgrading oil with different catalysts improved in varying degrees. The water and oxygen contents decreased significantly with significantly increasing high heating value. When the CeO2 content was 15%, the oxygen content reached the lowest (21.7%), indicating that the HDO effect was at the optimum at this time. At 15% CeO2, the water content of the oil phase was slightly high and the high heating value was slightly low, but the difference was negligible. Considering the oil yield and the effect of HDO, the Ni–Cu/15% CeO2-HZSM-5 catalyst appears to be suitable for the HDO process.

Table 1.
The properties of bio-oil and upgrading oil with different catalysts at 270 °C for 1 h.
The effect of HDO increased with the rise of reaction temperature, and the water and oxygen contents decreased with the increase of temperature (Table 2), indicating that the HDO effect of bio-oil gradually increased with temperature. However, the amount of coke deposited on the catalyst after the reaction increased rapidly at the reaction temperature from 270 to 300 °C. The coke content on the surface of the catalyst in the bio-oil HDO process was measured by TG analysis. The weight losses of the 15% CeO2–Ni–Cu/HZSM-5 catalyst at 250, 270, 300, and 330 °C for 1 h were 7, 15, 48, and 54%, respectively (Figure 3). The carbon depositions on the 15% CeO2–Ni–Cu/HZSM-5 catalyst were 7%, 15%, 48%, and 54% (wt%) after reactions at 250 °C, 270 °C, 300 °C, and 330 °C for 1 h, respectively. Temperature is one of the main factors affecting coke deposition, and it causes the deactivation of the catalyst. Y decreased rapidly between 270 °C and 300 °C. From the energy utilization perspective, 270 °C is the suitable temperature for HDO when the CeO2 content is 15% of the Ni–Cu/HZSM-5 catalyst.

Table 2.
The properties of upgrading oil at different temperatures with 15%CeO2–Ni–Cu/HZSM-5 catalyst.
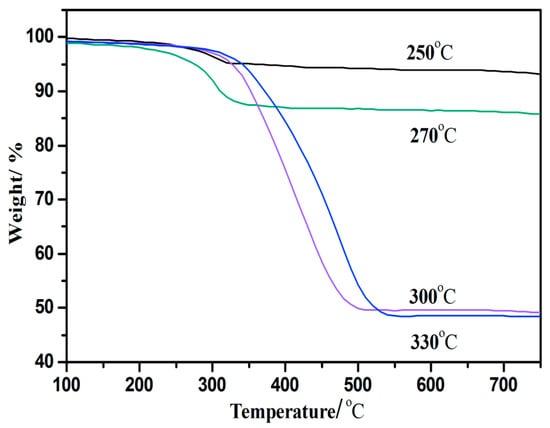
Figure 3.
The thermogravimetric profiles of the 15%CeO2–Ni–Cu/HZSM-5 catalysts after hydrodeoxygenation (HDO) at different temperatures at a reaction time of 1 h.
3.1.3. GC-MS Analysis
In order to explore the changes of chemical compositions in bio-oil before and after an HDO reaction, the composition of bio-oil and upgrading oil was determined by GC-MS. The results obtained are sorted out as shown in Table 3. The main components of bio-oil before HDO were phenols, ketones, and acids; after an HDO reaction with different catalysts, some chemical compositions changed in the upgrading oil. For the upgrading oils, their common changes were (1) that the content of acid, alcohol, and ketone decreased significantly and (2) that the content of esters and hydrocarbons increased significantly. For the upgrading oil with 15%CeO2–Ni–Cu/HZSM-5, the content of acid was the lowest, while the esters content reached the highest and the hydrocarbons also reached the maximum.

Table 3.
The chemical composition of bio-oil and upgrading oils.
3.2. Characterization of Catalysts
3.2.1. XRD
The diffraction peaks for each catalyst near 6.7°and 24.8° were due to the catalyst support (HZSM-5, PDF# 42–0305), and the peak near 46.5° was due to the Ni–Cu/HZSM-5 catalyst without CeO2 (Figure 4). These peaks were expected to be the Ni–Al compound formed between the metal and the catalyst support (Ni–Al PDF# 20–0019). However, the addition of CeO2 into the Ni–Cu/HZSM-5 catalyst inhibited the presence of the Ni–Al compound phase, in which the intensity of the peak (near 46.5°) was remarkably decreased. The addition of CeO2 can seemingly reduce the bond between the active metal and the catalyst support and can improve the catalytic activity of the catalyst. The crystal size was calculated by the Scherrer formula (Table 4). The crystal size decreased first and then increased with the increase of the CeO2 content. When the content of CeO2 was 15%, the average particle size of the catalyst was the smallest at 19.2 nm.
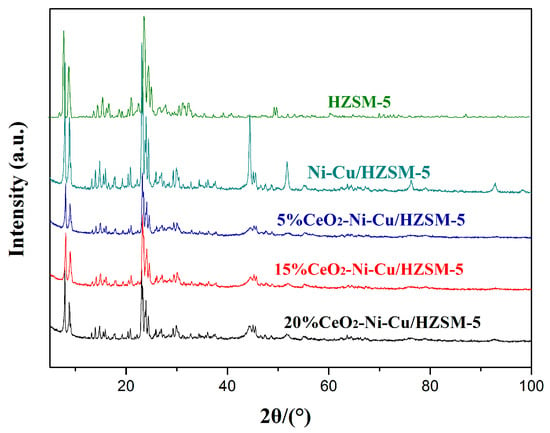
Figure 4.
The XRD patterns of HZSM-5 and Ni–Cu/HZSM-5 with different CeO2 contents.

Table 4.
The crystal particle size of the catalyst.
3.2.2. TEM
The catalyst image before an HDO reaction was captured by TEM (see Figure 5a–d for CeO2 contents of 0, 5, 15, and 20%, respectively). The average size of the catalyst with CeO2 is smaller than that without adding CeO2. A suitable CeO2 (e.g., 15%) content can effectively inhibit grain growth and, hence, provide a better dispersion of Ni with the smallest particle size (Figure 5). However, at a higher 20% CeO2 content, the aggregation of Ni appears due to excessive CeO2 accumulation on the pore/surface of the catalyst. Therefore, the catalyst with a 15% CeO2 addition is more suitable as the catalyst for the HDO of bio-oil.
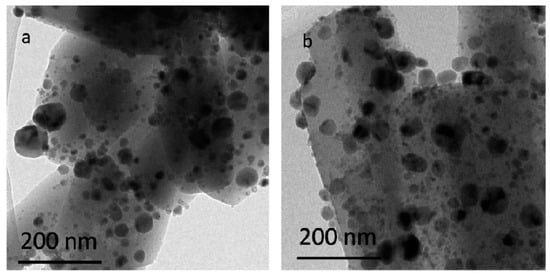
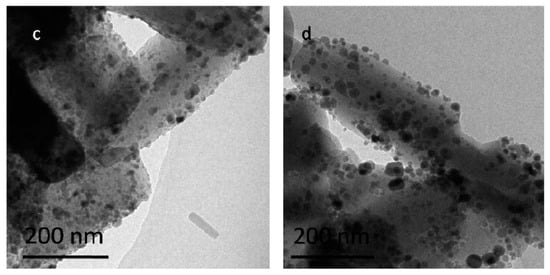
Figure 5.
TEM images of different catalysts: (a) Ni–Cu/HZSM-5, (b) 5%CeO2–Ni–Cu/HZSM-5, (c) 15%CeO2–Ni–Cu/HZSM-5, and (d) 20%CeO2–Ni–Cu/HZSM-5.
3.2.3. N2 adsorption-desorption
The surface area and pore volume measured by nitrogen adsorption-desorption for the different catalysts before and after the 1 h HDO reaction at 270 °C are shown in Table 5. As can be seen from Figure 5, with the increase of the CeO2 content, the dispersion of Ni increased; furthermore, nickel became smaller particles attached to the catalyst support with a decreased specific surface area (Table 5). Clearly, the specific surface area and pore volume of the catalyst were reduced with the addition of CeO2, but the activity of the catalyst was improved (see yield in Figure 1). After the HDO reaction, carbon was deposited on the catalyst, resulting in the decreased surface area and pore volume of the catalyst. For Ni–Cu/HZSM-5, 5%CeO2–Ni–Cu/HZSM-5, 15%CeO2–Ni–Cu/HZSM-5, 20%CeO2–Ni–Cu/HZSM-5, the differences in the surface area before and after the reaction were 188, 113, 100, and 105 m2/g, respectively. The advantage of using CeO2 is reflected by the reduction of the specific surface area, e.g., a 54% reduction after HDO with Ni–Cu/HZSM-5, whereas only a 31% reduction is observed in 15%CeO2–Ni–Cu/HZSM-5.

Table 5.
The specific surface area and pore volume of different catalysts before and after the reaction.
3.2.4. NH3-TPD
The acidity of the surface of the catalyst can be effectively measured by NH3-TPD. Figure 6 presents the NH3-TPD curves of the catalysts with different CeO2 contents, in which Figure 6a–d correspond to CeO2 contents of 15, 5, 20, and 0%, respectively. The four catalysts with different CeO2 contents have the same peaks at 225 and 430 °C that correspond to the Bronsted and Lewis acid positions [19], respectively. The extent of these two peaks before the reaction is shown in Table 6.
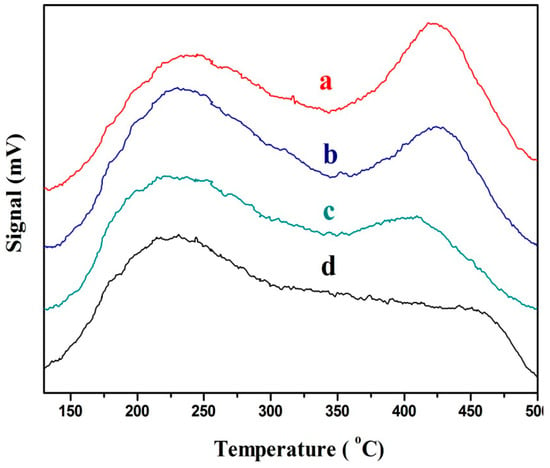
Figure 6.
The NH3-Temperature-Programmed Desorption (TPD) curves of the catalysts with different CeO2 contents: (a) 15%CeO2–Ni–Cu/HZSM-5, (b) 5%CeO2–Ni–Cu/HZSM-5, (c) 20%CeO2–Ni–Cu/HZSM-5, and (d) Ni–Cu/HZSM-5.

Table 6.
The peak areas for the catalysts with different CeO2 contents.
The total acidic sites of the CeO2 catalyst decreased significantly with the addition of CeO2. However, the Bronsted acid sites increased first and then decreased at 20% CeO2. At a 15% CeO2 addition, the ratio of Bronsted acid to total acids sites was the largest (51%) as compared to only 21% for Ni–Cu/HZSM-5. The increase in ratio of Bronsted acid to total acids may enhance the cracking ability of large molecules [20].
3.2.5. H2-TPR
H2-TPR can effectively determine the reducing capacity of the catalyst. Figure 7 shows the H2-TPR profiles of the catalyst before the HDO reaction. All the samples have no peak at the high temperature (>600 °C); this temperature corresponds to the reduction peak of nickel spinel [21], indicating no nickel spinel was produced in the experimental catalysts. Figure 4 of the XRD plots indicates the absence of the spinel phase for Ni. For example, NiO is shown in 2θ of 37.8, 44.7, and 62.3 (PDF# 78–0429) and NiAl2O4 in 2θ of 37.8, 42.3, and 68.4 (PDF# 78–0552) as reported by Shih and Leckie [22]—these 2θ data are not shown in the Figure 4 XRD spectra, albeit 44.7° indicates a slight peak. The slight difference in TPR profiles (with respect to peak pattern and corresponding temperatures) can be ascribed to the variation in Ni dispersion and active metal–HZSM-5 interaction. Compared with the reduction peaks of the catalyst with a 20% CeO2 content, the catalyst with a 15% CeO2 content exhibited a sharper reduction peak, indicating the presence of more uniform and highly dispersed metal particles [23]. Therefore, different CeO2 contents have slight effects on the reduction temperature of the catalyst. In particular, the reduction temperature reached the lowest at the catalyst with a 15% CeO2 content. Usually, the rapid deactivation of the catalyst is caused by the carbon deposition at a high HDO temperature. A low reduction indicates a low-temperature HDO process, hence, the less degree of carbon deposition on the catalysts during HDO. The catalyst with 15% CeO2 can promote the hydrogenation process at low temperatures, and the degree of carbon deposition on the catalysts can be effectively slacked during HDO.
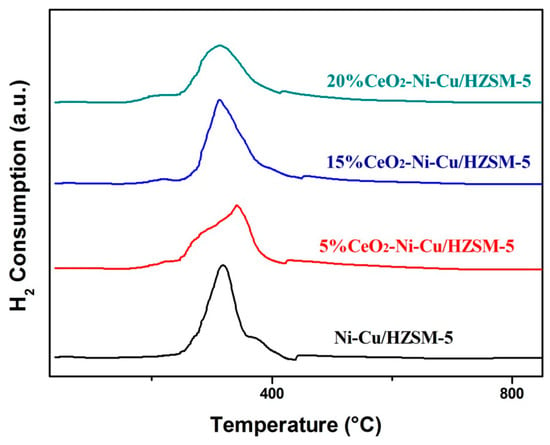
Figure 7.
The H2-Temperature-Programmed Reaction (TPR) profiles of catalysts with different CeO2 contents.
3.2.6. XPS
XPS was used to characterize the electronic state and distribution of elements on the surface of the catalysts. By comparing the XPS spectra of the 15%CeO2–Ni–Cu/HZSM-5 catalyst before and after the reaction, the change in the valence state of cerium before and after the reaction can be analyzed. Furthermore, by comparing the XPS spectra of different catalysts under the same reaction conditions, the morphology and distribution of the carbon deposited on the surface of the catalyst can be effectively analyzed.
The binding energies near the peaks shown in Figure 8 and Figure 9 were directly retrieved from the instrument. The XPS analyses for the catalyst before and after HDO exhibited peaks in the vicinity of 884.5 and 905.4 eV (Figure 8a), which corresponded to the electron bonding energy of Ce3d5/2 and Ce3d3/2, respectively [24]. The electronic binding energy of 920.6 eV (Figure 8a) belongs to the position peak of Ce4+ [25]. Figure 8b shows that the binding energy of Ce in the catalyst after the reaction exhibits approximately more than 2.5 eV of chemical shift of the Ce3d peaks, indicating a change in the valence state of Ce in the strong reduction atmosphere. According to the standard XPS spectra of Ce, the peak of Ce3d5/2 (887.9 eV) in the catalyst before the reaction is attributable to CeO2, whereas the peak of Ce3d5/2 after the reaction (885.1 eV) is attributable to the low-valence Ce, indicating that the Ce4+ content of the catalyst is reduced to Ce3+ during the reaction. In addition, part of the Ce4+ in CeO2 is reduced to Ce3+, oxygen vacancies are produced, and free electrons and lattice oxygen are released. The released electrons can be transferred to the active site of Ni0, thereby adjusting the electronic state of Ni atom on the surface, improving the interaction between the carrier and the active component resulting in better dispersion of Ni [26,27], and thus improving the catalyst’s redox ability. The release of lattice oxygen is also beneficial in transferring active carbon species on the catalyst surface, thus promoting coke removal [27,28].
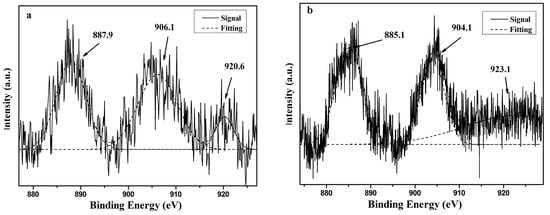
Figure 8.
The Ce3d XPS spectra of 15%CeO–Ni–Cu/HZSM-5 before (a) and after (b) the reaction.
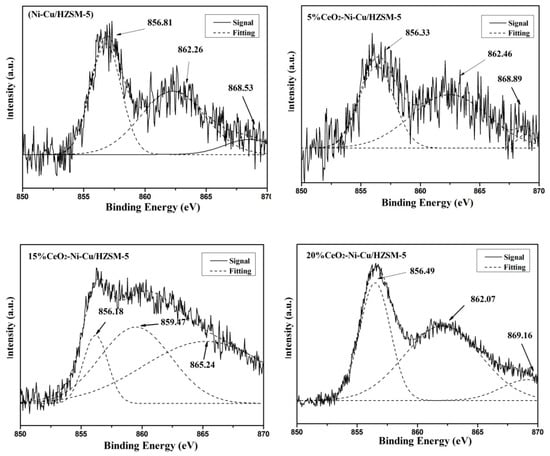
Figure 9.
The Ni 2p XPS spectra of the deactivation catalyst after the reaction at 270 °C for 1 h.
Figure 9 shows the Ni 2p XPS spectra of the used catalyst after the reaction at 270 °C for 1 h. The electron binding energies of Ni 2p in the Ni-based catalyst were approximately 856.5, 862, and 870 eV, corresponding to the Ni–O bond, the shakeup peaks, and the Ni0 of the reduced state, respectively [29]. As seen from Figure 9, the peaks (865–869 eV) near 870 eV (Ni0 of the reduced state) is the lowest in the catalyst without adding CeO2, and correspondingly, the 856 eV peak (Ni–O) was relatively the highest. Thus, a small part of Ni0 was translated into the Ni–O bond with the CeO2 added catalysts resulting in a small amount of nickel oxidized, eventually leading to enhanced hydrogenolysis. In other words, the virgin catalyst limits the HDO reaction, and the catalyst becomes more conducive to carbon deposition [30]. The Ni0 content in the catalyst with CeO2 addition is higher than that without CeO2, and a slightly negative shift in the electron bonding energy is observed, which proves that the addition of CeO2 can increase the electron density of Ni0, increase the electronegativity of Ni, and improve the reduction ability of Ni [30]. Moreover, the Ni0 content and the electron binding energy of the catalysts with different CeO2 contents were also significantly different. In short, at a 15% CeO2 content, the Ni0 content was the largest, implying that the carbon deposition was the lowest and the carbon resistance was the strongest.
3.2.7. TG
A TG analysis is an effective method for obtaining carbon activities and regeneration levels. Figure 10 shows the weight loss of different catalysts after a reaction under the same condition, in which a–d correspond to the 15%CeO2–Ni–Cu/HZSM-5, 5%CeO2–Ni–Cu/HZSM-5, 20%CeO2–Ni–Cu/HZSM-5, and Ni–Cu/HZSM-5 catalysts, respectively. The weight losses were 14, 23, 29, and 41% at 270 °C after a reaction time of 1 h, indicating that the amount of coke deposition is significantly lower with CeO2 addition than that without CeO2 addition. It means that the catalysts added with CeO2 can exhibit a better carbon deposition resistance. Again, with a 15% CeO2 addition, the weight loss is the least (14%) or the coke deposition is the least, agreeing with the previous assessments that the 15% CeO2 is the optimal amount for the HDO reaction of bio-oil. This finding suggests that a catalyst with a proper amount of CeO2 can improve the carbon resistance of the catalyst, but if excessive CeO2 is added, the carbon resistance of the catalyst is reduced. An excessive amount of CeO2 may cover the active site of a part of the Ni, thus reducing the chance of contact between the reactants and the active site, resulting in a large amount of carbon accumulation.
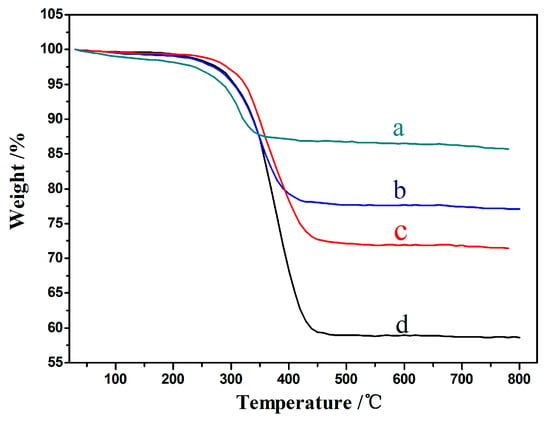
Figure 10.
Thermogravimetric (TG) analyses; (a)15%CeO2–Ni–Cu/HZSM-5, (b) 5%CeO2–Ni–Cu/HZSM-5, (c) 20%CeO2–Ni–Cu/HZSM-5, (d) Ni–Cu/HZSM-5.
Figure 11 of the DSC profiles (heat loss mW/mg) illustrates the type and distribution of the carbon deposits from the heat release curves of different catalysts under the same reaction conditions. Coke decomposition can be divided into four stages, namely, 100–250, 250–450 450–600, and 600–750 °C, which correspond to the decomposition temperatures of the small-molecule component results, soft coke, hard coke, graphite and graphite-like carbon, respectively [2,31]. The catalyst without CeO2 addition appears with an exothermic peak at 380 °C. The exothermic peaks of the added CeO2 catalysts apparently shifted to the left, or with 5%, 15%, and 20% CeO2, the peaks were 340, 310, and 360 °C, respectively, which prove that the main deposit on the catalyst is a soft carbon (soluble in organic solvent). The peak temperature reached the lowest (310 °C) when the CeO2 load was 15% because the soluble carbon deposited at this time has a relatively small molecular weight derivative (i.e., low boiling point and high solubility). The results indicate that the addition of CeO2 may lead to a substantial improvement in the resistance of the Ni–Cu/HZSM-5 catalyst against carbon deposition, and the different CeO2 contents have different effects on the catalyst’s resistance to carbon accumulation. In other words, when the CeO2 load is 15%, the ability of the catalyst to resist carbon may be the strongest.
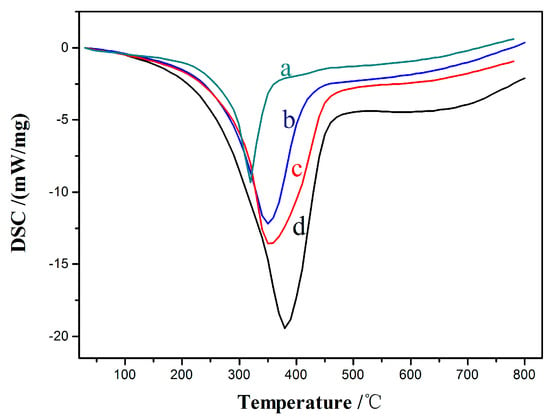
Figure 11.
Differential Scanning Calorimetry (DSC) analyses; (a) 15%CeO2–Ni–Cu/HZSM-5, (b) 5%CeO2–Ni–Cu/HZSM-5, (c) 20%CeO2–Ni–Cu/HZSM-5, (d) Ni–Cu/HZSM-5.
4. Conclusions
This study on the addition of different CeO2 contents to the Ni–Cu/HZSM-5 catalyst used for the HDO of bio-oil derived the following conclusions:
- The effect of bio-oil HDO can be improved by adding CeO2. The upgrading oil yield can reach a maximum of 47.6% when the CeO2 content is 15%. From the energy utilization perspective, 270 °C is the suitable temperature for HDO when the CeO2 content is 15% of the Ni–Cu/HZSM-5 catalyst.
- The addition of CeO2 can improve the Ni dispersion and redox ability, can increase the Bronsted acidity ratio, and can decrease the particle size of the catalyst. When the CeO2 content is 15%, the performance of the catalyst is at the optimum, the particle size of active metal is the smallest, the dispersibility of active metal is the best, the ratio of Bronsted acids to total acids is the largest, and the reduction temperature of H2-TPR is the lowest. In addition, the reduction of the specific surface area and the pore loss of the catalyst after the reaction is the smallest compared with that of the catalyst before reaction.
- The addition of CeO2 can improve the coke deposition of deactivated catalysts after HDO. The catalyst carbon deposit resistance is at the optimum when the CeO2 content is 15%. Compared with the catalyst without CeO2, the coke deposition decreases from 41 to 14 wt%. At this CeO2 content, the temperature of the exothermic peak of the coke combustion is also the lowest, therefore proving that the soft coke formed at this time is a derivative with a relatively small molecular weight.
Author Contributions
Conceptualization, C.Z. and R.Z.; validation, W.W.; investigation, W.W. and G.C.; resources, R.Z.; writing—original draft preparation, W.W.; writing—review and editing, C.Z., W.W., R.Z., and G.C.
Funding
This research was partially funded by the National Key Research and Development Program of China, grant number 2017YFC0212400.
Conflicts of Interest
The authors declare no conflict of interest.
References
- Peter, M.K. Energy production from biomass (Part 1): Overview of biomass. Bioresour. Technol. 2002, 83, 37–46. [Google Scholar]
- Zhang, X.; Wang, T.; Ma, L.; Qi, Z.; Jiang, T. Hydrotreatment of bio-oil over Ni-based catalyst. Bioresour. Technol. 2013, 127, 306–311. [Google Scholar] [CrossRef] [PubMed]
- Zhang, X.; Long, J.; Wei, K.; Qi, Z.; Chen, L.; Wang, T.; Ma, L.; Li, Y. Catalytic upgrading of bio-oil over Ni-based catalysts supported on mixed oxides. Energy Fuels 2014, 28, 2562–2570. [Google Scholar] [CrossRef]
- Yao, Y.; Goodman, D.W. Direct evidence of hydrogen spillover from Ni to Cu on Ni–Cu bimetallic catalysts. J. Mol. Catal. A Chem. 2014, 383–384, 239–242. [Google Scholar] [CrossRef]
- Ardiyanti, A.R.; Khromova, S.A.; Venderbosch, R.H.; Yakovlev, V.A.; Heeres, H.J. Catalytic hydrotreatment of fast-pyrolysis oil using non-sulfided bimetallic Ni-Cu catalysts on a δ-Al2O3 support. Appl. Catal. B Environ. 2012, 117–118, 105–117. [Google Scholar] [CrossRef]
- Mortensen, P.M.; Grunwaldt, J.D.; Jensen, P.A.; Knudsen, K.G.; Jensen, A.D. A review of catalytic upgrading of bio-oil to engine fuels. Appl. Catal. A Gen. 2011, 407, 1–19. [Google Scholar] [CrossRef]
- Baldauf, W.; Balfanz, U.; Rupp, M. Upgrading of flash pyrolysis oil and utilization in refineries. Biomass Bioenergy 1994, 7, 237–244. [Google Scholar] [CrossRef]
- Cheng, S.; Wei, L.; Zhao, X.; Kadis, E.; Cao, Y.; Julson, J.; Gu, Z. Hydrodeoxygenation of prairie cordgrass bio-oil over Ni based activated carbon synergistic catalysts combined with different metals. New Biotechnol. 2016, 33, 440–448. [Google Scholar] [CrossRef] [PubMed]
- Laurent, E.; Delmon, B. Study of the hydrodeoxygenation of carbonyl, carylic and guaiacyl groups over sulfided CoMo/γ-Al2O3 and NiMo/γ-Al2O3 catalysts: I. Catalytic reaction schemes. Appl. Catal. A Gen. 1994, 109, 77–96. [Google Scholar] [CrossRef]
- Cheng, S.; Wei, L.; Zhao, X.; Julson, J. Application, deactivation, and regeneration of heterogeneous catalysts in bio-oil upgrading. Catalysts 2016, 6, 195. [Google Scholar] [CrossRef]
- Li, Y.; Zhang, C.; Liu, Y.; Hou, X.; Zhang, R.; Tang, X.J.E. Coke deposition on Ni/HZSM-5 in bio-oil hydrodeoxygenation processing. Fuels 2015, 29, 1722–1728. [Google Scholar] [CrossRef]
- Zhang, S.-P. Study of hydrodeoxygenation of bio-oil from the Fast Pyrolysis of biomass. Energy Sources 2003, 25, 57–65. [Google Scholar]
- Yan, C.F.; Cheng, F.F.; Hu, R.R. Hydrogen production from catalytic steam reforming of bio-oil aqueous fraction over Ni/CeO–ZrO catalysts. Int. J. Hydrogen Energy 2010, 35, 11693–11699. [Google Scholar] [CrossRef]
- Trovarelli, A.; Deleitenburg, C.; Dolcetti, G.; Lorca, J.L. CO2 methanation under transient and steady-state conditions over Rh/CeO2 and CeO2-Promoted Rh/SiO2: The Role of surface and bulk ceria. J. Catal. 1995, 151, 111–124. [Google Scholar] [CrossRef]
- Do, J.; Chava, R.; Son, N.; Kim, J.; Park, N.-K.; Lee, D.; Seo, M.; Ryu, H.-J.; Chi, J.; Kang, M. Effect of Ce doping of a Co/Al2O3 catalyst on hydrogen production via propane steam reforming. Catalysts 2018, 8, 413. [Google Scholar] [CrossRef]
- Diebold, J.P.; Czernik, S.J.E. Additives to lower and stabilize the viscosity of pyrolysis oils during storage. Fuels 1997, 11, 1081–1091. [Google Scholar] [CrossRef]
- Xu, X.; Zhang, C.; Zhai, Y.; Liu, Y.; Zhang, R.; Tang, X.J.E. Upgrading of bio-oil using supercritical 1-butanol over a Ru/C heterogeneous catalyst: Role of the solvent. Fuels 2014, 28, 4611–4621. [Google Scholar] [CrossRef]
- Xu, X.; Zhang, C.; Liu, Y.; Zhai, Y.; Zhang, R. Two-step catalytic hydrodeoxygenation of fast pyrolysis oil to hydrocarbon liquid fuels. Chemosphere 2013, 93, 652–660. [Google Scholar] [CrossRef]
- Shu, Y.; Ma, D.; Xu, L.; Xu, Y.; Bao, X. Methane dehydro-aromatization over Mo/MCM-22 catalysts: A highly selective catalyst for the formation of benzene. Catal. Lett. 2000, 70, 67–73. [Google Scholar] [CrossRef]
- Peng, J.; Chen, P.; Lou, H.; Zheng, X. Catalytic upgrading of bio-oil by HZSM-5 in sub- and super-critical ethanol. Bioresour. Technol. 2009, 100, 3415–3418. [Google Scholar] [CrossRef]
- García-Sancho, C.; Guil-López, R.; Pascual, L.; Maireles-Torres, P.; Navarro, R.M.; Fierro, J.L.G. Optimization of nickel loading of mixed oxide catalyst ex-hydrotalcite for H2 production by methane decomposition. Appl. Catal. A Gen. 2017, 548, 71–82. [Google Scholar] [CrossRef]
- Shih, J.K.; Leckie, J.O. Nickel aluminate spinel formation during sintering of simulated Ni-laden sludge and kaolinite. J. Eur. Ceram. Soc. 2007, 27, 91–99. [Google Scholar] [CrossRef]
- Tang, X.; Zhang, B.; Li, Y.; Xu, Y.; Xin, Q.; Shen, W. Structural features and catalytic properties of Pt/CeO2 catalysts prepared by modified reduction-deposition techniques. Catal. Lett. 2004, 97, 163–169. [Google Scholar] [CrossRef]
- Vergand, F.; Roulet, H.; Dufour, G.; Bonnelle, C.; Ramaroson, E.; Tempere, J.F.; Guilleux, M.F.; Delafosse, D. Electron distribution of small Ni particles and Ce ions in X and Y zeolites related to their catalytic properties. Z. Für Phys. D At. Mol. Clust. 1989, 12, 425–429. [Google Scholar] [CrossRef]
- Koel, B.E.; Praline, G.; Lee, H.I.; White, J.M.; Hance, R.L. X-Ray Photoelectron study of the reaction of oxygen with cerium. J. Electron. Spectrosc. Relat. Phenom. 1980, 21, 17–30. [Google Scholar] [CrossRef]
- Liu, H.; Zou, X.; Wang, X.; Lu, X.; Ding, W. Effect of CeO2 addition on Ni/Al2O3 catalysts for methanation of carbon dioxide with hydrogen. J. Nat. Gas Chem. 2012, 21, 703–707. [Google Scholar] [CrossRef]
- Srisiriwat, N.; Therdthianwong, S.; Therdthianwong, A. Oxidative steam reforming of ethanol over Ni/AlO catalysts promoted by CeO, ZrO and CeO–ZrO. Int. J. Hydrogen Energy 2009, 34, 2224–2234. [Google Scholar] [CrossRef]
- Song, Y.; Lin, Y.U.; Sun, C.; Fei, Y.E.; Fang, Y.; Lin, W. Effect of Ce promoter on activity and stability of Ce-Ni/Al2O3 in partial oxidation of methane and CO2 reforming of methane to syngas. Chin. J. Catal. 2002, 23, 267–270. [Google Scholar] [CrossRef]
- Zhang, Z.; Wang, Y.; Chen, X.; Lu, Z.H. Facile synthesis of NiPt–CeO2 nanocomposite as an efficient catalyst for hydrogen generation from hydrazine borane. J. Power Sources 2015, 291, 14–19. [Google Scholar] [CrossRef]
- Kim, J.G.; Pugmire, D.L.; Battaglia, D.; Langell, M.A. Analysis of the NiCo2O4 spinel surface with Auger and X-ray photoelectron spectroscopy. Appl. Surf. Sci. 2000, 165, 70–84. [Google Scholar] [CrossRef]
- Zhang, H.; Shao, S.; Rui, X.; Shen, D.; Zeng, J. Characterization of coke deposition in the catalytic fast pyrolysis of biomass derivates. Energy Fuels 2013, 28, 52–57. [Google Scholar] [CrossRef]
© 2019 by the authors. Licensee MDPI, Basel, Switzerland. This article is an open access article distributed under the terms and conditions of the Creative Commons Attribution (CC BY) license (http://creativecommons.org/licenses/by/4.0/).