Article

Effects of Hooked-End Steel Fiber Geometry and Volume Fraction on the Flexural Behavior of Concrete Pedestrian Decks

1
Advanced Railroad Civil Engineering Division, Korea Railroad Research Institute, 176 Cheoldobangmulgwan-ro, Uiwang-si 16105, Gyeonggi-do, Korea
2
Department of Architectural Engineering, Hanyang University, 222 Wangsimni-ro, Seongdong-gu, Seoul 04763, Korea
3
Department of Civil Engineering, Kyungsung University, 309 Sooyoung-ro, Nam-gu, Busan 48434, Korea
*
Authors to whom correspondence should be addressed.
Appl. Sci. 2019, 9(6), 1241; https://doi.org/10.3390/app9061241
Submission received: 21 February 2019 / Revised: 14 March 2019 / Accepted: 18 March 2019 / Published: 25 March 2019
(This article belongs to the Section Civil Engineering)

Abstract

:
This study investigates the effects of hooked-end fiber geometry and volume fraction on the flexural behavior of concrete pedestrian decks. To achieve this, three different fiber geometries, i.e., three-dimensional (3D), four-dimensional (4D), and five-dimensional (5D), and volume fractions of 0.37%, 0.6%, and 1.0% were considered. Test results indicate that a higher number of hook ends can more effectively enhance the flexural strength and flexural strength margin at all volume fractions than a lower number, so that the order of effectiveness of hooked-end fibers on the flexural strength parameters was as follows: 5D > 4D > 3D. To satisfy the ductility index of 0.39, the amounts of 3D, 4D, and 5D hooked steel fibers should be in the range of 0.98%‒1.10%. Moreover, at a fiber volume fraction of 1.0%, only multiple cracking behaviors were observed, and the numerical results indicated that the volume fraction should be equal to 1.0% to guarantee a deflection-hardening response of pedestrian decks, regardless of the hooked-end fiber geometry. Consequently, a 1.0% by volume of hooked-end steel fiber is recommended to replace the minimum longitudinal steel rebars and guarantee a ductile flexural behavior with multiple cracks for pedestrian decks made of high-strength concrete.

1. Introduction

In general, pedestrian bridge decks only require minimal longitudinal steel reinforcing bars (rebars), compared to conventional bridge decks that are subjected to wheel loads because of the smaller magnitude of loads applied. Thus, only the minimum amount of steel rebars is installed in some pedestrian decks, such as the Soleri Viaduct [1] and other civil structures, e.g., tunnel linings [2]. Inclusion of conventional steel rebars in concrete structures has several benefits such as achieving a ductile behavior under flexure or tension; however, it also has some drawbacks, e.g., an increased thickness of concrete element needed to obtain a sufficient cover depth in terms of enough bond strength, reduced durability due to corrosion of steel rebars, and a work volume increase at construction sites. According to ACI 318 [3] and Eurocode 2 [4], minimum reinforcement ratios are recommended to prevent sudden brittle failure after cracking; hence, they derived equations for the minimum reinforcement ratio based on an assumption that the moment capacity is greater than or at least equal to the cracking moment ( M n M c r ), where Mn is the nominal moment capacity and Mcr is the cracking moment. Therefore, if the concrete material itself can achieve a deflection-hardening characteristic, which increases the load carrying capacity even beyond the matrix cracking point, we can theoretically eliminate the conventional steel rebars from some concrete structures that only require the minimum reinforcement ratio and overcome the limitations of incorporating steel rebars.
To achieve an excellent post-cracking flexural (or tensile) performance of concrete, many researchers [5,6,7,8,9] have incorporated discontinuous fibers into the concrete mixture. The incorporated fibers could improve the flexural performance of concrete by effectively bridging the cracks. Bindiganavile and Banthia [7] experimentally verified that concrete reinforced with deformed steel fibers exhibit a higher flexural strength and toughness than that reinforced with polymeric fibers under static flexure. In addition, according to a previous study by Banthia and Trottier [8], using hooked-end steel fibers is more effective in enhancing the flexural performance of normal and mid-strength concretes with compressive strengths of approximately 40 MPa and 52 MPa, in terms of the flexural strength and toughness, compared to other types of deformed steel fibers such as crimped and twin-coned. Aslani and Samali [9] noted that using the steel fibers is most effective in enhancing the modulus of rupture of concrete than using polypropylene (PP) fibers or hybrid use of steel and PP fibers. Thus, it can be expected that hooked-end steel fibers can be effectively used to reinforce plain concrete under flexure and replace the minimum amount of conventional steel rebars in concrete with a design strength of 50 MPa.
In recent years, some researchers [10,11,12,13,14] developed a novel multiple hook-end steel fiber and verified its effectiveness based on pullout and tensile tests. Abdallah and Fan [10] reported that the maximum pullout load and energy of conventional hooked-end steel fibers with three-dimensional (3D) geometry are significantly improved by using four-dimensional (4D) and five-dimensional (5D) geometries. The typical picture of 3D, 4D, and 5D hooked fibers used in this study is shown in Figure 1. The 5D hooked-end steel fiber provided 11% and 73% higher maximum pullout load and 53% and 92% higher pullout energy than the 4D and 3D hooked-end steel fibers, respectively [10]. Such a superior bond performance is achieved because of the improved mechanical anchorage, owing to the increased number of hook ends. The peak and post-peak tensile strengths of steel fiber-reinforced concrete (SFRC) with conventional 3D hooked-end fibers were significantly enhanced by using the 4D and 5D hooked-end fibers, according to a previous study performed by Abdallah et al. [11]. The 5D hooked-end fiber specimen only exhibited a re-increase in tensile stress (hardening) after a sudden drop in the stress by matrix cracking because of its stronger pullout resistance than the others (i.e., 3D and 4D hooked-end fibers). The effectiveness of using steel fibers with multiple hook ends in plain concrete has recently been studied at the material level; however, to the best of the authors’ knowledge, only a few studies [13] regarding their structural performance have been conducted.
Accordingly, in this study, the effects of hooked-end steel fiber geometry and volume content on the flexural behavior of structural pedestrian concrete decks were first examined. To achieve this, various types of hooked-end steel fibers with different hook-end geometries, i.e., 3D, 4D, and 5D, and three different volume fractions of 0.37, 0.6, and 1.0% were considered. In order to predict the flexural behavior of SFRC decks, sectional analysis was also conducted based on the material models recommended by RILEM code [15]. Finally, the feasibility of replacing the minimum longitudinal steel rebars in concrete pedestrian decks to discontinuous hooked-end steel fibers was investigated experimentally and numerically.

2. Research Objective and Design Process of Novel Pedestrian Decks

The major objective of this study is to examine the effects of the number of end hooks and volume fraction of steel fibers on the structural behavior of pedestrian concrete decks since most of previous studies were focused on only the material properties. Also, the feasibility of using various types of hooked steel fibers on pedestrian decks made of high-strength concrete instead of the conventional steel rebars is evaluated. A pedestrian deck requiring a minimum flexural reinforcement was targeted. To achieve this, three hooked-end steel fibers with different hook geometries, i.e., 3D, 4D, and 5D, were adopted along with three different volume fractions of 0.37%, 0.60%, and 1.00%. The medium volume fraction of hooked-end fibers (i.e., 0.60%) was determined as the threshold value, exhibiting a similar cracking load (Pcr) and post-cracking ultimate load (Pu) based on three-point bending tests. The lower volume fraction of 0.37% provides a deflection-softening behavior, whereas the higher volume fraction of 1.00% exhibits a deflection-hardening behavior. Fantilli et al. [1] studied the development of lightweight concrete slabs for maintaining the Soleri Viaduct using polymeric fibers without conventional steel rebars and suggested the suitable amount (15.5 kg/m3) of polymer fibers, which can replace the minimum flexural reinforcement given by Eurocode 2 [4], based on a ductility index (DI) of D I = P u P c r P c r , where pu is the ultimate flexural load and Pcr is the cracking load. Some international codes such as ACI 318-14 [3] and Eurocode 2 [4], have suggested an equation for determining the minimum flexural reinforcement area (As,min) to prevent sudden failure immediately after crack generation and to guarantee a ductile failure mode, as follows (in SI units):
A s , min = 0.25 f c k f y b w d 1.4 f y b w d   [ ACI   318 ]
A s , min = 0.26 f c t m f y b w d 0.0013 b w d   [ Eurocode   2 ]
where fck is the compressive strength of concrete, fy is the yield strength of steel rebar, bw is the beam width, d is the effective depth of beam, and fctm is the tensile strength of concrete.
Equations (1) and (2) were suggested to satisfy the assumption that the nominal moment capacity is greater than or at least equal to the cracking moment ( M n M c r ). The nominal moment capacity, Mn, is calculated by multiplying the resistance factor (ϕ) of 0.9 and the ultimate moment given by the yield strength of steel rebar and moment arm; the cracking moment, Mcr, is evaluated using the modulus of rupture and sectional geometry. Accordingly, to replace the minimum amount of steel rebars with discontinuous fibers, it should be confirmed that the SFRC provides the deflection-hardening response, leading to a higher load-carrying capacity after the formation of cracks.
In particular, based on some assumptions, i.e., (1) the plane section remains plane, (2) concrete exhibits linear elastic behavior, and (3) neutral axis depth is located at the center, the ratio of nominal moment and cracking moment (Mn/Mcr) can be calculated. If the beam height is considered as 1.2 times the effective depth of beam (h = 1.2d) [16], the nominal and cracking moment ratio from ACI 318 code can be obtained (approximately 1.19), which means that the nominal moment capacity is 19% higher than the cracking moment. Thus, the ultimate flexural strength of deflection-hardening SFRCs needs to be at least 20% higher than the first cracking strength conservatively to guarantee the ductile flexural behavior.

3. Experimental Program

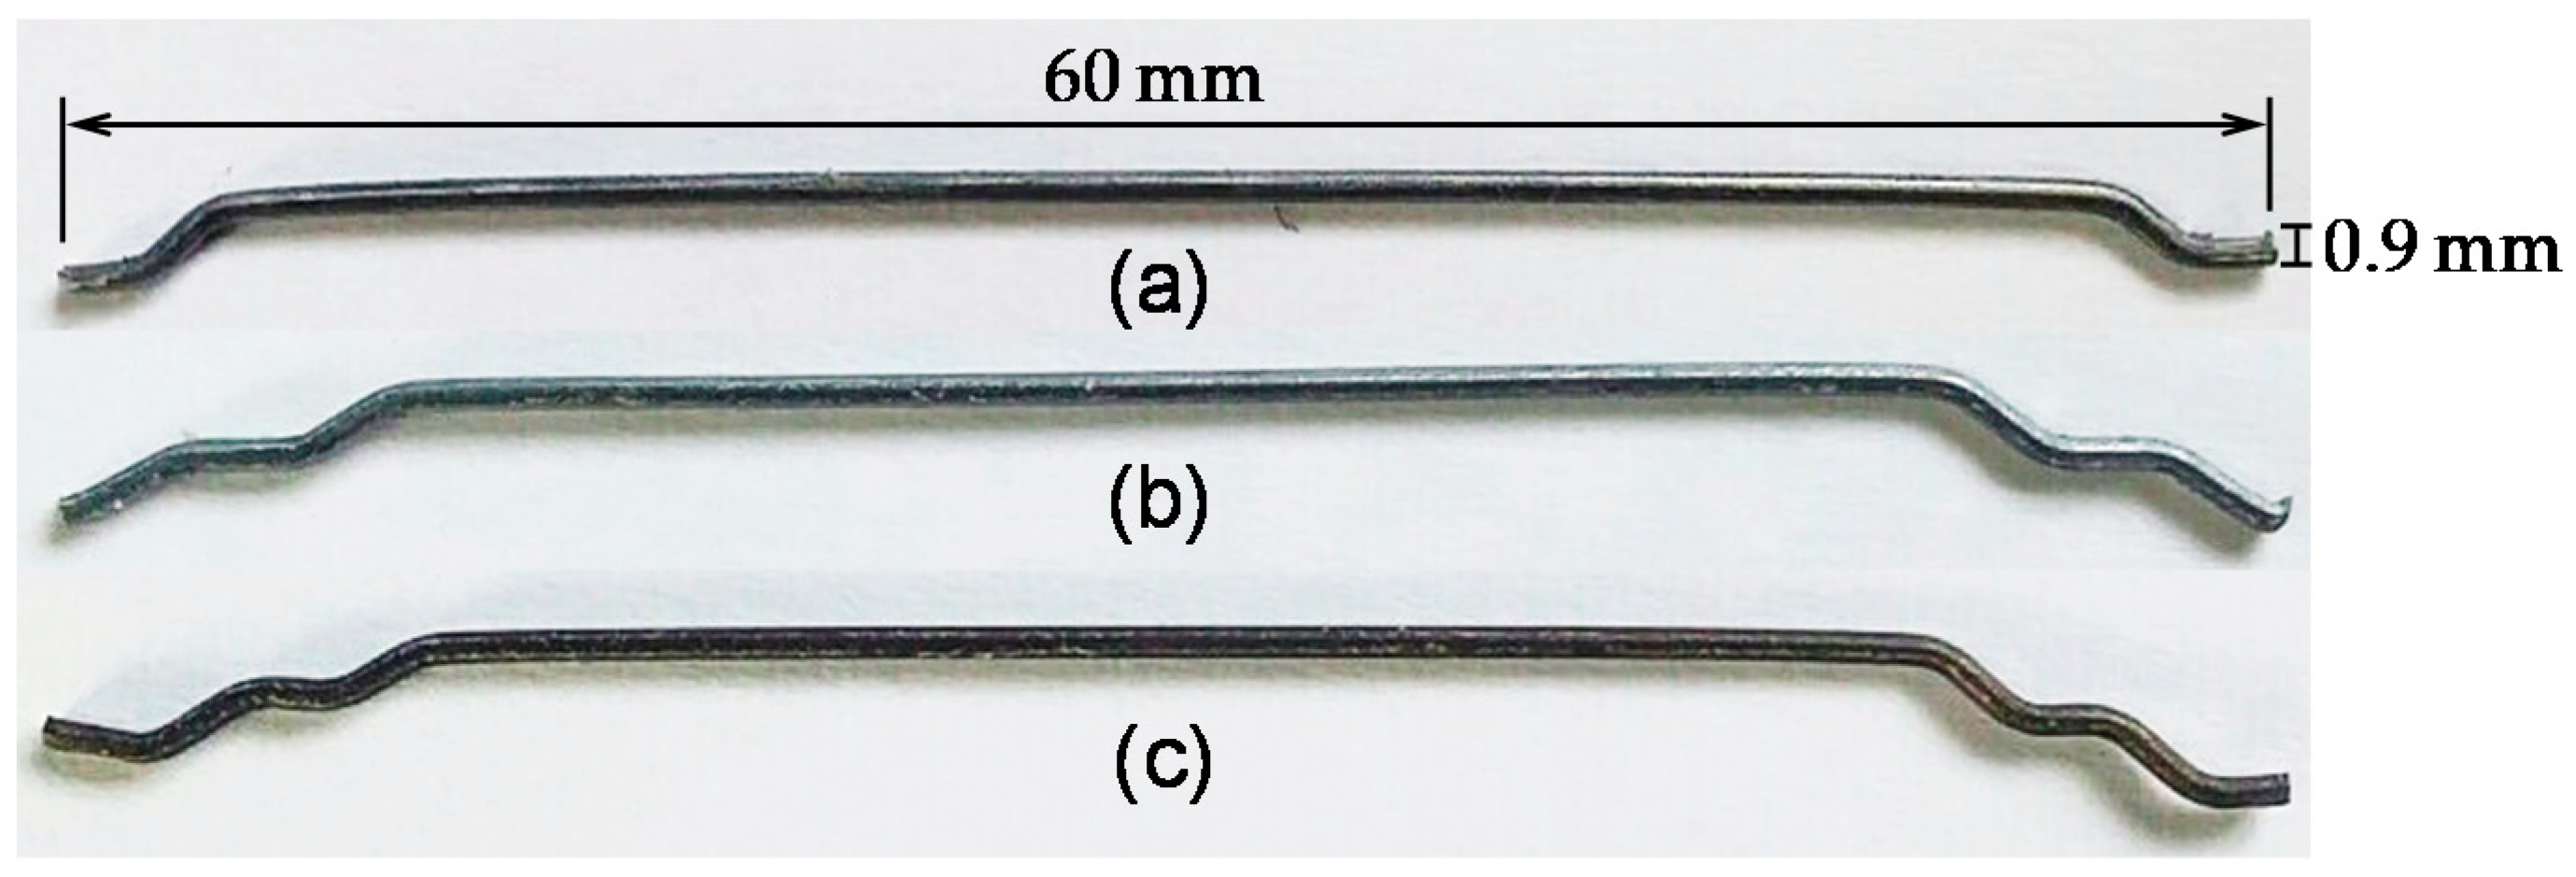
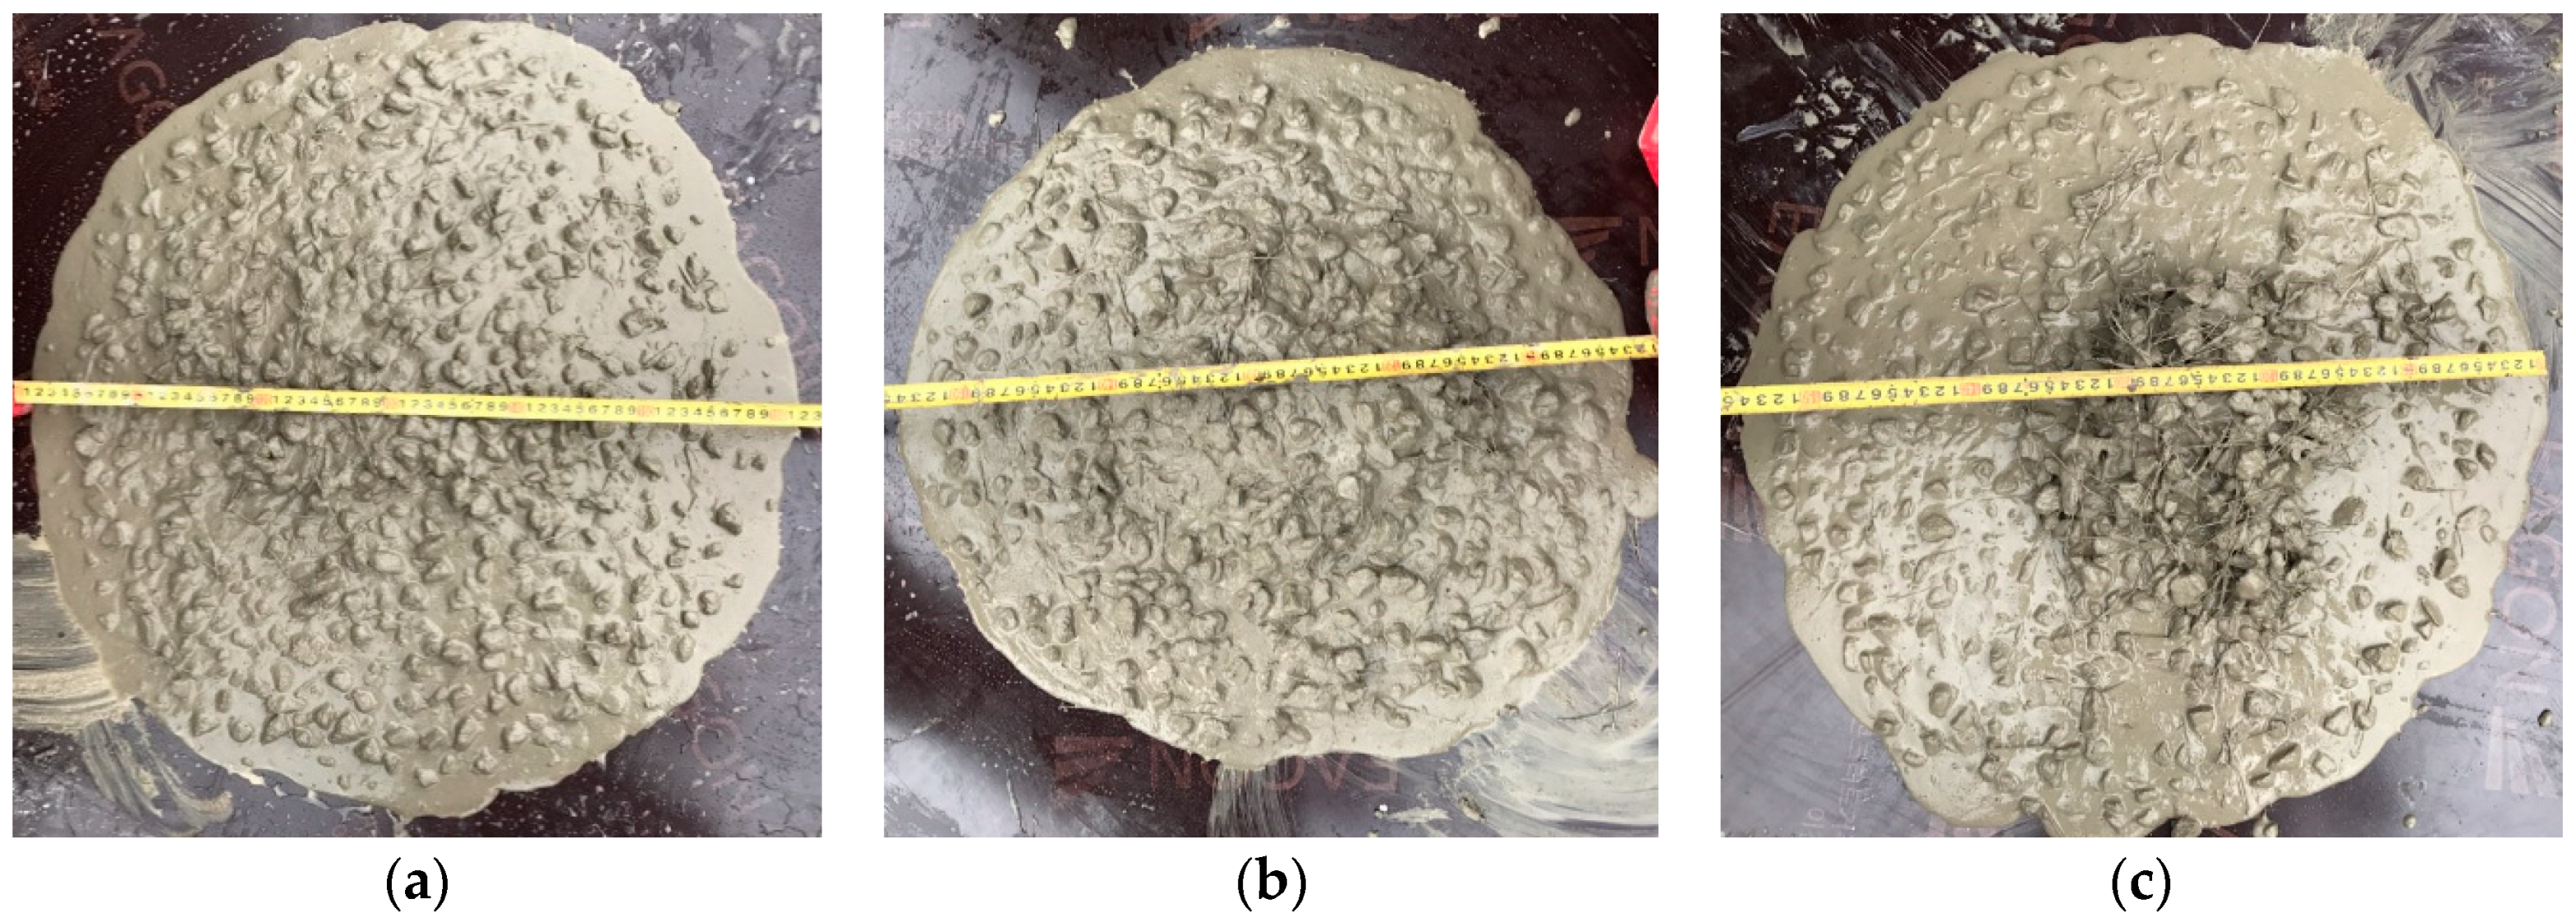
3.1. Mix Proportion and Steel Fiber

Table 1 summarizes the mixture proportions of high-strength concrete and SFRC used in this study. The Type I Portland cement, ground granulated blast-furnace slag, and fly ash were used as cementitious materials, and a water-to-binder ratio of 0.35 was adopted. River sand was used as fine aggregate, whereas gravel with a maximum size of 25 mm was used as coarse aggregate. A sand-to-total aggregate ratio of 0.48 was applied. To achieve a self-consolidating property, a water-reducing admixture was additionally included into the mixture as 1.0% of total binder contents. The slump flow values, which were measured according to ASTM C1611 [17], were obtained in a range of 490–630 mm, and the air contents measured were approximately 1.7%–1.8% for all tested mixtures. Typical slump flow test results for the 3D hooked-end fiber specimens are shown in Figure 2.
In order to evaluate the effect of end-hook geometry of steel fibers on the flexural behavior of concrete slabs, three types of hooked-end steel fibers with different end geometries, i.e., 3D, 4D, and 5D, were adopted. A picture of the hooked-end steel fibers used is shown in Figure 1. Their density was 7.9 g/cm3 and the tensile strength was approximately 1100 MPa. Because the post-cracking tensile strength of fiber-reinforced concrete is affected by the fiber reinforcing index, vf × lf/df, identical volume fractions and aspect ratios were applied for all hooked-end steel fibers with different end deformations [18]. Here, vf is the fiber volume fraction, lf is the fiber length, and df is the fiber diameter. The length and diameter of all 3D, 4D, and 5D hooked-end steel fibers were 60 mm and 0.9 mm, respectively, resulting in an aspect ratio (lf/df) of approximately 65. Owing to a better mechanical anchorage effect of the highly deformed hooked-end fibers, the order of bond performance was reported as follows: 5D > 4D > 3D [10]. Abdallah and Fan [10] noted that the maximum pullout load and energy absorption capacity of 5D hooked-end steel fibers embedded in normal-strength concrete are obviously higher than those of 3D and 4D fibers, respectively. In addition, three different volume fractions, i.e., 0.37%, 0.60%, and 1.00%, of hooked-end steel fibers were adopted to produce deflection-softening and deflection-hardening SFRCs, based on three-point bending test results [19].

3.2. Compressive and Bending Tests

The effects of hooked-end fiber geometry and volume fraction on the compressive strength of concrete were evaluated based on compressive tests. For this, three cylindrical specimens for each variable were fabricated with a diameter of 100 mm and a height of 200 mm, as per ASTM C39 [20]. Before testing, the casting surface was polished using a diamond blade to make it flat and minimize the eccentric effect on the compressive strength measured. A uniaxial load was monotonically applied to the specimens using a universal testing machine (UTM), and the maximum load measured from a load cell attached to the machine was used to calculate the compressive strength.
To evaluate the effectiveness of adding hooked-end steel fibers on the flexural behavior of concrete and determining the appropriate fiber volume fractions producing deflection-softening and deflection-hardening SFRCs, three-point bending tests were conducted according to the EN 14651 standard [19]. To achieve this, 150 × 150 × 550 mm3 prismatic beams were fabricated and tested with a clear span length of 500 mm. In accordance with the standard, a notch with a depth of 25 mm was provided at the center of the beams before testing, and the crack mouth opening displacement (CMOD) was measured using a clip gauge. The midspan deflection for determining the residual flexural strengths was calculated from Equation (3) [19] as follows:
δ = 0.85 × C M O D + 0.4
where δ is the midspan deflection.
Since the casting surface was relatively rough, we rotated the beams 90° from the casting surface before testing to minimize the eccentric effect, and a uniaxial load was applied to the beams using the UTM through a displacement control. The applied load was measured from the attached load cell, and the flexural strength was calculated based on the maximum load value using the following equation [21]:
f = 3 P max L 2 b ( h a 0 ) 2
where Pmax is the maximum load, L is the clear span length, b is the beam width, h is the beam height, and a0 is the notch depth.

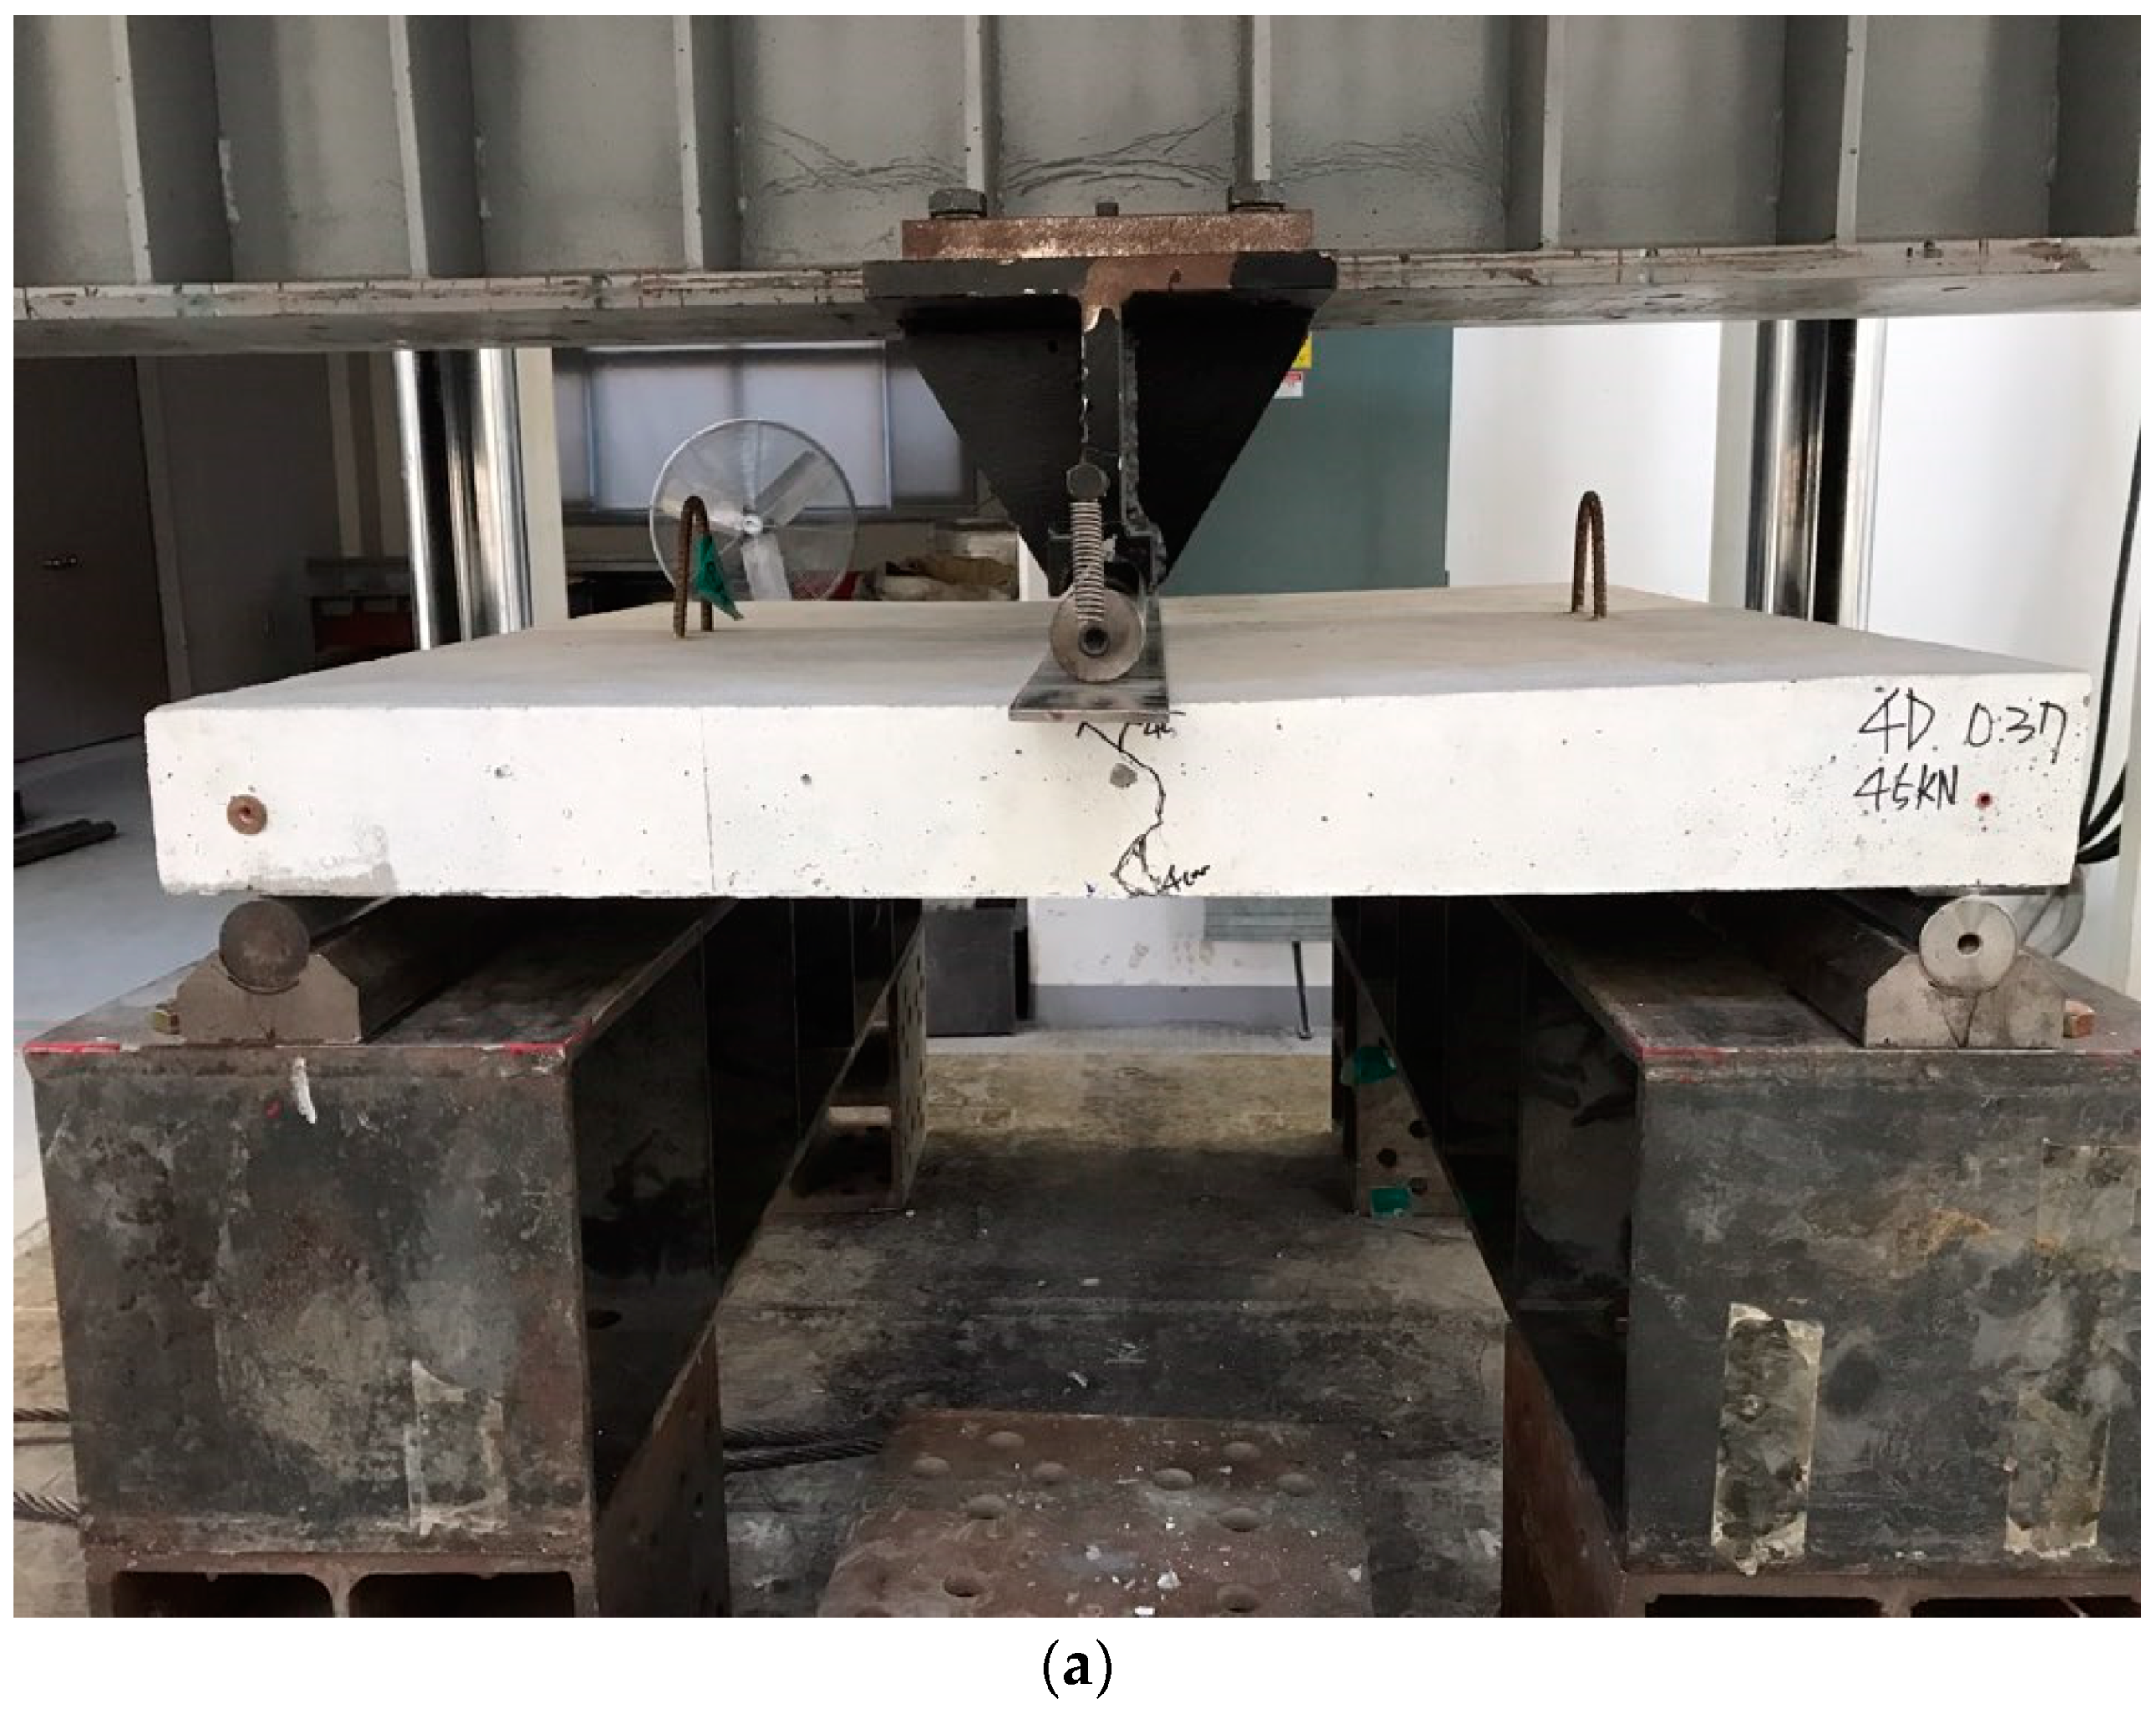
3.3. Structural Test for Concrete Pedestrian Decks

To evaluate the effects of fiber volume content and hook geometry on the flexural behavior of concrete pedestrian decks, 100 × 1000 × 1000 mm3 decks were fabricated using both plain concrete and SFRC. The size of the tested pedestrian decks was relatively similar to the slabs tested by Fantilli et al. [1] and applied to the Soleri Viaduct bridge. A center-point bending load was applied through an H beam and roller supports were adopted on both sides at a clear span length of 900 mm. The applied load was measured from a load cell attached to the test machine, and a linear variable differential transformer was installed to measure the center deflection. The detailed specimen dimensions and test setup are shown in Figure 3.

4. Experimental Results and Discussions

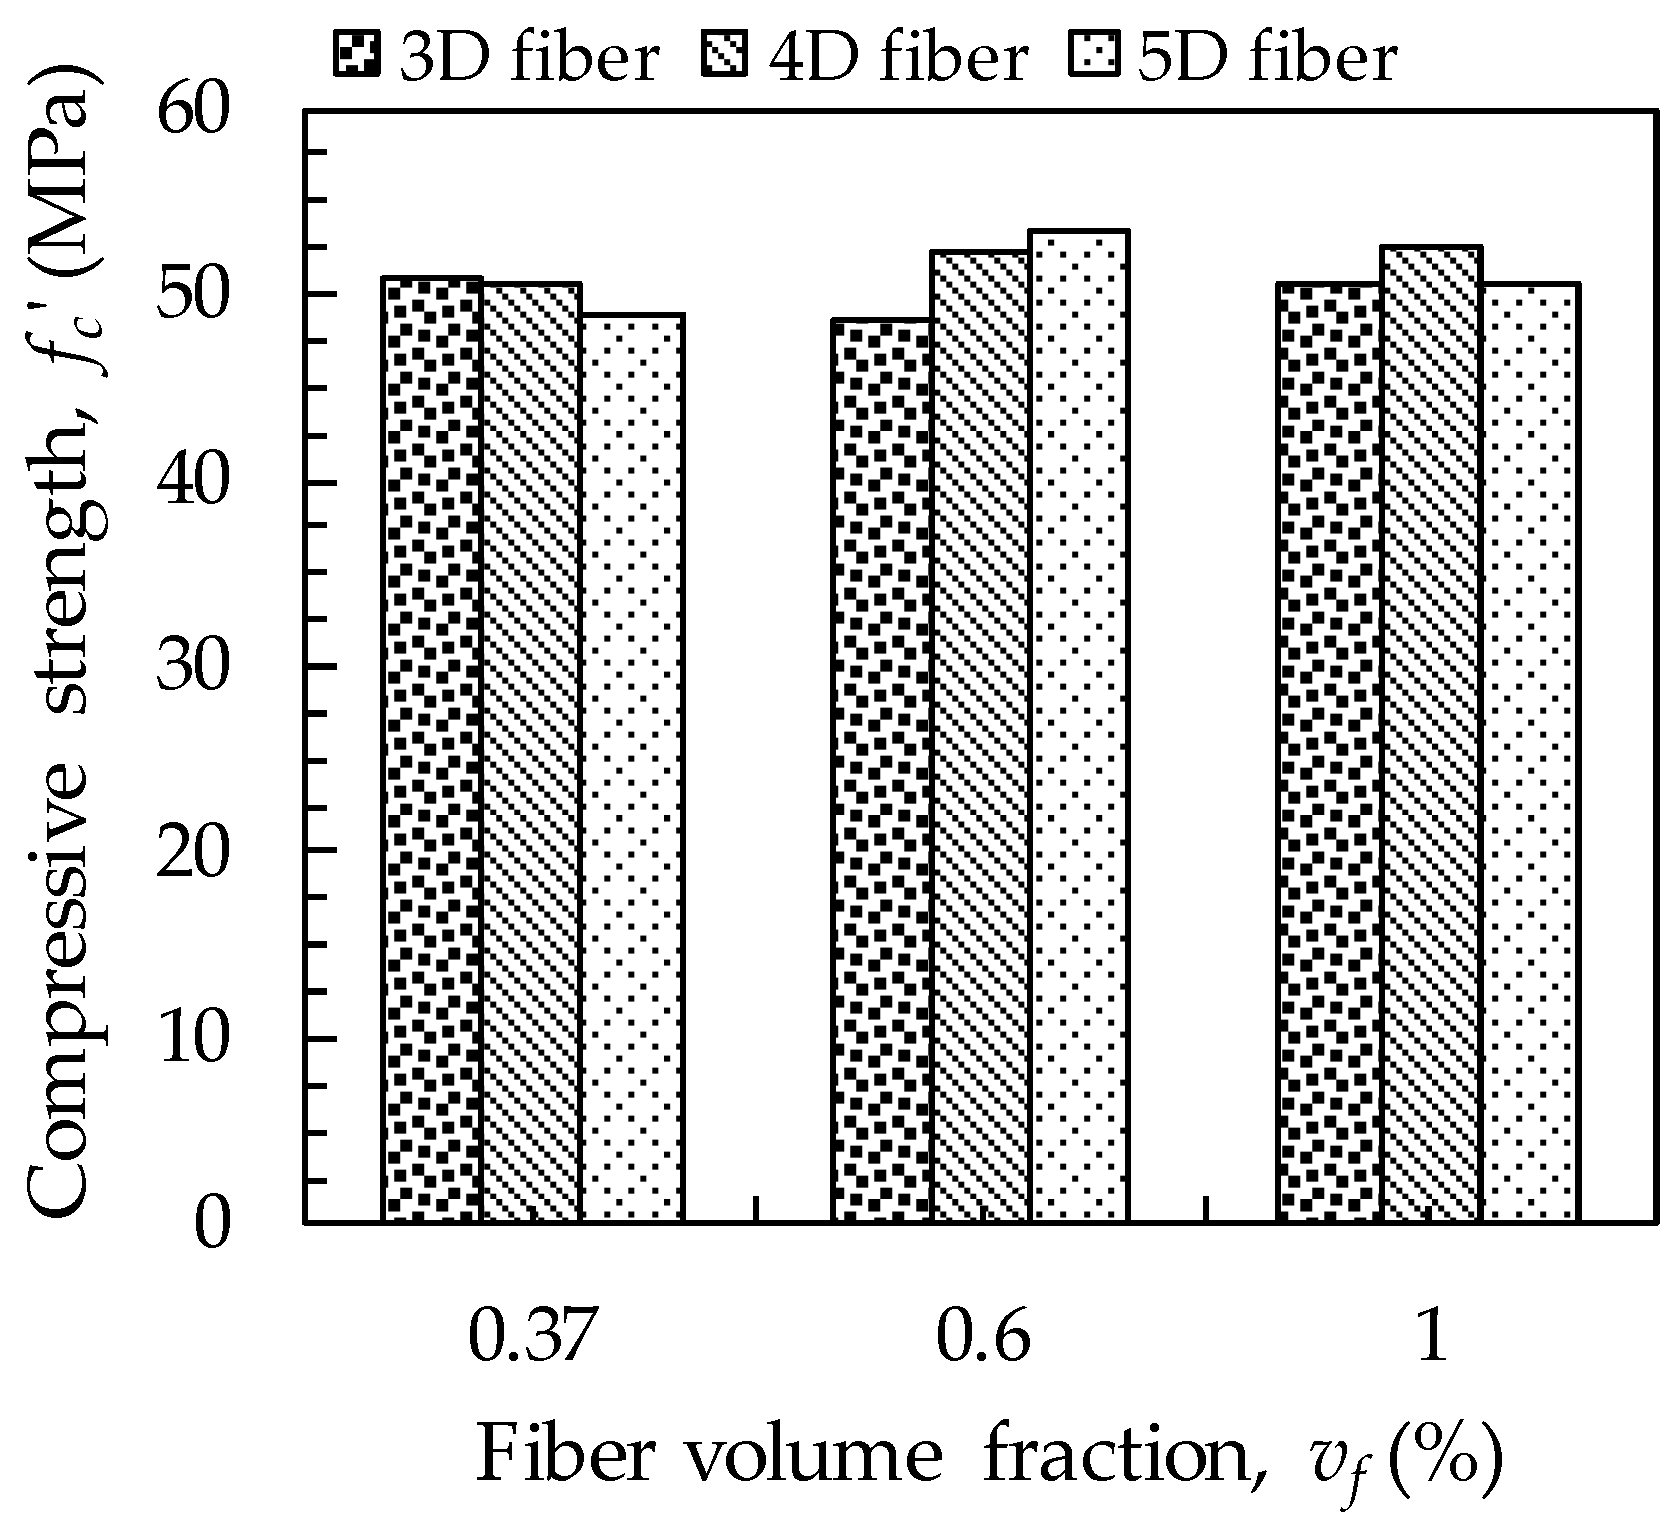
4.1. Mechanical Properties

The compressive strengths of all cylindrical specimens are shown in Figure 4. The compressive strengths, found to be approximately 50 MPa, were not influenced by the fiber volume fraction and the number of hook ends. This is consistent with the findings of Hsu and Hsu [22] and Banthia and Gupta [23], who reported that the addition of fibers yields a negligible change in the compressive strength of concrete. This is because the steel fibers incorporated lead to positive and negative effects on the compressive strength simultaneously, i.e., inhibition of crack formation and propagation and their inhomogeneous dispersion. Banthia and Nandakumar [24] reported that the fibers enhance the resistance to nucleation and growth of cracks in concrete, based on fundamental fracture tests. Thus, it is concluded that the inclusions of 3D, 4D, and 5D hooked-end steel fibers into the concrete mixture do not result in any significant change in the compressive strength up to a volume fraction of 1%.
The flexural load versus CMOD curves of all tested beams are shown in Figure 5. Regardless of the number of hook ends, a higher flexural strength was obtained with increased fiber volume fraction. At the low volume fraction of 0.37%, the specimens with 3D and 4D hooked-end fibers exhibited a deflection-softening behavior, while that with 5D hooked-end fiber provided a vague deflection-hardening behavior. When the volume fraction was 0.6%, all specimens showed a higher post-cracking flexural strength (fMOR) than the initial cracking strength (fLOP), although there was a sharp decrease in load immediately after the formation of matrix cracking. The sharp decreases in loads after cracking, observed in the specimens with a fiber volume fraction of less than 0.6%, were attributed to the fact that the amounts of fibers existing at the crack surface were insufficient to immediately sustain the cracking tensile force. Once the crack is formed in the matrix, a steep decrease in load with increasing CMOD, called matrix softening, is obtained. However, for fiber-reinforced concrete, the post-cracking tensile stress can increase again owing to the fiber bridging effect, and their total post-cracking behavior is determined by adding the matrix softening and fiber bridging curves [25]. The sharp decrease in load immediately after cracking is therefore dependent on the slope of the matrix softening and fiber bridging stiffness. Based on a micromechanical analysis, Yoo et al. [25] reported that the fiber bridging stiffness increases with increasing fiber volume fraction; thus, the sharp load drop was mitigated by increasing the fiber contents in all types of steel fibers in Figure 5. In general, slightly higher flexural strengths (fMOR) were observed in the SFRC beams with 4D and 5D hooked-end fibers compared to 3D hooked-end fibers because of the improved mechanical anchorage at the fiber ends.
Several important parameters regarding flexural strengths of SFRCs are summarized in Table 2, based on fib Model Code 2010 [26,27]. The flexural strength at the limit of proportionality (fL) was calculated by using Equation (4) and the highest value of the load was recorded up to a CMOD of 0.05 mm [5]. In addition, residual flexural strengths (fR,j) were calculated using Equation (4) with load values corresponding to CMODs of 0.5, 1.5, 2.5, and 3.5 mm, respectively. Given the following equation, we also can calculate the characteristic residual flexural strengths (fRjK) and evaluate the material class [26]:
f R j K = f R , j 1.89 σ
where fR,j is the residual flexural strength and σ is the standard deviation.
The flexural strength at the LOP (fL) slightly increased with increasing fiber volume fraction, as shown in Figure 6. However, the increase in value of fL was relatively minor compared to those of residual flexural strengths (fR,J) because the value of fL is more dependent on the matrix cracking rather than on the fiber bridging capability [25]. The highest flexural strengths were generally obtained near a CMOD value of 1.5 mm or 2.5 mm, and the residual flexural strengths almost linearly increased with the fiber volume fraction (Figure 6). Since the values of CMOD1 (=0.5 mm) and CMOD3 (=2.5 mm) are related to serviceability and ultimate limit states, respectively [26], it can be concluded that using higher amounts of hooked-end steel fibers is effective for enhancing the flexural strengths of concrete at both the serviceability and ultimate limit states, regardless of the geometry of hook ends. The characteristic flexural strength ratios (fR3K/fR1K) were not clearly influenced by the fiber volume fraction, because both the characteristic flexural strengths (fR1K and fR3K) were enhanced by increasing the fiber content, whereas the SFRCs with 1.0% of steel fibers were considered as higher material classes (Table 2) compared to those with lower fiber volume fractions, regardless of the hooked-end fiber type.
In order to guarantee a ductile flexural behavior of SFRC, the post-cracking strength needs to be at least 20% higher than the initial cracking strength. At the low volume fraction of 0.37%, all types of steel fibers did not satisfy this requirement, but all tested specimens with fiber volume fractions equal to or greater than 0.6% fulfilled this requirement. For instance, the post-cracking flexural strengths of 3D, 4D, and 5D hooked-end fiber specimens with vf of 0.6% were respectively 26%, 31%, and 44% higher than their initial cracking strengths. The effectiveness of adding steel fibers on guaranteeing the ductile flexural behavior of concrete increased by increasing the number of hook ends. Thus, the 5D hooked-end fiber provided the greatest enhancement in flexural strength from the initial cracking point to the peak point, i.e., 44% and 90% for the cases of vf of 0.6% and 1.0%, respectively, followed by the 4D and 3D hooked-end fibers. Consequently, it can be stated that increasing the number of hook ends in hooked-end steel fibers is effective for inducing the ductile behavior of plain concrete under flexure.

4.2. Flexural Performance of Concrete Pedestrian Decks

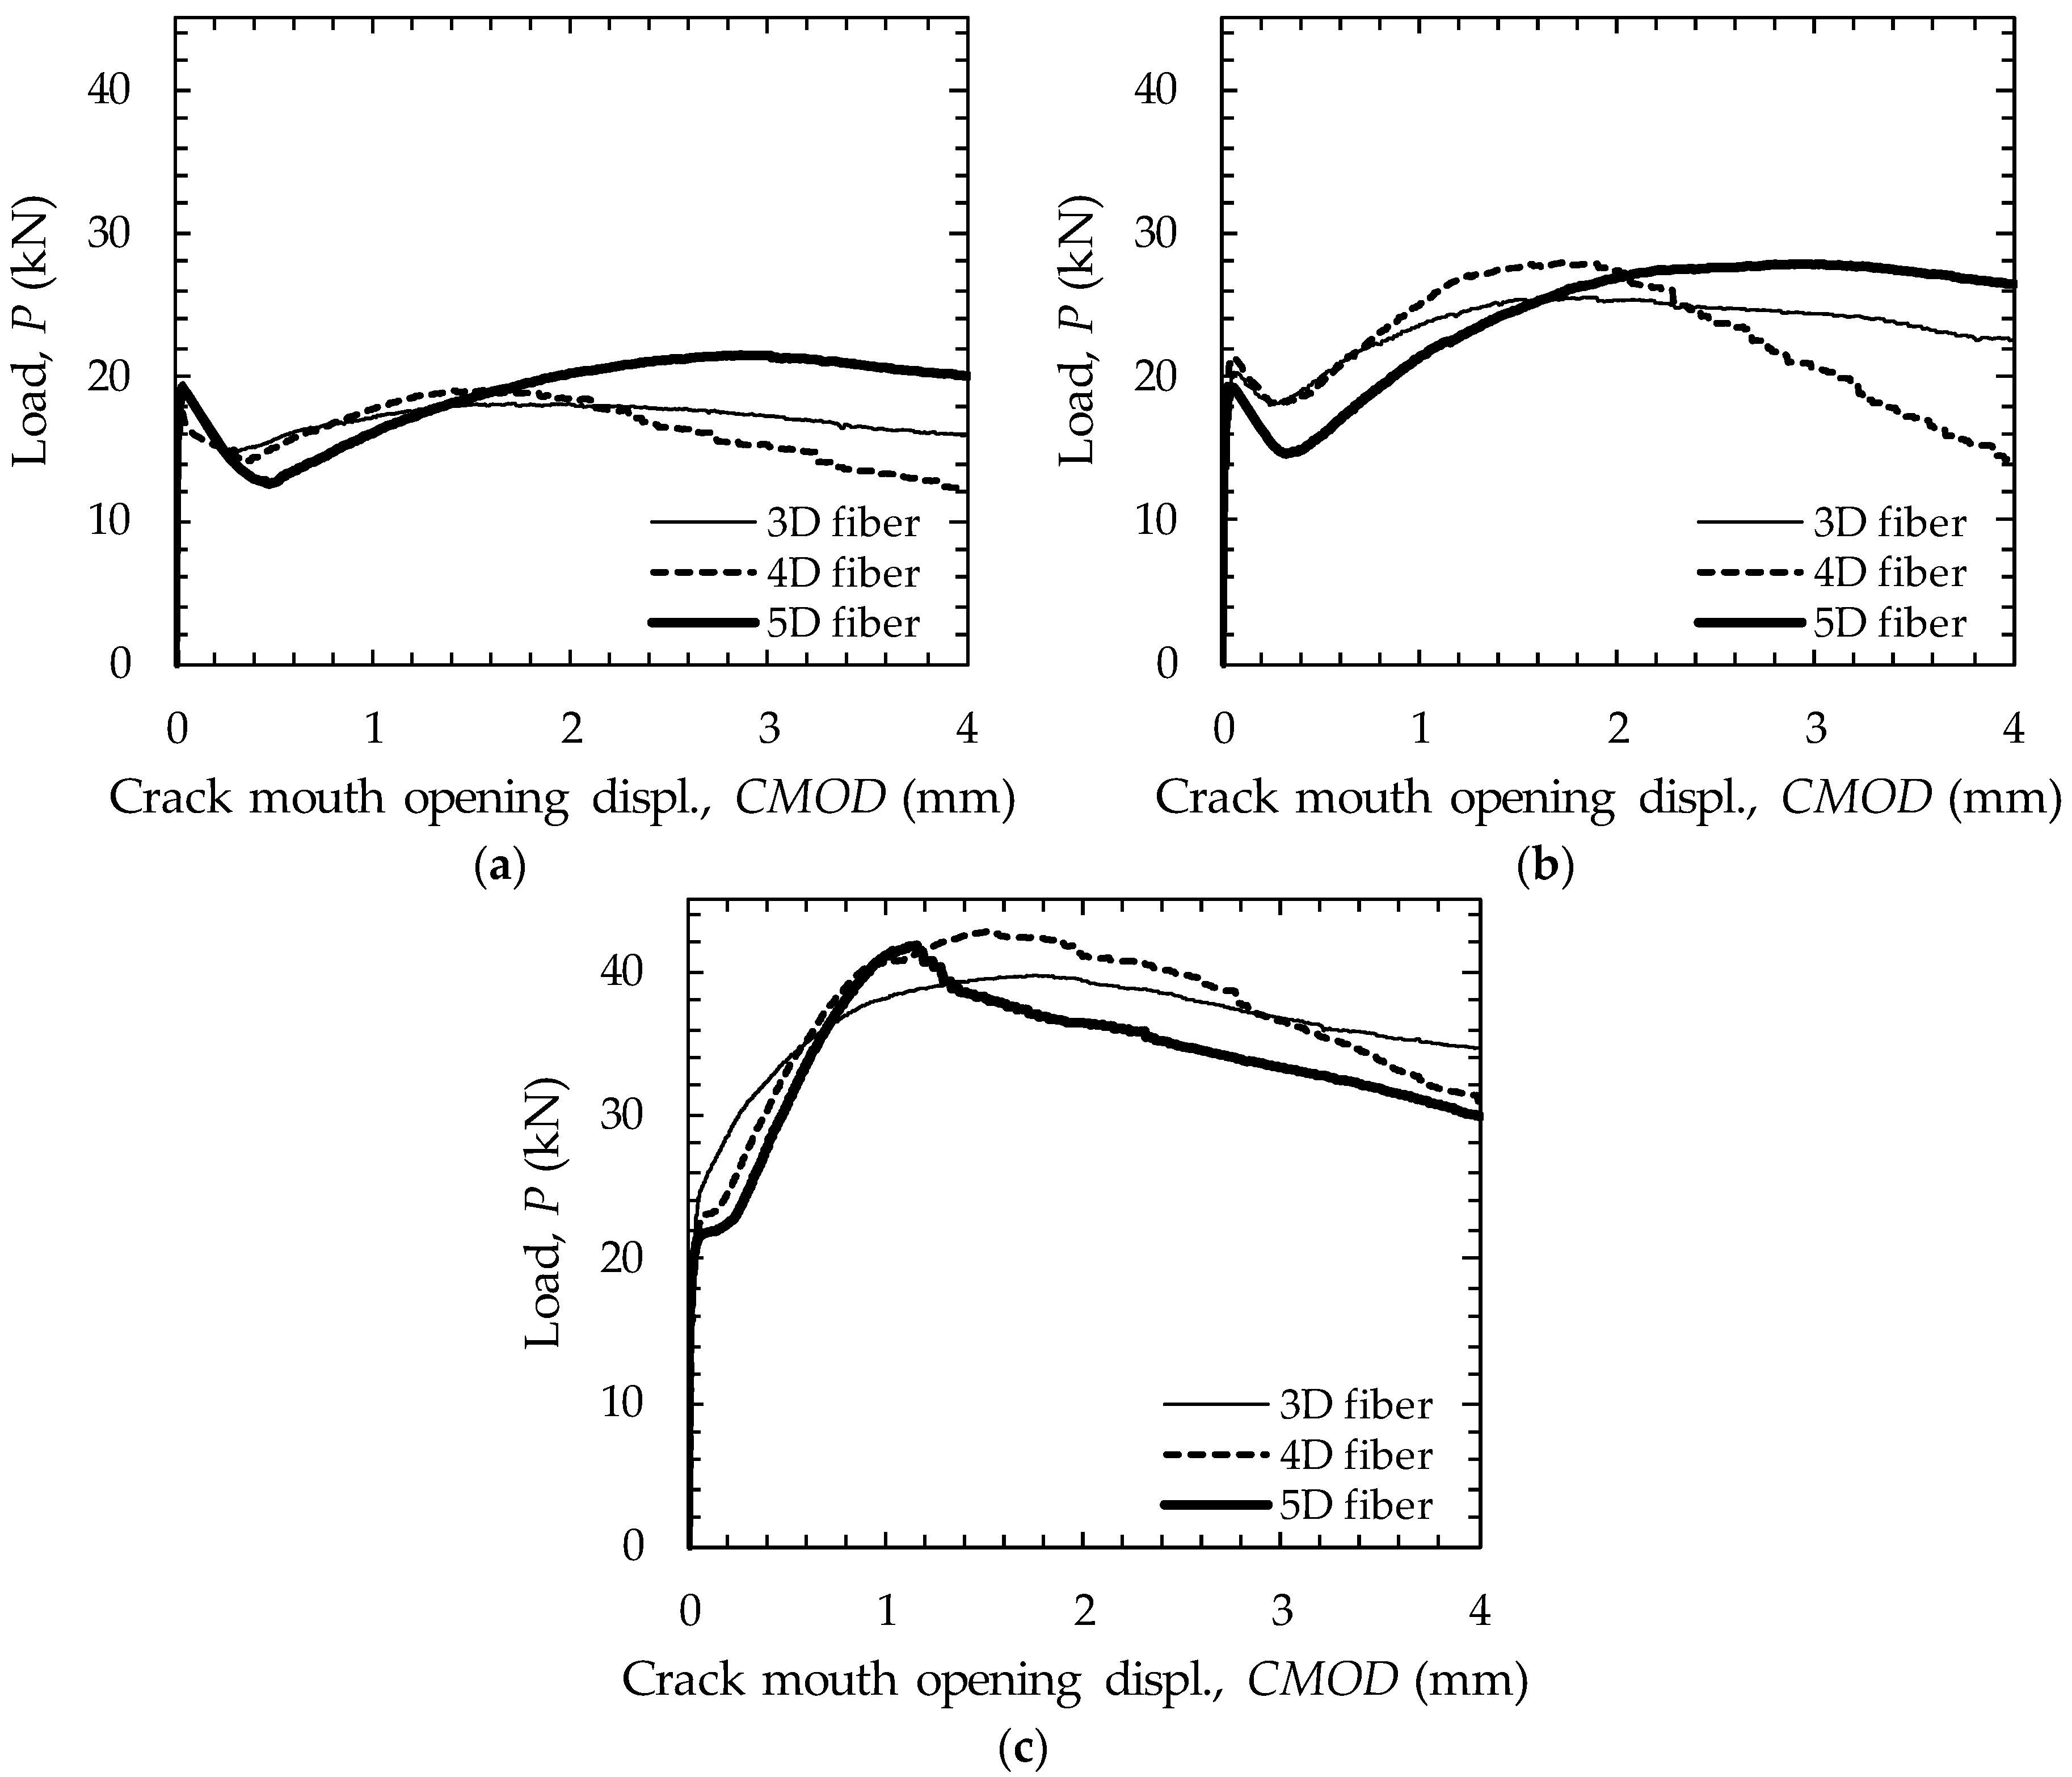
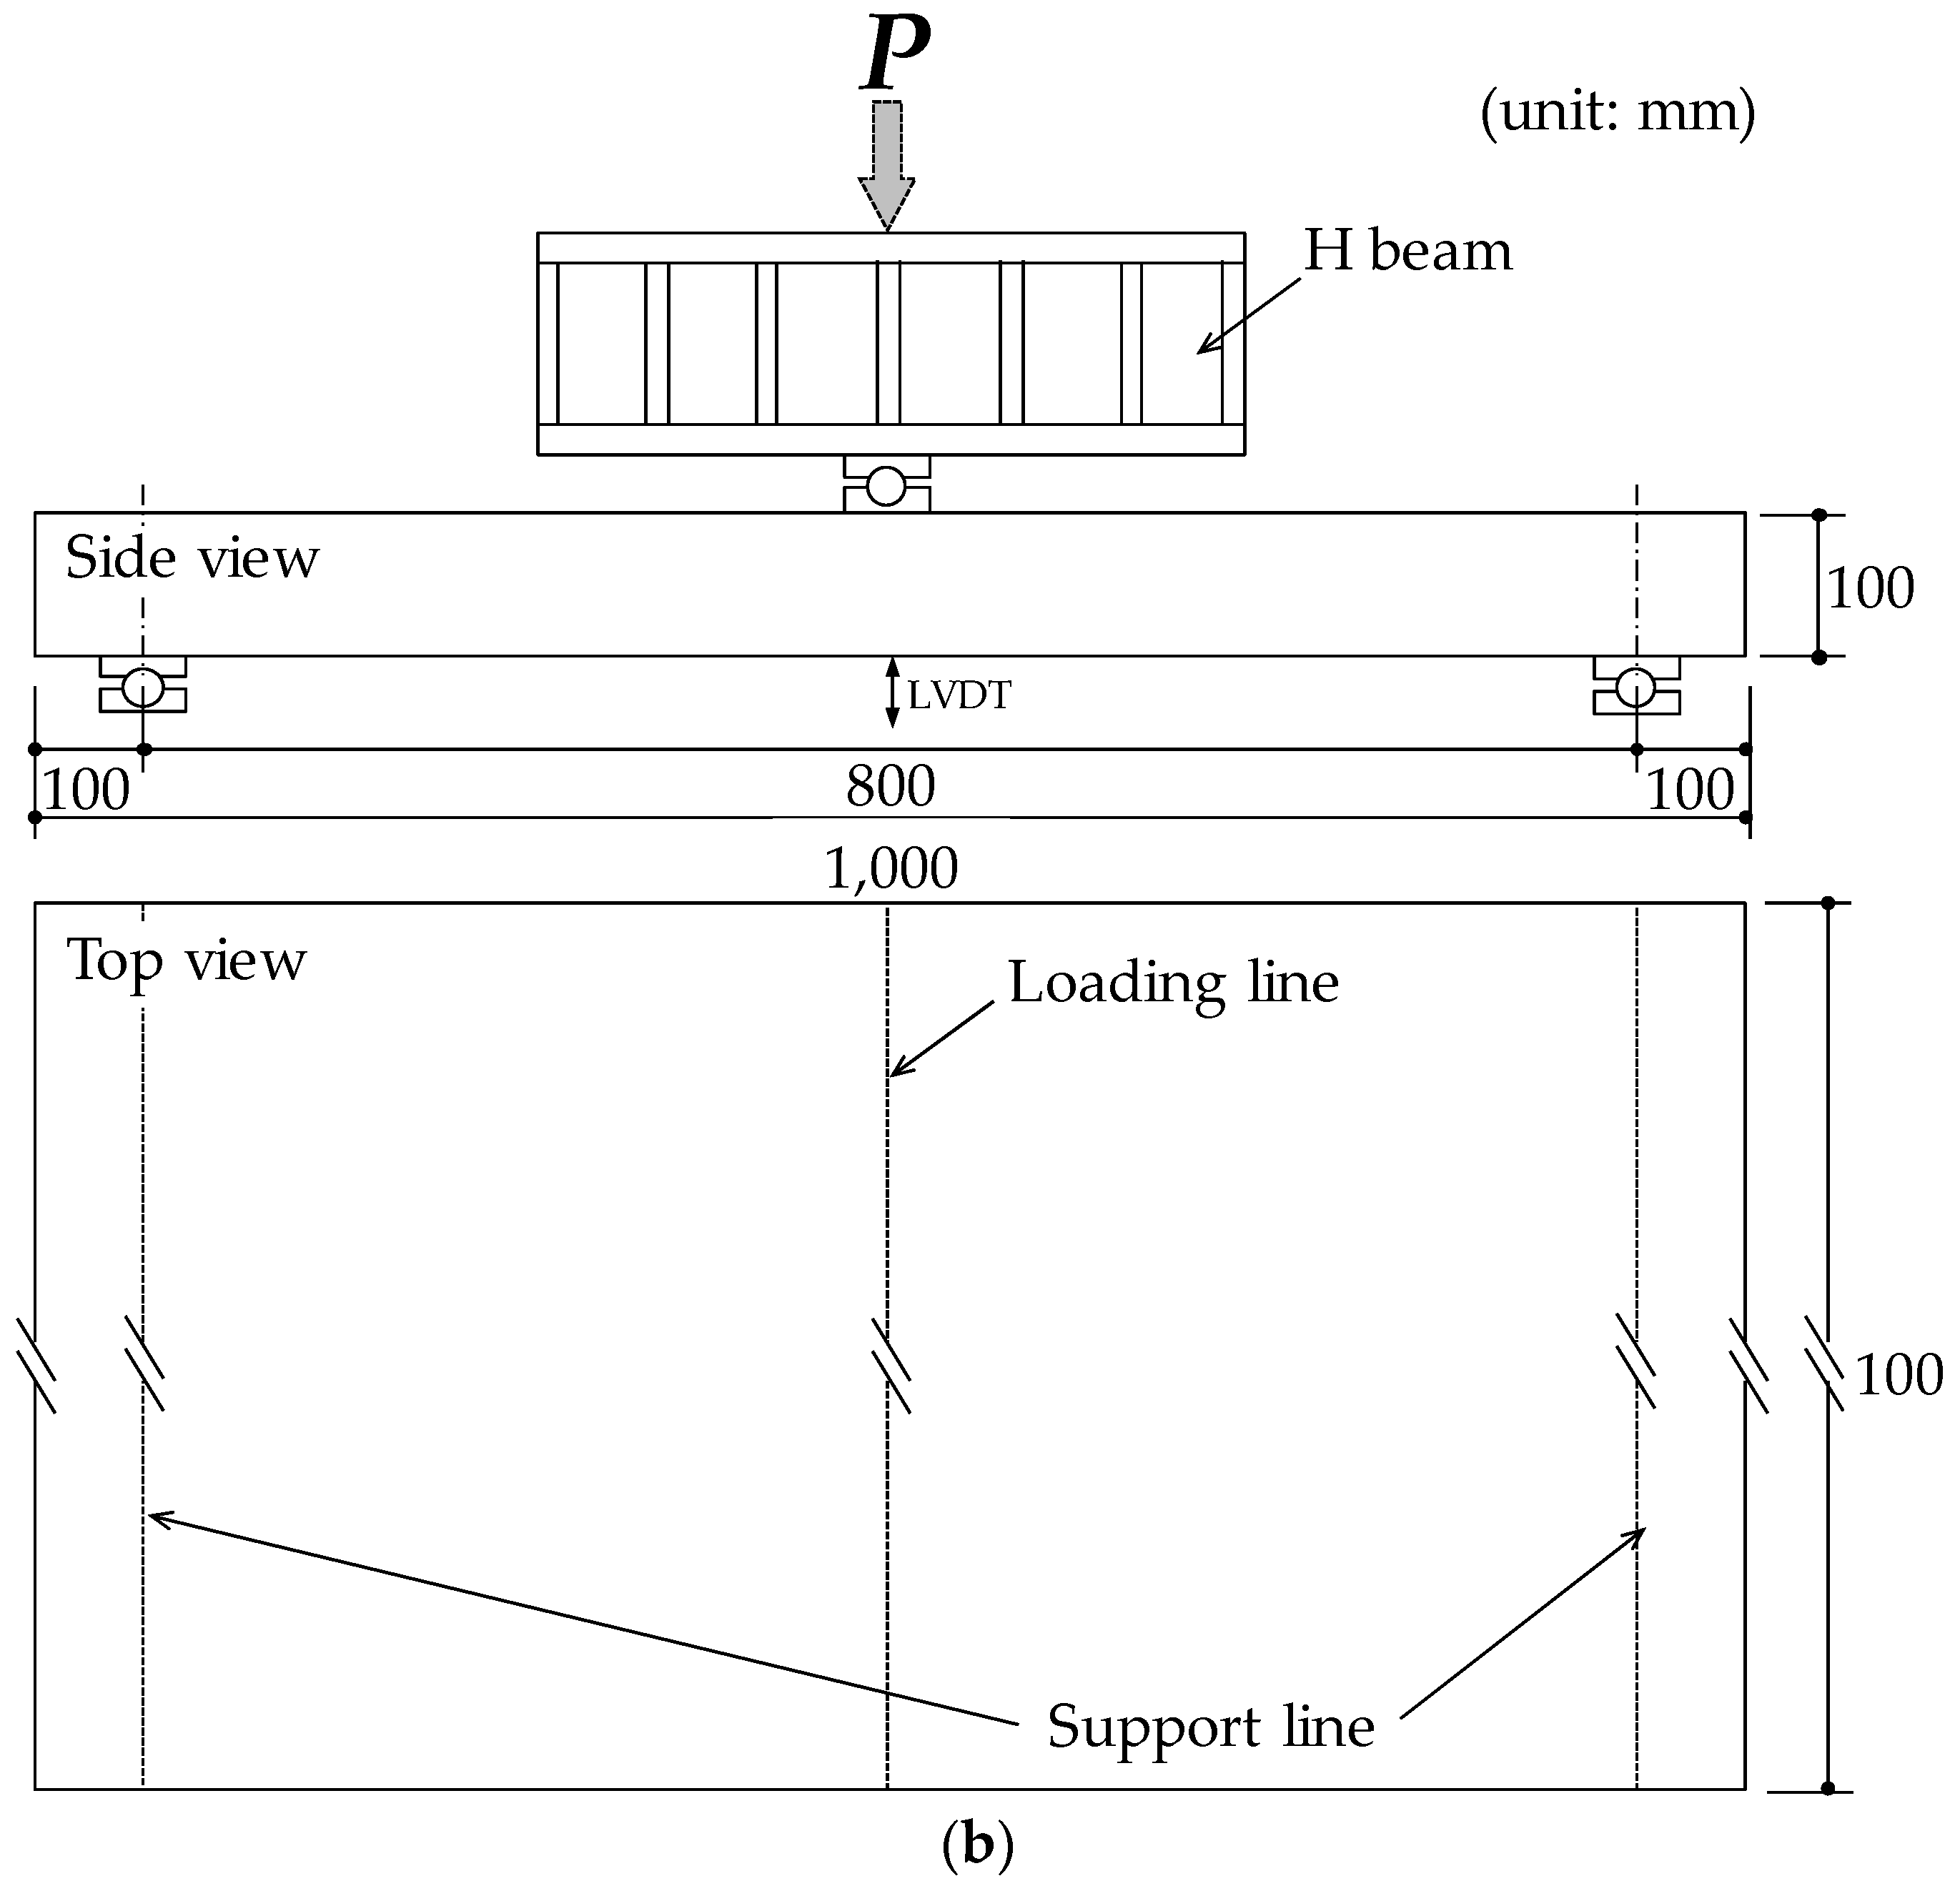
4.2.1. Effects of End-Hook Geometry and Volume Fraction of Hooked-End Steel Fibers on the Overall Flexural Behavior

The flexural load versus center deflection curves for all concrete pedestrian decks tested are shown in Figure 7. Given the same fiber volume fraction, the 5D hooked-end fibers have the best flexural performance including the load-carrying capacity and post-peak ductility, followed by the 4D and 3D hooked-end fibers, respectively. This is mainly caused by their better pullout resistance, i.e., higher bond strength and pullout work, as reported by some previous studies [10,11,12]. The higher number of hook ends requires a higher force to bend more plastic hinges; hence, the 5D hooked-end fiber had the highest pullout resistance, followed by the 4D and 3D fiber, based on an assumption that the cement matrix was strong enough. Abdallah et al. [11] reported that the tensile strength and post-cracking hardening behavior of concrete are enhanced by adding 0.5% and 1% hooked-end steel fibers and the 5D hooked-end fiber results in the best tensile performance. Given the identical fiber volume fractions of 0.5% and 1%, only the specimens with 5D hooked-end fibers exhibited a re-increase in the tensile stress after cracking, called hardening, while the others with 3D and 4D hooked-end fibers did not show the hardening behavior. Similarly, Venkateshwaran et al. [12] mentioned that SFRCs comprising fibers with multiple hook ends provide a higher residual flexural strength than the counterpart with a single hook end (3D) because of the enhanced fiber anchorage. Thus, it can be concluded that a higher number of hook ends can effectively increase both the flexural tensile strength and post-cracking bridging capacity, related to the residual strength, of plain concrete compared to a lower number of hook ends.
Similar to the uniaxial flexural test results of notched beams, the SFRC decks with 0.37% volume fraction exhibited deflection-softening behaviors. This means that the post-cracking maximum load is lower than the initial cracking load, as shown in Figure 7a. Furthermore, a sudden drop in the load immediately after the crack formation was observed similar to the results observed by Banthia and Sappakittipakorn [28]; it is caused by the drastic softening of plain concrete and vulnerable fiber bridging capability. The slight re-increase in flexural load after the sudden decrease was also reported by Fantilli et al. [1] at low volume fractions of steel fibers. At the fiber volume fraction of 0.6%, the 3D hooked-end fiber specimen led to deflection-softening behavior, whereas the 5D hooked-end fiber specimen resulted in deflection-hardening behavior. The 4D hooked-end fiber specimen led to an intermediate behavior. Regardless of the fiber type, all SFRC decks with vf of 0.6% prevented or at least decreased the sudden load drop immediately after the formation of crack based on the enhanced fiber bridging capacity. The steep decrease in the post-cracking flexural load was fully sustained by the higher number of steel fibers at the crack surface, leading to the improved residual strength in SFRC decks with the higher fiber volume fraction of 0.6% compared to those with lower volume fractions, as shown in Figure 7a,b. With the highest fiber volume fraction of 1.0%, all SFRC decks showed excellent deflection-hardening behaviors, as shown in Figure 7c. Since using a higher number of hook ends is more effective in enhancing the flexural performance of concrete decks as compared to a lower number, it can more effectively reduce or replace the minimum amount of steel rebars, based on ACI 318 code [3].
The flexural strength of SFRC decks increased with an increase in the fiber volume fraction from 0.37% to 1.0%, for all steel fiber types, which is consistent with the findings of Venkateshwaran et al. [12]. This is because a higher number of fibers can more effectively bridge the cracks and limit their propagation and widening compared to a lower number. The first-cracking and ultimate flexural loads of SFRC decks according to the fiber volume fraction are shown in Figure 8. Because the SFRC decks with 0.37 vol% of steel fibers provided deflection-softening behaviors, they exhibited identical first-cracking and ultimate loads of 40.8 kN, 44.8 kN, and 51.0 kN for the 3D, 4D, and 5D hooked-end fibers, respectively. For the case of first-cracking load in Figure 8a, there was no obvious increase in the load by increasing the volume fraction up to 0.6% and some specimens even exhibited reduced load values (4D and 5D fiber specimens). However, at the highest volume fraction of 1.0%, all SFRC decks provided higher loads than those with the lower volume fraction of 0.37%. In contrast, the ultimate load obviously increased with increased fiber volume fraction, as shown in Figure 8b, and the load increase was more significant from the volume fraction of 0.6% to 1.0% than that from 0.37% to 0.6%, because all SFRC decks obviously showed deflection-hardening behaviors at the volume fraction of 1.0%.

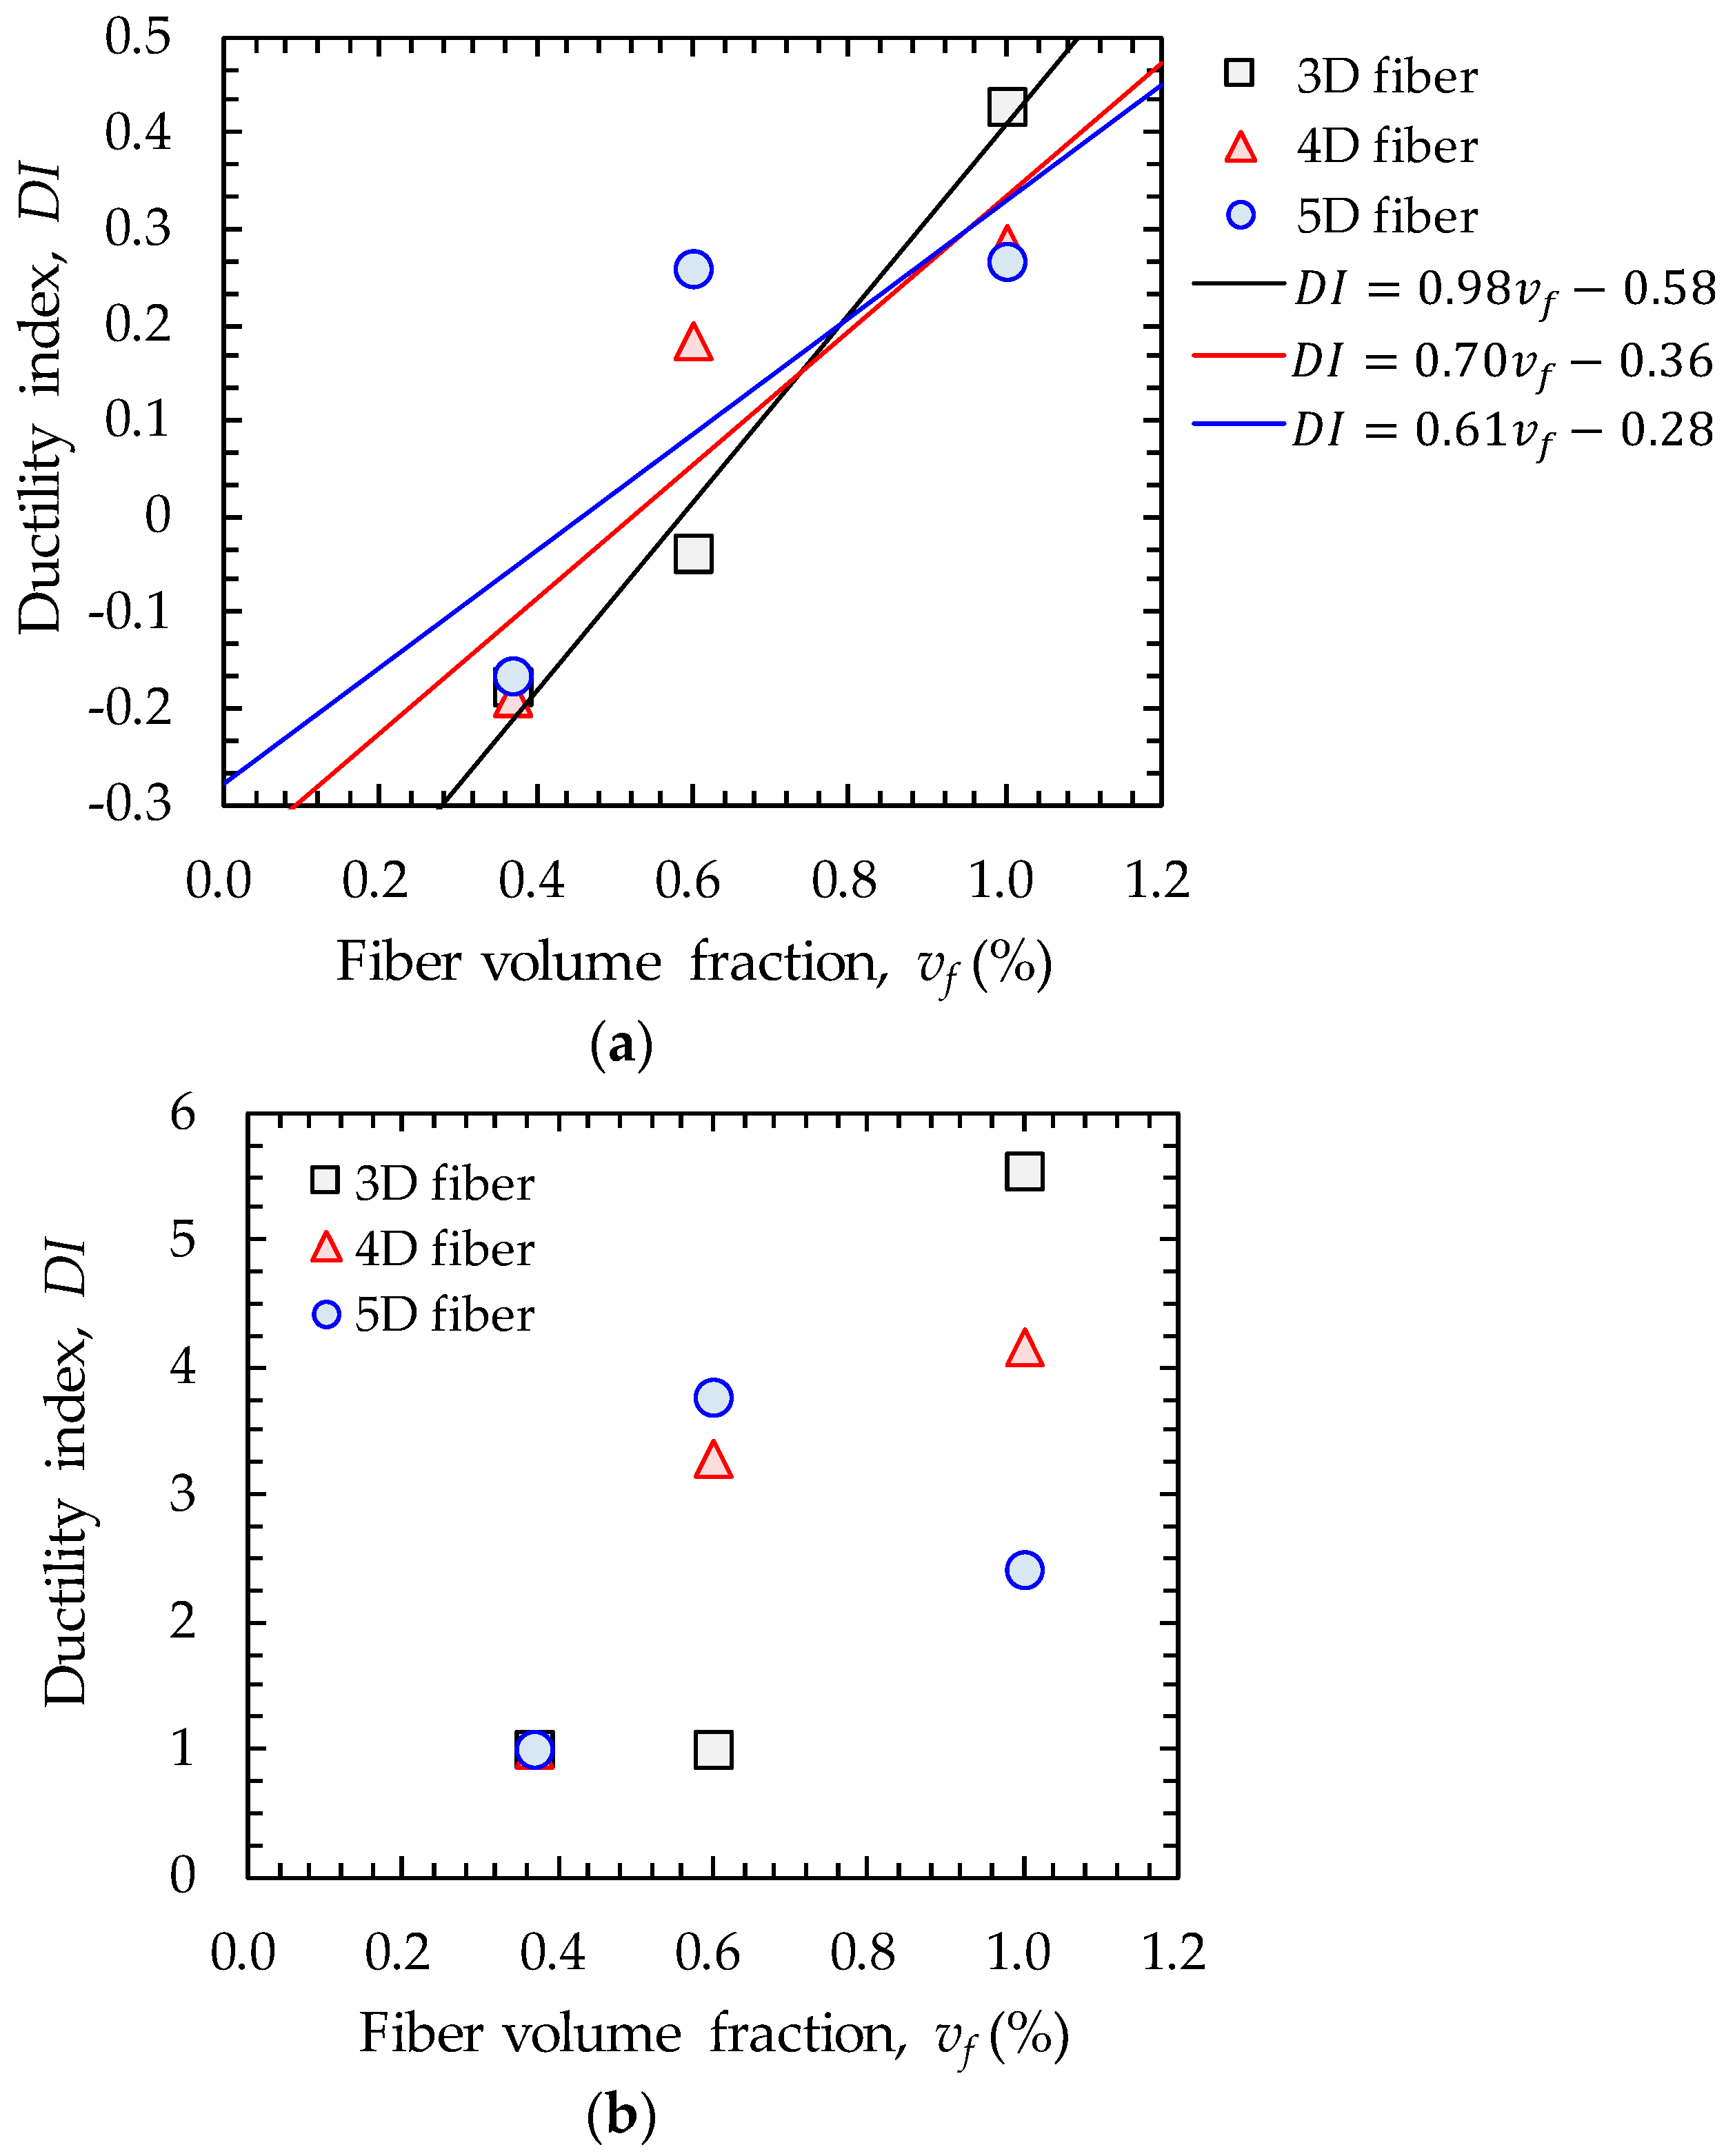
4.2.2. Ductility Evaluation

To comparatively evaluate the effectiveness of adding hooked-end steel fibers and their amounts on the first-cracking and ultimate loads, the ratios of ultimate load and first-cracking load (Pu/Pcr) are shown in Figure 9. In general, increasing the volume fraction of hooked-end steel fibers led to an increased Pu/Pcr ratio. This means that an increase in fiber amount is more efficient in enhancing the ultimate load than the cracking load, because the fiber bridging is mainly activated after the formation of matrix cracks. Similarly, Yoo et al. [6] reported that the first-cracking flexural strength of SFRC beams with vf of 0.5% was similar to that of plain concrete beams without fibers as it is more dependent on the matrix cracking strength than the fiber bridging effect; however, the SFRC beams with vf of more than 1.0% provided a noticeably higher flexural strength than the plain concrete beams. Because a higher Pu/Pcr ratio guarantees a more ductile behavior, adding a higher amount of hooked-end steel fibers of up to 1% is beneficial in fabricating ductile pedestrian concrete decks without conventional steel rebars. It is interesting to note that, at the moderate volume fraction of 0.6%, steel fibers with a higher number of hook ends led to a higher Pu/Pcr ratio; however, that ratio decreased with an increase in the number of hook ends at the high volume fraction of 1.0%.
To quantitatively investigate the ductility of pedestrian decks, two different DIs, based on flexural load and deflection, are adopted. First, DI is calculated by dividing the difference between the post-cracking ultimate load and cracking load by the cracking load [1]. Second, a deflection DI, calculated by dividing the deflection at the first-cracking point by the deflection at the maximum load, is adopted. The DIs are given as follows:
D I = P p u P c r P c r
μ = Δ c r Δ p
where Ppu is the post-cracking ultimate load, Pcr is the cracking load, μ is the deflection ductility index (DI), Δcr is the deflection at the cracking point, and Δp is the deflection at maximum load.
The relationship between the load DI and fiber volume fraction is shown in Figure 10a. It is obvious that the DI increases with increasing volume fraction for all types of hooked-end steel fibers, which is consistent with the findings of Fantilli et al. [1]. According to the minimum reinforcement ratio concept given by the ACI 318 code, the 4D and 5D hooked-end fibers can replace the minimum longitudinal rebars if their volume fraction is equal to 0.6%, whereas the 3D hooked-end fiber requires a higher volume fraction of 1.0%. The highest value of DI was found to be 0.43 in the specimen with 1.0 vol% of 3D hooked-end steel fibers, which is much higher than that (below 0.3) given by Fantilli et al. [1] for sidewalk slabs made of lightweight SFRC and having a similar size. In particular, the DI value obtained in the lightweight slab reinforced with the minimum amount of conventional steel rebars was 0.39 [1], which is lower than the highest value of SFRC slabs without steel rebars tested in this study. The 3D hooked-end fiber specimens provided the steepest increase in the DI values according to the fiber volume fraction, followed by the 4D and 5D hooked-end fiber specimens. This is because the effectiveness of hooked-end steel fibers for enhancing the DI at the high volume fraction of 1.0% was greater in the specimens with a lower number of hook ends. Based on a previous study [1], if we assume the minimum value of DI as 0.39, the required amount of hooked-end steel fibers to satisfy it can be calculated based on a simple linear empirical equation: D I = a × v f + b , where vf is the fiber volume fraction. The required amounts of steel fibers to satisfy the minimum value of 0.39 were calculated to be 0.98%, 1.08%, and 1.10% for the 3D, 4D, and 5D hooked-end fibers, respectively.
In general, for reinforced-concrete beams, DI is calculated based on deflections at the steel bar yielding and peak points [29,30]. However, because no conventional steel rebar was used for the SFRC decks tested in this study, the deflection at the steel bar yielding point was replaced by the cracking deflection (Δcr), as given in Equation (6). The calculated DIs are shown in Figure 10b. A higher DI was generally obtained with a higher amount of steel fibers, similar to the results of the Pu/Pcr ratio. The highest DI was found to be 5.5 for the specimen with 1.0 vol% of 3D hooked-end steel fibers, and the specimen with 1.0 vol% of 4D hooked-end fibers exhibited the second highest DI of 4.2. Identical to the results of the Pu/Pcr ratio and DI, at the high volume fraction of 1.0%, the DI was reduced by increasing the number of hook ends. This is caused by the enhanced post-cracking flexural stiffness as shown in Figure 7c. The specimen with 3D hooked-end fibers exhibited a gradual and continuous increase in load after the cracking point, while the specimen with 5D hooked-end fibers provided a steep increase in load after cracking, quickly reaching the maximum point, followed by a gradual load decrease. Thus, the higher cracking load and post-cracking flexural stiffness of the specimen with 5D hooked-end fibers resulted in a lower DI. On the other hand, the DI increased by increasing the number of hook ends at the moderate volume fraction of 0.6%. Thus, the highest DI of 3.8 was found in the case of 5D hooked-end fibers at the volume fraction of 0.6%. Consequently, the steel fiber with a lower number of hook ends led to the steepest improvement in ductility of concrete pedestrian decks and the 3D hooked-end steel fiber is the most effective in enhancing the ductility of decks at a high fiber volume fraction of 1%.

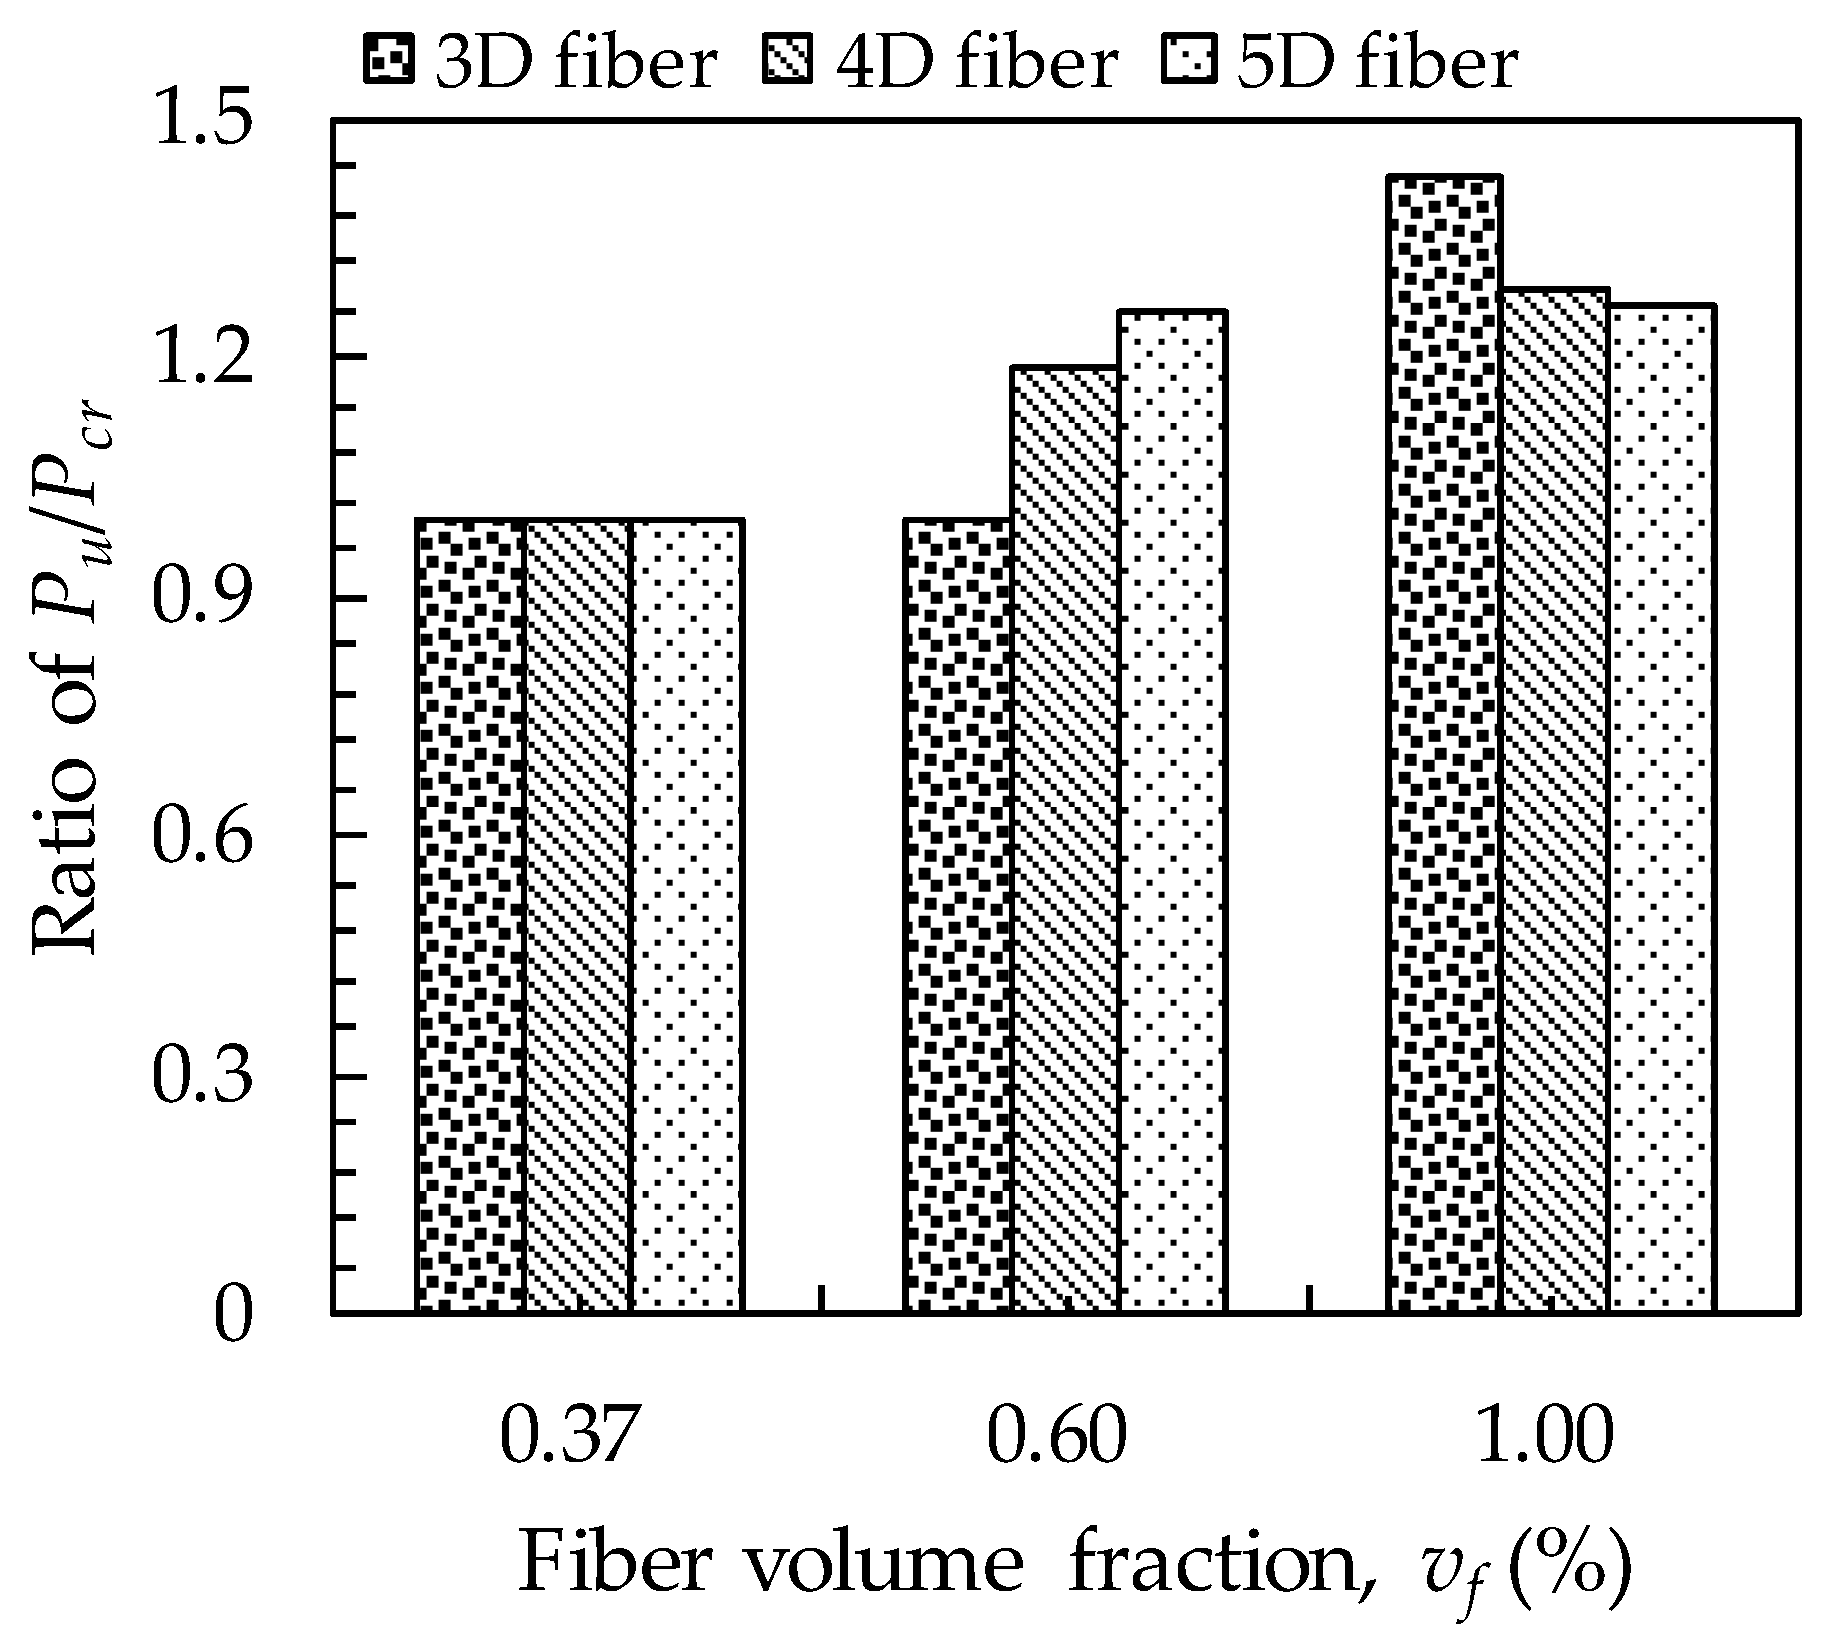
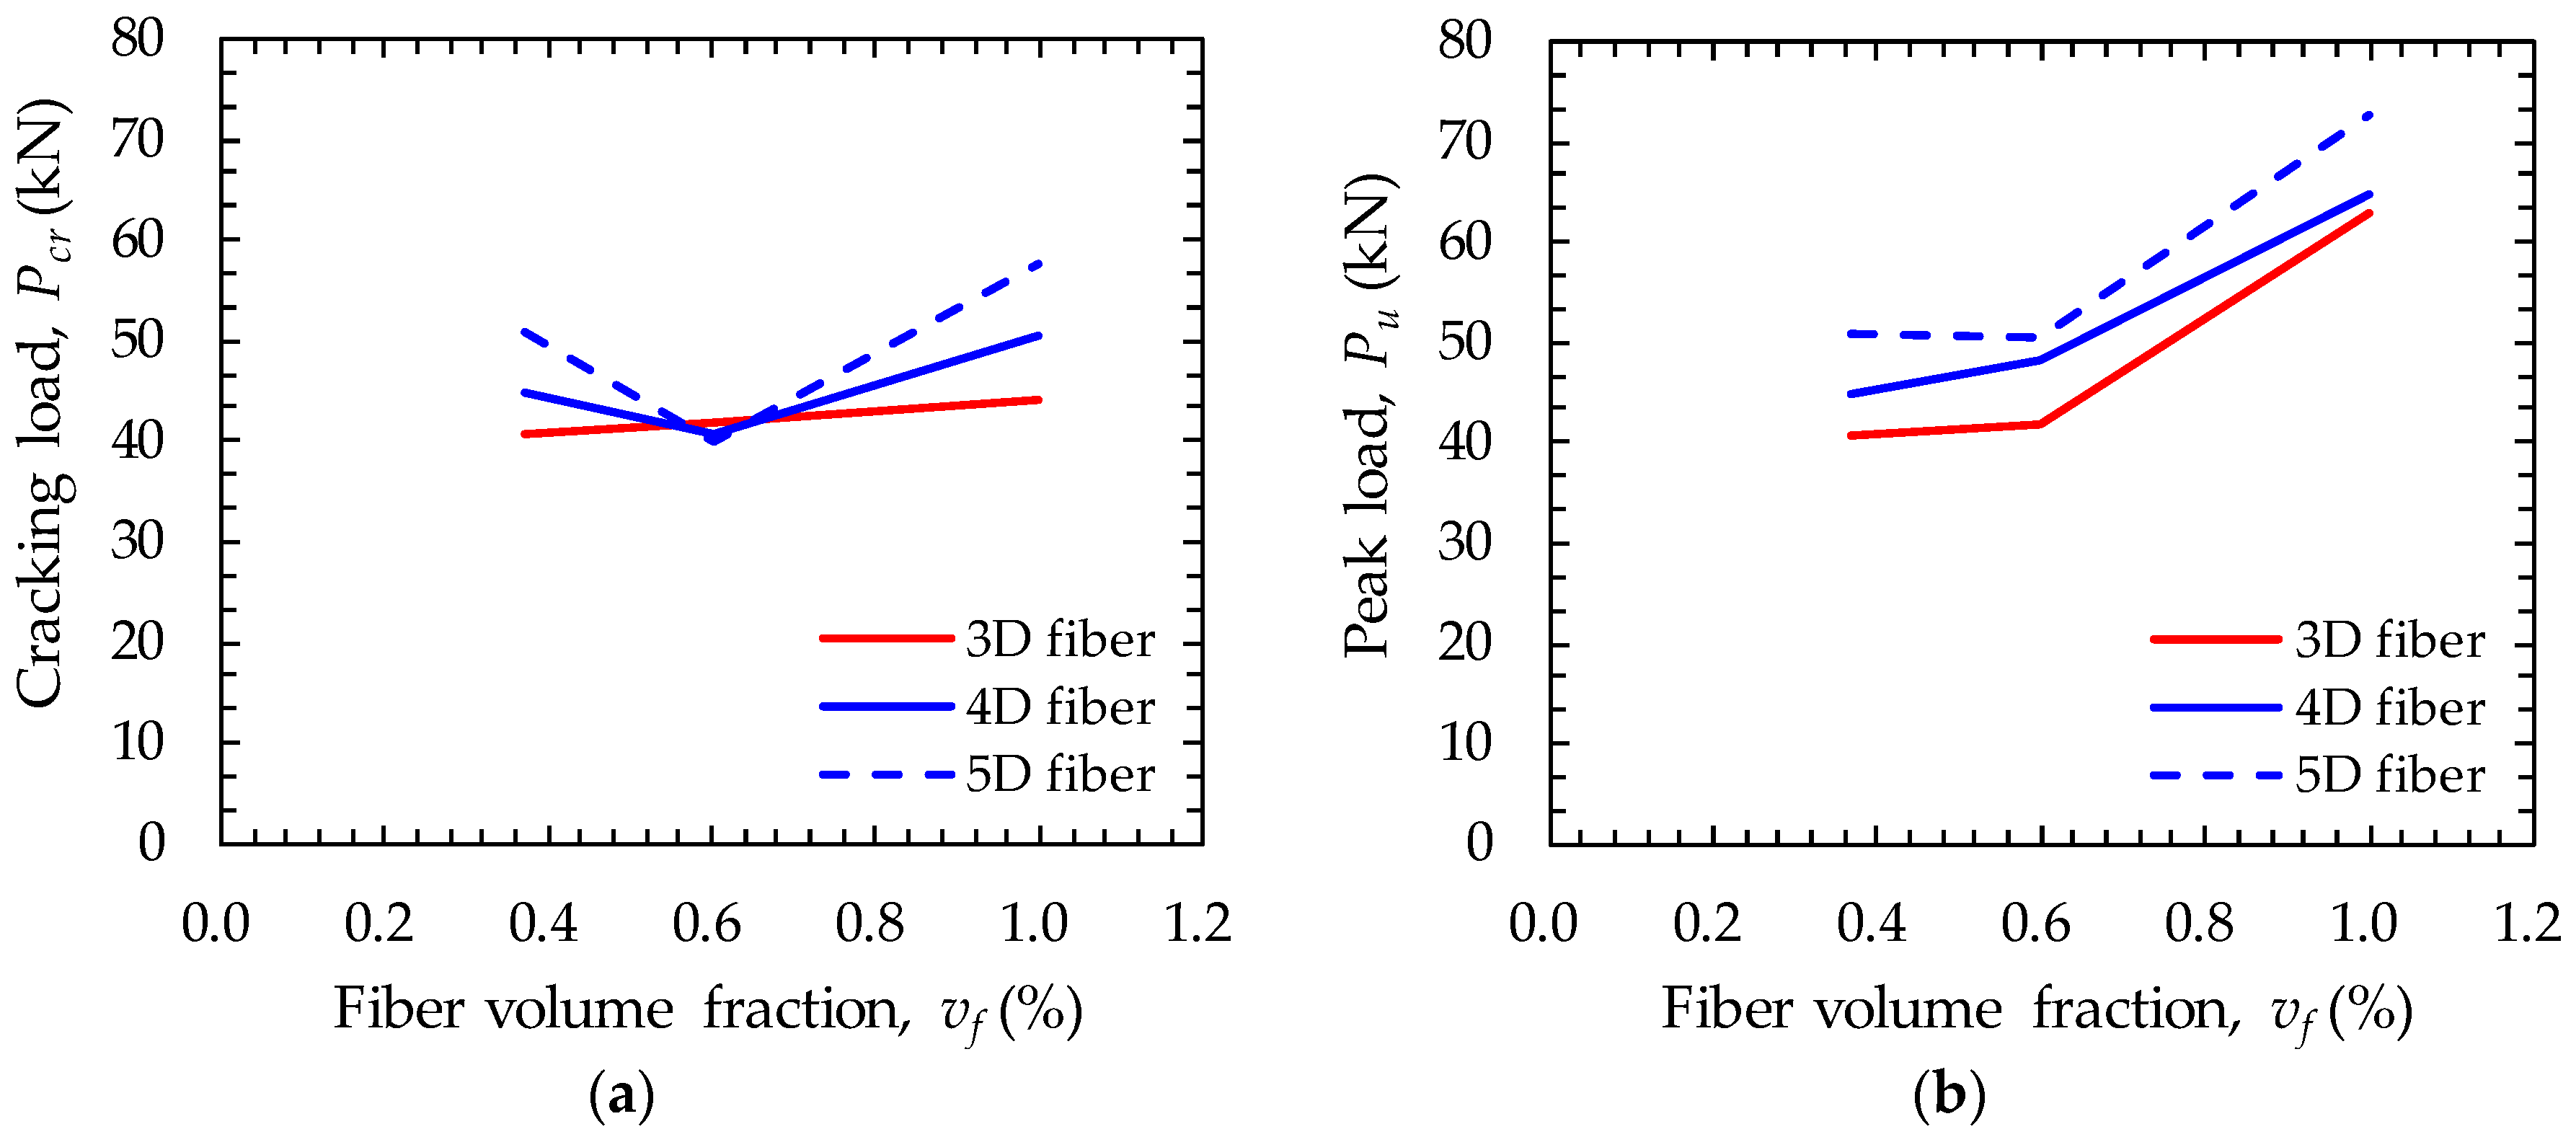
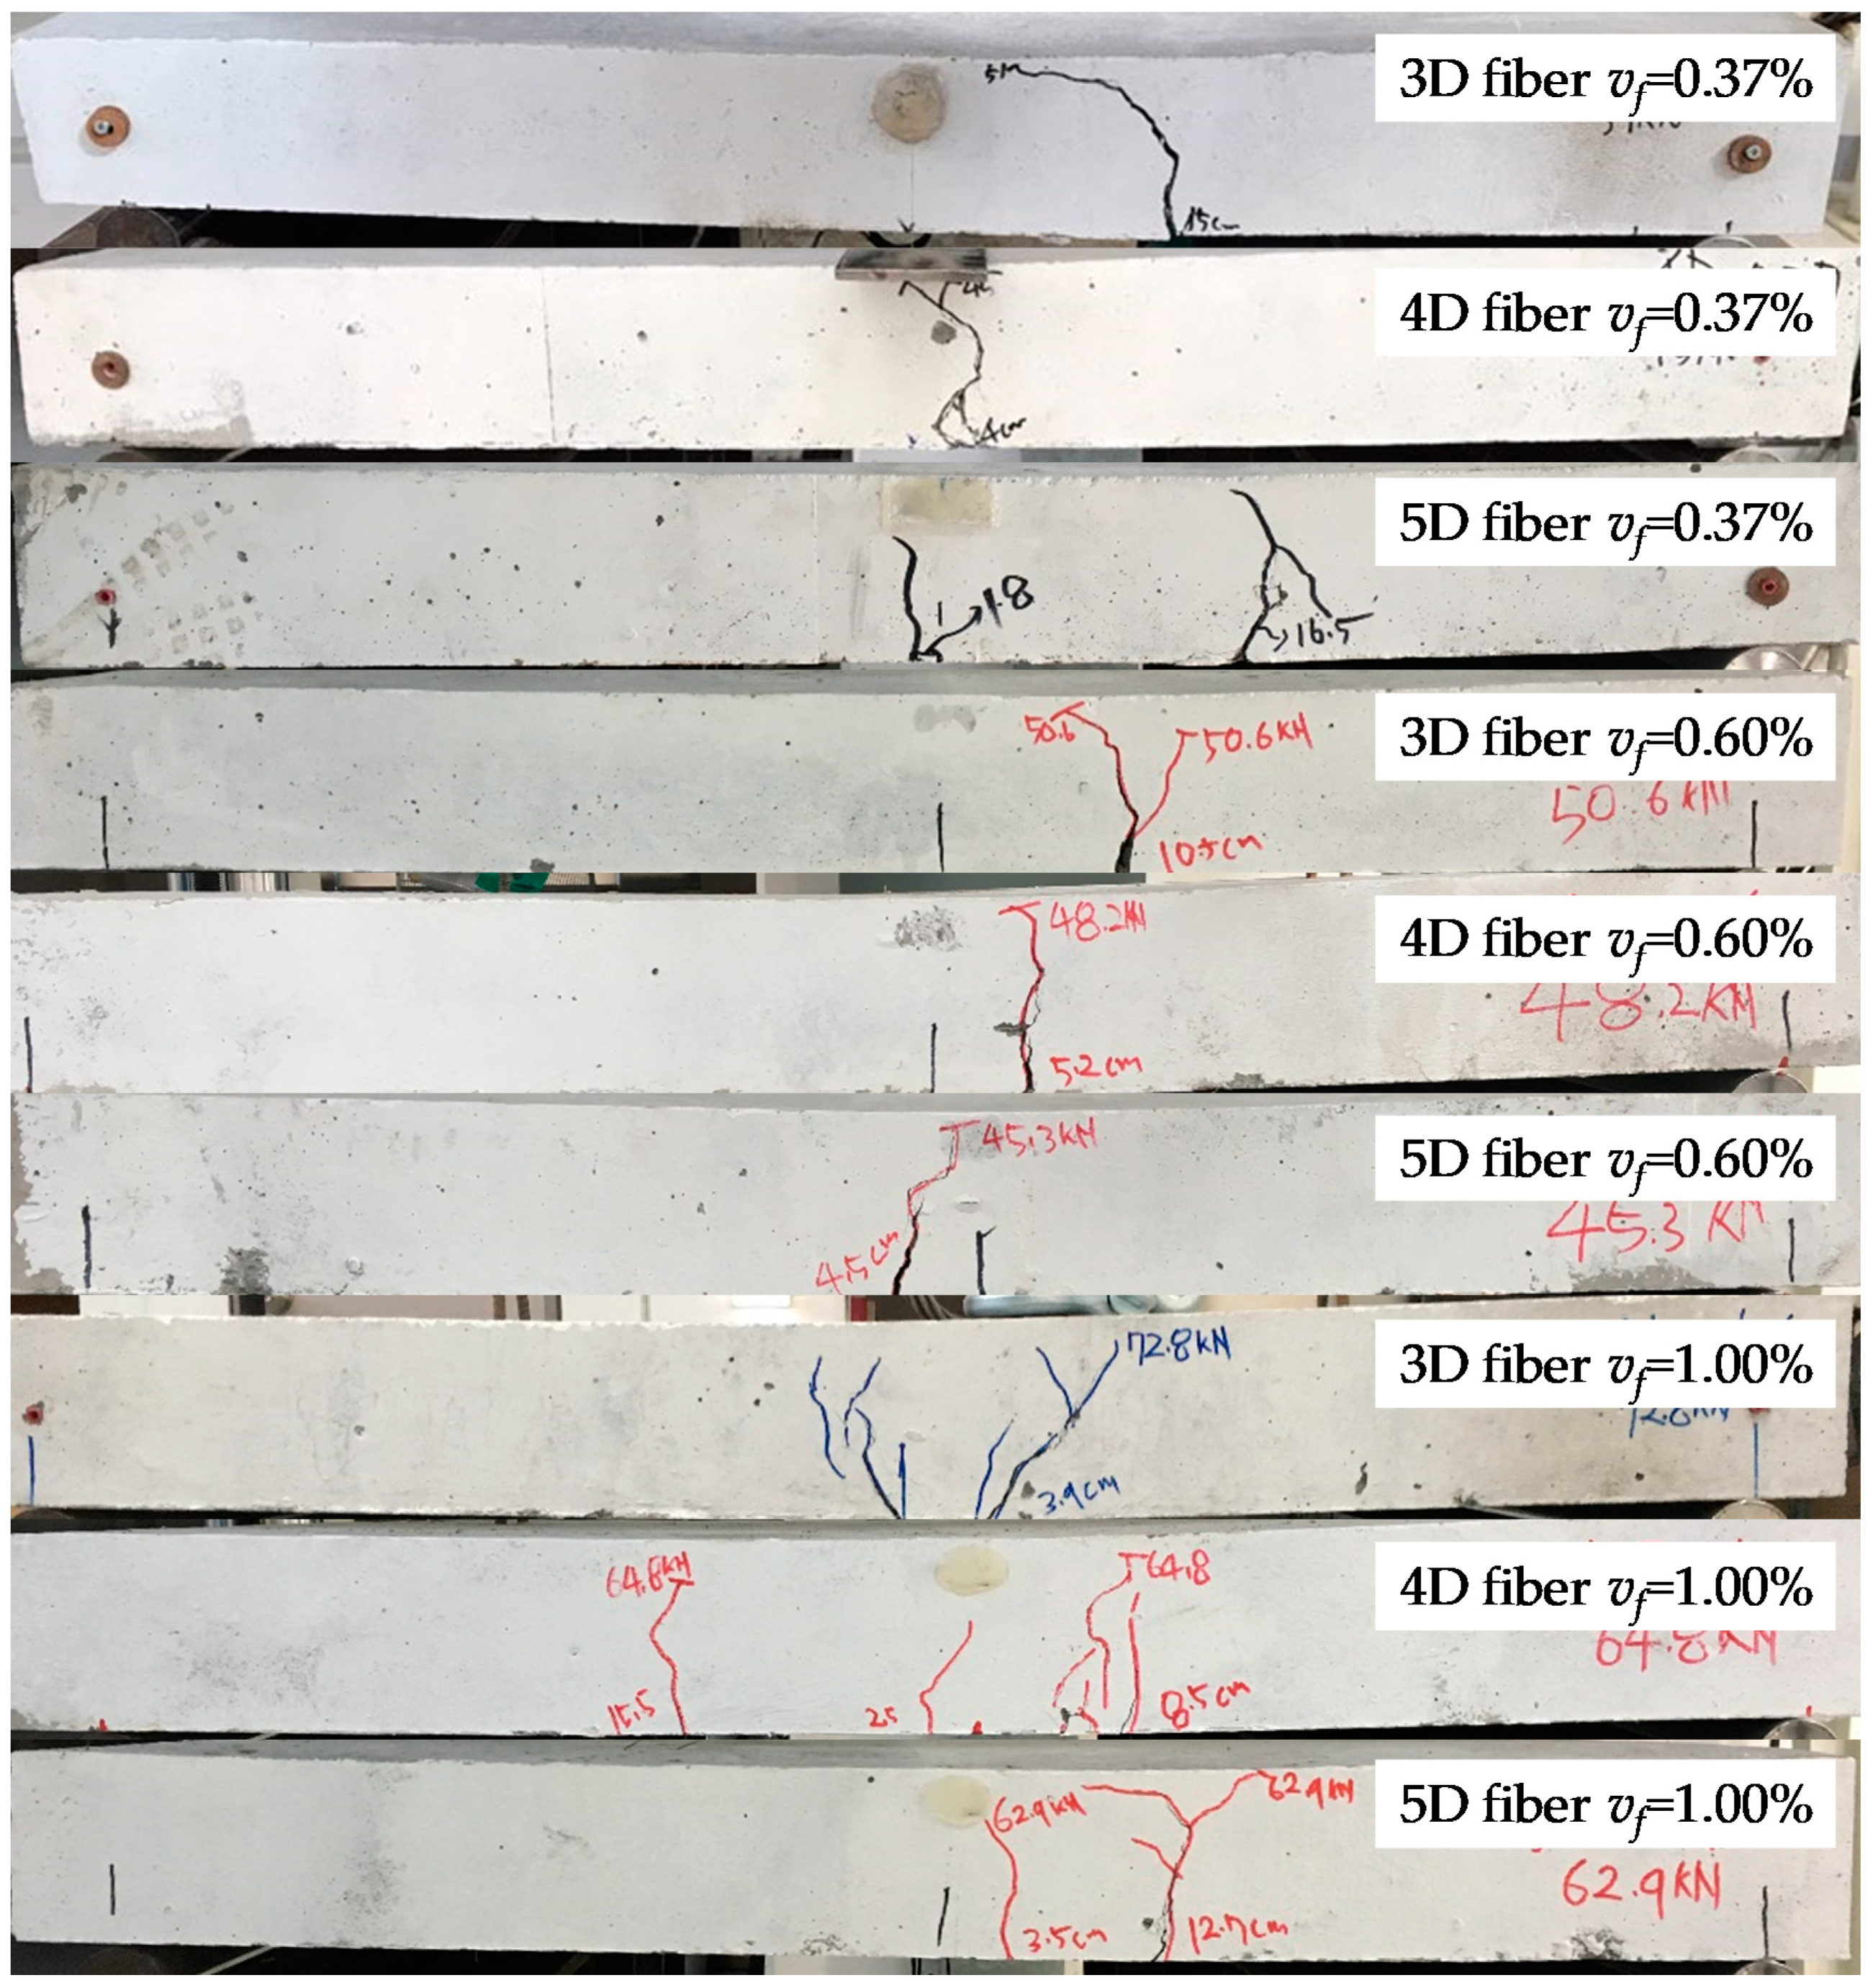
4.2.3. Cracking Response

Figure 11 shows the crack patterns of all tested SFRC decks near the maximum flexural loads. In general, only single or double cracks were formed in the specimens at the low and moderate volume fractions of 0.37 and 0.6%, regardless of the hooked-end fiber type. However, at the high volume fraction of 1.0%, the number of cracks obviously increased and all SFRC decks showed multiple flexural cracks. These cracking behaviors are related to the post-cracking load-carrying capacity. In order to achieve the deflection-hardening characteristic, the steel fibers at the crack surface must endure an increased pullout force after matrix cracking without pullout and rupture failures. This indicates that the maximum pullout load, applied to the steel fiber at the point of matrix cracking, was smaller than its pullout resistance (bond strength). The increased pullout load at the crack surface was thus transferred to the matrix surrounding the fibers, causing formations of additional cracks when the transferred stress exceeded its tensile strength. For this reason, deflection-hardening SFRC beams generally form multiple flexural cracks as reported by previous studies [31,32]. On the other hand, the SFRC decks with fiber volume fractions of 0.37% and 0.6% exhibited a deflection-softening or vague deflection-hardening behavior (PcrPpu); hence, the multiple cracking behavior was not observed. This is because the pullout load applied to the steel fibers at the point of crack formation was higher than or similar to their pullout resistance, so that they started pulling out from the matrix just after the crack formation, leading to a decrease in load. Thus, the tensile stress transferred to the surrounding matrix could not exceed the tensile strength causing crack localization without formation of multiple flexural cracks. For the specimens with 4D and 5D hooked-end fibers, larger crack widths were observed in the case of the moderate volume fraction of 0.6% than in the low volume fraction of 0.37% because the post-cracking ultimate load was slightly higher than the cracking load. Therefore, the deflection capacities of the former increased significantly than the latter, leading to greater values of curvature as well as crack width. Because flexural cracks initiate from the weakest part where fibers are fewer and the orientations are poorer, some specimens produced flexural cracks that deviate from the center where the maximum moment occurs.

5. Numerical Simulation

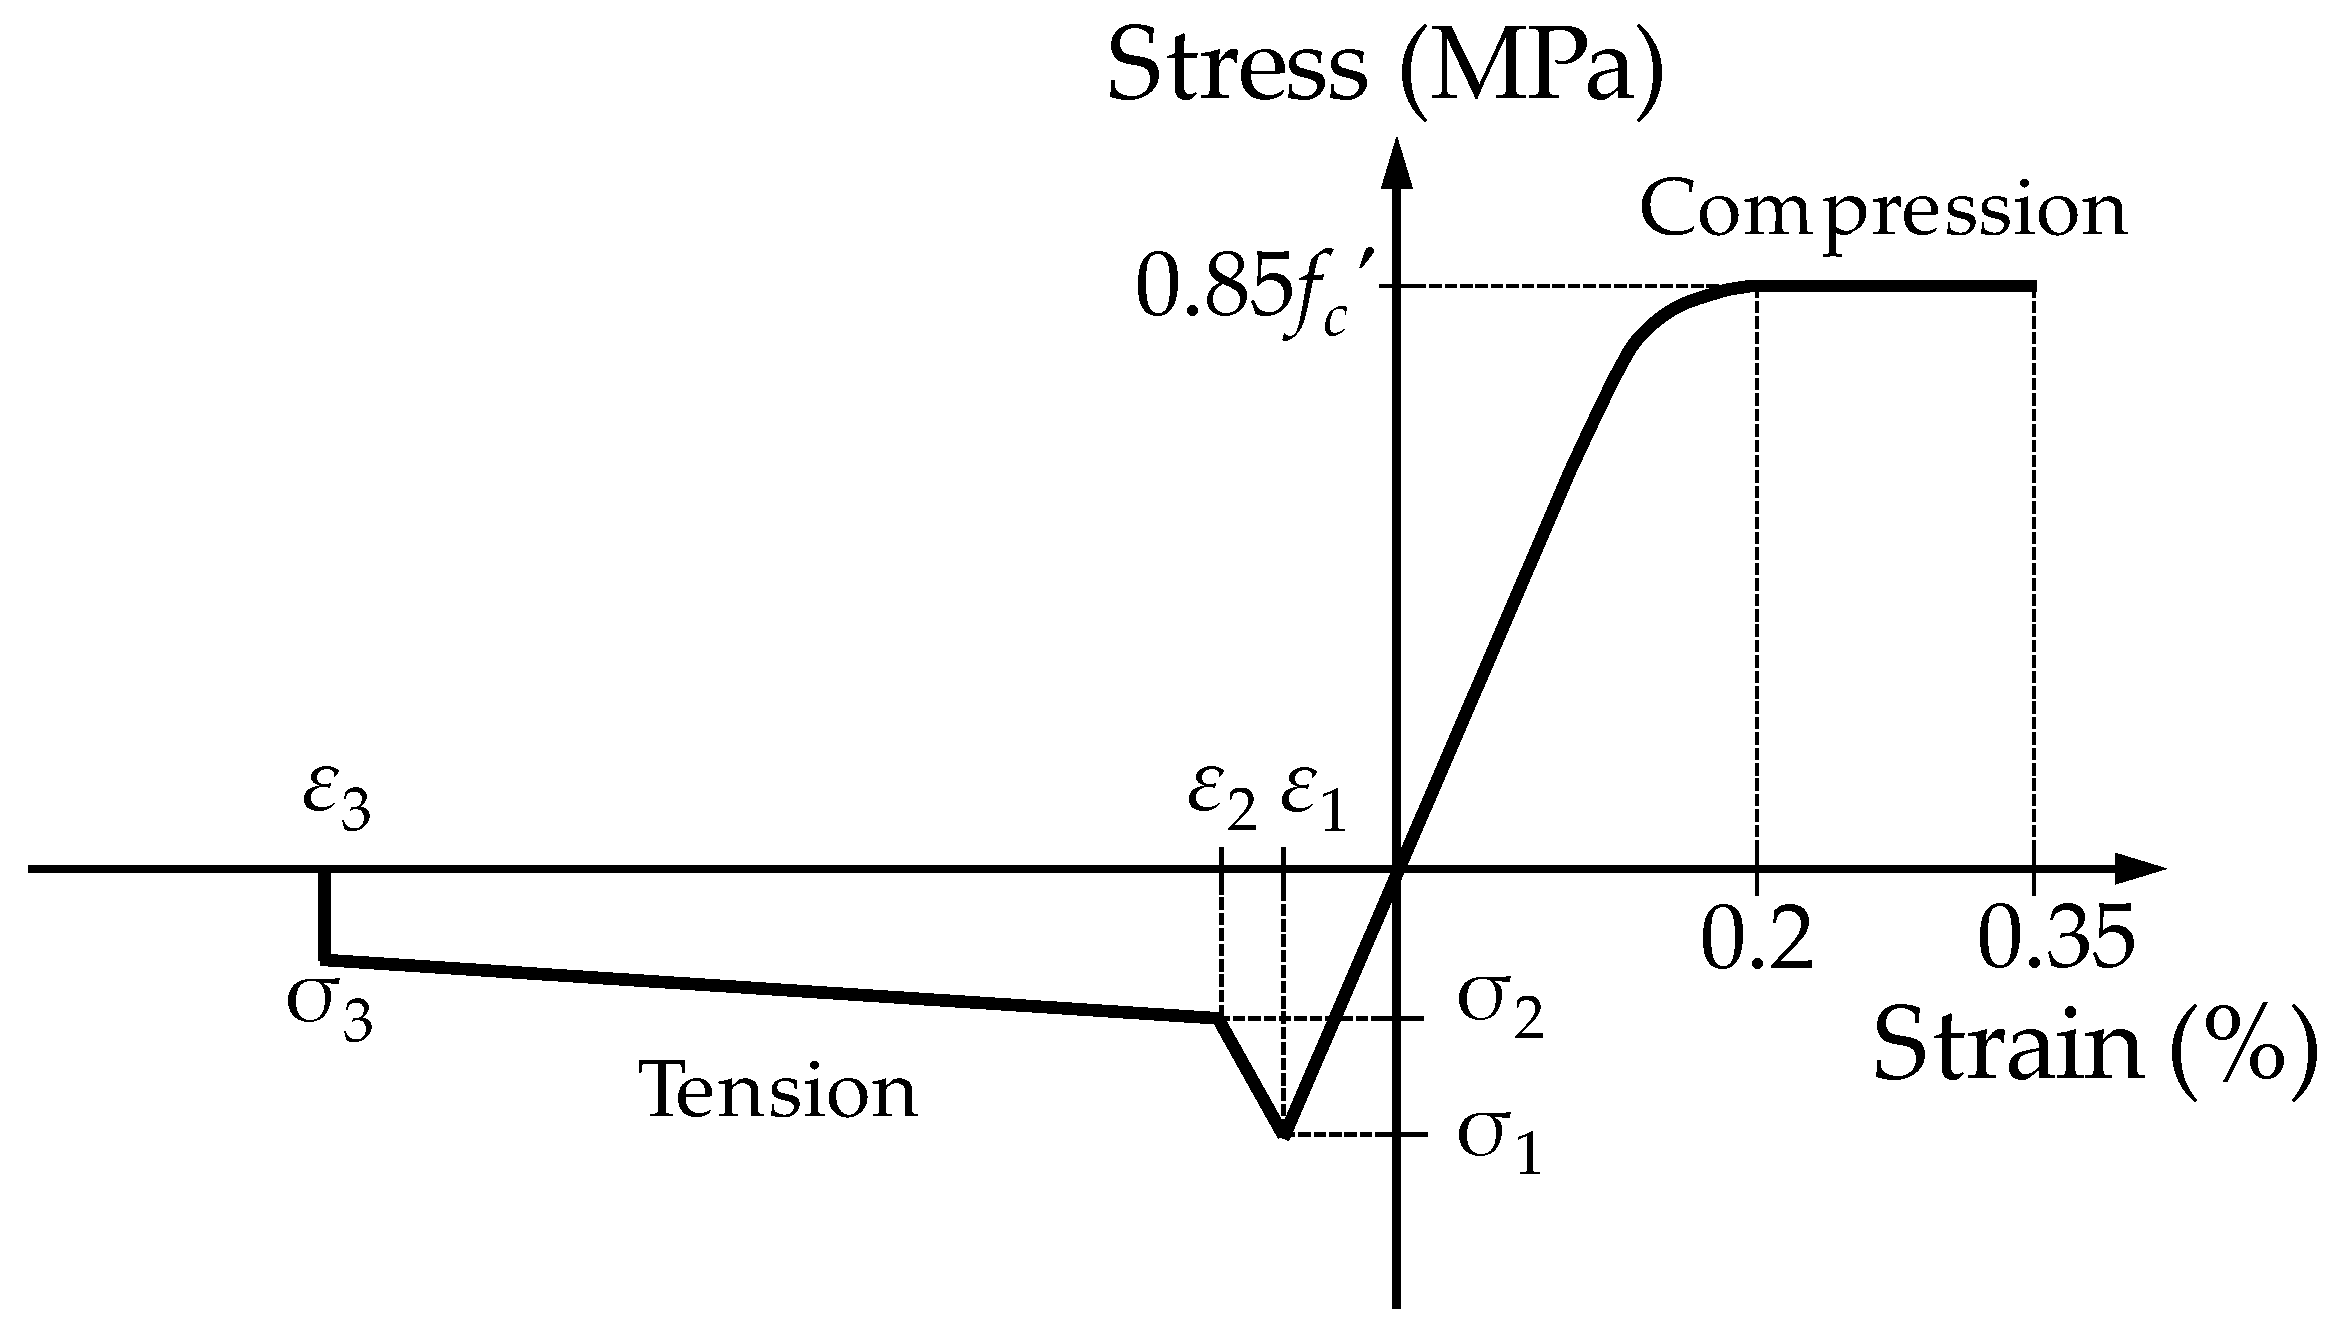
5.1. Suggestion of Compressive and Tensile Stress Blocks

To predict the flexural behavior of plain concrete and SFRC pedestrian decks, a sectional analysis was conducted because this method can adopt actual compressive and tensile stress blocks based on RILEM TC 162-TDF recommendation [15]. Although several compressive stress-strain models were suggested for SFRCs and well summarized by Aslani and Natoori [33], we simply adopted a parabolic compressive stress–strain model for both plain concrete and SFRC, as recommended by the RILEM TC 162-TDF: the compressive stress parabolically increases with strains of up to 85% of the compressive strength and then it is assumed to be maintained up to a strain value of 0.0035 (Figure 12). This is caused by the fact that the parabolic model can be simply adopted, and it is a minor factor influencing the accuracy of section analysis for reinforced SFRC decks. In contrast, the tensile stress–strain model is different for the plain concrete and SFRC. It is assumed that there is no contribution of plain concrete beyond its tensile strength (after cracking), whereas the tensile force at the crack surface can be resisted by steel fibers up to a strain value of 0.025 for the case of SFRC. The characteristic parameters of the tensile stress–strain model for SFRC shown in Figure 12 are obtained from three-point bending test results of notched beams and formulae suggested by the RILEM recommendation [15]. Before reaching the tensile strength (σ1), SFRC is assumed to exhibit a linear elastic behavior (σ = Ecε), and its elastic modulus (Ec) is calculated based on the following equation given by Lee et al. [34]: E c = ( 367 v f l f d f + 5520 ) f c 0.41 , where σ is the tensile stress, ε is the tensile strain, vf is the fiber volume fraction, lf is the fiber length, and df is the fiber diameter. The tensile strength (σ1) and strain capacity (ε1) is also calculated by σ 1 = 0.7 f f t ( 1.6 d ) and ε 1 = σ 1 / E c , where fft is the flexural strength and d is the effective depth.
After the tensile strength, a bilinear softening curve was obtained until the ultimate strain value of 0.025. The characteristic tensile stresses and strains in the softening zone (σ2, σ3, ε2, and ε3), as shown in Figure 12, can be calculated based on the following equation:
σ 2 = 0.45 f e q , 2 k h
σ 3 = 0.37 f e q , 3 k h
ε 2 = ε 1 + 0.0001
ε 3 = 0.025
where feq,2 and feq,3 are equivalent strength parameters and k h = 1.0 0.6 h 12.5 47.5 | 12.5 h 60 | (in cm).
The equivalent strength parameters are calculated based on the three-point bending test and RILEM recommendation [15] as follows:
f e q , 2 = 3 2 D B Z , 2 f 0.5 L b ( h a 0 ) 2
f e q , 3 = 3 2 D B Z , 3 f 2.5 L b ( h a 0 ) 2
where DfBZ,2 and DfBZ,3 are the energy absorption capacities up to the deflections of δ2 and δ3, respectively (δ2 = δL + 0.65 mm, δ3 = δL + 2.65 mm), δL is the deflection corresponding to the flexural strength at the LOP (fL), L is the clear span length, b is the beam width, h is the beam height, and a0 is the notch depth.
In order to calculate the energy absorption capacities by the fibers only, the energy absorbed by matrix (DbBZ) was neglected from the values of DfBZ,2 and DfBZ,3 based on the values of fL and δL + 0.3 mm [5]. Therefore, the equivalent strength parameters and the characteristic tensile stresses in the softening zone are purely based on the fiber bridging capability of steel fibers. From these calculation processes, the complete tensile stress–strain model is obtained, and consequently, the total material model of SFRC for the sectional analysis could be obtained, as shown in Figure 12.

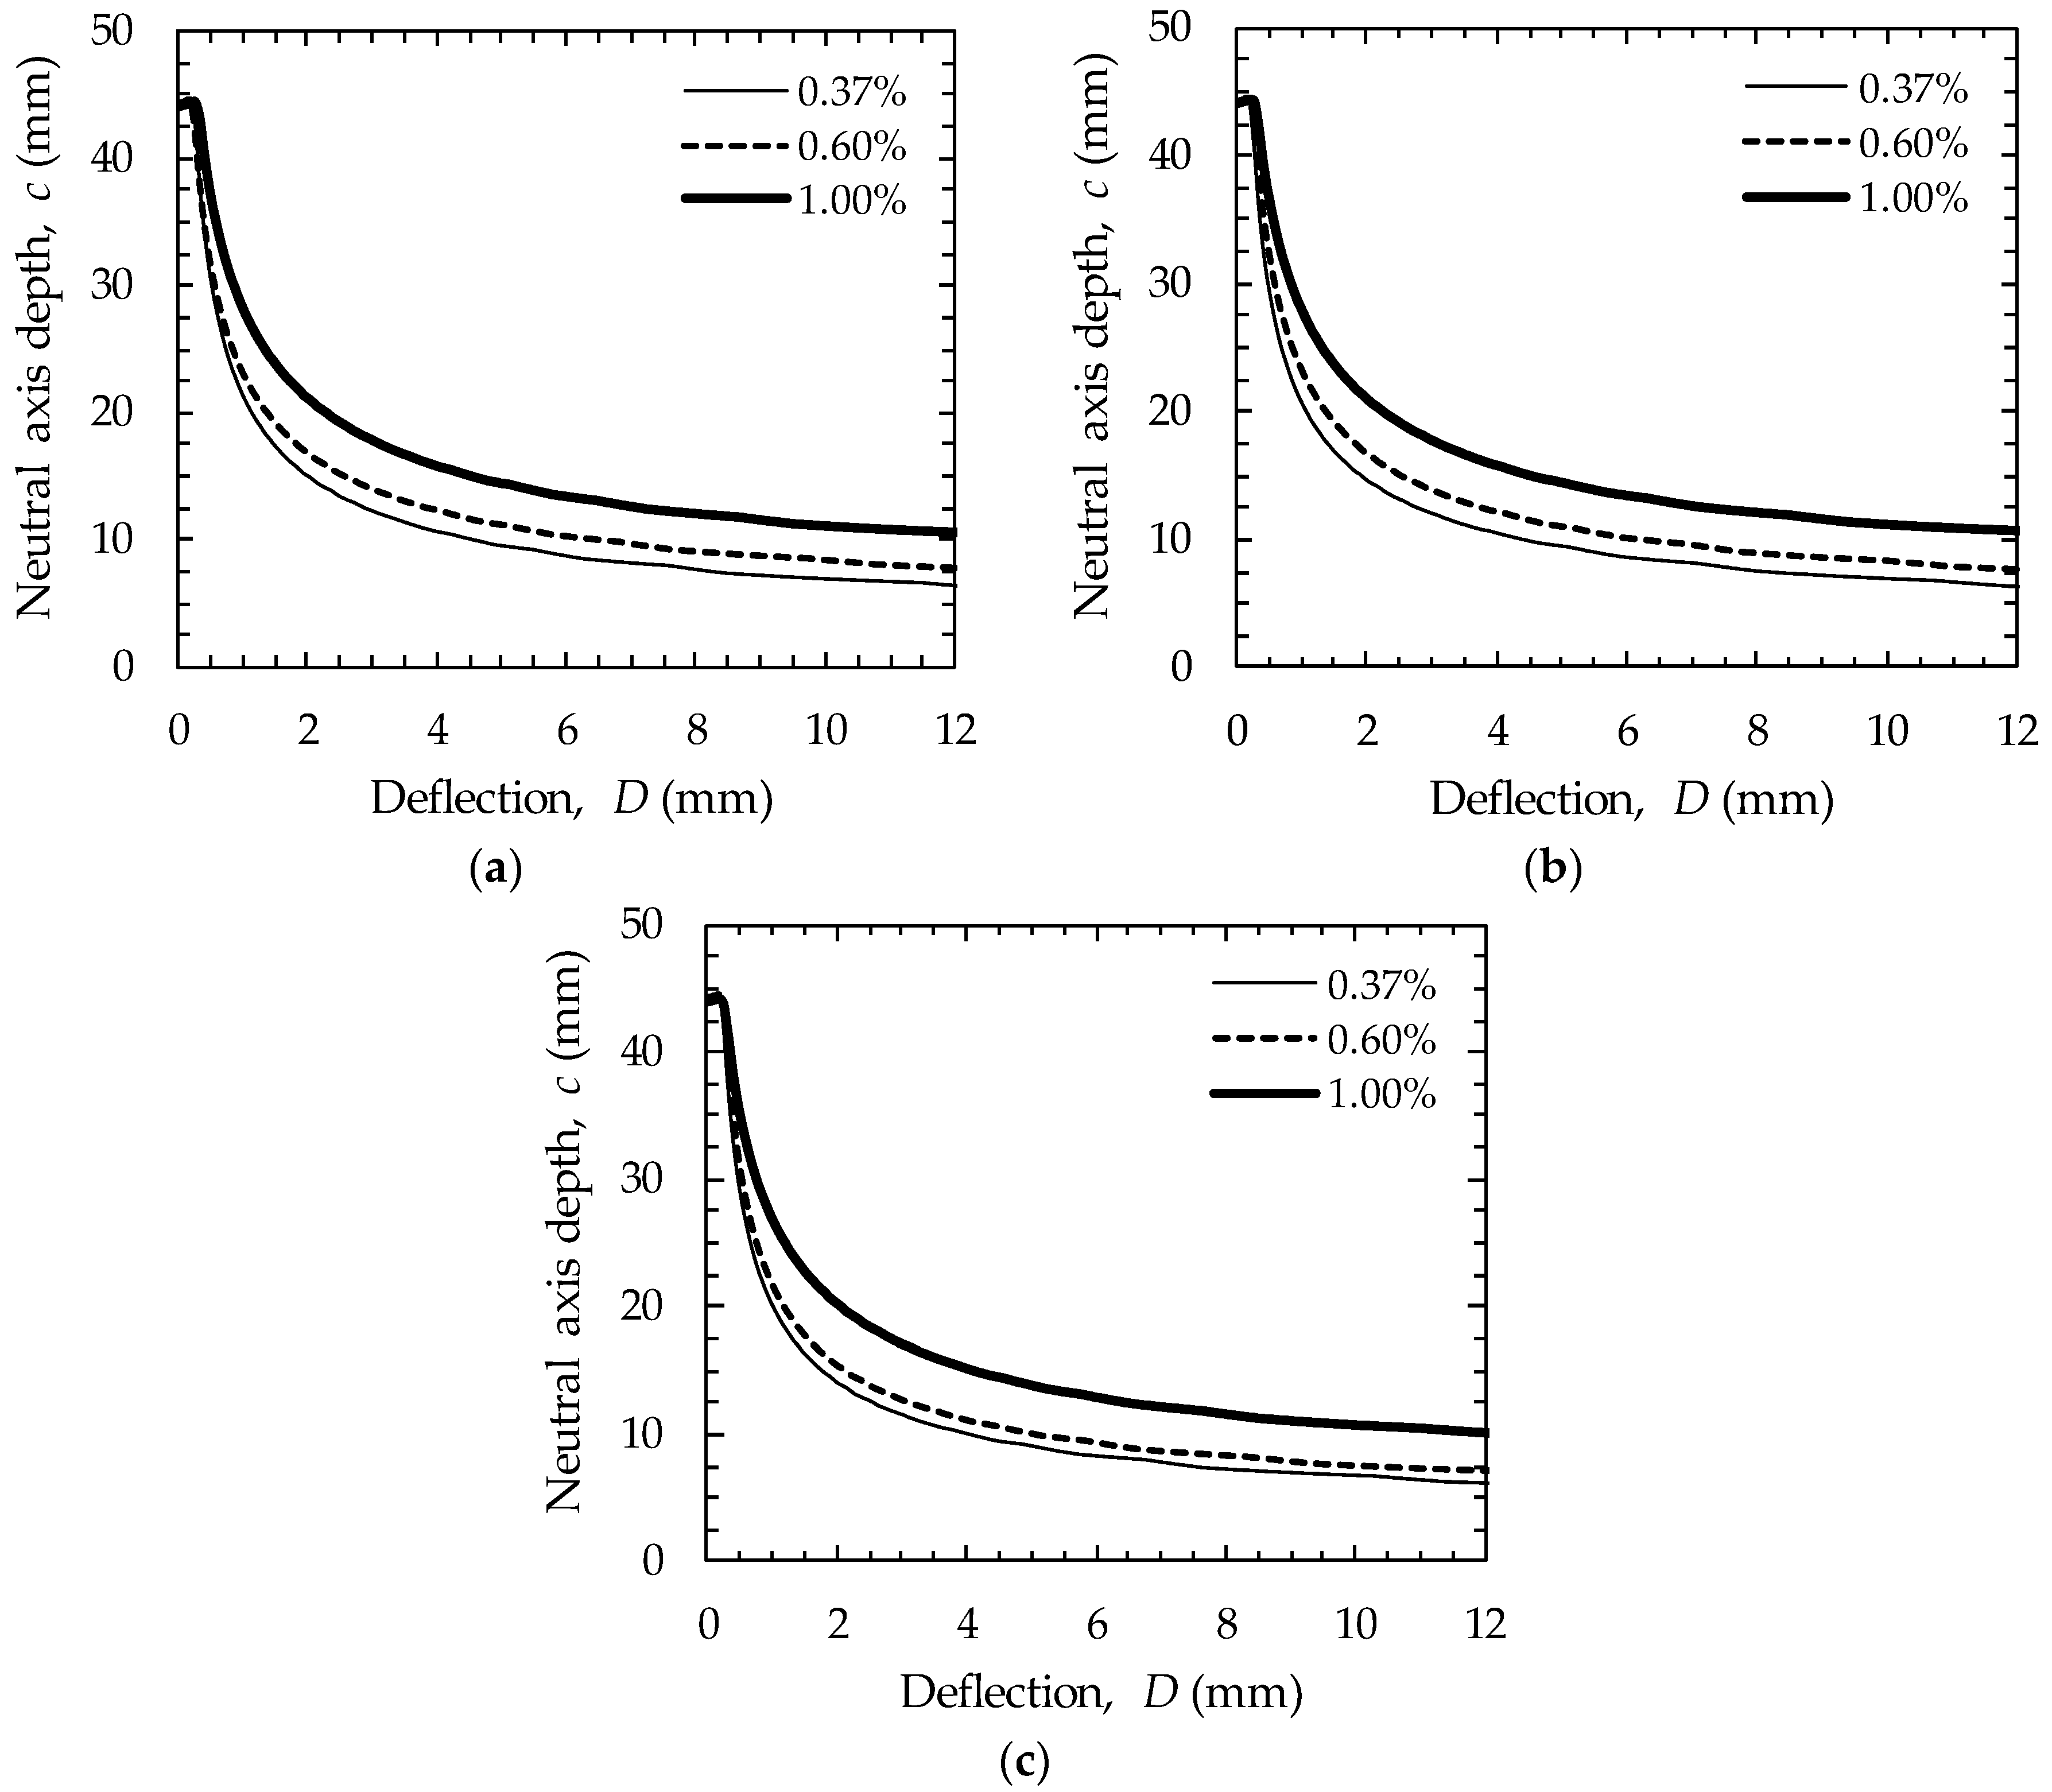
5.2. Procedure for Sectional Analysis

The cross-section of the pedestrian deck was first divided into 50 layers with 2 mm thickness. Then, an initial curvature (ϕ) and neutral axis depth (c) were assumed, and compressive and tensile stresses at each layer were determined from an assumption that the plane section remains plane using the material models given above. Based on a force equilibrium condition, we checked if the assumed neutral axis depth is correct, and this calculation process was iteratively repeated until it satisfied the force equilibrium. After that, the moment capacity (M) of the section was calculated at the given assumed curvature, and these calculation processes were continued by increasing the curvature until the zero neutral axis depth. A similar procedure and algorithm for this sectional analysis is found elsewhere [30]. To directly compare the flexural behaviors of the pedestrian decks obtained from the experiments and numerical simulations, the calculated moment and curvature were changed to the load and deflection based on the following equations:
P = 4 M L
δ = ϕ L 2 12
where P is the flexural load, M is the moment, L is the clear span length, δ is the midspan deflection, and ϕ is the curvature.

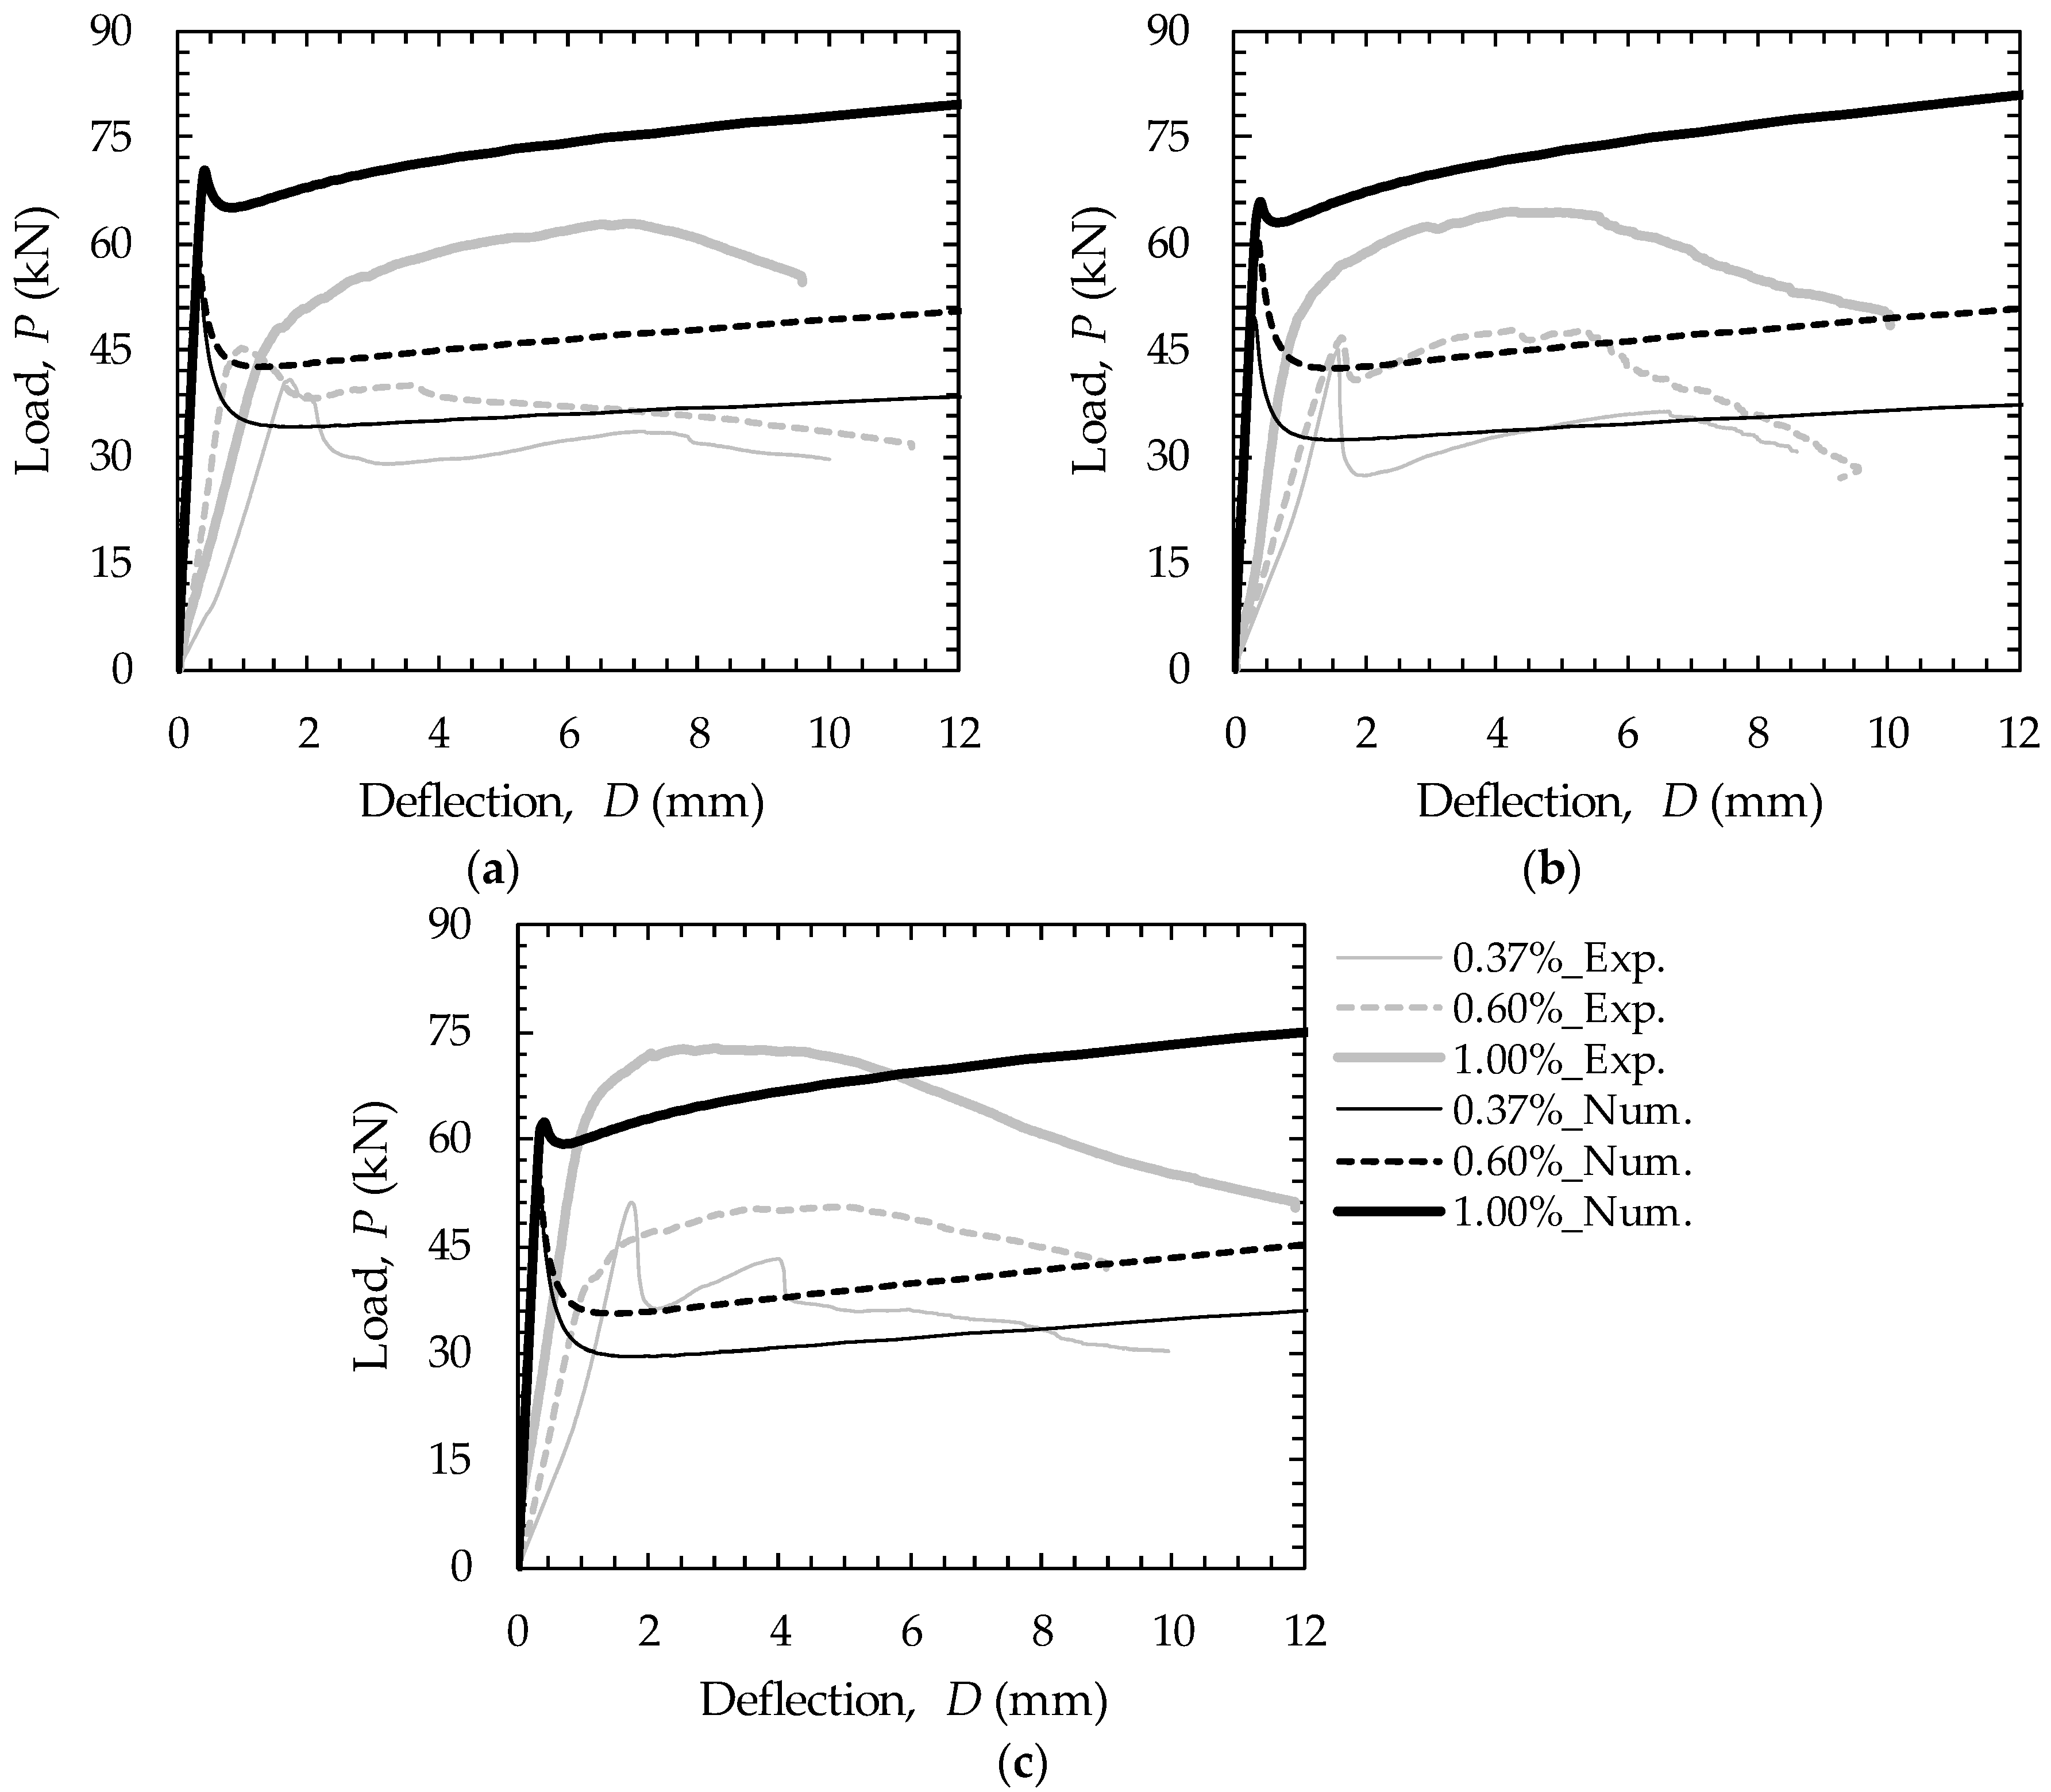
5.3. Comparison of Experimental and Numerical Results

Figure 13 shows the comparative flexural load versus deflection curves of all tested specimens from both the experiments and numerical simulations. In general, the numerical results overestimated the flexural strengths of SFRC pedestrian decks, and the difference between the experimental and numerical results increased with increasing fiber volume contents. The 3D hooked-end fiber specimens resulted in the lowest accuracy, whereas the 5D hooked-end fiber specimens provided the highest one. The flexural strength ratios of the experiment and simulation were found to be approximately 0.75, 0.81, and 0.93 for the 3D, 4D, and 5D hooked-end fiber specimens, respectively. The possible reason for increasing the inaccuracy of numerical results at higher volume contents of fibers is the poorer fiber dispersion and orientation. When we increased the amount of steel fibers, the slump flow values were generally reduced, deteriorating the workability. Furthermore, fiber balls are more easily formed and fiber alignment is easily disturbed at higher fiber volume fractions. Because the pedestrian deck has a much greater width of 1000 mm than the notched beam with 150 mm width, such deteriorated fiber dispersion and orientation characteristics became more obvious, causing the increased inaccuracy of numerical results. The RILEM recommends to take into account the size effect using a section depth, d, in the equation for tensile strength. However, it was insufficient to precisely consider the poorer fiber dispersion and orientation in a larger specimen since they were affected by numerous parameters, such as casting method, viscosity of cement matrix, type and amount of aggregate, etc. The differences between the numerical and experimental results increase with increasing the fiber volume fraction, meaning that the higher amount of fibers is more affected by the parameters. Therefore, a further study is required to take into account the deteriorated fiber dispersion and orientation by increasing the specimen size more accurately.
Based on the sectional analysis results, the SFRC decks with 0.6% or lower fiber volume fraction exhibited the deflection-softening behavior, whereas that with 1.0% volume fraction provided the deflection-hardening behavior. These observations were very similar to the experimental results that the specimens with vf of 0.37% and 1.0% provided the deflection-softening and deflection-hardening behaviors, respectively, and that with vf of 0.6% showed a vague deflection-hardening or deflection-softening behavior.
As shown in Figure 14, by increasing the amount of steel fibers, higher neutral axis depths were obtained at identical deflections regardless of the fiber type. This is because a higher number of steel fibers can more effectively limit the propagation of flexural cracks into the compressive zone. Moreover, because a greater area of tensile stress block was obtained with higher fiber volume contents, the area of compressive stress block needs to be increased based on the force equilibrium. Similar observations were also reported by a previous study [6] for SFRC beams. Thus, it is noted that increasing the amount of hooked-end steel fibers can effectively limit the deep propagation of flexural cracks into the compressive zone.

6. Conclusions

This study examined the effects of hooked-end steel fiber geometry and volume content on the flexural behavior of concrete pedestrian decks. For this, three different geometries, i.e., 3D, 4D, and 5D hooked ends, and three different volume fractions of 0.37%, 0.6%, and 1.0% were considered. In order to simulate their flexural behaviors, sectional analyses considering the material models recommended by RILEM [15] were conducted. Based on the experimental and numerical results, the following conclusions can be drawn:
(1)
For the high-strength concrete with a compressive strength of approximately 50 MPa, all the uniaxial beams with a low fiber volume fraction of 0.37% showed a deflection-softening behavior, whereas others with a higher volume fraction of 0.6% or 1.0% exhibited a deflection-hardening behavior. Regardless of the steel fiber type, the flexural performance of SFRC was improved by increasing the amounts of fibers.
(2)
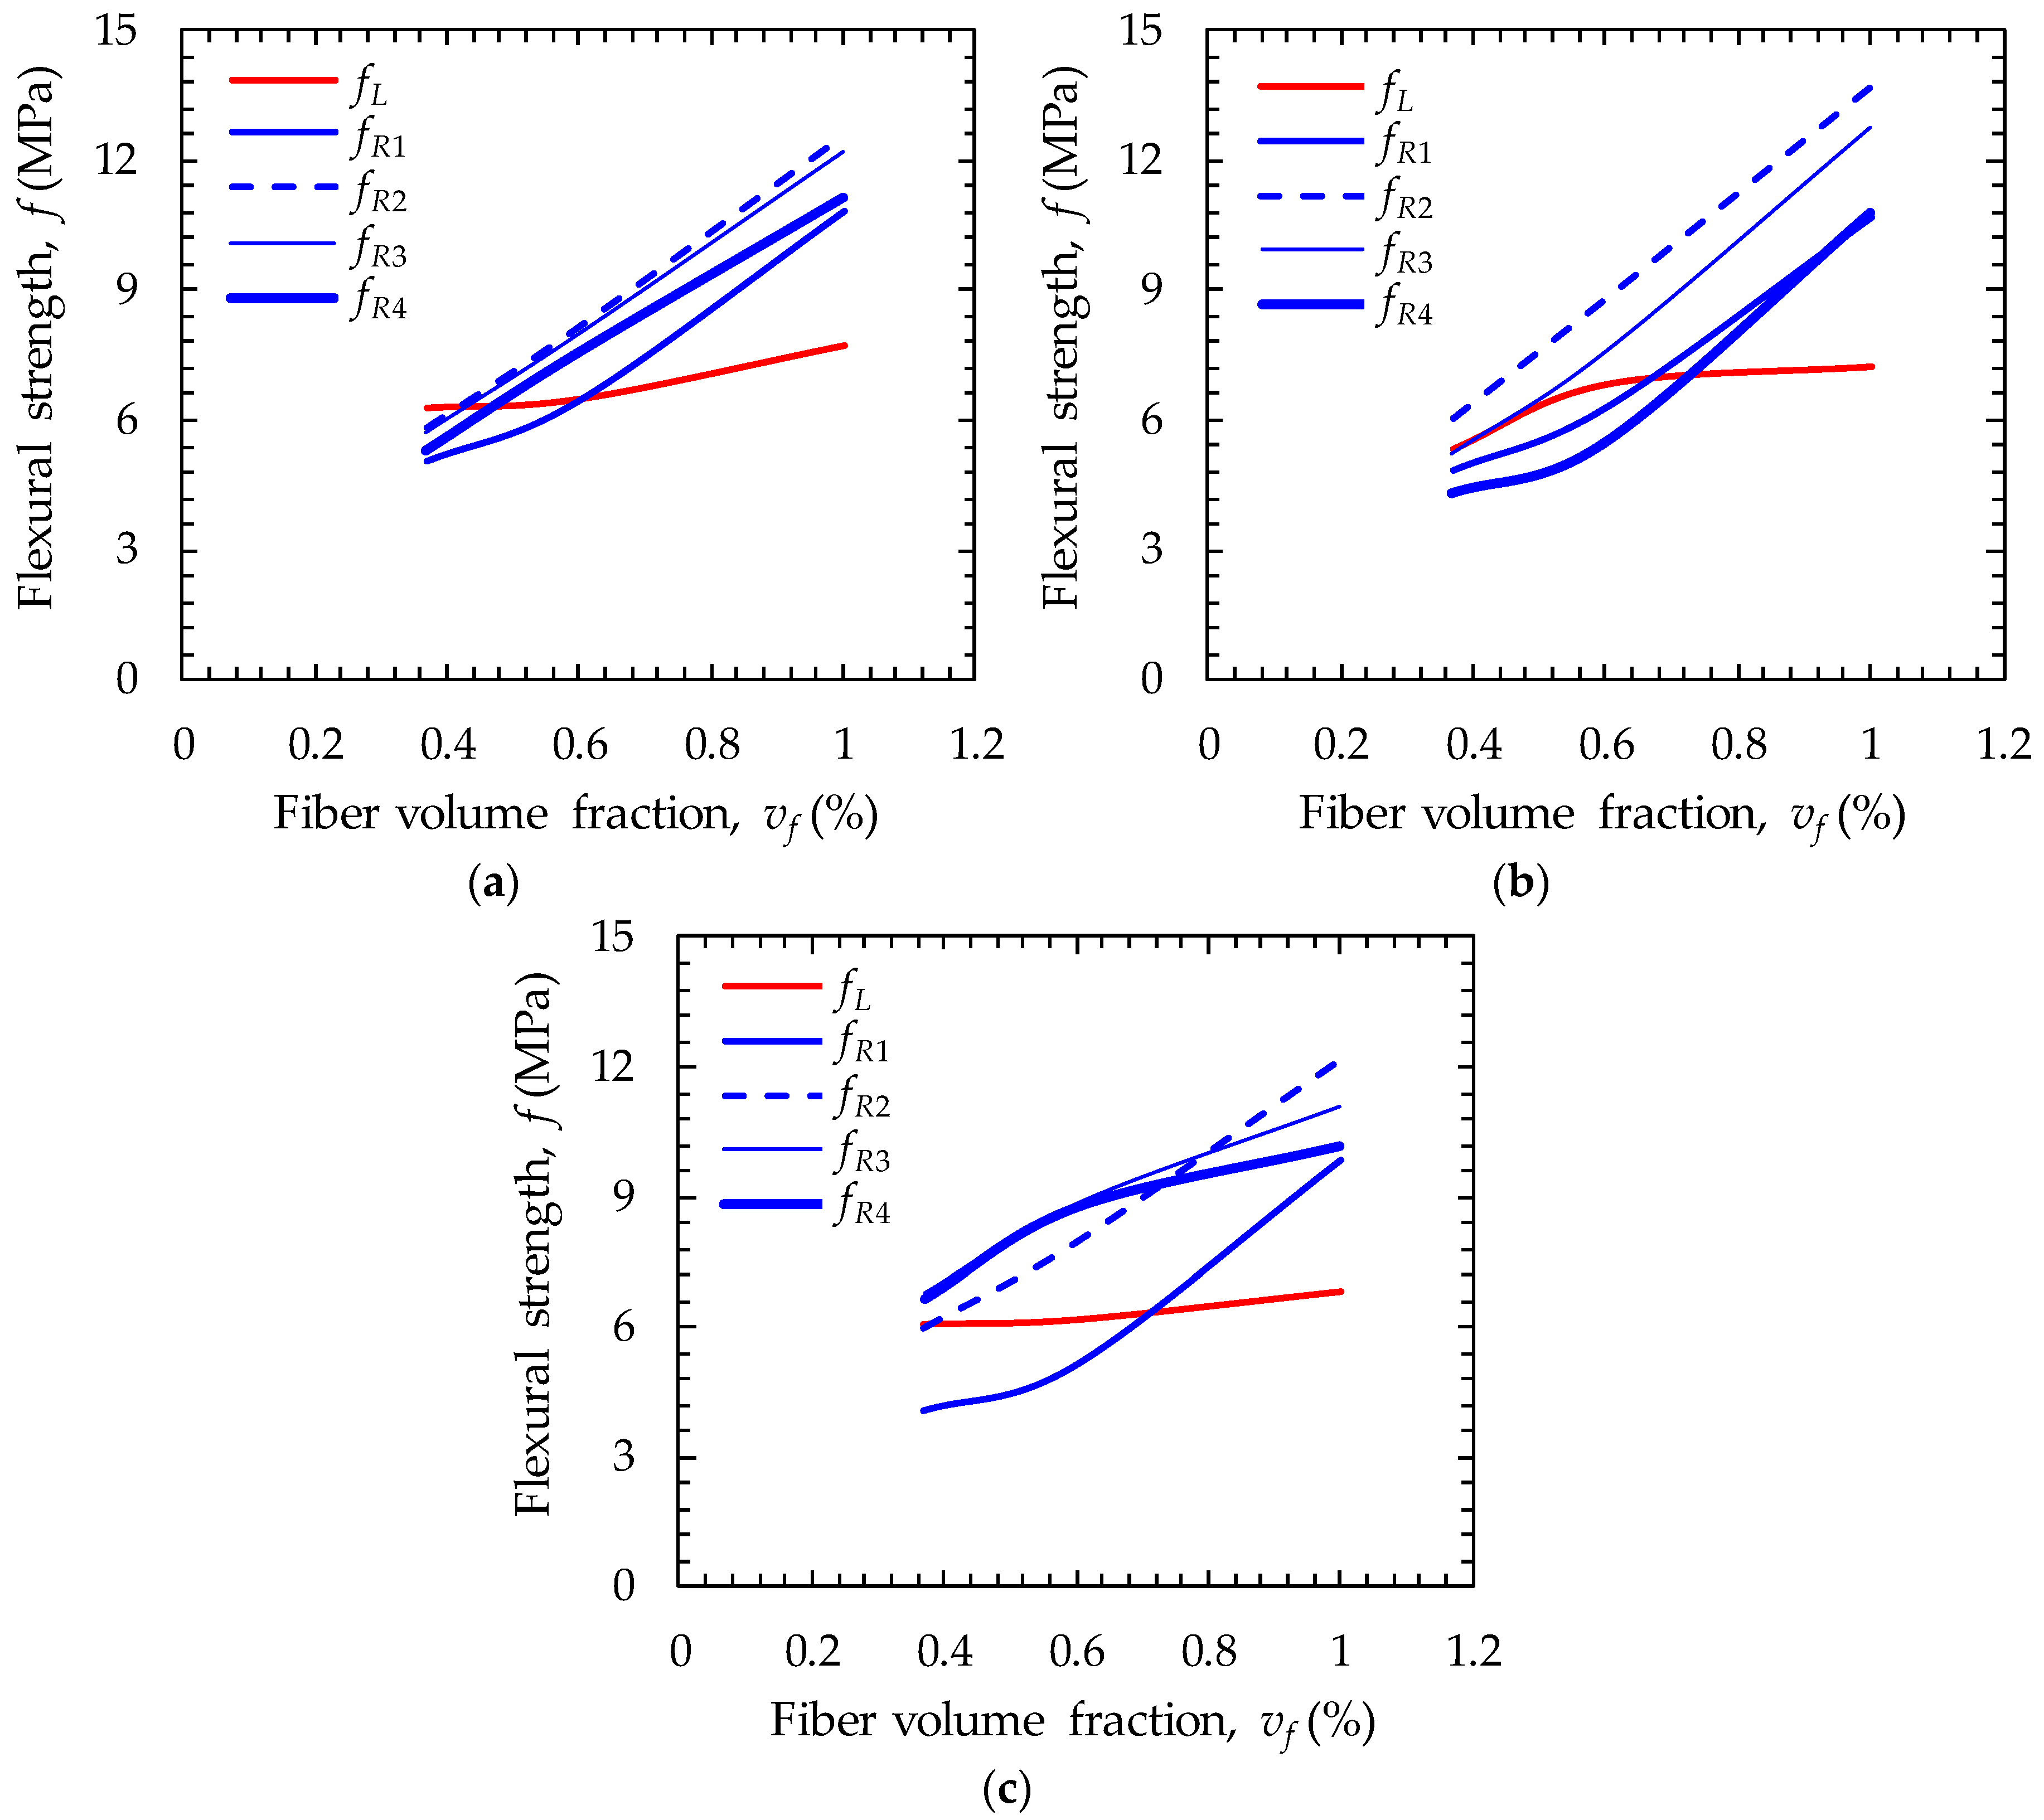
Increasing the number of hook ends in hooked-end steel fibers can effectively increase the flexural strength and induce ductile flexural behavior of SFRC beams. Therefore, the specimens with 5D hooked-end steel fibers resulted in the greatest flexural strengths and flexural strength margins (= fMOR/fLOP − 1) at all volume fractions, followed by the 4D and 3D hooked-end fibers.
(3)
To guarantee a ductile flexural behavior and replace the minimum longitudinal steel rebars of concrete pedestrian decks based on ACI 318 code, 0.6% of 4D and 5D hooked-end fibers and 1.0% of 3D hooked-end fibers were required to be incorporated. Furthermore, in order to satisfy the DI value of 0.39 for the minimum reinforcement ratio given by Fantilli et al. [1], the required amount of all the hooked-end fibers (i.e., 3D, 4D, and 5D) was approximately 0.98%‒1.10%.
(4)
Regardless of the number of hook ends, a multiple cracking behavior was observed only when the fiber volume fraction is 1.0%.
(5)
The flexural strength ratios of experiments and simulations, based on RILEM recommendation [15] and sectional analyses, were found to be 0.75, 0.81, and 0.93 on average for the 3D, 4D, and 5D hooked-end fiber specimens, respectively. The numerical results indicated that to guarantee a deflection-hardening response of pedestrian decks, the fiber volume fraction needs to be 1.0%, regardless of the steel fiber type.
(6)
Consequently, a volume fraction of 1.0% of hooked-end steel fibers is recommended to replace the minimum longitudinal steel rebars and guarantee a ductile flexural behavior with multiple cracks for concrete pedestrian decks.

Author Contributions

Conceptualization, D.-Y.M.; methodology, D.-Y.M. and S.-J.L.; software, D.-Y.Y.; validation, D.-Y.M. and D.-Y.Y.; formal analysis, D.-Y.Y.; investigation, D.-Y.Y.; resources, D.-Y.M.; data curation, D.-Y.M.; writing—original draft preparation, D.-Y.Y.; writing—review and editing, S.-J.L.; visualization, D.-Y.Y.; supervision, D.-Y.Y.; project administration, D.-Y.M.; funding acquisition, D.-Y.M.

Funding

This research was supported by a grant (18CTAP-C117247-03) from Technology Advancement Research Program funded by Ministry of Land, Infrastructure and Transport of Korean government.

Conflicts of Interest

The authors declare no conflict of interest.

References

  1. Fantilli, A.P.; Cavallo, A.D.; Pistone, G. Fiber-reinforced lightweight concrete slabs for the maintenance of the Soleri Viaduct. Eng. Struct. 2015, 99, 184–191. [Google Scholar] [CrossRef]
  2. Chiaia, B.; Fantilli, A.P.; Vallini, P. Evaluation of minimum reinforcement ratio in FRC members and application to tunnel linings. Mater. Struct. 2007, 40, 593–604. [Google Scholar] [CrossRef]
  3. ACI Committee 318. Building Code Requirements for Structural Concrete (ACI 318-14) and Commentary (318R-14); American Concrete Institute: Farmington Hills, MI, USA, 2014. [Google Scholar]
  4. Eurocode 2. Eurocode 2: Design of Concrete Structures—Part 1: General Rules and Rules for Buildings; EN 1992-1-1; European Committee for Standardization: Brussels, Belgium, 2004. [Google Scholar]
  5. Barros, J.A.; Cunha, V.M.; Ribeiro, A.F.; Antunes, J.A.B. Post-cracking behaviour of steel fibre reinforced concrete. Mater. Struct. 2005, 38, 47–56. [Google Scholar] [CrossRef]
  6. Yoo, D.Y.; Yoon, Y.S.; Banthia, N. Predicting the post-cracking behavior of normal-and high-strength steel-fiber-reinforced concrete beams. Constr. Build. Mater. 2015, 93, 477–485. [Google Scholar] [CrossRef]
  7. Bindiganavile, V.; Banthia, N. Polymer and steel fiber-reinforced cementitious composites under impact loading—Part 2: Flexural toughness. ACI Mater. J. 2001, 98, 17–24. [Google Scholar]
  8. Banthia, N.; Trottier, J.F. Concrete reinforced with deformed steel fibers—Part II: Toughness characterization. ACI Mater. J. 1995, 92, 146–154. [Google Scholar]
  9. Aslani, F.; Samali, B. Flexural toughness characteristics of self-compacting concrete incorporating steel and polypropylene fibres. Aust. J. Struct. Eng. 2014, 15, 269–286. [Google Scholar] [CrossRef]
  10. Abdallah, S.; Fan, M. Anchorage mechanisms of novel geometrical hooked-end steel fibres. Mater. Struct. 2017, 50, 139. [Google Scholar] [CrossRef]
  11. Abdallah, S.; Rees, D.W.; Ghaffar, S.H.; Fan, M. Understanding the effects of hooked-end steel fibre geometry on the uniaxial tensile behaviour of self-compacting concrete. Constr. Build. Mater. 2018, 178, 484–494. [Google Scholar] [CrossRef]
  12. Venkateshwaran, A.; Tan, K.H.; Li, Y. Residual flexural strengths of steel fiber reinforced concrete with multiple hooked-end fibers. Struct. Concr. 2018, 19, 352–365. [Google Scholar] [CrossRef]
  13. Abdallah, S.; Fan, M.; Rees, D.W. Analysis and modelling of mechanical anchorage of 4D/5D hooked end steel fibres. Mater. Des. 2016, 112, 539–552. [Google Scholar] [CrossRef]
  14. Venkateshwaran, A.; Tan, K.H. Load-carrying capacity of steel fiber reinforced concrete beams at large deflections. Struct. Concr. 2018, 19, 670–683. [Google Scholar] [CrossRef]
  15. RILEM TC162-TDF. Test and design methods for steel fibre reinforced concrete: Bending test. Mater. Struct. 2000, 33, 75–81. [Google Scholar]
  16. Carpinteri, A.; Cadamuro, E.; Corrado, M. Minimum flexural reinforcement in rectangular and T-section concrete beams. Struct. Concr. 2014, 15, 361–372. [Google Scholar] [CrossRef]
  17. ASTM C1611/C1611M–14. Standard Test Method for Slump Flow of Self-Consolidating Concrete; ASTM International: West Conshohocken, PA, USA, 2014; pp. 1–6. [Google Scholar]
  18. Yoo, D.Y.; Kim, S.; Park, G.J.; Park, J.J.; Kim, S.W. Effects of fiber shape, aspect ratio, and volume fraction on flexural behavior of ultra-high-performance fiber-reinforced cement composites. Compos. Struct. 2017, 174, 375–388. [Google Scholar] [CrossRef]
  19. BS EN 14651:2005. Test Method for Metallic Fibered Concrete—Measuring the Flexural Tensile Strength (Limit of Proportionality [LOP], Residual); British Standards Institution: London, UK, 2005; 17p. [Google Scholar]
  20. ASTM C39/C39M. Standard Test Method for Compressive Strength of Cylindrical Concrete Specimens; ASTM International: West Conshohocken, PA, USA, 2014; pp. 1–7. [Google Scholar]
  21. Yoo, D.Y.; Kang, S.T.; Yoon, Y.S. Effect of fiber length and placement method on flexural behavior, tension-softening curve, and fiber distribution characteristics of UHPFRC. Constr. Build. Mater. 2014, 64, 67–81. [Google Scholar] [CrossRef]
  22. Hsu, L.S.; Hsu, C.T.T. Stress–strain behavior of steel-fiber high-strength concrete under compression. ACI Struct. J. 1994, 91, 448–457. [Google Scholar]
  23. Banthia, N.; Gupta, R. Hybrid fiber reinforced concrete (HyFRC): Fiber synergy in high strength matrices. Mater. Struct. 2004, 37, 707–716. [Google Scholar] [CrossRef]
  24. Banthia, N.; Nandakumar, N. Crack growth resistance of hybrid fiber reinforced cement composites. Cem. Concr. Compos. 2003, 25, 3–9. [Google Scholar] [CrossRef]
  25. Yoo, D.Y.; Kang, S.T.; Banthia, N.; Yoon, Y.S. Nonlinear finite element analysis of ultra-high-performance fiber-reinforced concrete beams. Int. J. Damage Mech. 2017, 26, 735–757. [Google Scholar] [CrossRef]
  26. di Prisco, M.; Colombo, M.; Dozio, D. Fibre-reinforced concrete in fib Model Code 2010: Principles, models and test validation. Struct. Concr. 2013, 14, 342–361. [Google Scholar] [CrossRef]
  27. Fédération Internationale du Béton. fib Model Code for Concrete Structures 2010; Ernst & Sohn: Lausanne, Switzerland, 2013. [Google Scholar]
  28. Banthia, N.; Sappakittipakorn, M. Toughness enhancement in steel fiber reinforced concrete through fiber hybridization. Cem. Concr. Res. 2007, 37, 1366–1372. [Google Scholar] [CrossRef]
  29. Shin, S.W.; Ghosh, S.K.; Moreno, J. Flexural ductility of ultra-high-strength concrete members. ACI Struct. J. 1989, 86, 394–400. [Google Scholar]
  30. Yoo, D.Y.; Yuan, T.; Yang, J.M.; Yoon, Y.S. Feasibility of replacing minimum shear reinforcement with steel fibers for sustainable high-strength concrete beams. Eng. Struct. 2017, 147, 207–222. [Google Scholar] [CrossRef]
  31. Kim, J.; Kim, D.J.; Park, S.H.; Zi, G. Investigating the flexural resistance of fiber reinforced cementitious composites under biaxial condition. Compos. Struct. 2015, 122, 198–208. [Google Scholar] [CrossRef]
  32. Yoo, D.Y.; Banthia, N.; Kang, S.T.; Yoon, Y.S. Size effect in ultra-high-performance concrete beams. Eng. Fract. Mech. 2016, 157, 86–106. [Google Scholar] [CrossRef]
  33. Aslani, F.; Natoori, M. Stress-strain relationships for steel fibre reinforced self-compacting concrete. Struct. Eng. Mech. 2013, 46, 295–322. [Google Scholar] [CrossRef]
  34. Lee, S.C.; Oh, J.H.; Cho, J.Y. Compressive behavior of fiber-reinforced concrete with end-hooked steel fibers. Materials 2015, 8, 1442–1458. [Google Scholar] [CrossRef]
Figure 1. Pictures on (a) 3D hooked fiber, (b) 4D hooked fiber, and (c) 5D hooked fiber.
Applsci 09 01241 g001
Figure 2. Slump flow test results (3D hooked fiber case): (a) vf of 0.37%, (b) vf of 0.6%, and (c) vf of 1.0%.
Applsci 09 01241 g002
Figure 3. Test setup for SFRC pedestrian deck: (a) picture, (b) schematic description.
Applsci 09 01241 g003aApplsci 09 01241 g003b
Figure 4. Summary of compressive strengths.
Applsci 09 01241 g004
Figure 5. Summary of three-point flexural test results: (a) vf of 0.37%, (b) vf of 0.60%, and (c) vf of 1.00%.
Applsci 09 01241 g005
Figure 6. Relationship between flexural strength and fiber volume fraction: (a) 3D fiber, (b) 4D fiber, (c) 5D fiber.
Applsci 09 01241 g006
Figure 7. Summary of flexural load versus mid-span deflection curves: (a) vf of 0.37%, (b) vf of 0.60%, and (c) vf of 1.00%.
Applsci 09 01241 g007
Figure 8. Summary of (a) cracking load and (b) peak load.
Applsci 09 01241 g008
Figure 9. Effects of hooked steel fiber geometry and volume fraction on cracking load and peak load ratio.
Applsci 09 01241 g009
Figure 10. Summary of (a) load ductility index and (b) deflection ductility index.
Applsci 09 01241 g010
Figure 11. Cracking patterns and failure mode.
Applsci 09 01241 g011
Figure 12. Material model for sectional analysis.
Applsci 09 01241 g012
Figure 13. Comparative load versus deflection responses: (a) 3D fiber, (b) 4D fiber, (c) 5D fiber.
Applsci 09 01241 g013
Figure 14. Calculated neutral axis depth and deflection relationships: (a) 3D fiber, (b) 4D fiber, (c) 5D fiber.
Applsci 09 01241 g014
Table 1. Mixture proportions.
W/B
[%]
s/a
[%]
Gmax
[mm]
Unite Weight [kg/m3]AE Agent
[B × %]
Steel Fiber *
[%]
WaterCementSandGravelGGBFSFA
354825165282796859141471.00.37
0.60
1.00
[Note] W/B = water-to-binder ratio, s/a = ratio of amount of fine aggregate and total amount of aggregate, Gmax = maximum gravel size, GGBFS = ground granulated blast furnace slag, FA = fly ash, and AE agent = air-entraining agent. * Steel fiber contents are determined by volume fraction. AE agent is included by weight percentage of total binder.
Table 2. Summary of three-point bending test results as per EN 14651 standard [19].
Type of Hooked FiberStatistical
Parameter
vf
[%]
fL
[MPa]
fR,1
[MPa]
fR,2
[MPa]
fR,3
[MPa]
fR,4
[MPa]
fR1k
[MPa]
fR3k
[GPa]
fR3k/fR1kMaterial Class *
3DAvg.0.376.925.536.386.255.815.045.931.185d
St. dev.0.2010.2590.1850.1720.343----
Avg.0.607.026.377.846.497.313.352.660.793b
St. dev.0.2031.6002.3732.0252.000----
Avg.1.008.7312.0013.9213.3112.189.8612.431.269d
St. dev.0.4451.1291.0730.4620.212----
4DAvg.0.376.884.766.345.954.613.004.321.443e
St. dev.0.8100.9310.7160.8620.659----
Avg.0.607.436.238.757.495.562.803.331.192d
St. dev.0.8021.8122.7522.2001.574----
Avg.1.007.7211.2614.6613.5711.578.0211.121.398e
St. dev.0.6391.7121.1431.2921.381----
5DAvg.0.376.784.486.567.497.312.253.711.652e
St. dev.0.6941.1821.7991.9971.617----
Avg.0.606.855.628.739.749.613.576.161.733e
St. dev.0.6031.0841.6281.8921.732----
Avg.1.007.4410.4112.9712.0311.078.239.871.208d
St. dev.1.1501.1551.7401.1451.433----
[Note] vf = fiber volume fraction, fL = flexural strength corresponding to the highest value of the load recorded up to a CMOD of 0.05 mm, fR,j = residual flexural strengths corresponding to CMODj (j = 1, 2, 3, and 4), equal to 0.5, 1.5, 2.5, and 3.5 mm, respectively, fRjK = characteristic residual flexural strengths, calculated based on the following equation: fRjK = fR,j − 1.89σ, and σ = standard deviation. * Material class is determined by fib Model Code [27].

