Article

Analysis of Seven Biogenic Amines and Two Amino Acids in Wines Using Micellar Electrokinetic Chromatography

Department of Applied Science, National Taitung University, 95092 Taitung, Taiwan
*
Author to whom correspondence should be addressed.
Appl. Sci. 2019, 9(6), 1193; https://doi.org/10.3390/app9061193
Submission received: 31 December 2018 / Revised: 14 March 2019 / Accepted: 14 March 2019 / Published: 21 March 2019
(This article belongs to the Section Chemical and Molecular Sciences)

Abstract

:
A low-cost, simple, and fast method utilizing micellar electrokinetic chromatography for the simultaneous determination of seven biogenic amines and two amino acids was developed. A background electrolyte containing 5 mM phosphate buffer (pH 3.7) and 20 mM sodium dodecyl sulfate was used. The optimal separation of nine investigated analytes was achieved in 11 min, with limits of detection (S/N = 3) ranging from 0.11 to 0.61 µM. The linear ranges for all analytes were observed between 0.55 and 10.0 μM (R2 > 0.990). The developed approach was extended to the analysis of analytes in commercial wine and beer samples. The recoveries of the proposed method ranged from 98.8% to 115.6%.

Graphical Abstract

1. Introduction

Biogenic amines (BAs) are low-molecular-weight organic bases comprising an aliphatic (including methylamine, ethylamine, putrescine, and cadaverine), an aromatic (including 2-phenylethylamine and tyramine), or a heterocyclic (e.g., tryptamine and 5-hydrotryptoamine) structure, which exhibit important biological activities [1]. BAs are also classified as mono- or polyamines according to their amine content, which are mainly synthesized or degraded during cellular metabolism activities in animals, plants, and microorganisms. These reactions involve the conversion of amino acids to BAs after the removal of the carboxyl group using decarboxylase enzyme or the transamination of aldehydes and ketones using amino acid transaminases [2,3].
Meanwhile, the presence of BAs in food is crucial from the viewpoints of safety and quality, given their relation to toxic incidents. Various fermented, seasoned, or conserved foodstuffs (including cheese, wine, beer, and meat) may contain BAs, and their concentrations are reportedly considered as markers for freshness and hygiene during storage and food processing [4,5,6]. In addition, BAs are important compounds of bioorganic bodies and play important physiological roles. However, the excess intake of BAs can cause various symptoms, including headaches, heart palpitations, edema, hypotension, and nausea, among other symptoms [7]. BAs are not equally toxic, and histamine is the most toxic compound among the BAs. In addition, BAs have been reported to be precursor species during the formation of carcinogenic N-nitrous compounds [8].
Several methods have been developed for the quantitative analysis of BAs, including gas chromatography [9,10,11], liquid chromatography [12,13,14], and capillary electrophoresis (CE) [15,16,17,18] coupled with UV–Vis, fluorescence, and mass spectrometry. Gas chromatography and liquid chromatography are powerful methods, but they exhibit disadvantages, such as long analysis time, tedious sample pretreatment procedures, and consumption of large volume of organic solvents. Owing to the minimized consumption of sample and reagent, high speed and separation efficiency, CE is becoming an alternative analytical approach [19,20,21]. Different modes of CE, such as capillary zone electrophoresis [22,23,24], micellar electrokinetic chromatography (MEKC) [25,26], and capillary electrochromatography [27] have been employed to analyze BAs in various samples. Among these modes, MEKC with high separation efficiency has become a powerful technique for the separation of neutral and ionic compounds in complicated mixtures [28]. With the advantages of high separation efficiency and resolution and short analysis time, MEKC was chosen for the simultaneous determination of BAs. Sodium dodecyl sulfate (SDS) is a typical surfactant added to the background electrolytes at a concentration greater than its critical micellar concentration (CMC). The basic principle of MEKC is based on the differential partitioning of analytes between the pseudo-stationary micellar phase and the mobile aqueous phase.
In this study, a simple, cost-effective, and rapid method for the quantitative determination of nine analytes using MEKC is described. Several experimental parameters that affect the separation efficiency, including the concentration and pH of the phosphate buffer and SDS concentration, were investigated. The approach performance was evaluated in terms of its ability to obtain accurate and precise qualitative and quantitative data over a relevant concentration range. The approach was satisfactorily used to analyze BAs in wines.

2. Materials and Methods

2.1. Chemicals and Reagents

Nine analytes, i.e., dopamine hydrochloride (DA), tryptophan (Trp), epinephrine (E), norepinephrine (NE), 5-hydroxytryptophan (5-HTP), tyrosine (Tyr), tryptamine (T), tyramine (TA), 5-hydroxytryptamine hydrochloride (5-HT), and SDS, were purchased from Sigma-Aldrich (St. Louis, MO, USA). Sodium dihydrogen phosphate and sodium hydroxide were purchased from Riedel-de Haën (Seelze-Hannover, Germany). Phosphoric acid was purchased from J.T. Baker (Phillipsburg, NJ, USA). All aqueous solutions were prepared with 18 MΩ cm deionized water (Barnstead Nanopure Ultrafiltration unit, Boston, MA, USA). Stock solution (1.0 mL) of 10 mM of the analytes were prepared in deionized water individually and stored in the dark at 4 °C, while sample solution (1.0 µM for each analyte) was prepared daily by appropriate dilution of the stock solution of the standards in deionized water (1.0 mL).

2.2. Instrumentation

The CE equipment was a laboratory-made CE unit, similar to our previous study [29], consisting of a −20-kV high-voltage power supply (ES20N–20W/DAM; Gamma High Voltage Research Inc., Ormond Beach, FL, USA) and a UV–Vis detector (SAPPHIRE 600 detector; ECOM, Prague, Czech Republic). Electropherograms were recorded and processed using DataApex Software (DataApex, Prague, Czech Republic). A 75-μm i.d. and 365-μm o.d. fused-silica capillary was purchased from Polymicro Technologies (Phoenix, AZ, USA). The experiments were carried out using a 50-cm capillary with 40-cm effective length. All measurements were repeated three times.

2.3. CE Conditions

New capillaries were preconditioned by rinsing with 0.5 M NaOH at 1 kV for 60 min, and deionized water for 5 min, respectively. The capillary was equilibrated with a background electrolyte (5 mM phosphate buffer at pH 3.7 containing 20 mM SDS) for 5 min before each run and rinsed with deionized water for 5 min, followed by the background electrolyte for 3 min after each run. Samples were injected by hydrodynamic injection for 10 s, with a height difference of 20 cm between the capillary inlet and outlet. The analysis was performed at −15 kV and monitored at 200 nm.

2.4. Sample Pretreatment

Wine samples including two types of white wine (A and B), beer (C), and rice wine (D) were purchased from local supermarkets (Taitung, Taiwan). Beer sample was degassed by sonication for 20 min. Samples (2 mL) were subjected to centrifugation at 12,000 rpm for 10 min, and the supernatant was filtered through a 0.22-μm filter membrane. Next, the solution was diluted with deionized water to a suitable volume (10-fold for white wine A, 16-fold for white wine B, 50-fold for beer, and no dilution for rice wine) prior to CE analysis. The recovery tests were carried out by spiking the wine samples with a known amount of analyte mixture.

3. Results and Discussion

In our experiments, low-pH buffers and SDS were used. The magnitude of the EOF was determined by the surface charge on the capillary wall, and a small EOF was observed at low pH owing to the suppressed dissociation of silanol groups. Owing to the suppressed EOF, negatively charged SDS micelles migrated toward the anode. Under these conditions, analytes strongly partitioning into the micelles (lipophilic compounds) migrated to the detector more rapidly compared to the less partitioned compounds (hydrophilic solutes). Scheme 1 shows the illustration of the experiment. Three experimental parameters that affect the separation efficiency of analytes include the phosphate buffer concentration and pH and SDS concentration, respectively. These three factors were utilized to improve the MEKC separation efficiency.

3.1. Effect of the Concentration and pH of the Buffer Solutions

Resolution and selectivity are strongly affected by the pH and concentration of the running buffer. To investigate the ionic strength of the phosphate buffer, a constant SDS concentration (20 mM) was added to different concentrations of phosphate buffer (1–15 mM, pH 3.5). Results revealed that with increasing phosphate concentration, the analysis time increases (Figure 1). Each peak was identified individually by spiking known concentration of standard in the sample solution and the increased intensity of peak was used to confirm the standard of the peak. The increase in the ionic strength of the phosphate buffer leads to an increase in the EOF. With the application of a high voltage across the capillary, EOF corresponded to the movement of the buffer solution. However, at high phosphate concentrations (≥15 mM), high Joule heating was observed, leading to band broadening (Figure 1D). DA and Trp were not separated using 10 mM phosphate (Figure 1C). Furthermore, the sharpest peaks were observed using 5 mM phosphate. Hence, the optimum phosphate concentration is selected as 5 mM.
In addition, pH of the buffer is an important parameter for regulating EOF and mobilities of ionic analytes. Thus, it is vital to select the most suitable pH for the phosphate buffer. The pKa value of T, 5-HT, TA, DA, Trp, E, 5-HTP, NE, and Tyr were 10.20, 9.97, 9.77, 8.93, 9.39, 8.59, 9.18, 8.58, and 10.46, respectively. The pH was optimized by increasing it from 3.0 to 4.0, all analytes were protonated at this pH interval. With increasing pH, the migration time of the analytes obtained using a 5 mM phosphate buffer containing 20 mM SDS increased (Figure 2). 5-HTP, NE, and Tyr co-migrated with a long migration time (>11 min) at pH 4.0 (Figure 2D). At pH 3.7, the best separation was achieved. Therefore, the optimum pH is selected at 3.7 and the RSDs of the migration time of the analytes were less than 10%.

3.2. Effect of SDS Concentration

In MEKC, the SDS concentration is significant for separation. To evaluate the effect of SDS concentration on the separation of analytes, the SDS concentration was varied from 15 to 30 mM in 5 mM phosphate buffer at pH 3.7. The CMC of SDS in water is ~8.2 mM [30]. The positive charged analytes interacted with negative charged SDS micelles to form ion pairs. The migration time of each analyte decreased with increasing SDS concentration because of the strong interaction with micelles (Figure 3). The log Kow values of T, 5-HT, TA, DA, Trp, E, 5-HT, NE, and Tyr were 1.55, 0.21, 0.86, −0.98, −1.05, −1.24, −1.37, −1.70, and −2.26, respectively [31]. The order of migration is related to the polarity of the ion pair formed with SDS which, in turn, is strongly related to the polarity of the different analytes. With the addition of 20 mM SDS, analytes were baseline separated (Figure 3). Optimum MEKC conditions were 5 mM phosphate buffer containing 20 mM SDS at pH 3.7. Figure 3B shows the electropherogram for 1.0 µM analytes standards using the optimum MEKC conditions. All analytes were successfully detected within 11 min.

3.3. Performance of the Proposed Approach

To verify the performance of the proposed CE approach, the calibration graph was constructed in the range of 0.5 to 10.0 μM. Table 1 summarizes the analytical characteristics and method validation including linear range, linearity, LOD (S/N = 3), LOQ (S/N = 10), repeatability (intraday precision), and reproducibility (interday precision). A good linear response was observed in all cases (R2 > 0.990). To evaluate the reproducibility of our approach and ensure acceptable precision in terms of peak heights, the relative standard deviations (RSD, n = 3) for intraday and interday analyses were carried out. The results were revealed to be less than 2.90% and 4.61%, respectively. The LODs and LOQs of the analytes ranged from 0.11 to 0.61 µM and 0.38 to 2.03 µM, respectively. Table 2 summarizes the comparison of the analytical characteristics of different CE methods from previous literature. The advantages of the proposed approach include high efficiency, fast analysis time and cost-effectiveness.

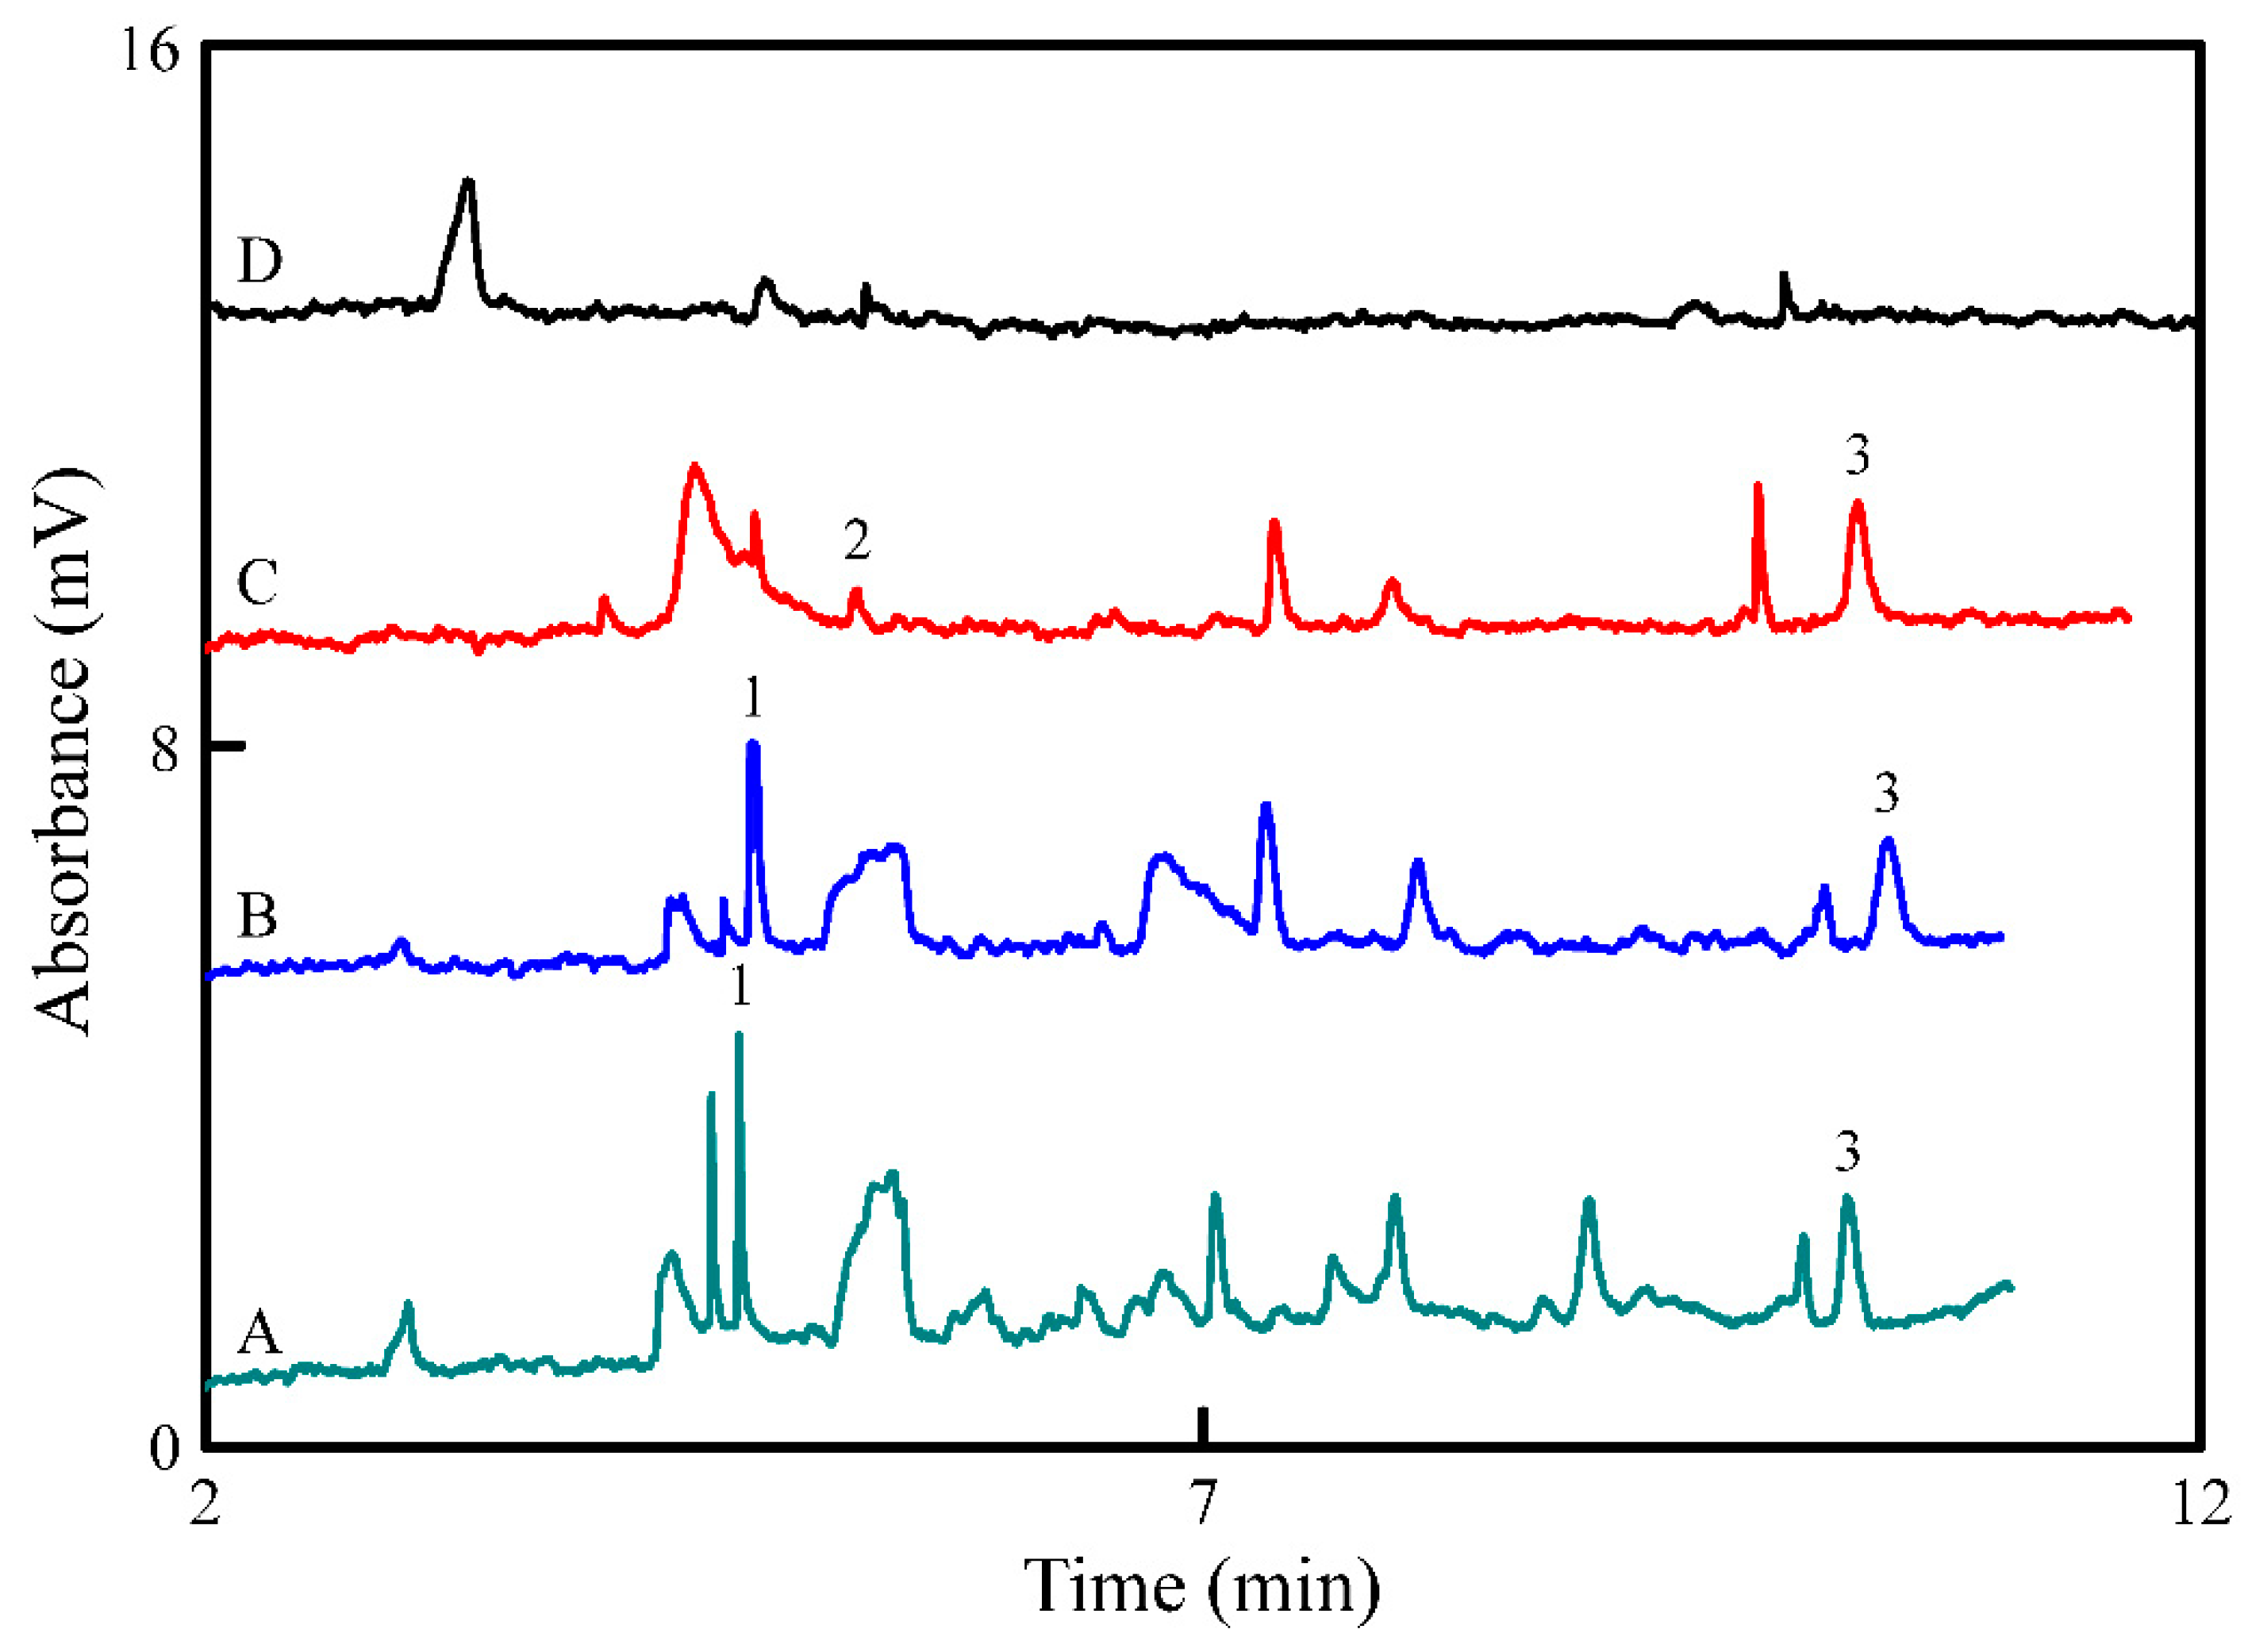
3.4. Application to Wine Samples

The selected nine analytes in four wine samples were identified and quantified to verify the applicability of our proposed method. As described in Section 2.4, analytes in four wine samples (i.e., white wine A and B, beer; and rice wine, respectively) were analyzed by CE-UV, as shown in the electropherograms in Figure 4A–D, respectively. All unidentified peaks were corresponding to compounds with absorbance at 200 nm. Table 3 summarizes the qualitative and quantitative analyses achieved by spiking with nine standard analyte mixtures in the rice wine sample. Two BAs (i.e., TA and Trp, respectively) were detected in white wine samples, and Trp and Tyr were detected in beer, but the concentrations of some analytes were extremely low for quantification (Table 3). The recoveries for the beer sample were 98.8–115.6%.

4. Conclusions

In this study, nine analytes were quantified by MEKC-UV, and this approach afforded a high efficiency, fast analysis time, and cost-effectiveness, as well as convenience of analysis. A background electrolyte containing 5 mM phosphate (pH 3.7) and 20 mM SDS achieved the satisfactory separation of the selected analytes. Under optimum conditions, nine analytes were completely separated within 11 min with good linearity, repeatability, reproducibility, and efficiency. This approach afforded LODs of 0.11–0.61 µM for 9 analytes. In addition, this CE approach was successfully applied to the analysis of the selected analytes in wine and beer samples.

Author Contributions

C.-Y.H., Y.-X.W., X.-Z.W., C.-C.H., and T.-C.C. contributed toward the preparation of the manuscript text, figures, and tables. C.-Y.H. conducted all major experiments.

Funding

This research received funding as described in Acknowledgments.

Acknowledgments

This research was funded by the Ministry of Science and Technology of Taiwan, grant number MOST 107-2113-M-143-002.

Conflicts of Interest

The authors declare no conflict of interests in financial/non-financial or any kinds of interests.

References

  1. Papageorgiou, M.; Lambropoulou, D.; Morrison, C.; Kłodzińska, E.; Namieśnik, J.; Płotka-Wasylka, J. Literature update of analytical methods for biogenic amines determination in food and beverages. Trends Anal. Chem. 2018, 98, 128–142. [Google Scholar] [CrossRef]
  2. Bettini, S.; Santino, A.; Valli, L.; Giancane, G. A smart method for the fast and low-cost removal of biogenic amines from beverages by means of iron oxide nanoparticles. RSC Adv. 2015, 5, 18167–18171. [Google Scholar] [CrossRef]
  3. Lorenzo, C.; Bordiga, M.; Pérez-Álvarez, E.P.; Travaglia, F.; Arlorio, M.; Salinas, M.R.; Coïsson, J.D.; Garde-Cerdán, T. The impacts of temperature, alcoholic degree and amino acids content on biogenic amines and their precursor amino acids content in red wine. Food Res. Int. 2017, 99, 328–335. [Google Scholar] [CrossRef] [PubMed]
  4. Ordóñez, J.L.; Troncoso, A.M.; García-Parrilla, M.D.C.; Callejón, R.M. Recent trends in the determination of biogenic amines in fermented beverages—A review. Anal. Chim. Acta 2016, 939, 10–25. [Google Scholar] [CrossRef] [PubMed]
  5. Mohammed, G.I.; Bashammakh, A.S.; Alsibaai, A.A.; Alwael, H.; El-Shahawi, M.S. A critical overview on the chemistry, clean-up and recent advances in analysis of biogenic amines in foodstuffs. Trends Anal. Chem. 2016, 78, 84–94. [Google Scholar] [CrossRef]
  6. Doeun, D.; Davaatseren, M.; Chung, M.-S. Biogenic amines in foods. Food Sci. Biotechnol. 2017, 26, 1463–1474. [Google Scholar] [CrossRef] [PubMed]
  7. Sentellas, S.; Núñez, Ó.; Saurina, J. Recent advances in the determination of biogenic amines in food samples by (U)HPLC. J. Agric. Food Chem. 2016, 64, 7667–7678. [Google Scholar] [CrossRef]
  8. Miękus, N.; Olędzka, I.; Plenis, A.; Kowalski, P.; Bień, E.; Miękus, A.; Krawczyk, M.A.; Adamkiewicz-Drożyńska, E.; Bączek, T. Determination of urinary biogenic amines’ biomarker profile in neuroblastoma and pheochromocytoma patients by MEKC method with preceding dispersive liquid–liquid microextraction. J. Chromatogr. B 2016, 1036–1037, 114–123. [Google Scholar]
  9. Płotka-Wasylka, J.; Simeonov, V.; Namieśnik, J. An in situ derivatization—Dispersive liquid–liquid microextraction combined with gas-chromatography—Mass spectrometry for determining biogenic amines in home-made fermented alcoholic drinks. J. Chromatogr. A 2016, 1453, 10–18. [Google Scholar] [CrossRef] [PubMed]
  10. Mohammadi, M.; Kamankesh, M.; Hadian, Z.; Mortazavian, A.M.; Mohammadi, A. Determination of biogenic amines in cheese using simultaneous derivatization and microextraction method followed by gas chromatography–mass spectrometry. Chromatographia 2017, 80, 119–126. [Google Scholar] [CrossRef]
  11. Papageorgiou, M.; Lambropoulou, D.; Morrison, C.; Namieśnik, J.; Płotka-Wasylka, J. Direct solid phase microextraction combined with gas chromatography—Mass spectrometry for the determination of biogenic amines in wine. Talanta 2018, 183, 276–282. [Google Scholar] [CrossRef] [PubMed]
  12. Fonseca, B.M.; Rodrigues, M.; Cristóvão, A.C.; Gonçalves, D.; Fortuna, A.; Bernardino, L.; Falcão, A.; Alves, G. Determination of catecholamines and endogenous related compounds in rat brain tissue exploring their native fluorescence and liquid chromatography. J. Chromatogr. B 2017, 1049–1050, 51–59. [Google Scholar] [CrossRef]
  13. Tašev, K.; Ivanova-Petropulos, V.; Stefova, M. Ultra-performance liquid chromatography-triple quadruple mass spectrometry (UPLC-TQ/MS) for evaluation of biogenic amines in wine. Food Anal. Methods 2017, 10, 4038–4048. [Google Scholar] [CrossRef]
  14. Jastrzębska, A.; Piasta, A.; Krzemiński, M.; Szłyk, E. Application of 3,5-bis-(trifluoromethyl)phenyl isothiocyanate for the determination of selected biogenic amines by LC-tandem mass spectrometry and 19F NMR. Food Chem. 2018, 239, 225–233. [Google Scholar] [CrossRef] [PubMed]
  15. Daniel, D.; dos Santos, V.B.; Vidal, D.T.R.; do Lago, C.L. Determination of biogenic amines in beer and wine by capillary electrophoresis–tandem mass spectrometry. J. Chromatogr. A 2015, 416, 121–128. [Google Scholar] [CrossRef]
  16. Wang, W.-F.; Ju, F.-R.; Ran, Y.-L.; Zhang, H.-G.; Chen, X.-G. Detection of biogenic amines in C57BL/6 mice brain by capillary electrophoresis electrokinetic supercharging. Analyst 2016, 141, 956–962. [Google Scholar] [CrossRef] [PubMed]
  17. He, L.; Xu, Z.; Hirokawa, T.; Shen, L. Simultaneous determination of aliphatic, aromatic and heterocyclic biogenic amines without derivatization by capillary electrophoresis and application in beer analysis. J. Chromatogr. A 2017, 1482, 109–114. [Google Scholar] [CrossRef] [PubMed]
  18. Miękus, N.; Olędzka, I.; Kowalski, P.; Miękus, P.; Baczek, T. Practical application of biogenic amine profiles for the diagnosis of patients with Ischemic stroke. J. Stroke. Cerebrovasc. Dis. 2018, 27, 945–950. [Google Scholar] [CrossRef]
  19. Chang, P.-L.; Hsieh, M.-M.; Chiu, T.-C. Recent advances in the determination of pesticides in environmental samples by capillary electrophoresis. Int. J. Environ. Res. Public Health 2016, 3, 409. [Google Scholar] [CrossRef] [PubMed]
  20. Álvarez, G.; Montero, L.; Castro-Puyana, M.; Cifuentes, A. Recent advances in the application of capillary electromigration methods for food analysis and Foodomics. Electrophoresis 2018, 39, 136–159. [Google Scholar] [CrossRef] [PubMed]
  21. Voeten, R.L.C.; Ventouri, I.K.; Haselberg, R.; Somsen, G.W. Capillary electrophoresis: Trends and recent advances. Anal. Chem. 2018, 90, 1464–1481. [Google Scholar] [CrossRef] [PubMed]
  22. An, D.; Chen, Z.; Zheng, J.; Chen, S.; Wang, L.; Huang, Z.; Weng, L. Determination of biogenic amines in oysters by capillary electrophoresis coupled with electrochemiluminescence. Food Chem. 2015, 68, 1–6. [Google Scholar] [CrossRef] [PubMed]
  23. Adımcılar, V.; Öztekin, N.; Erim, F.B. A direct and sensitive analysis method for biogenic amines in dairy products by capillary electrophoresis coupled with contactless conductivity detection. Food Anal. Methods 2018, 11, 1374–1379. [Google Scholar] [CrossRef]
  24. Woźniakiewicz, M.; Woźniakiewicz, A.; Nowak, P.M.; Kłodzińska, E.; Namieśnik, J.; Płotka-Wasylka, J. CE-MS and GC-MS as “green” and complementary methods for the analysis of biogenic amines in wine. Food Anal. Methods 2018, 11, 2614–2627. [Google Scholar] [CrossRef]
  25. Miękus, N.; Kowalski, P.; Olędzka, I.; Plenis, A.; Bień, E.; Miękus, A.; Krawczyk, M.; Adamkiewicz-Drożyńska, E.; Bączek, T. Cyclodextrin-modified MEKC method for quantification of selected acidic metabolites of catecholamines in the presence of various biogenic amines. Application to diagnosis of neuroblastoma. J. Chromatogr. B 2015, 1003, 27–34. [Google Scholar] [CrossRef] [PubMed]
  26. Parrot, S.; Vergés, M.P.; Perrot-Minnot, M.-J.; Denoroy, L. External influences on invertebrate brain histamine and related compounds via an automated derivatization method for capillary electrophoresis. ACS Chem. Neurosci. 2017, 8, 1839–1846. [Google Scholar] [CrossRef] [PubMed]
  27. Li, F.; Qiu, D.; Kang, J. Preparation of a sulfoalkylbetaine-based zwitterionic monolith with enhanced hydrophilicity for capillary electrochromatography separation applications. Chromatographia 2017, 80, 975–981. [Google Scholar] [CrossRef]
  28. El Deeb, S.; Dawwas, H.A.; Gust, R. Recent methodological and instrumental development in MEKC. Electrophoresis 2013, 34, 1295–1303. [Google Scholar] [CrossRef] [PubMed]
  29. Hsu, S.-H.; Hu, C.-C.; Chiu, T.-C. Online dynamic pH junction–sweeping for the determination of benzoic and sorbic acids in food products by capillary electrophoresis. Anal. Bioanal. Chem. 2014, 406, 635–641. [Google Scholar] [CrossRef]
  30. Hsu, C.-H.; Hu, C.-C.; Chiu, T.-C. Analysis of carbofuran, carbosulfan, isoprocarb, 3-hydroxycarbofuran, and 3-ketocarbofuran by micellar electrokinetic chromatography. J. Sep. Sci. 2012, 35, 359–364. [Google Scholar] [CrossRef]
  31. U. S. National Library of Medicine. Available online: http://sis.nlm.nih.gov/chemical.html (accessed on 27 December 2018).
  32. Liu, X.; Yang, L.-X.; Lu, Y.-T. Determination of biogenic amines by 3-(2-furoyl)quinoline-2-carboxaldehyde and capillary electrophoresis with laser-induced fluorescence detection. J. Chromatogr. A 2003, 998, 213–219. [Google Scholar] [CrossRef]
Scheme 1. Schematic representation of the separation mechanism.
Applsci 09 01193 sch001
Figure 1. Effect of the concentrations of the phosphate buffer (pH 3.5) containing 20 mM SDS on the separation of the nine analytes: (A) 1, (B) 5, (C) 10, and (D) 15 mM. Sample (1.0 μM) injection was performed at a height of 20 cm for 10 s. A 50-cm capillary with an effective length of 40 cm was used. Separation was conducted at −15 kV. Peak identities: (1) T, (2) 5-HT, (3) TA, (4) DA, (5) Trp, (6) E, (7) 5-HTP, (8) NE, and (9) Tyr.
Applsci 09 01193 g001
Figure 2. Effect of the pH on the separation of the nine analytes. The capillary was filled with 5 mM phosphate buffer at a pH of (A) 3.0, (B) 3.5, (C) 3.7, and (D) 4.0 containing 20 mM SDS before the sample was injected. Other conditions were the same as shown in Figure 1B.
Applsci 09 01193 g002
Figure 3. Electropherograms showing the effect of SDS on the separation of the nine analytes: SDS of (A) 15 mM, (B) 20 mM, (C) 25 mM, and (D) 30 mM. Other conditions were the same as shown in Figure 2C.
Applsci 09 01193 g003
Figure 4. Electropherograms of (A) white wine A, (B) white wine B, (C) beer, and (D) rice wine. Other conditions were the same as shown in Figure 2C. Peak identities: (1) TA, (2) Trp, and (3) Tyr.
Applsci 09 01193 g004
Table 1. Linearity, precision, accuracy, LOQs, and LODs of the proposed method.
AnalyteLinear Range (μM)Regression EquationR2Repeatability (%) aReproducibility (%) aLOQ (μM)LOD (μM)
T1.0–10.0y = 0.147x − 0.0480.99041.934.122.030.61
5-HT1.0–10.0y = 0.195x − 0.0310.99210.683.461.500.45
TA0.8–10.0y = 0.348x − 0.1110.99171.232.100.910.27
DA0.55–10.0y = 0.437x − 0.0590.99591.992.900.480.15
Trp1.0–10.0y = 0.176x − 0.0470.99361.563.241.580.48
E0.55–10.0y = 0.478x − 0.1110.99642.904.610.410.12
5-HTP0.8–10.0y = 0.223x − 0.0440.99560.703.331.040.31
NE0.55–10.0y = 0.500x − 0.1050.99241.894.290.380.11
Tyr0.55–10.0y = 0.275x + 0.0280.99541.863.140.450.13
a RSD for three replicate injections on the same day (repeatability) or over successive days (reproducibility) of migration time.
Table 2. Comparison of the developed method with previously reported capillary electrophoresis (CE) methods for the determination of biogenic amines.
MethodAnalytesTime (min)LODsReference
CE-ECLSpd, His, Tyr, Phe, Put306.0 × 10−4 − 9.6 × 10⁻² mg/L[22]
CE-C4DSpd, Put, His, Cad, Tyr64.1 × 10−2 − 9.8 × 10⁻² mg/L[23]
CE-UVSpd, Put, His, Cad, Phe, TA, Try, DA, 5-HTP, OA, NE, E8.50.4 − 0.6 µM[17]
CE-LIFHist, Put, Cad, Spd, Spe, Tyr, Phe, Try280.5 − 10 nM[32]
CEC-UV3-MT, HVA, DOPAC, 5-HIAA, NE, 5-HTP, DA, Trp, DHBA, Tyr, NA, DOPA40N.P.[27]
MEKC-UVT, 5-HT, TA, DA, Trp, E, 5-HTP, NE, Tyr110.11 − 0.61 µMThis work
3-MT: 3-methoxytyramine; 5-HIAA: 5-hydroxyindole-3-acetic acid; 5-HT: 5-hydroxytryptamine; 5-HTTP: 5-hydroxytryptophan; C4D: capacitively coupled contactless conductivity detection; Cad: cadaverine; CD: cyclodextrin; CE: capillary electrophoresis; CEC: capillary electrochromatography; DA: dopamine; DOPA: 3,4-dihydroxyphenylalanine; DOPAC: 3,4-dihydroxyphenlacetic acid; E: epinephrine; ECL: electrochemiluminescence; His: histamine; HVA: homovanillic acid; MEKC: micellar electrokinetic chromatography; MS: mass spectrometry; NE: norepinephrine; N.P.: not provided; OA: octopamine; Phe: phenylethylamine; Put: putrescine; Spd: spermidine; Spe: spermine; T: tryptamine; TA: tyramine; Trp: tryptophan; Try: tryptamine; Tyr: tyrosine; UV: ultraviolet detector.
Table 3. Analytical results in wine samples (n = 3).
White Wine AWhite Wine BBeerRice Wine
AnalyteOriginal (μM)Recovery a (%)RSD (%)Original (μM)Recovery (%)RSD (%)Original (μM)Recovery (%)RSD (%)Original (μM)Recovery (%)RSD (%)
TN.D. N.D. N.D. N.D.111.62.89
5-HTN.D. N.D. N.D. N.D.101.52.32
TA3.52105.74.663.5796.84.60N.D. N.D.115.65.54
DAN.D. N.D. N.D. N.D.111.13.17
TrpN.D. N.D. 1.5296.57.01N.D.98.81.25
EN.D. N.D. N.D. N.D.107.42.65
5-HTN.D. N.D. N.D. N.D.104.23.67
NEN.D. N.D. N.D. N.D.104.23.67
Tyr2.2399.62.653.59104.05.023.95104.88.29N.D.104.44.81
N.D.: not detected. a The recovery results were calculated by spiking 4.0 μM standards to each sample.

