Abstract
Determining the quality of meat has always been essential for the food industry because consumers prefer superior quality meat. Therefore, the food industry requires the development of a rapid and non-destructive method for meat-quality determination. Over the past few years, a number of techniques have been presented for monitoring meat–chemical attributes. However, most previous techniques are quite expensive, destructive, and require complex hardware to operate. Thus, in this work, we demonstrate a low-cost sensing technique (eliminating the expensive equipment and complicated design) for meat–chemical quality detection. The newly developed system was integrated with a low-cost monochrome camera and ordinary light-emitting diode (LED) light sources, with fifteen different wavebands ranging from 458 to 950 nm. The monochrome camera captures images of the meat sample across a spectral range from 458 to 950 nm using a single snapshot method. The chemical values (e.g., moisture, fat, and protein) were also determined using conventional methods. The collected images were combined to produce a multispectral data cube and to extract spectral data. Partial least squares (PLS) and support vector regression (SVR) modeling were used on the extracted spectra and chemical values. The developed models for meat samples displayed accurate chemical-component prediction ( > 0.80). Our model, based on a monochrome sensor using only fifteen wavebands, provided reasonable results compared with the previously developed expensive spectroscopic techniques. Therefore, this complementary metal-oxide semiconductor (CMOS) based multispectral sensing technique may have the potential to detect meat quality, thereby facilitating a simple, fast, and cost-effective method applicable to small-scale meat-processing industries.
1. Introduction
Meat has become an important resource for human health; it has a high nutritional value, flavor, and juiciness characteristics [1]. In recent years, consumers and buyers have become more conscious of meat quality and safety [2]. A United Nations Food and Agriculture Organization (FAO) report illustrates that, during the past decade, meat production and consumption has increased continuously, and will increase by 60% by 2050. To satisfy future meat demands, governments and organizations will likely be concerned about meat production, quality, and safety. A consumer’s meat selection is usually based on color, marbling, texture, and juiciness parameters [3]. These parameters are influenced by several chemical attributes. The attributes of moisture, protein, and fat are the largest contributors to meat quality [4]. They play an important role in meat quality and are directly associated with the juiciness, tenderness, marbling, and nutritional characteristics of the meat [5]. Thus far, a variety of instrumental techniques has been employed to assess the chemical properties in meat samples. Conventional techniques for meat-quality assessment generally rely on visual evaluations and laboratory-based chemical analyses, e.g., Kjeldahl nitrogen, Soxhlet extraction, and chromatography techniques [6]. Although these techniques provide very sensitive chemical identification, they are tedious, time-consuming, destructive, and often require expensive chemicals.
Because of these weaknesses, conventional techniques are not applicable for large-scale meat industries, where speed is significant, for on-line product-quality measurements [7]. To overcome such issues, spectroscopic techniques, which are known as very powerful tools, are widely implemented in large-scale meat-processing industries [8]. Example techniques include hyperspectral imaging (HSI), infrared spectroscopy (IR), nuclear magnetic resonance (NMR) spectroscopy, and Raman spectroscopy [9,10,11]. In recent years, spectroscopic techniques have become more popular in large-scale meat-processing industries [12]. The spectroscopic techniques are quite expensive, due to their high-cost sensor and optic elements; nevertheless, the meat industry invests in a large budget to employ these techniques to assure the quality of their product. These spectroscopic tools provide the company with a non-destructive, chemical-free, and rapid quality assessment during the online meat-product measurement [13]. Several studies have confirmed the potential use of spectroscopic techniques for monitoring the chemical properties of meat samples with outstanding prediction accuracies [14,15,16,17,18,19,20]. Previous studies have already proven that spectroscopic devices have great potential for product-quality management and are easily applicable to large-scale meat-processing industries with high-throughput product screening.
Apart from these applications, a range of studies has been particularly conducted for monitoring different quality parameters of various meat and meat products utilizing an HSI technique in different spectral ranges [21]. This technology combines the advantages of both spectroscopy and imaging techniques in one system to provide both spectral and spatial information for effective quality inspection. Although HSI is a promising technique that can provide rapid quality monitoring of various food commodities including meat, it still faces some inherent limitation in terms of application, complex data handling, and initial investment [22]. To achieve rapid detection of quality parameters and to increase the industrial operating efficiency of meat products, the multispectral imaging technique can be adopted for accurate quality prediction in meat products. For a multispectral imaging system, the concept is similar to the HSI, however, the main difference is in the spectral bands, which are discrete, non-contiguous, and irregular during image acquisition [23]. Thus, the complexity of multispectral imaging is comparably lower than that of the HSI technique. Owing to these particular advantages of multispectral imaging over HSI, a range of studies utilized multispectral imaging for quality prediction of meat where the data of meat samples were first collected using HSI. The optimal wavebands were selected by applying a variety of chemometric techniques of variable selection, and some of which are documented in [22]. However, despite being simple and effective, no study published concerning on the development of multispectral imaging system using the selected bands for meat quality analysis, and only applied in terms of data analysis by developing multispectral models to reduce the (HSI) data dimension and redundancy.
Although the aforementioned spectroscopic devices (specifically, HSI technique) have great potential for product-quality management in large-scale industries, their price makes them inaccessible to small-scale industries. Small-scale or medium-sized meat-processing industries often cannot afford the expensive instruments and quality-control staff; therefore, they cannot ensure the quality of their product. Hence, they tend to seek devices that are economically reasonable and easily applicable to their industry. Thus, to fulfill the small-scale industry requirements, it is important to develop low-cost, yet accurate devices. The objectives of this work are as follows: (a) Develop low-cost and non-destructive sensing approach for monitoring meat-sample quality; (b) Investigate the feasibility of the developed technique for predicting important chemical elements, e.g., moisture, fat, and protein, in the meat; (c) Develop a multivariate analysis model to analyze the chemical components of the meat.
2. Materials and Methods
2.1. Meat Samples
For this study, sirloin, tenderloin, and turkey breast samples were collected from local supermarkets in South Korea. The samples were cut into equal pieces, vacuum packed, and stored in a refrigerator at 4 °C for 24 h. After 24 h, the samples were removed from the vacuum packages and measured. Fifty samples from sirloin and tenderloin meat category and forty samples from turkey meat category were used for multispectral imaging.
2.2. Instrumentation and Image Acquisition
A multispectral imaging system (shown in Figure 1) was developed to acquire images of the meat samples. The system was mainly composed of a monochrome industrial camera (DMK 23UM021, The Imaging Source Asia Co., Ltd., Taiwan) with a maximum resolution of 1280 × 960 pixels (1.2 MP) and a maximum frame rate of 115 fps, a complementary metal-oxide-semiconductor (CMOS) sensor, a USB 3.0 cable (CA-USB30-AmB-BLS/3) for the data transfer, light-emitting diode (LED) light sources with fifteen wavelengths in the range of 458 to 950 nm, a Bluetooth sensor (FB155BC serial board, Firmtech Co., Ltd., Korea) to control the LED light sources, and a dark-room environment chamber.
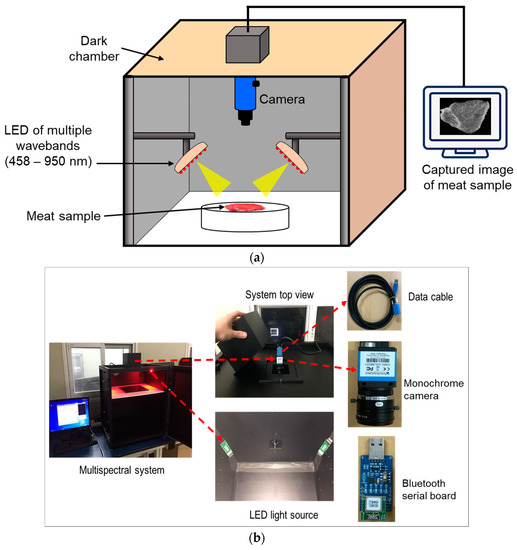
Figure 1.
Schematic diagram (a) and photo (b) of the proposed multispectral imaging system for meat samples.
2.3. Light-Emitting Diode (LED) Wavebands Selection
In this work, the LEDs of different wavelengths for the developed multispectral system were selected based on the hyperspectral imaging (HSI). For this purpose, hyperspectral imaging data of all three categories of meat samples were collected using a laboratory-based hyperspectral imaging system in the reflectance mode in a wavelength range of 400 to 1000 nm. The system comprised an electron multiplying charge-coupled device (EMCCD) camera, line-scan imaging spectrograph (Headwall Photonics, USA), objective lens of 28 mm focal length, and detector size of 1004 × 1002 pixels. A more detailed description of the used HSI system can be found in [14,21]. The collected images were corrected, and a partial least squares (PLS) regression model for each parameter (fat, moisture, and protein) was developed with extracted spectral data and Y vector of reference (measured) values. Regression coefficient (beta coefficient) was used to select the wavelength containing essential information. The regression coefficient method selects the optimal wavelengths that have the highest absolute value of the regression coefficient from the PLS regression model.
2.4. Image Acquisition
Equal-size meat samples were manually placed inside the dark chamber for the image acquisition, within the camera field of view (FOV). Before the image acquisition, the exposure time was set using a white Teflon tile with uniform reflectance. The system components and image-acquisition process were controlled by custom software created with the Microsoft Visual Basic environment under the Windows operating system (Figure 2). The software graphical user interface (GUI) included several options, e.g., image capture, camera calibration, LED information, image correction, image display, and save. To correct the captured raw images () of meat samples, a white reference image () was obtained with a Teflon sheet, while a dark reference image () was obtained with a lens cover. Further, the relative reflectance () was calculated as:
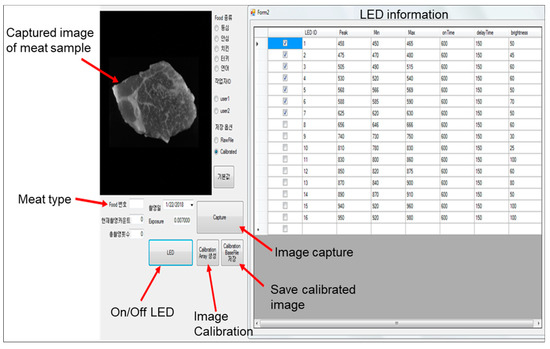
Figure 2.
Custom-built software for meat-image acquisition.
Finally, the calibrated images were saved in TIFF format and image processing, such as multispectral cube construction, and analysis was done in MATLAB software environment, version 2016a (MathWorks Inc. Natick, MA, USA).
2.5. Reference Measurements
Once the images were acquired, the center slice of the meat sample was used for the reference analysis using conventional chemical analysis methods. The reference values for the moisture, protein, and fat content of the meat samples were measured using a modified Association of Analytical Communities (AOAC) standard method (1995). The moisture content was determined using an oven-drying method [14]. Two grams of the meat sample were placed on an aluminum dish and dried for 2 h in an oven at 110 °C; then, the weight difference was calculated. The crude protein content was measured using the Kjeldahl method [4], and further calculated using a protein coefficient. The crude fat content was measured using the Soxhlet extraction method [4].
Table 1 shows the descriptive statistics, e.g., mean, range, and standard deviation, obtained using the conventional methods. The values indicate a wide variation in the measured components. The variation in the protein content was relatively smaller than that observed in the fat and moisture content as with other previous studies [24]. We also calculated the skewness and kurtosis parameters, which are related to the sample distribution. Measured parameters with a large deviation and a wide range of measured values would help us to improve the stability of the established predictive models.

Table 1.
Descriptive statistics of measured parameters.
2.6. Spectral Extraction and Correction
The monochrome camera obtained the meat images with a snap-shot method. The generated images are discrete, with each LED providing a single image over the range of 450 to 950 nm. Therefore, we combined all the images from different LEDs to generate a “multispectral cube,” which consists of two spatial dimensions and one spectral dimension. The total time for image collection and multispectral cube generation was about sixteen secs. The region of interest (ROI) was selected on the multispectral cube to extract the continuous spectrum for statistical analysis. This step was manually performed for each meat image, and the ROI-selected pixel spectra were averaged for each meat sample before the analysis. However, the pixel selection step can be done automatically for an industrial process chain by applying a simple threshold method on the acquired multispectral image to discriminate the meat sample from the background. In addition, the extracted spectral data were subjected to different preprocessing methods to remove random noise and spectral variation. Various preprocessing techniques, e.g., auto-scaling, mean centering, normalization, and standard normal variate (SNV), were tested and selected using the respective model accuracy. This method is commonly used to remove spectral variations and the scatter effect from the data, and transform the data into a normal form. The best preprocessed data were used for further analysis.
2.7. Data Analysis
In this study, partial least-squares regression (PLSR) and support-vector regression (SVR) models were used to analyze the meat data. PLSR is the most frequently applied chemometric technique to predict the sample quality. It is an extension of the multiple linear regression model, which is widely used to specify the linear relationship between a dependent variable (Y-matrix) and independent variables (X-matrix) [12]. In this study, the independent variable was the spectral data obtained from the multispectral device, while the dependent variable was the chemical parameters (e.g., moisture, fat, and protein content) measured using conventional methods.
The goal of the PLSR model is to predict the chemical parameters of the meat samples. In the PLSR model, data decomposed into orthogonal structures called latent variables (LVs). The LVs describe the maximum covariance between the spectral data and the response variables [25]. To build a regression model for predicting the chemical components in the meat, the entire dataset (X and Y matrix data) was divided into calibration and prediction sets using the Kenard–Stone (KS) algorithm. KS algorithm uniformly divides the samples by calculating the Euclidean distances between the X variables [26]. By using the KS method, 70% percent of the data were used to build the calibration dataset, while 30% were used as the prediction dataset. Further, the PLS model was constructed using the calibration set, while the prediction set was retained for testing the model’s performance. However, to prevent the model from over-fitting or under-fitting, it was critical to select the optimal number of latent variables (LVs) for the regression model. The optimal number of LVs was selected using the lowest value from the root-mean-square error (RMSE) method during the cross-validation (leave-one-out) process. The equation is as follows:
where and are the predicted and measured chemical values, respectively, and n is the number of observations in the calibration set.
Similar to PLSR, SVR also solves regression problems. However, its advantage over PLSR is that it solves both linear and non-linear problems using an optimization approach. SVR fits data into the linear regression model, y = wx + b, between the independent variable (x) and the dependent variables (y) by minimizing the cost function. The final SVR function can be expressed as:
where are Lagrange multipliers, b is the bias term obtained from the optimization process, K(,) is the kernel function, and and are the input training and testing vectors, respectively.
A radial basis function (RBF) was used to develop the SVR model, while optimal kernel parameters (γ and C) were used to train the dataset. The proper kernel function and optimum kernel parameters are crucial during the SVR process; they are optimized using the cross-validation method with the lowest RMSE value. Detailed descriptions of the SVR model are available in the literature [27,28].
In the present study, the SVR analysis was performed using RBF kernel functions to predict the chemical parameters of the meat samples. Initially, the calibration set of the meat-sample data was cross-validated, and optimum parameters were obtained with the lowest root-mean-square current (RMSC) value. The optimized parameters were used to train the meat samples’ calibration data set. Finally, the prediction set was used to test the model. All SVR computations were conducted using the MATLAB software and the SVR toolbox. Figure 3 shows the flowchart of the overall data-analysis process used for the meat samples.
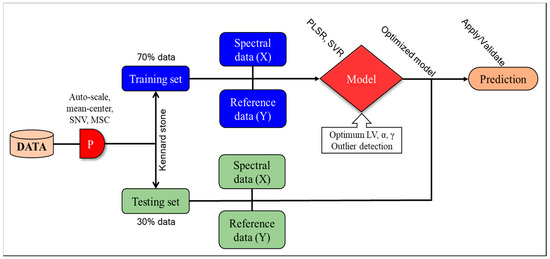
Figure 3.
Flowchart for meat-data analysis.
3. Results and Discussion
3.1. Selection of Optimal Wavebands Using Hyperspectral Imaging (HSI) Data
The sensitive wavelengths from HSI data reflecting the characteristics of spectra for predicting quality parameters of meat sample, such as moisture, fat, and protein, were obtained based on the regression coefficient (beta coefficient) plot of the PLSR model. The highest absolute values of the regression coefficient obtained from HSI data were deemed the most important variable responsible for the prediction and interpretation of model [29]. A range of studies has utilized the beta coefficient for optimal wavebands selection and emphasized that wavelength selection can be carried out based on the information derived from the PLS model. This is a much more straight forward and simpler strategy [7,30]. The beta coefficient provides spectral difference among different groups (concentration) of samples, thus, revealing important wavelength regions for different quality parameters.
As shown in Figure 4, the highlighted and selected wavebands regions had particular importance for moisture, fat, and protein contents. These selected spectral bands are well-known absorption peaks for the aforementioned quality parameters. The peak of beta coefficients (Figure 4) obtained for moisture, fat, and protein showed a good match with the spectral regions mentioned in previous studies for the prediction of aforementioned chemical components in meat sample [14,16,23]. In addition to wavebands selected using beta coefficients, five additional LEDs in the wave range between 800 and 900 nm were also used as this region represent the combined features from moisture and fat contents [14]. In particular, the region between 700 and 800 nm was selected for moisture (Figure 4a), and the region between 650 and 750 nm and 900 and 950 were selected for fat content (Figure 4b) [16,23]. Although the range between 700 and 1000 nm is not quite sensitive for protein content, the visible region between 458 and 600 nm representing the myoglobin (a protein found in muscle cells) [16,18,19] was selected for protein content (Figure 4c). However, the beta coefficients obtained from three different models show some common peaks with different intensities. This is possibly because the change in concentration of an individual quality parameter (moisture, fat, or protein) highly affects the concentration of other chemical components.
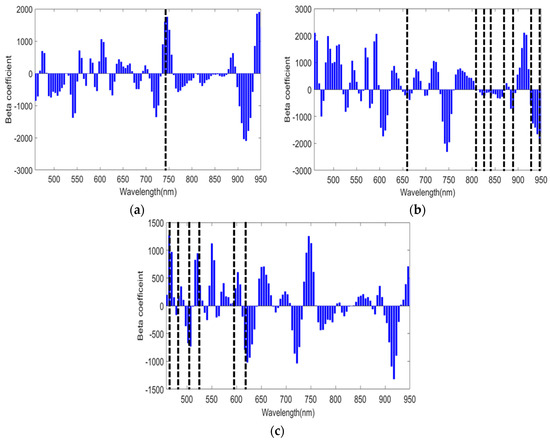
Figure 4.
Selection of light-emitting diode (LED) wavebands using hyperspectral imaging (HSI) data based on beta coefficient plot. The selected wavebands were further used for multispectral system: (a) Selected regions for moisture content; (b) Selected regions for fat content; (c) Selected regions for protein contents. The dashed lines correspond to the central wavelengths.
Following the application of the regression coefficient method for optimal waveband selection, a simplified model based on selected wavebands was developed for each parameter using PLS multivariate analysis method, and the prediction performance of the simplified model was then compared with the model developed using all variables. Based on the results, no difference was observed between the performance of two different models developed with selected wavelength and all variables. Therefore, owing to the effectiveness of selected wavelength for prediction of aforementioned quality parameters of different meat samples, LEDs of above-mentioned wavebands were selected and used as an illumination source to obtain multispectral images of meat samples.
3.2. Spectral Characteristics of Meat Samples
Figure 5 shows the spectral characteristics of three types of meat sample: sirloin, tenderloin, and turkey. The spectra from the meat samples showed varying intensity in the region from 458 to 950 nm. The variation in the visible spectrum (458–700 nm) is mostly caused by the characteristics of the sample’s skin, color, and darkness of the meat; whereas, the variation towards the near-infrared (NIR) region is due to the chemical components in the samples.
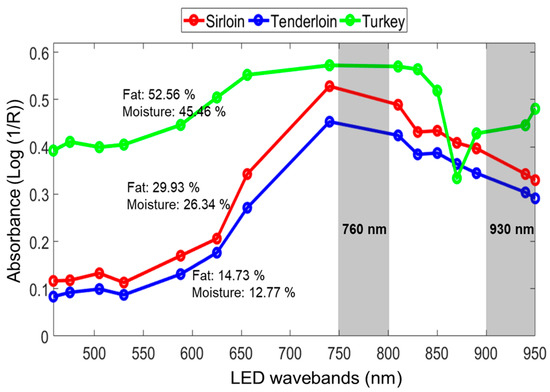
Figure 5.
Mean absorbance spectra of three different meat types (sirloin, tenderloin, and turkey).
The region at 762 nm is the third overtone of the O−H stretching, which is linked to the presence of water; the region at 930 nm is the third overtone of the C−H stretching, linked to the presence of fat in the muscle of the meat [24]. In comparison with the tenderloin spectra, the turkey and sirloin samples showed higher spectral-absorbance intensity. This might be due to the presence of higher fat and moisture content in the samples. The fat and moisture values in the tenderloin samples were 14.73% and 12.77%, respectively, which were lower than the turkey and sirloin samples, showing lower spectral absorbance (Figure 5). However, the turkey spectra showed relatively higher optical reflection in the visible region of the spectrum due to the outside skin color.
3.3. Model-Parameter Optimization
Figure 6 shows parameter-optimization examples for the PLSR model. The first four latent variables (number of principal components) capture the maximum X and Y variance for over 80% of the data, the percentage variance decreased after four latent variables (Figure 6a). It is important to note that only the first four latent variables (LVs) are useful for predicting the chemical components. Comparing the latent variable plot against the root-mean-square error (RMSE) showed that the error value dropped at the fourth latent variable (Figure 6b). Therefore, it was concluded that only four latent variables were essential in the PLSR model for obtaining a good prediction accuracy with a lower error rate, while avoiding the risk of under-fitting or over-fitting the model.
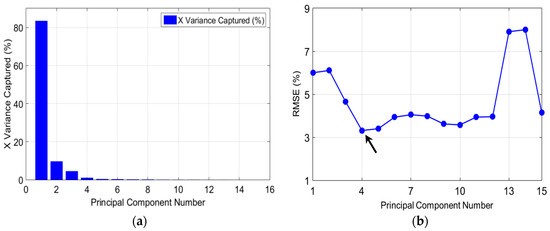
Figure 6.
Example cross-validation method for optimizing a partial least squares (PLS) model: (a) Plot for the X-variance captured by the model; (b) Plot of latent variables (LVs) vs. root-mean-square error (RMSE) (the arrow indicates the optimized LVs with the lowest root-mean-square current (RMSC)).
In contrast to PLSR, an examination of the RMSC value is also essential for optimizing the SVR parameters. Figure 7 presents the SVR-parameter optimization in the form of a counter-plot. The counter-plot displays the C and γ parameters against the RMSE values. Grid searching, as a recommended process, was applied to tune the parameter sets (C and γ). Here, the RMSC value was calculated for each combination of C and γ for every grid point; the grid point providing the smallest RMSE value is the best combination of the parameter sets. It can be seen that the grid marked with an arrow shows the lowest error for both parameters.
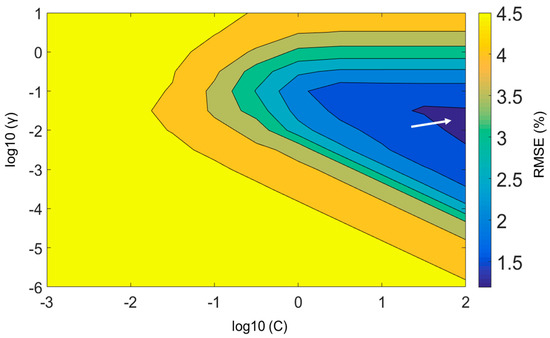
Figure 7.
Counter-plot example obtained from the grid-searching method for optimizing the support-vector regression (SVR) parameters. The arrow indicates a finer grid with the lowest RMSE with the highest prediction.
3.4. Chemical Component Prediction
Once the parameters were optimized for both the PLSR and SVR models, the optimized parameters with the lowest RMSC were used to predict the chemical components of the meat samples. In this study, the prediction model for the meat data was also contaminated by the outliers; it was perhaps caused by a wrong system response, variability in the measurements, or experimental error. Therefore, identifying and excluding outliers from the data is significant, to prevent false data predictions. To detect outliers in the data, a widely used 3σ rule was applied, by removing values exceeding ±3σ [31,32]. Figure 8 presents an example of the outliers’ impact on the fat-prediction accuracy in the sirloin samples. For the fat prediction, the calibration data exhibited a strong correlation and a low error rate (: 0.83; RMSEC: 2.81%) between the measured and predicted values (Figure 8a). However, for the prediction data set, the correlation value decreased and the model error increased (: 0.69; RMSEC: 4.08%), due to the presence of outliers in the data. The outliers were identified by observing the leverage values against the standard residual values (Figure 8b), where some data surpassed the limit of ±3σ; they were considered outliers and excluded. After excluding outliers from the data, the prediction accuracy was improved with of 0.81 and RMSEC: 2.95% (Figure 8c). A similar method was used for outlier detection in the other samples and the best results are presented here.
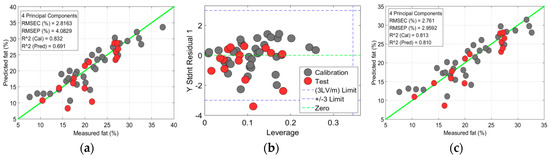
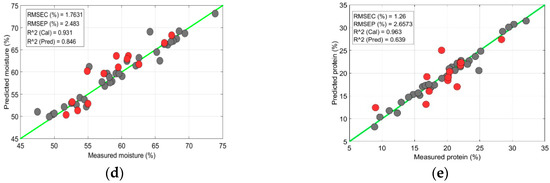
Figure 8.
Chemical-component prediction in a sirloin sample: (a) Prediction plot of fat content from partial least-squares regression (PLSR) model with outliers included; (b) Plot for outlier identification in fat data; (c) Prediction of fat content from PLSR model with outliers excluded; (d) Prediction of moisture content with SVR model; (e) Prediction of protein content with SVR model. The black dots are for calibration sample-set and red dots are for test-sample set.
Data from the sirloin samples were subjected to moisture and fat content prediction. Compared with the PLSR model, the SVR model showed superior moisture content prediction with of 0.84 and RMSEP of 2.48% (Figure 8d); the accuracy was decreased for the protein content prediction (Figure 8e).
For the turkey data, the SVR model revealed a similar accuracy of > 0.80 with a lower error rate for the fat and moisture prediction (Figure 9a,b); however, the accuracy fell again for the protein-content prediction (Figure 9c). A reduction in accuracy could be observed because the region from 458 to 950 nm did not provide the significant information about the protein content. Previous authors also observed moderate accuracy for the protein content prediction in the 400 to 1000 nm region [24]. Both the PLSR and SVR models accurately determined the chemical components in the tenderloin samples. However, in contrast to the PLSR model, the SVR model provided higher accuracies with lower prediction errors for both the calibration and prediction sets. For all the measured parameters, the SVR model exhibited > 0.84 with RMSEP < 2%, and a bias close to the error values (Figure 10).
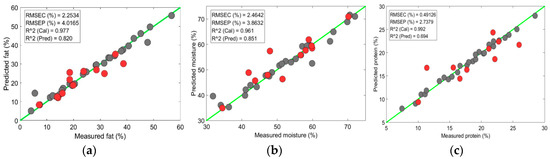
Figure 9.
Chemical-component prediction in turkey from SVR model: (a) Prediction plot of fat content; (b) Prediction plot of moisture content; (c) Prediction plot of protein content.
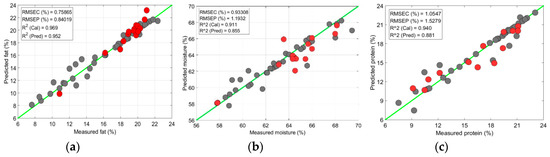
Figure 10.
Chemical-component prediction in tenderloin from SVR model: (a) Prediction plot of fat content; (b) Prediction plot of moisture content; (c) Prediction plot of protein content.
The overall chemical parameter prediction results from both analysis approaches are given in Table 2. Among all of the preprocessing methods, the SNV preprocessed data performed superior for chemical component prediction. As our results were compared with previous meat quality research based on hyperspectral and NIR spectroscopy [14,24,33], the results presented from our system showed a limited prediction accuracy. Furthermore, the error rate was higher (RMSEP > 1%) than the previous recordings (previous recordings the SEP or RMSEP < 1% and > 90 for moisture, fat, and protein prediction). It is obvious that the previous researchers applied expensive and high-resolution sensors for the meat measurements. However, considering the currently expensive use of HSI technique in the meat industry this system paves the way for small scale industries and big companies. Later, we have also compared the performance of multispectral system with our laboratory based HSI system. Compared with the result of multispectral imaging and HSI in Table 2 and Table 3, the HSI performed superior for chemical prediction with all variables, more specifically for sirloin and tenderloin samples. However, except for protein prediction in sirloin and turkey samples, the multispectral imaging showed a reasonable performance for other parameters using only a few wavebands. In addition, the errors for the multispectral system were higher compared with HSI: 8% higher for tenderloin, 29% for sirloin; and 25% for moisture, 36% for fat, and 91% protein. However, in future work, we will able to optimize our system with higher accuracy and fewer errors by incorporating higher resolution LEDs with emission wavelengths in the NIR range. Moreover, to provide the optimal sensor performance, the working LED set, that is, the LED number and wavelengths, should be adopted to each case individually to take the respective chemical component and optical properties of the sample into account. We believe that a significant technical simplification of the LED-based multispectral imaging system, compare to conventional HSI system and commercial multispectral imaging systems, should result in a dramatic reduction of the devices prices without minimal reduction of the performance.
Table 2.
Chemical component prediction in meat samples based on multispectral imaging with standard normal variate (SNV) preprocessing method.
Table 3.
Chemical component prediction in meat samples based on hyperspectral imaging (his) with SNV preprocessing method.
4. Conclusions
A low-cost and non-destructive multispectral imaging system comprised of a monochrome camera and LED light sources was developed and investigated to examine the possibility to assess the meat quality attributes. The performance of the established models for moisture, fat, and protein content of three meat categories demonstrates that the developed system has good potential to be an alternative to the expensive commercial HSI or spectroscopy. Although the prediction accuracy for tenderloin was outstanding, the model accuracies for protein content for sirloin and turkey meat were relatively low. This might be because the best wavelength region (458–580 nm) selected in this study was not sufficiently sensitive for protein content determination. The spectral range still needs to extend to the NIR region (beyond 1000 nm) to increase the sensitive for chemical component measurement. Apart from this, the present study illustrates that the developed multispectral imaging system with optimal LED wavebands for meat quality analysis was promising and low-priced compared with existing devices. Further, the developed system can easily be adopted in small-scale meat industries that lack quality-control tests for their products.
Author Contributions
L.M.K., J.L. and J.B. performed the experiments; L.M.K. and S.L. analyzed the data; L.M.K. and B.-K.C. wrote the paper.
Funding
This research was partially supported by Samsung Electronics Co., Ltd and by a grant from the collaborative research project Program (No. PJ011815), Rural Development Administration, Republic of Korea.
Conflicts of Interest
The authors declare no conflicts of interest.
References
- Xazela, N.; Hugo, A.; Marume, U.; Muchenje, V. Perceptions of Rural Consumers on the Aspects of Meat Quality and Health Implications Associated with Meat Consumption. Sustainability 2017, 9, 830. [Google Scholar] [CrossRef]
- Xiong, Z.; Sun, D.-W.; Pu, H.; Gao, W.; Dai, Q. Applications of emerging imaging techniques for meat quality and safety detection and evaluation: A review. Crit. Rev. Food Sci. Nutr. 2017, 57, 755–768. [Google Scholar] [CrossRef] [PubMed]
- Font-i-Furnols, M.; Guerrero, L. Consumer preference, behavior and perception about meat and meat products: An overview. Meat Sci. 2014, 98, 361–371. [Google Scholar] [CrossRef] [PubMed]
- Prieto, N.; Roehe, R.; Lavín, P.; Batten, G.; Andrés, S. Application of near infrared reflectance spectroscopy to predict meat and meat products quality: A review. Meat Sci. 2009, 83, 175–186. [Google Scholar] [CrossRef] [PubMed]
- Joo, S.T.; Kim, G.D.; Hwang, Y.H.; Ryu, Y.C. Control of fresh meat quality through manipulation of muscle fiber characteristics. Meat Sci. 2013, 95, 828–836. [Google Scholar] [CrossRef] [PubMed]
- Kadim, I.T.; Mahgoub, O.; Al-Marzooqi, W.; Annamalai, K. Prediction of Crude Protein, Extractable Fat, Calcium and Phosphorus Contents of Broiler Chicken Carcasses Using Near-infrared Reflectance Spectroscopy. Asian Australas. J. Anim. Sci. 2005, 18, 1036–1040. [Google Scholar] [CrossRef]
- Kucha, C.T.; Liu, L.; Ngadi, M.O. Non-Destructive Spectroscopic Techniques and Multivariate Analysis for Assessment of Fat Quality in Pork and Pork Products: A Review. Sensors 2018, 18, 377. [Google Scholar] [CrossRef] [PubMed]
- Narsaiah, K.; Jha, S.N. Nondestructive methods for quality evaluation of livestock products. J. Food Sci. Technol. 2012, 49, 342–348. [Google Scholar] [CrossRef] [PubMed]
- Ahmed, M.R.; Yasmin, J.; Lee, W.H.; Mo, C.; Cho, B.K. Imaging Technologies for Nondestructive Measurement of Internal Properties of Agricultural Products: A Review. J. Biosyst. Eng. 2017, 42, 199–216. [Google Scholar]
- Mo, C.; Lim, J.; Kwon, S.W.; Lim, D.K.; Kim, M.S.; Kim, G.; Kang, J.; Kwon, K.-D.; Cho, B.K. Hyperspectral Imaging and Partial Least Square Discriminant Analysis for Geographical Origin Discrimination of White Rice. J. Biosyst. Eng. 2017, 42, 293–300. [Google Scholar]
- Qin, J.; Kim, M.S.; Chao, K.; Cho, B.-K. Raman Chemical Imaging Technology for Food and Agricultural Applications. J. Biosyst. Eng. 2017, 42, 170–189. [Google Scholar]
- Wang, W.; Paliwal, J. Near-infrared spectroscopy and imaging in food quality and safety. Sens. Instrum. Food Qual. Saf. 2007, 1, 193–207. [Google Scholar] [CrossRef]
- Qu, J.H.; Liu, D.; Cheng, J.H.; Sun, D.W.; Ma, J.; Pu, H.; Zeng, X.A. Applications of Near-infrared Spectroscopy in Food Safety Evaluation and Control: A Review of Recent Research Advances. Crit. Rev. Food Sci. Nutr. 2015, 55, 1939–1954. [Google Scholar] [CrossRef] [PubMed]
- Kandpal, L.M.; Lee, H.; Kim, M.S.; Mo, C.; Cho, B.K. Hyperspectral reflectance imaging technique for visualization of moisture distribution in cooked chicken breast. Sensors 2013, 13, 13289–13300. [Google Scholar] [CrossRef] [PubMed]
- Naganathan, G.K.; Grimes, L.M.; Subbiah, J.; Calkins, C.R.; Samal, A.; Meyer, G.E. Visible/near-infrared hyperspectral imaging for beef tenderness prediction. Comput. Electron. Agric. 2008, 64, 225–233. [Google Scholar] [CrossRef]
- Balage, J.M.; da Luz e Silva, S.; Gomide, C.A.; Bonin Mde, N.; Figueira, A.C. Predicting pork quality using Vis/NIR spectroscopy. Meat Sci. 2015, 108, 37–43. [Google Scholar] [CrossRef] [PubMed]
- ElMasry, G.; Sun, D.-W.; Allen, P. Non-destructive determination of water-holding capacity in fresh beef by using NIR hyperspectral imaging. Food Res. Int. 2011, 44, 2624–2633. [Google Scholar] [CrossRef]
- De Marchi, M.; Penasa, M.; Cecchinato, A.; Bittante, G. The relevance of different near infrared technologies and sample treatments for predicting meat quality traits in commercial beef cuts. Meat Sci. 2013, 93, 329–335. [Google Scholar] [CrossRef] [PubMed]
- Alamprese, C.; Casale, M.; Sinelli, N.; Lanteri, S.; Casiraghi, E. Detection of minced beef adulteration with turkey meat by UV–vis, NIR and MIR spectroscopy. LWT Food Sci. Technol. 2013, 53, 225–232. [Google Scholar] [CrossRef]
- Tøgersen, G.; Arnesen, J.F.; Nilsen, B.N.; Hildrum, K.I. On-line prediction of chemical composition of semi-frozen ground beef by non-invasive NIR spectroscopy. Meat Sci. 2003, 63, 515–523. [Google Scholar] [CrossRef]
- Lohumi, S.; Lee, S.; Lee, H.; Kim, M.S.; Lee, W.H.; Cho, B.K. Application of hyperspectral imaging for characterization of intramuscular fat distribution in beef. Infrared Phys. Technol. 2016, 74, 1–10. [Google Scholar] [CrossRef]
- Feng, C.H.; Makino, Y.; Oshita, S.; García Martín, J.F. Hyperspectral imaging and multispectral imaging as the novel techniques for detecting defects in raw and processed meat products: Current state-of-the-art research advances. Food Control 2018, 84, 165–176. [Google Scholar] [CrossRef]
- Panagou, E.Z.; Papadopoulou, O.; Carstensen, J.M.; Nychas, G.-J.E. Potential of multispectral imaging technology for rapid and non-destructive determination of the microbiological quality of beef filets during aerobic storage. Int. J. Food Microbiol. 2014, 174, 1–11. [Google Scholar] [CrossRef] [PubMed]
- Barbin, D.F.; ElMasry, G.; Sun, D.W.; Allen, P. Non-destructive determination of chemical composition in intact and minced pork using near-infrared hyperspectral imaging. Food Chem. 2013, 138, 1162–1171. [Google Scholar] [CrossRef] [PubMed]
- Varmuza, K.; Filzmoser, P. Introduction to Multivariate Statistical Analysis in Chemometrics, 1st ed.; CRC Press: Boca Raton, FL, USA, 2009; p. 321. [Google Scholar]
- Xiao, H.; Sun, K.; Sun, Y.; Wei, K.; Tu, K.; Pan, L. Comparison of benchtop fourier-transform (FT) and protable grating scanning spactrometers for determination of total soluable solid contents in single grape berry (Vitis vinifera L.) and calibraiton transfer. Sensors 2017, 17, 2693. [Google Scholar]
- Coen, T.; Saeys, W.; Ramon, H.; De Baerdemaeker, J. Optimizing the tuning parameters of least squares support vector machines regression for NIR spectra. J. Chemom. 2006, 20, 184–192. [Google Scholar] [CrossRef]
- Thissen, U.; Üstün, B.; Melssen, W.J.; Buydens, L.M.C. Multivariate Calibration with Least-Squares Support Vector Machines. Anal. Chem. 2004, 76, 3099–3105. [Google Scholar] [CrossRef] [PubMed]
- Kandpal, L.M.; Lohumi, S.; Kim, M.S.; Kang, J.-S.; Cho, B.K. Near-infrared hyperspectral imaging system coupled with multivariate methods to predict viability and vigor in muskmelon seeds. Sensors Actuators B Chem. 2016, 229, 534–544. [Google Scholar] [CrossRef]
- ElMasry, G.; Sun, D.W.; Allen, P. Near-infrared hyperspectral imaging for predicting colour, pH and tenderness of fresh beef. J. Food Eng. 2012, 110, 127–140. [Google Scholar] [CrossRef]
- Chen, D.; Shao, X.; Hu, B.; Su, Q. Simultaneous wavelength selection and outlier detection in multivariate regression of near-infrared spectra. Anal. Sci. 2005, 21, 161–166. [Google Scholar] [CrossRef] [PubMed]
- Liu, Z.; Cai, W.; Shao, X. Outlier detection in near-infrared spectroscopic analysis by using Monte Carlo cross-validation. Sci. China Ser. B Chem. 2008, 51, 751–759. [Google Scholar] [CrossRef]
- Tøgersen, G.; Isaksson, T.; Nilsen, B.N.; Bakker, E.A.; Hildrum, K.I. On-line NIR analysis of fat, water and protein in industrial scale ground meat batches. Meat Sci. 1999, 51, 97–102. [Google Scholar] [CrossRef]
© 2019 by the authors. Licensee MDPI, Basel, Switzerland. This article is an open access article distributed under the terms and conditions of the Creative Commons Attribution (CC BY) license (http://creativecommons.org/licenses/by/4.0/).