A Modeling Framework to Investigate the Influence of Fouling on the Dynamic Characteristics of PID-Controlled Heat Exchangers and Their Networks


Abstract
1. Introduction
2. Materials and Methods
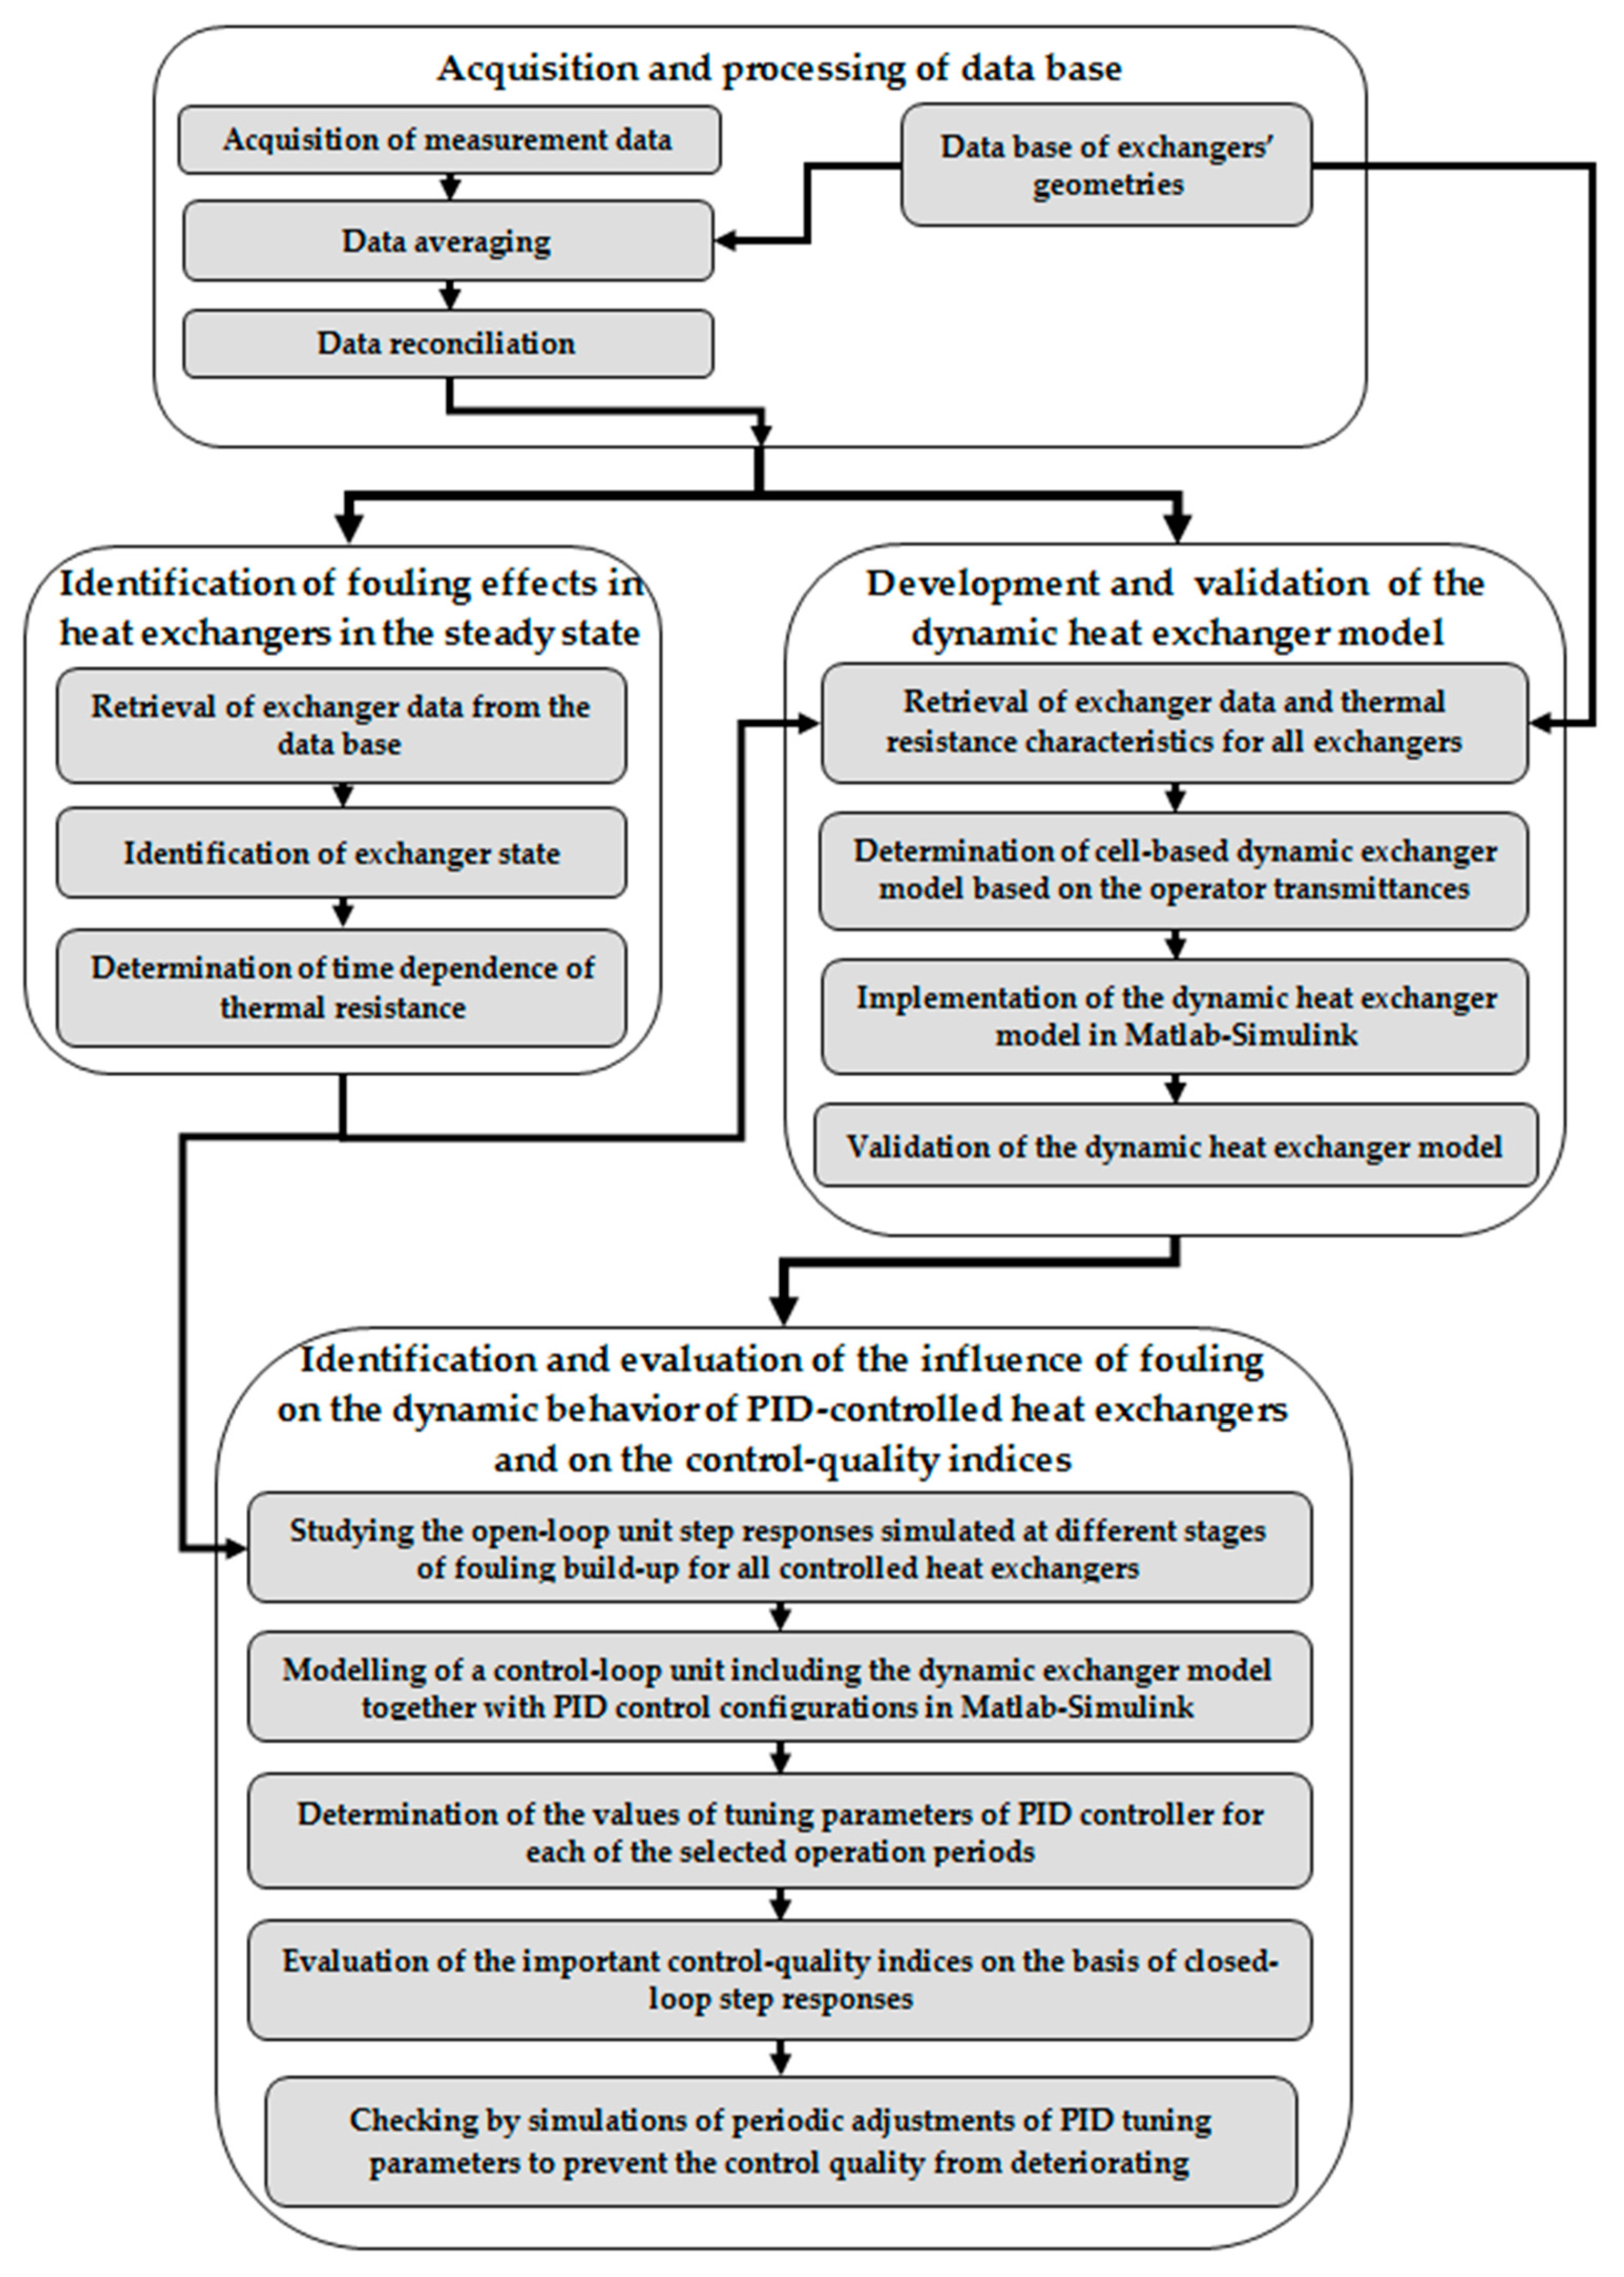
2.1. Stage 1—Acquisition and Pre-processing of the Data Base
2.2. Stage 2—Identification of fouling effects in HEs in the steady state
2.3. Stage 3—Development and Validation of the Dynamic HE Model
- Determination of a cell-based dynamic HE model based on the operator transmittances. By solving the equations of the mathematical model, relationships employing operator transmittances can be obtained between disturbances occurring at cell inlet and changes in temperature at the cell outlet. Operator transmittance G(s) is a widely used tool for describing a dynamic system. This step is extensively described in Section 2 of the authors’ previous work [6].
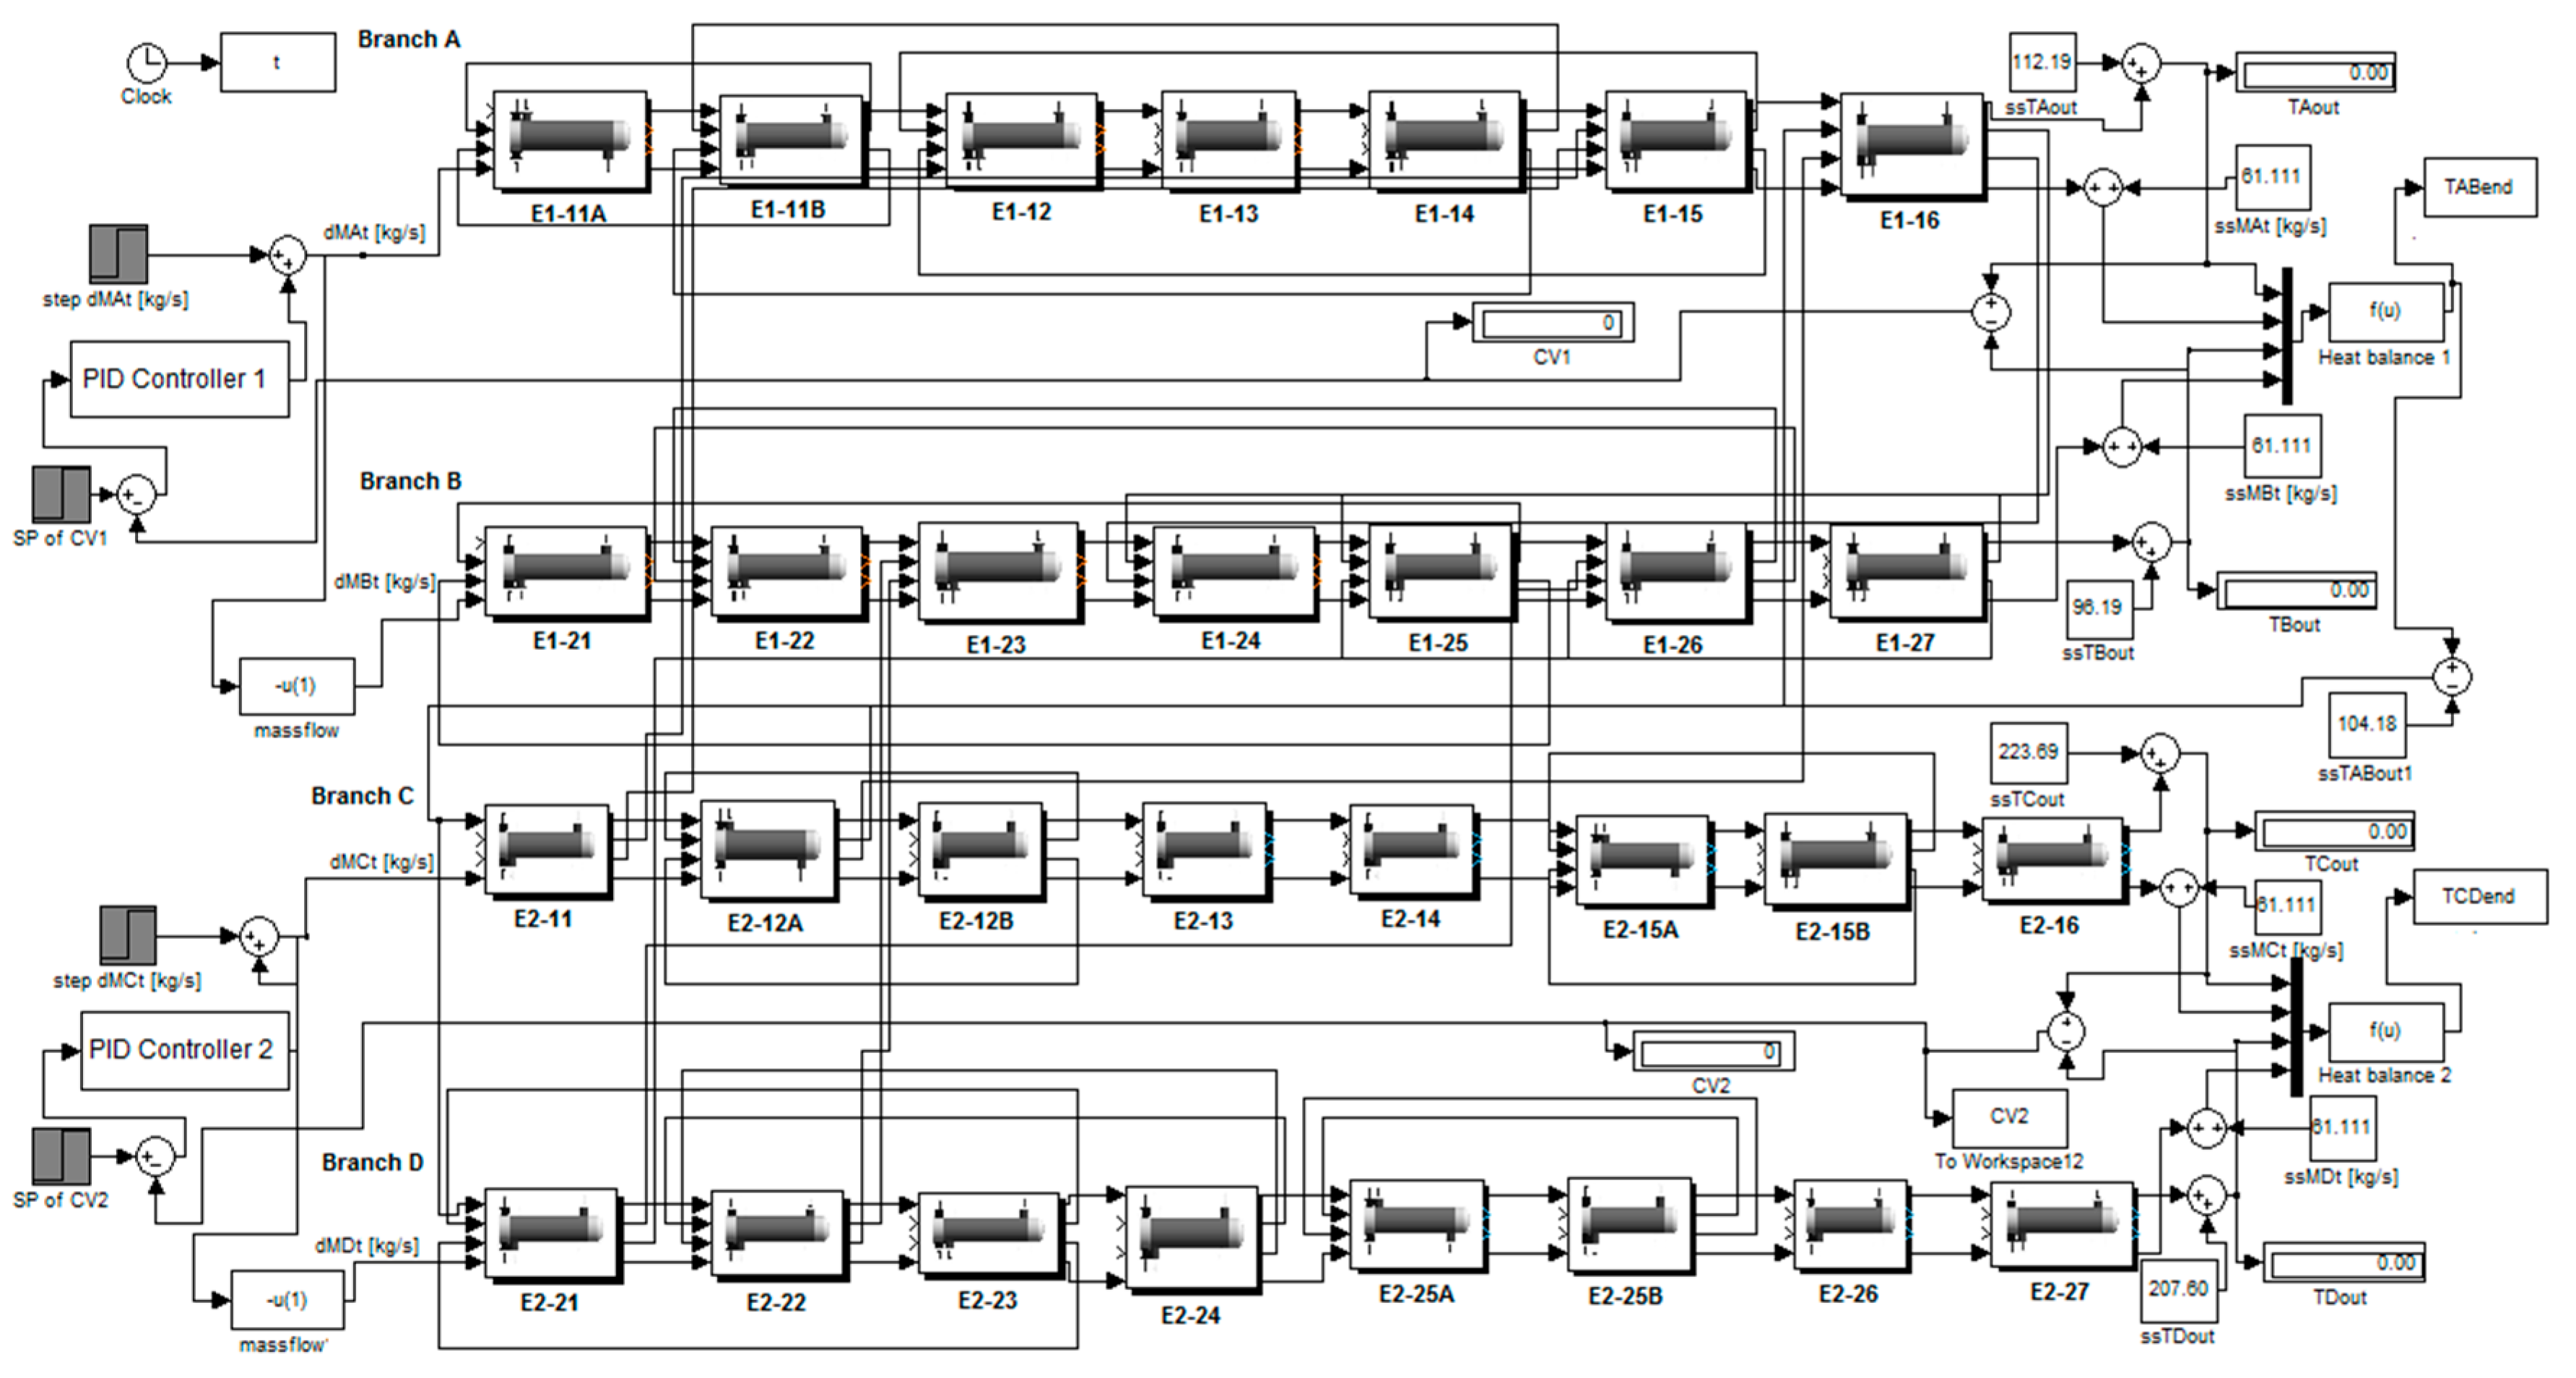
- Implementation of the dynamic HE model. Starting from HEN block diagram in which the role of operator transmittances was visualized and using MATLAB/Simulink program package, a software module was developed to simulate the performance of HEN control. In order to make simulation possible, a database is needed for providing the values of relevant parameters in all the cells at steady state (from stage 2), of all the HEs in the HEN. This step is extensively described in Section 2.2 of the authors’ previous work [6].
- Validation of the dynamic HE model using operational data of a real-life HEN coupled with a CDU. The values of simulated and real temperature at heat exchanger outlet in transient states of the exchanger were compared and found to be in close agreement. This step is in more detail described in Section 3 of the authors’ previous work [6].
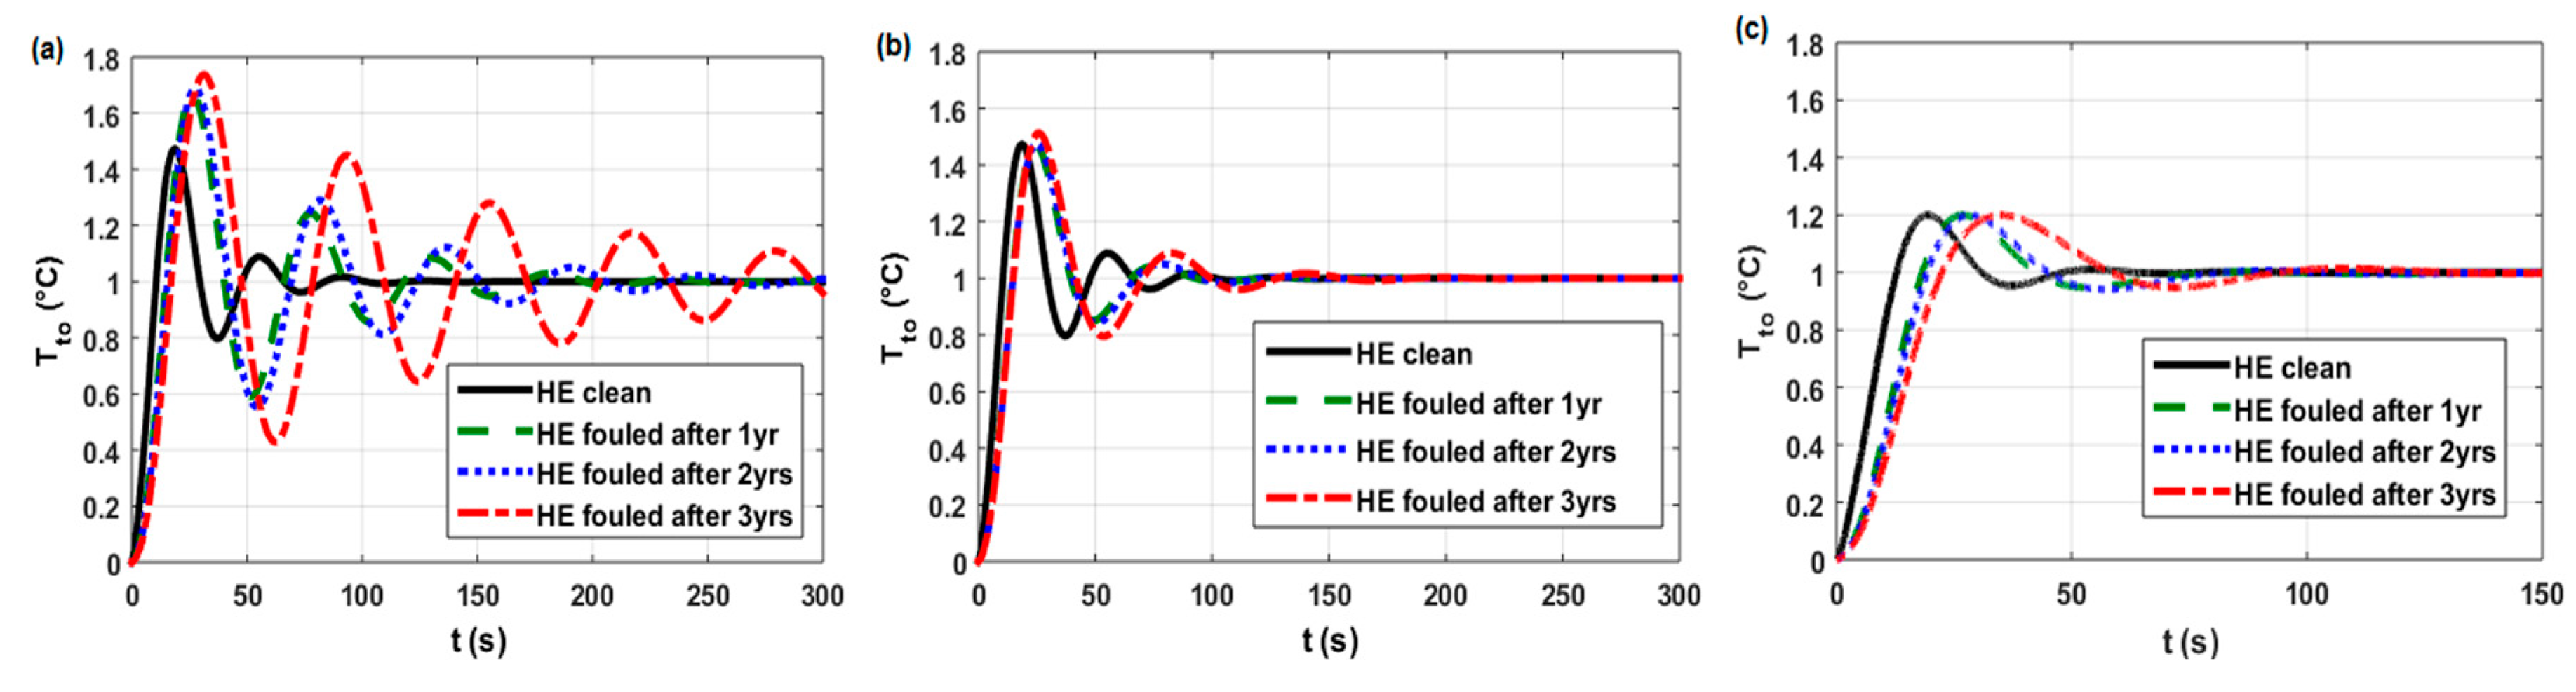
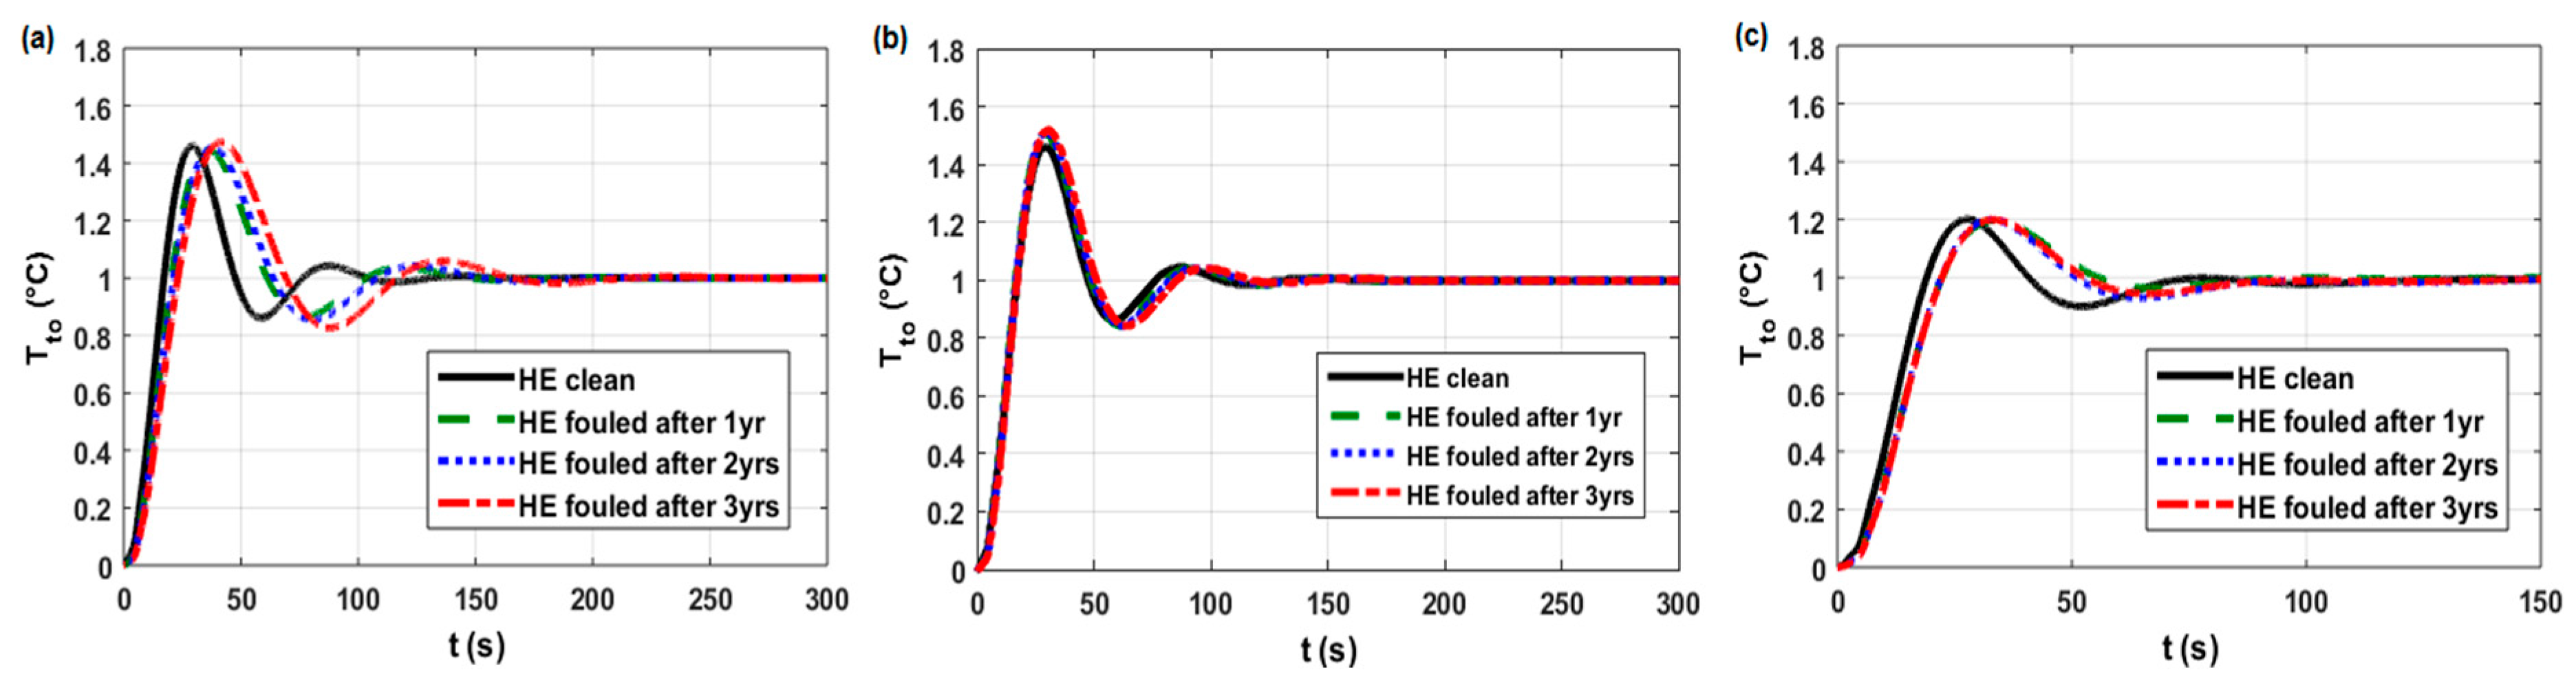
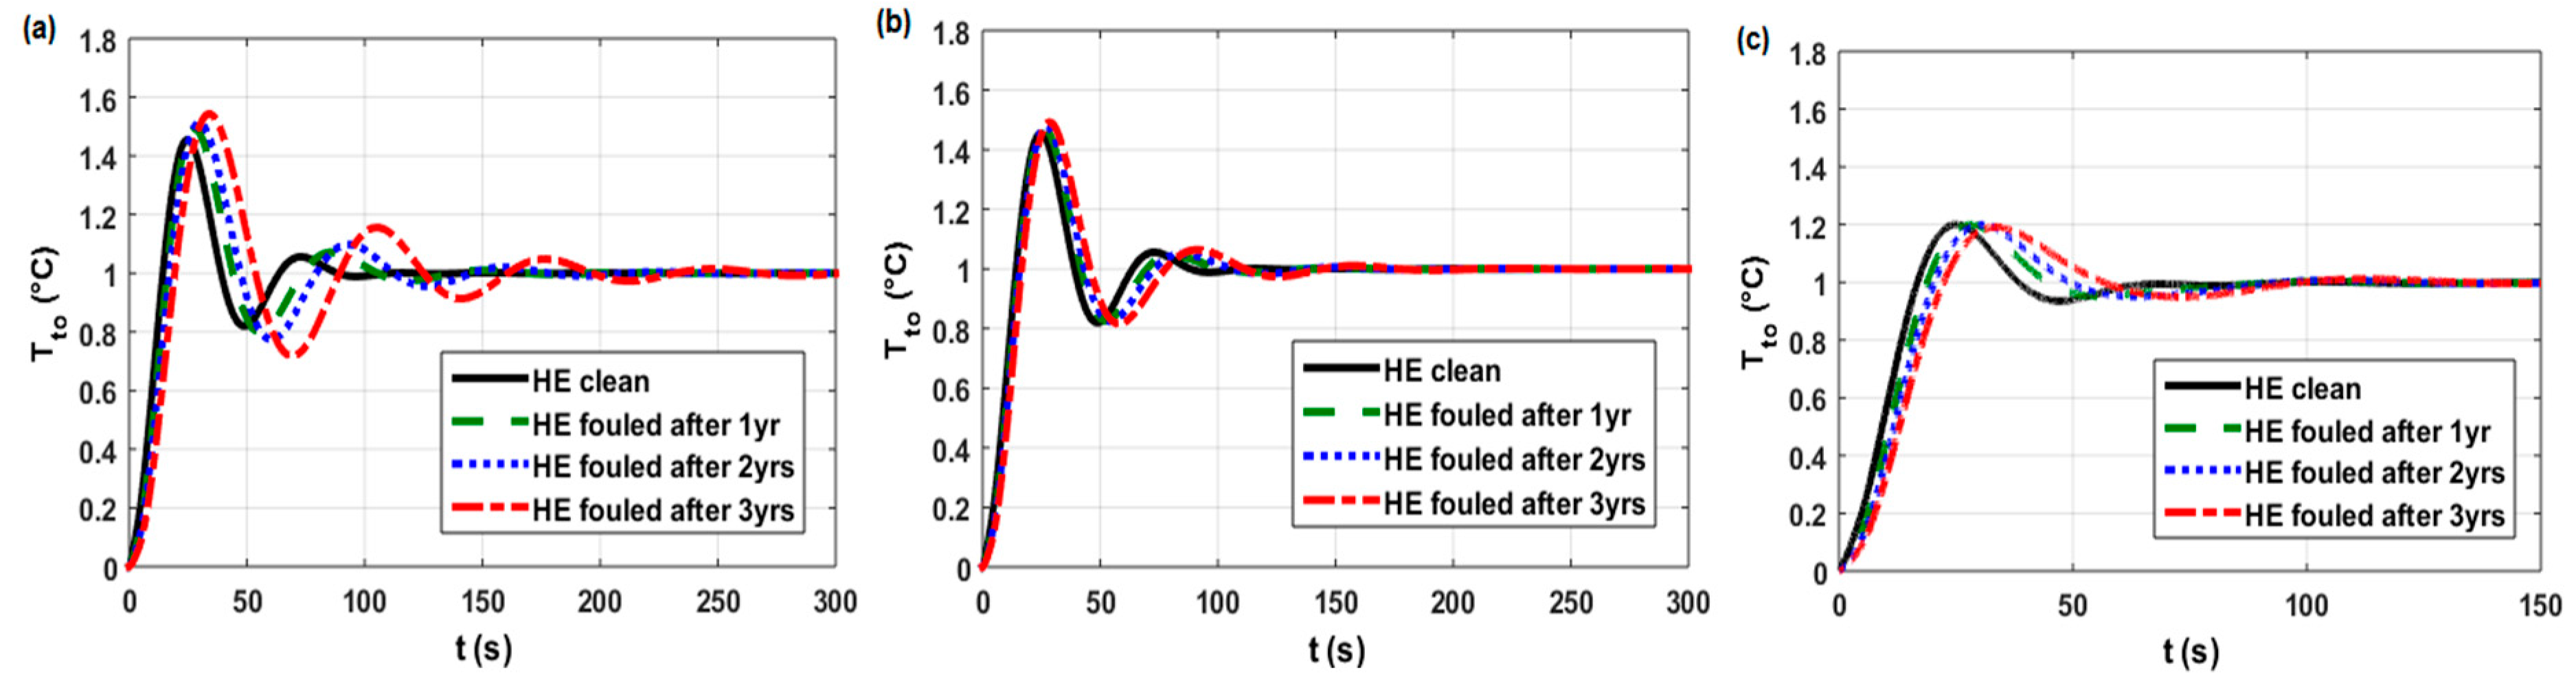
2.4. Stage 4—Identification and Evaluation of the Influence of Fouling on the Dynamic Behavior of PID-Controlled HEs and on the Control-Quality Indices
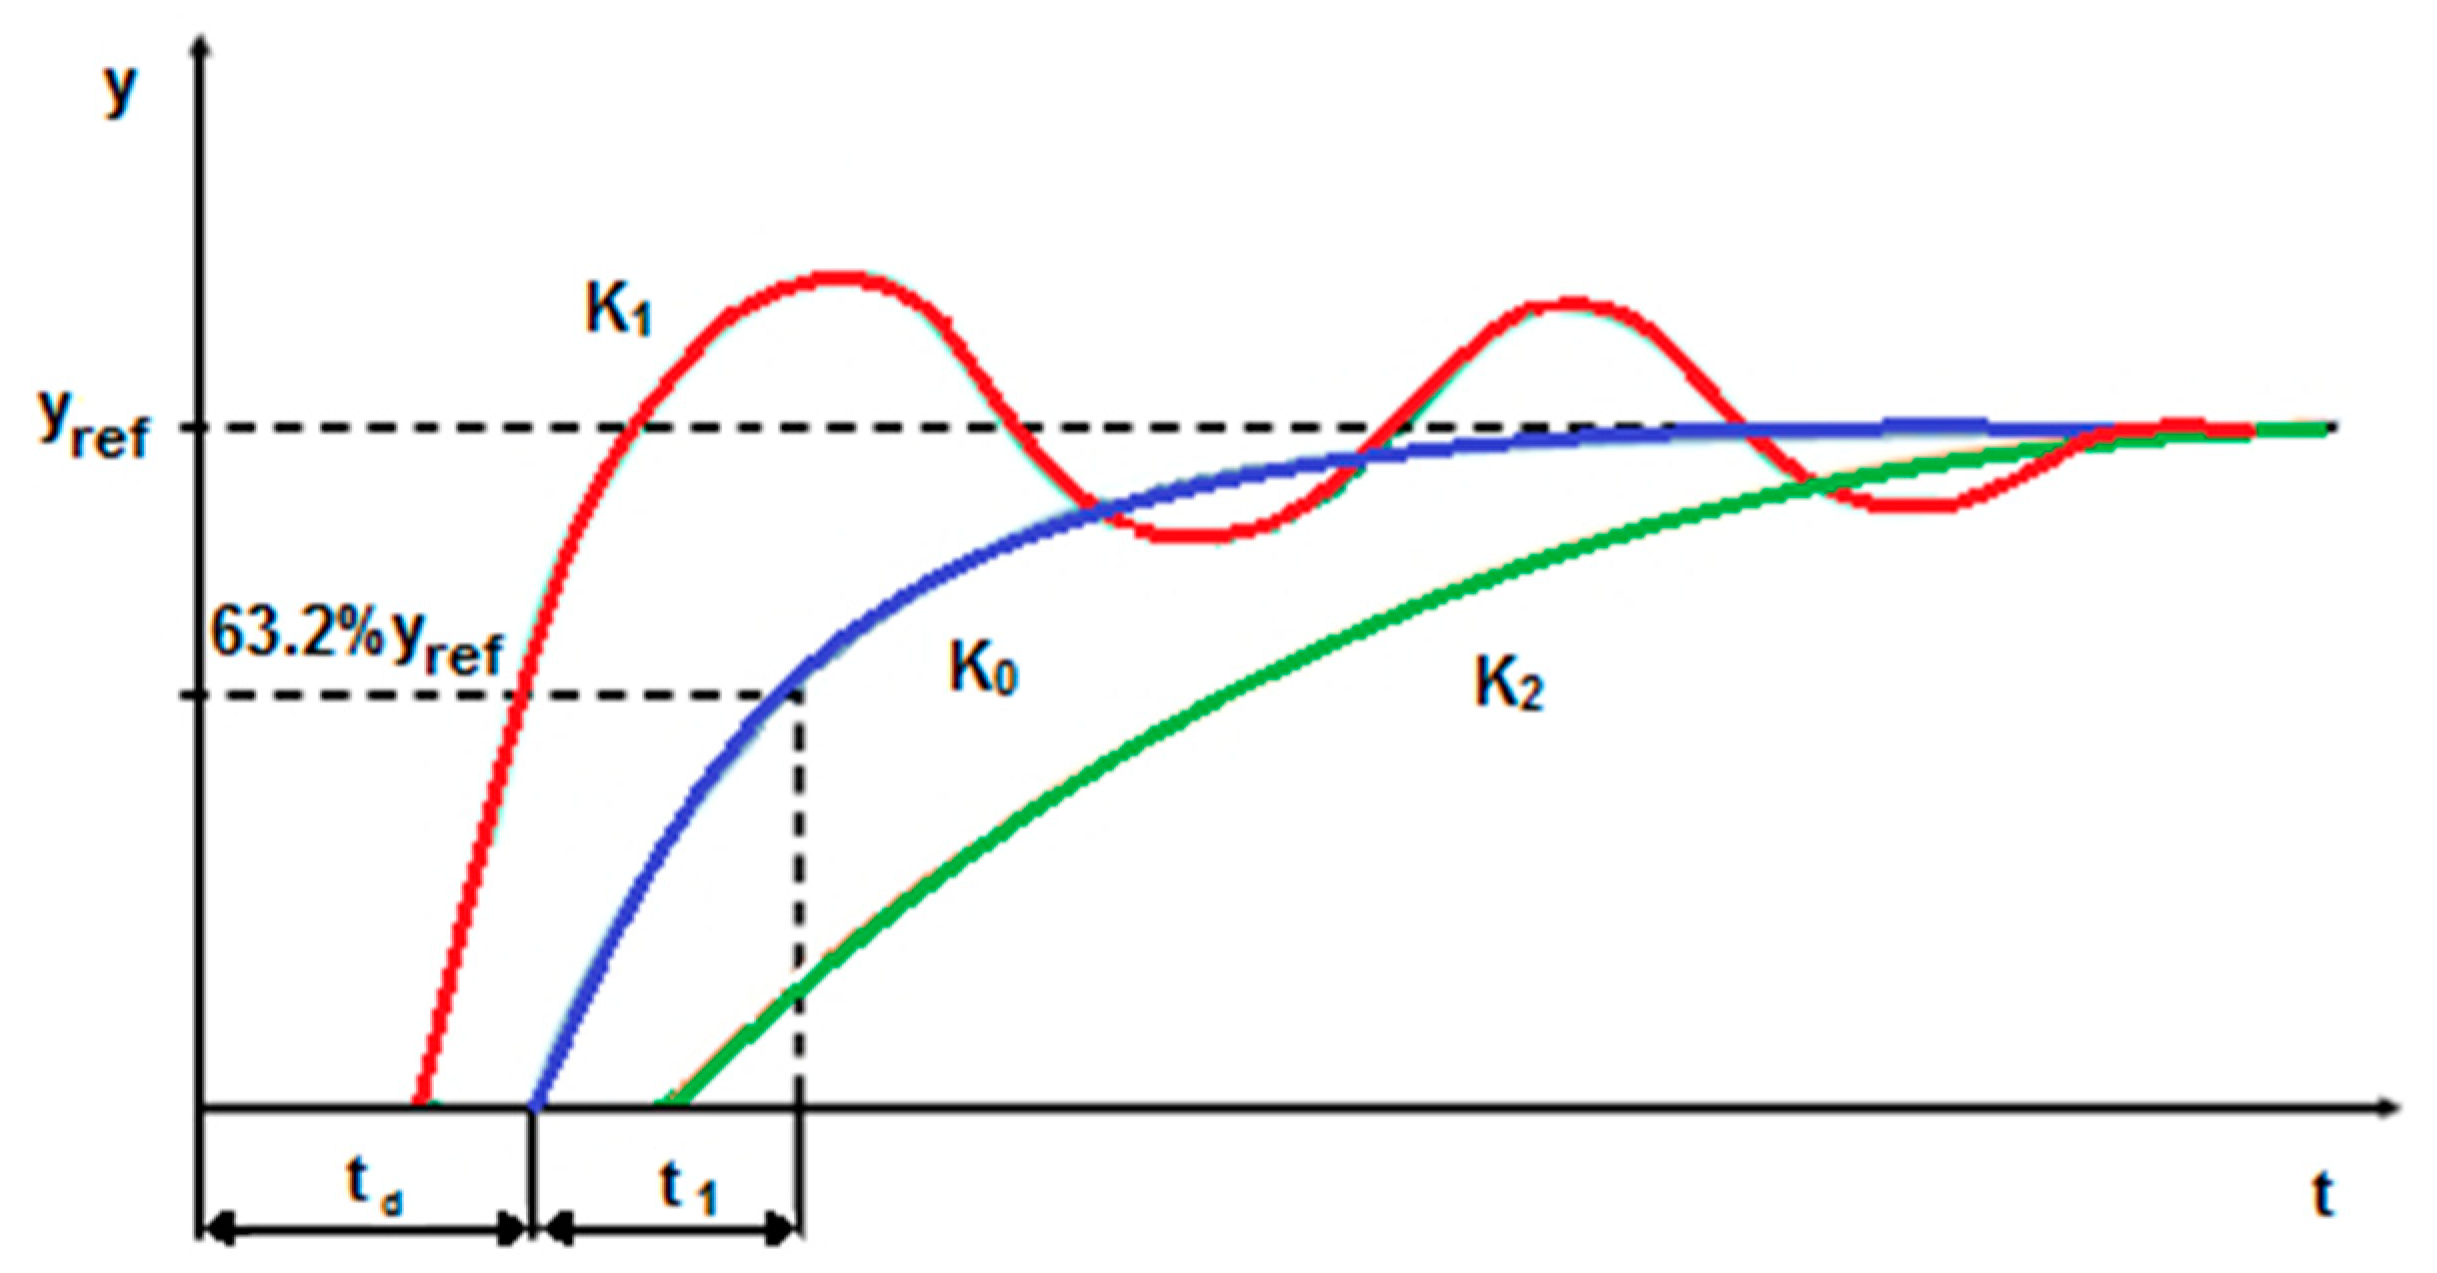
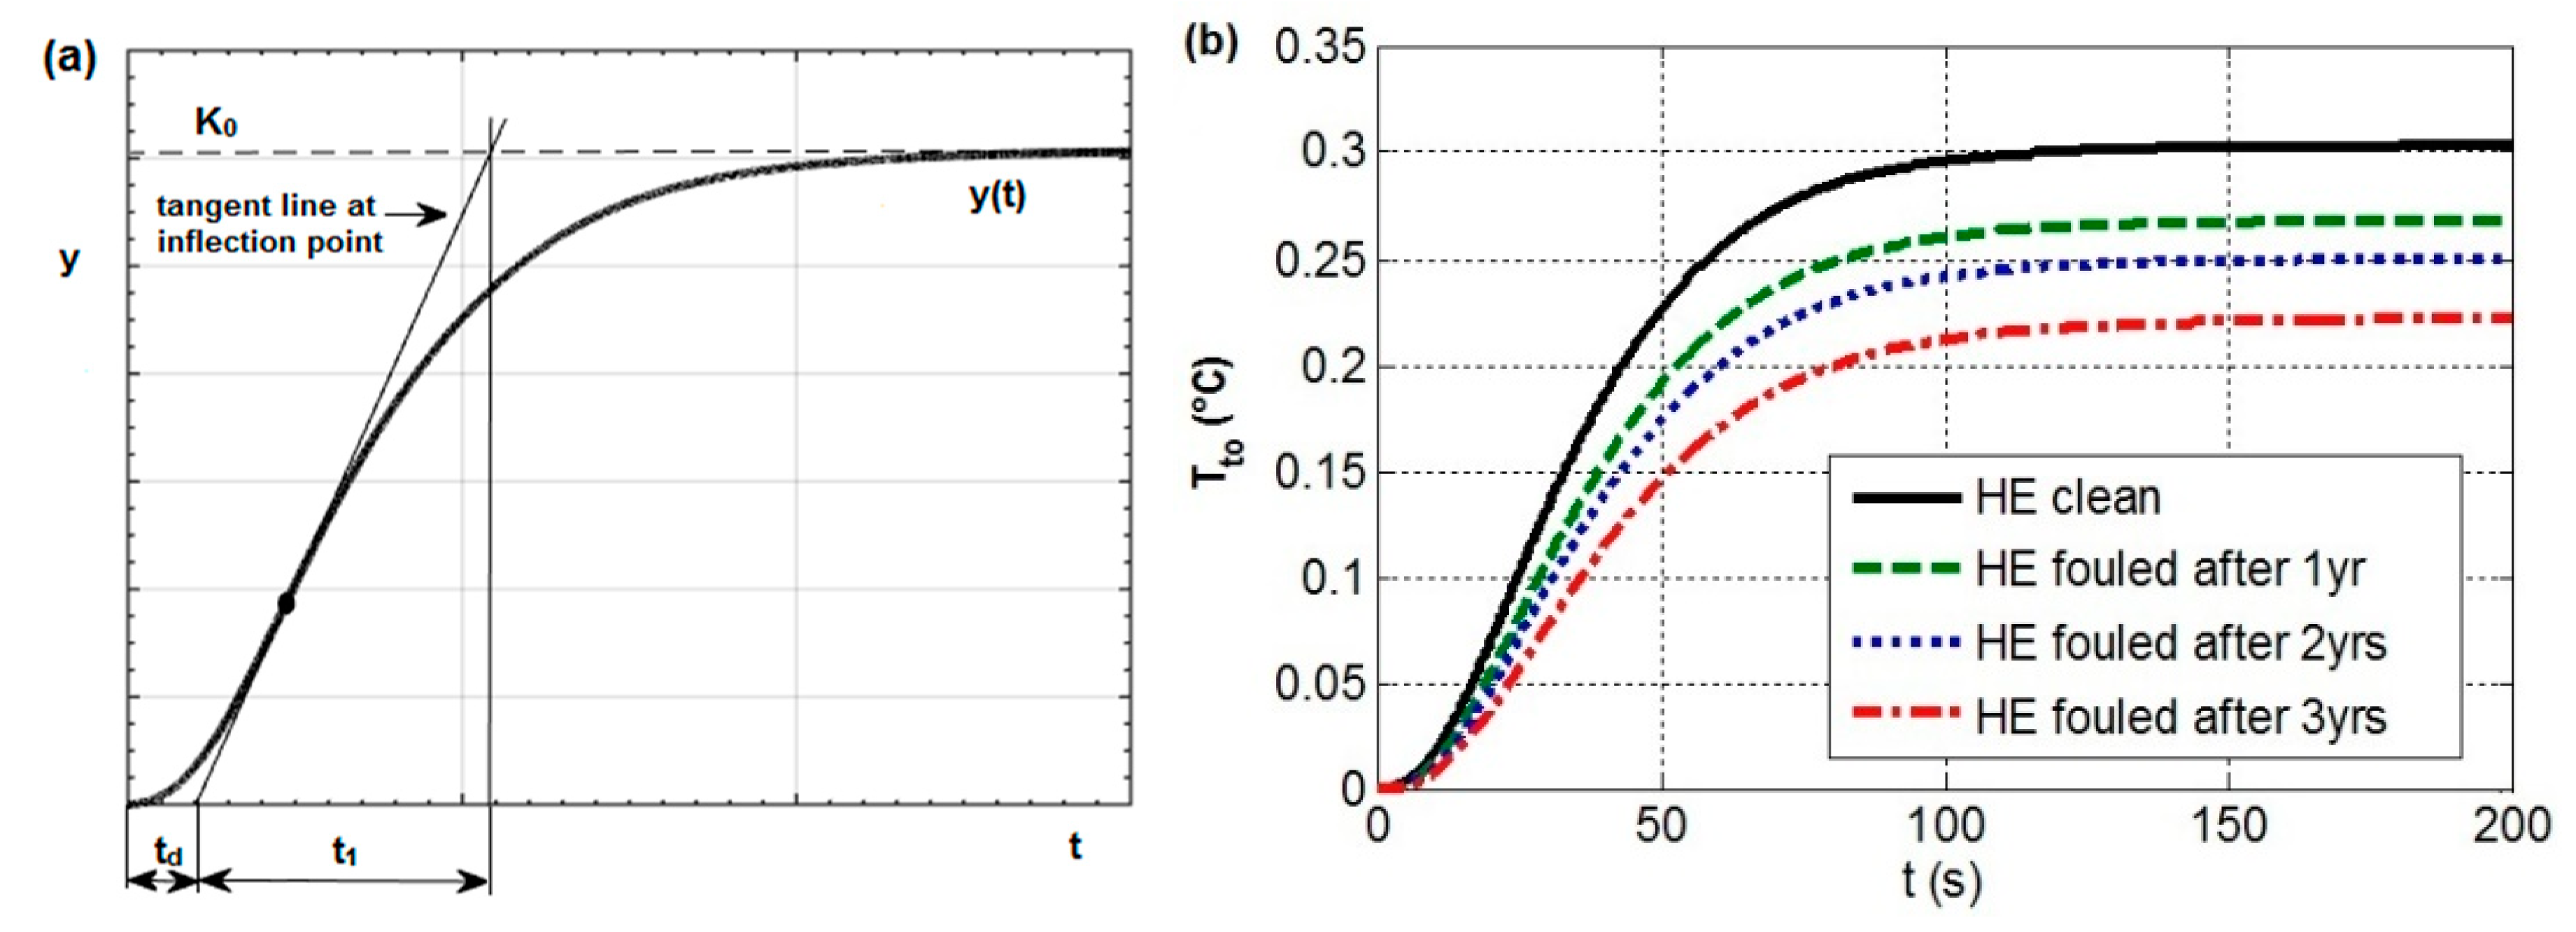
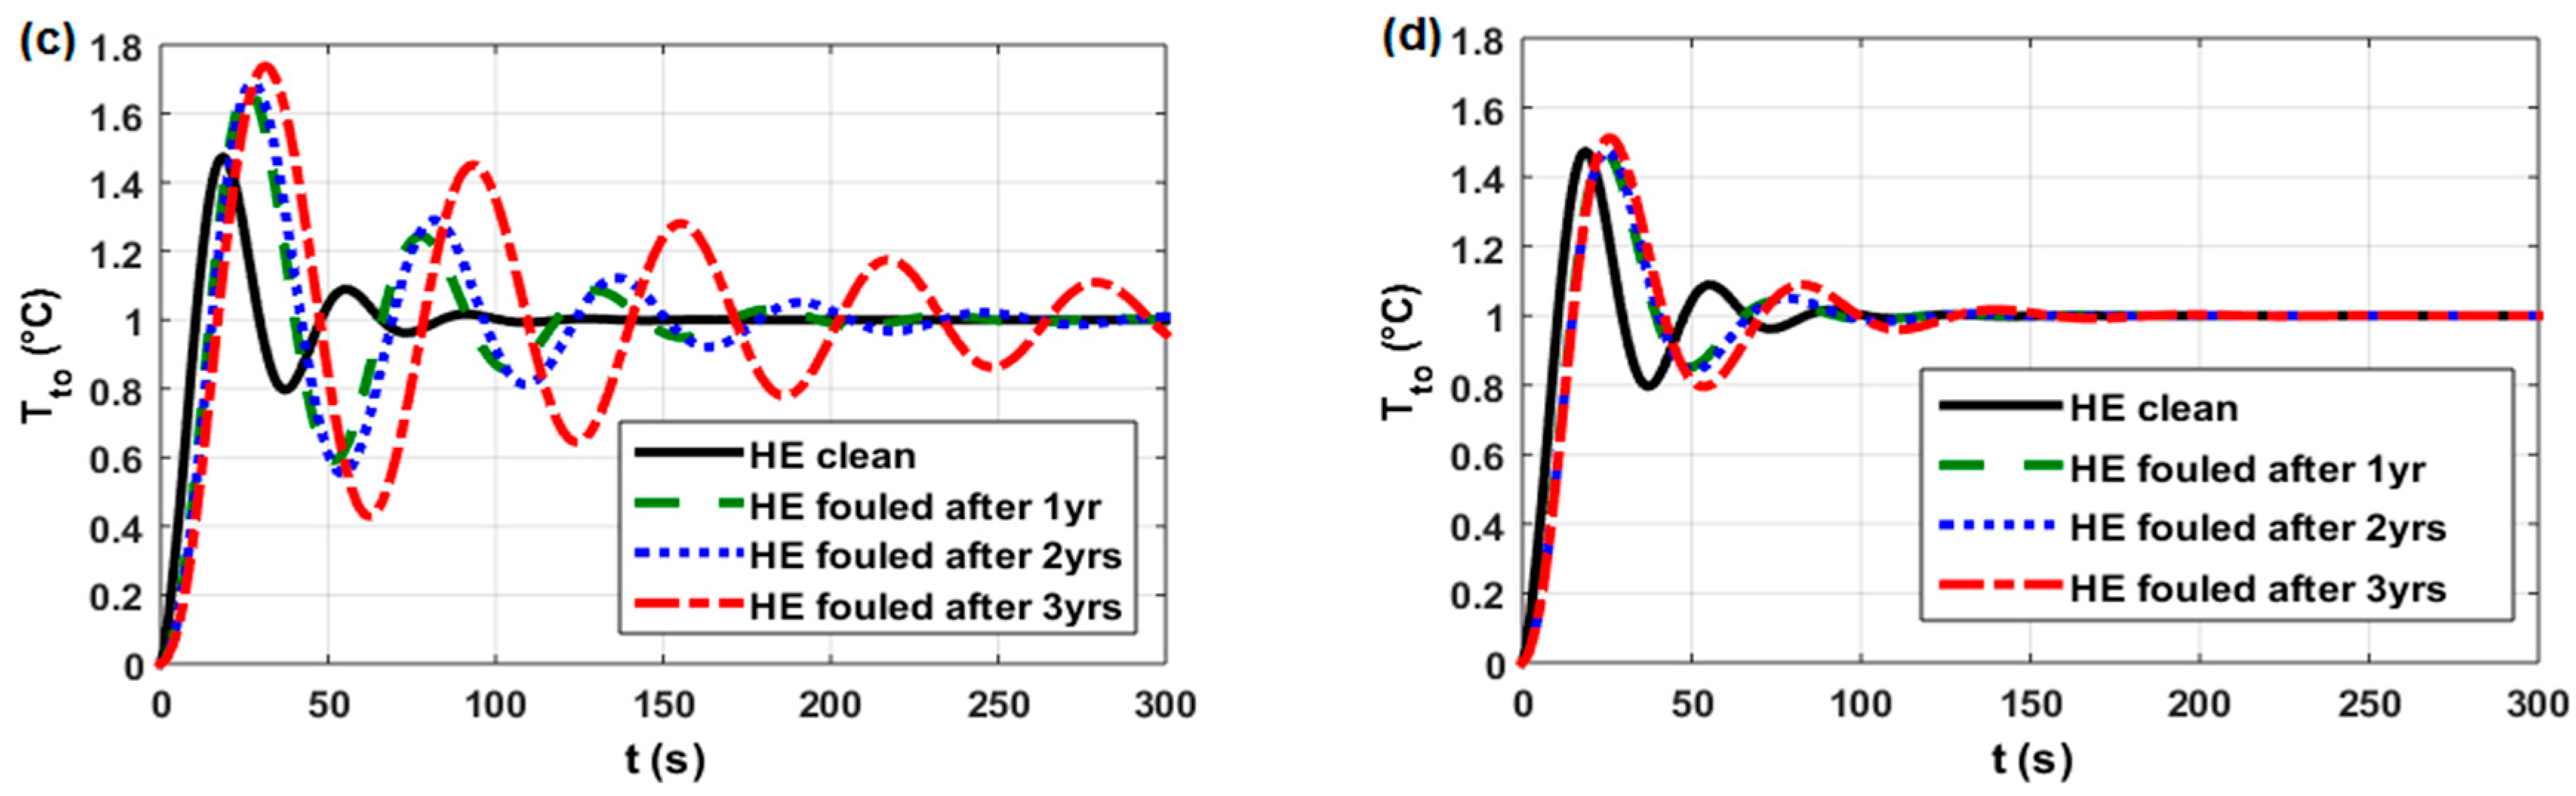
- Overshoot Mp—percentage of the maximum deviation of step response y(t) from its steady-state value:where: ymax − y(t) at its maximum, yss − y(t) at steady state (yss ≤ ymax). The value of overshoot is determined during control-system design and may be used as a measure of system stability; large overshoot values are not recommended.Mp = ((ymax − yss)/yss) × 100%,
- Peak time tp—time interval to the maximum of y(t), that is, y(tp) = ymax.
- Delay time td—time interval to the step response reaching 50% of its value at steady state, that is, y(td) = 0.5 yss.
- Rise time tr—time interval to the step response reaching 80% of its value at steady state, that is, y(tr) = 0.8 yss.
- Settling time ts—time interval to the step response staying within the tolerance margin of its steady-state value, usually yss ± 5% (see Figure 7b).
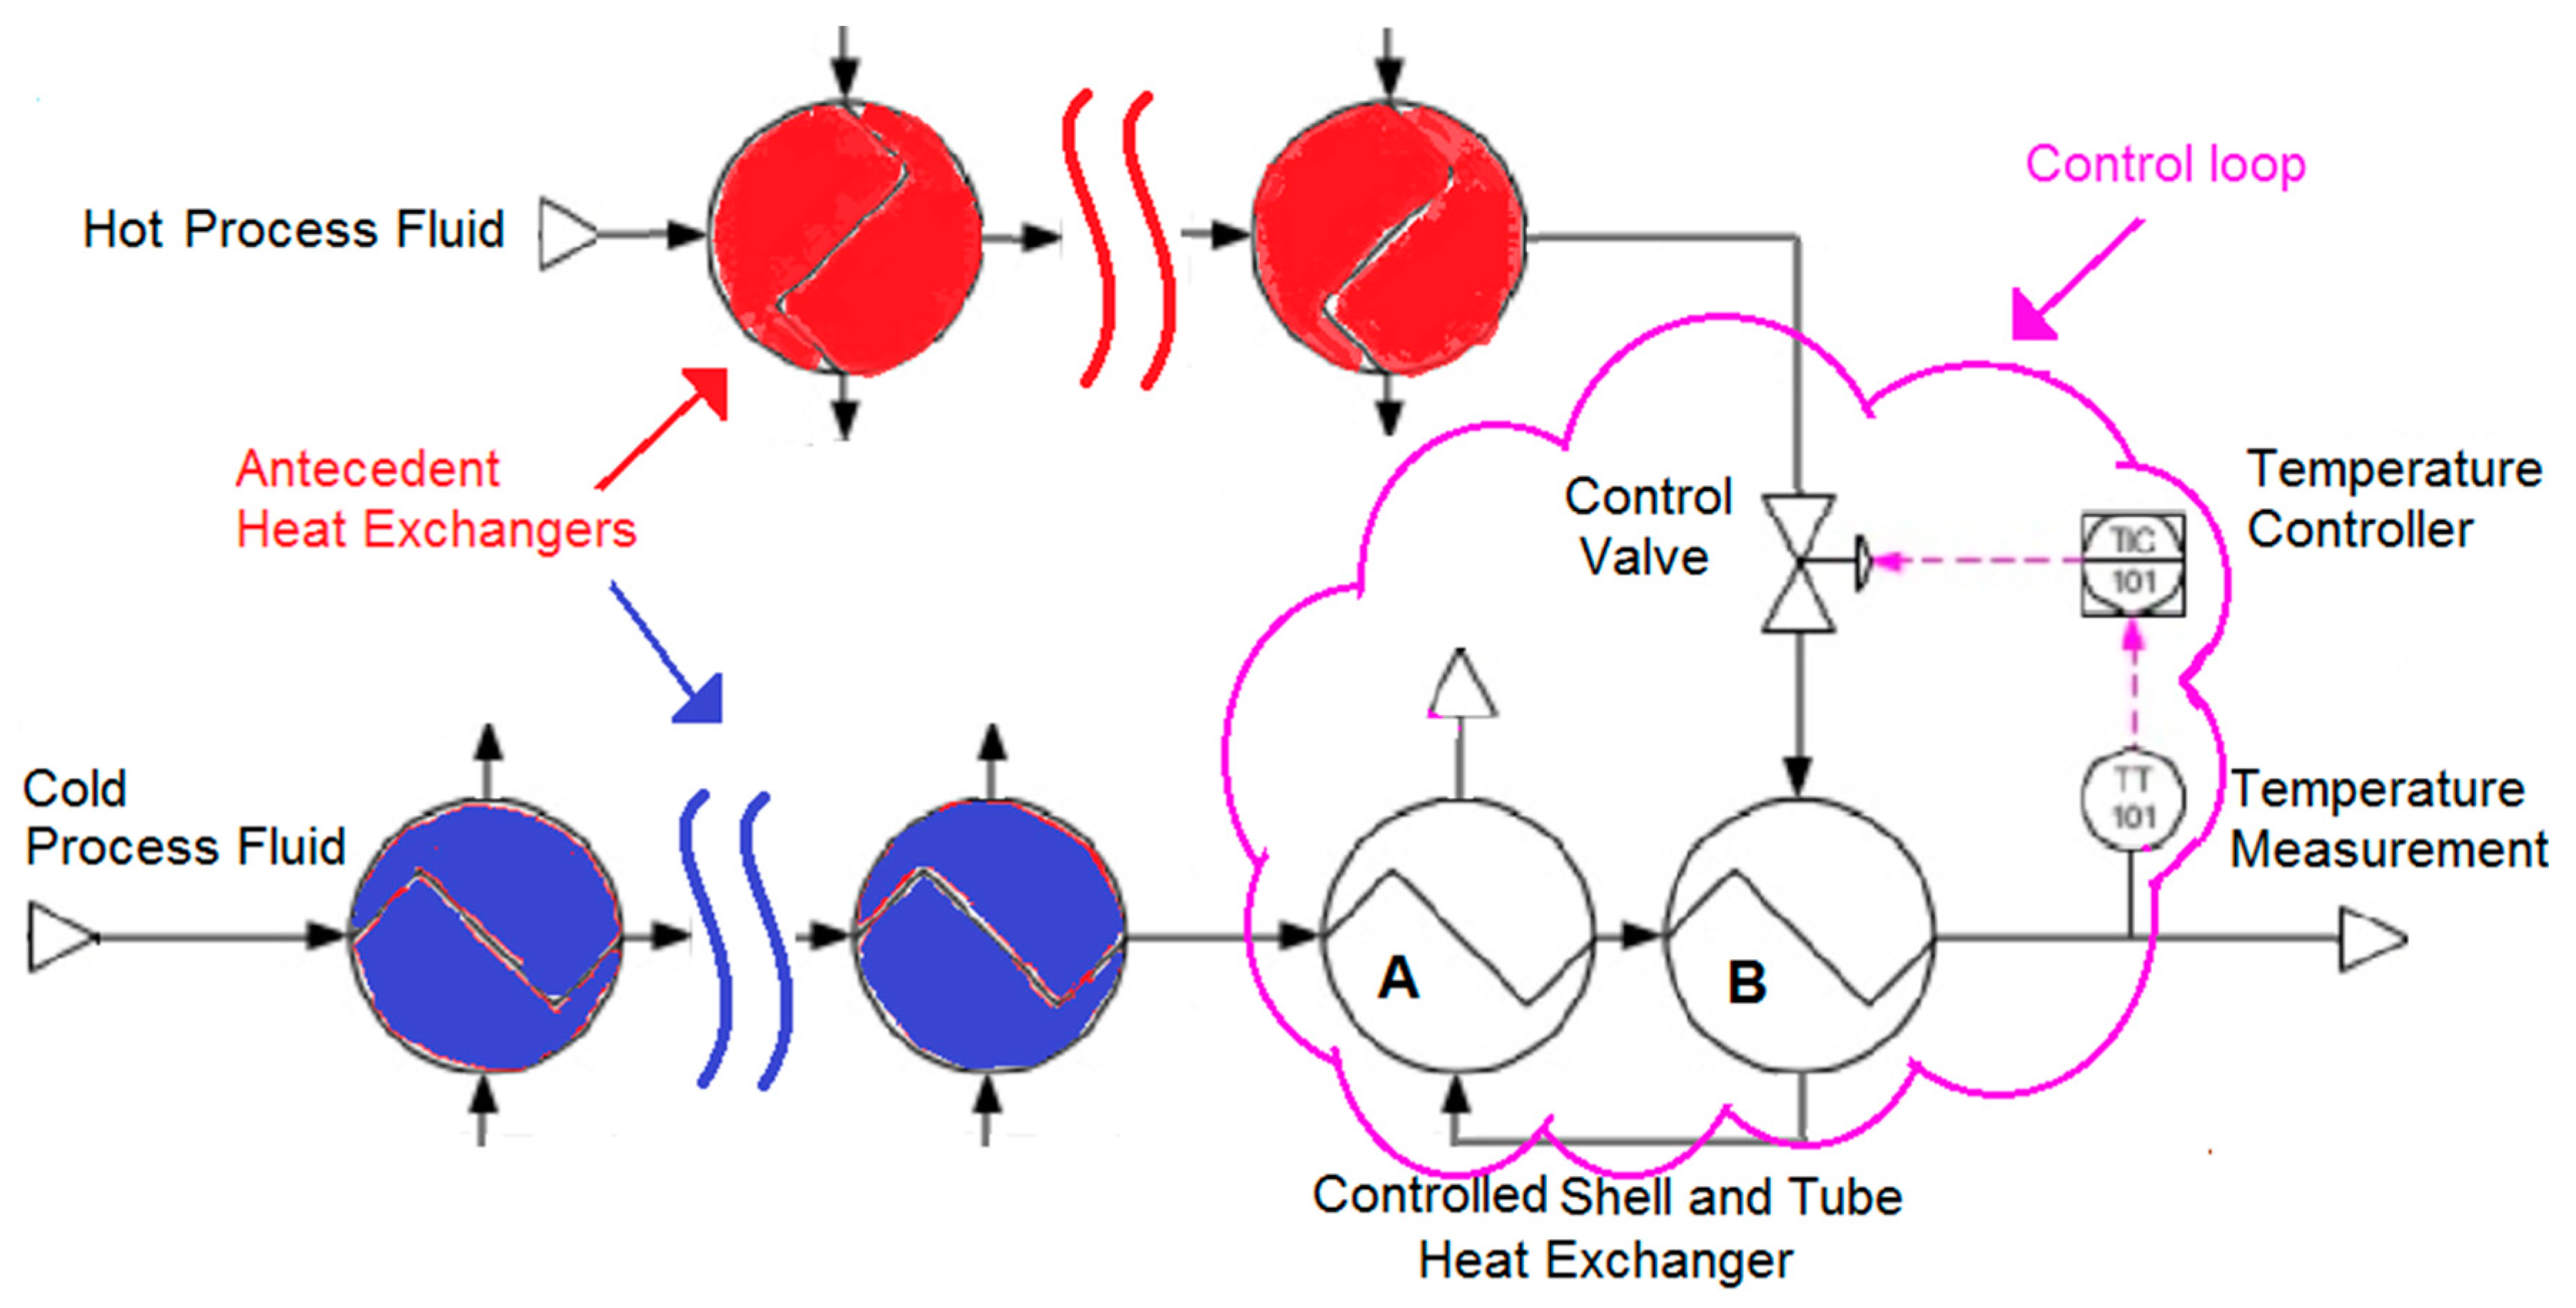
3. Case Study—Results
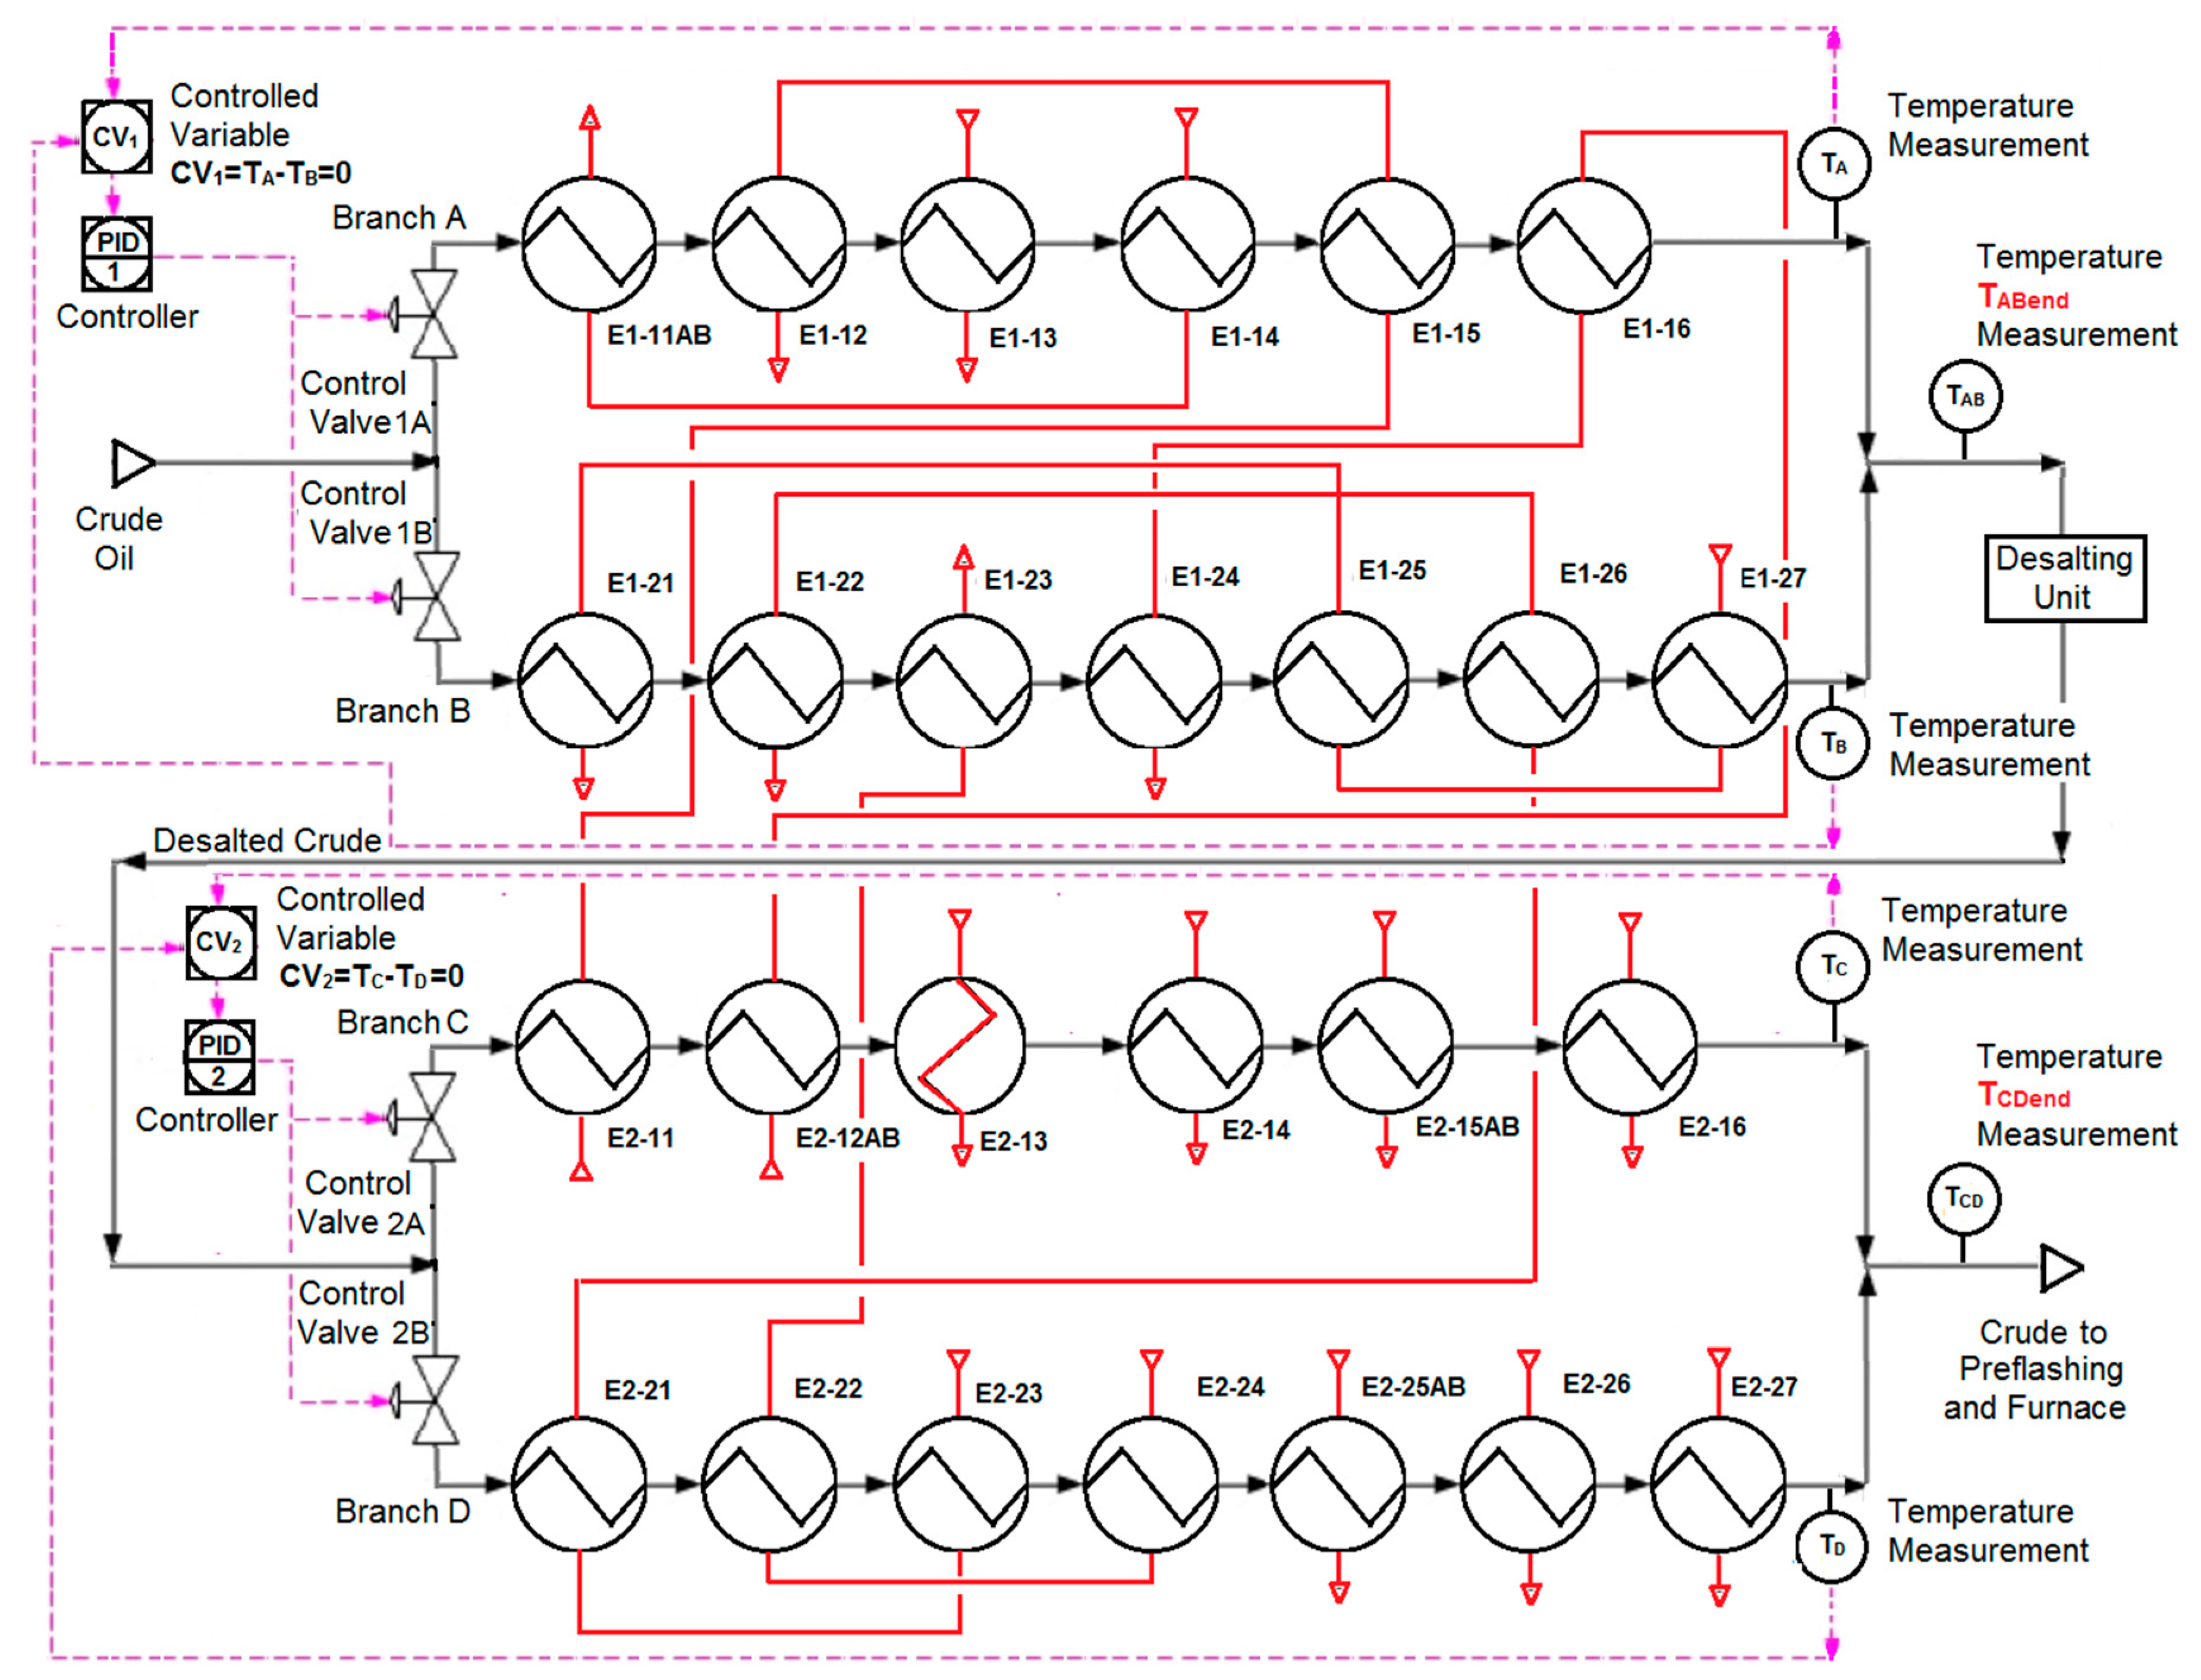
3.1. Case No. 1
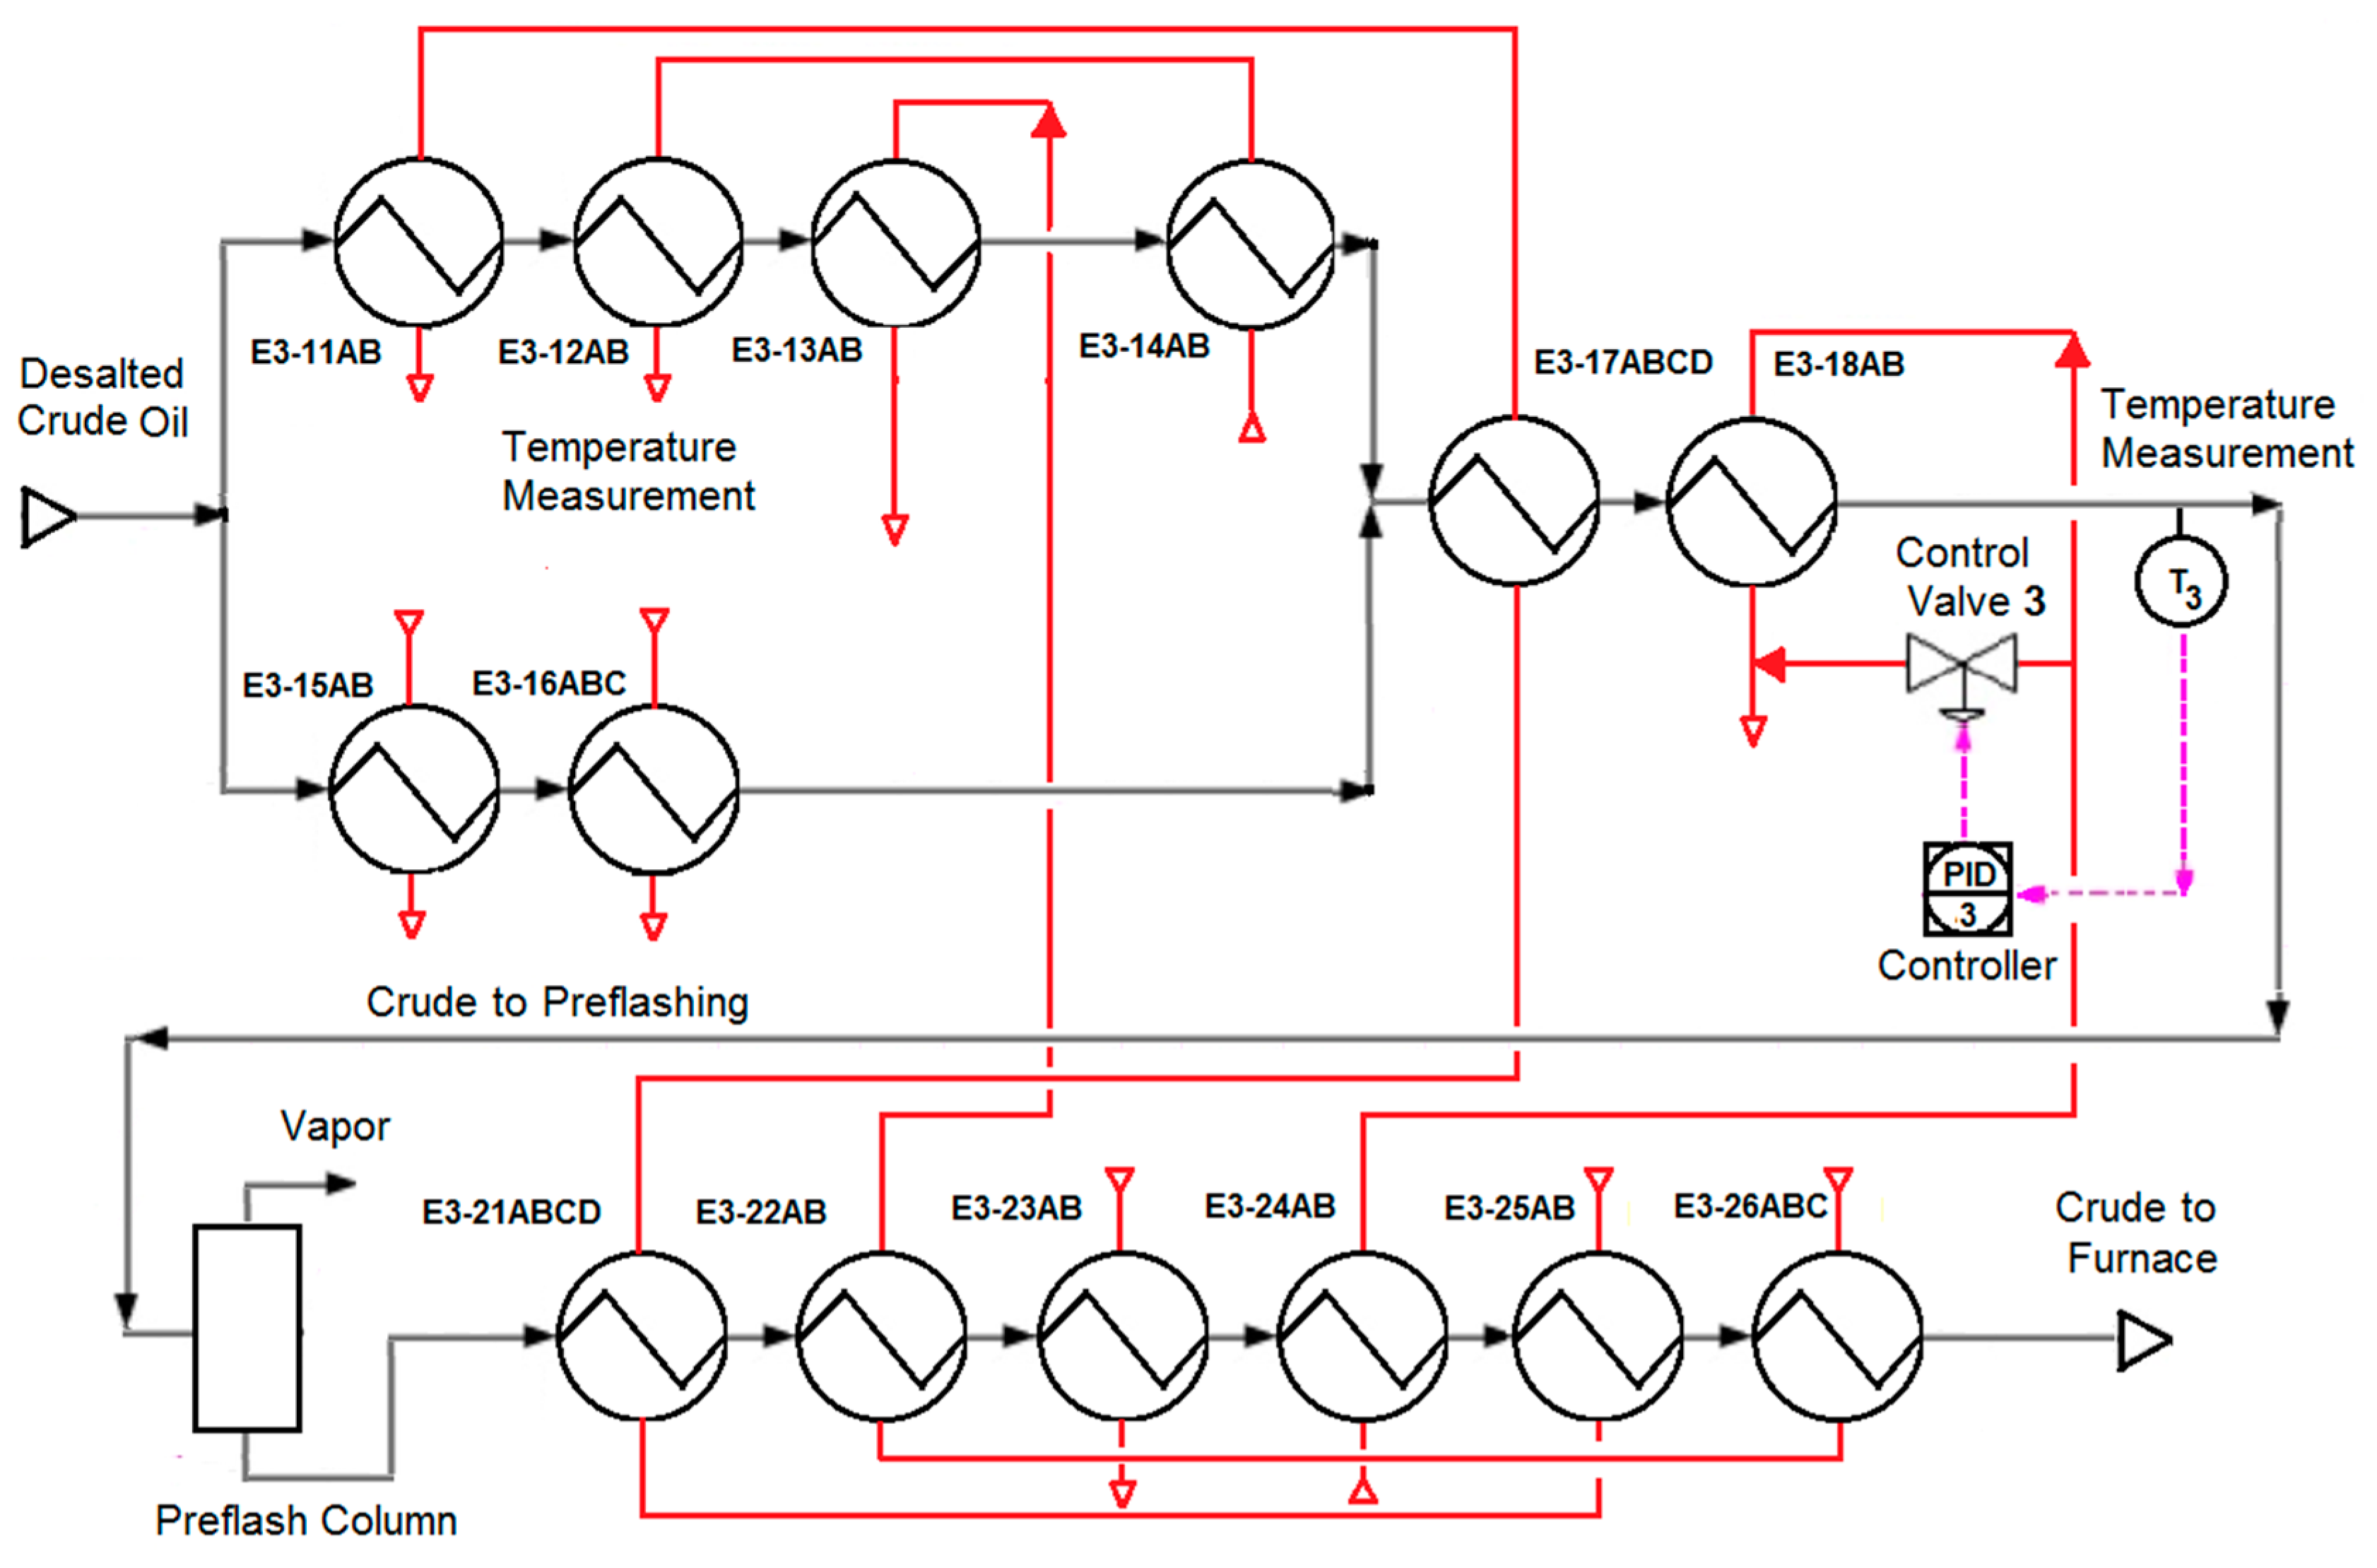
3.2. Case No. 2
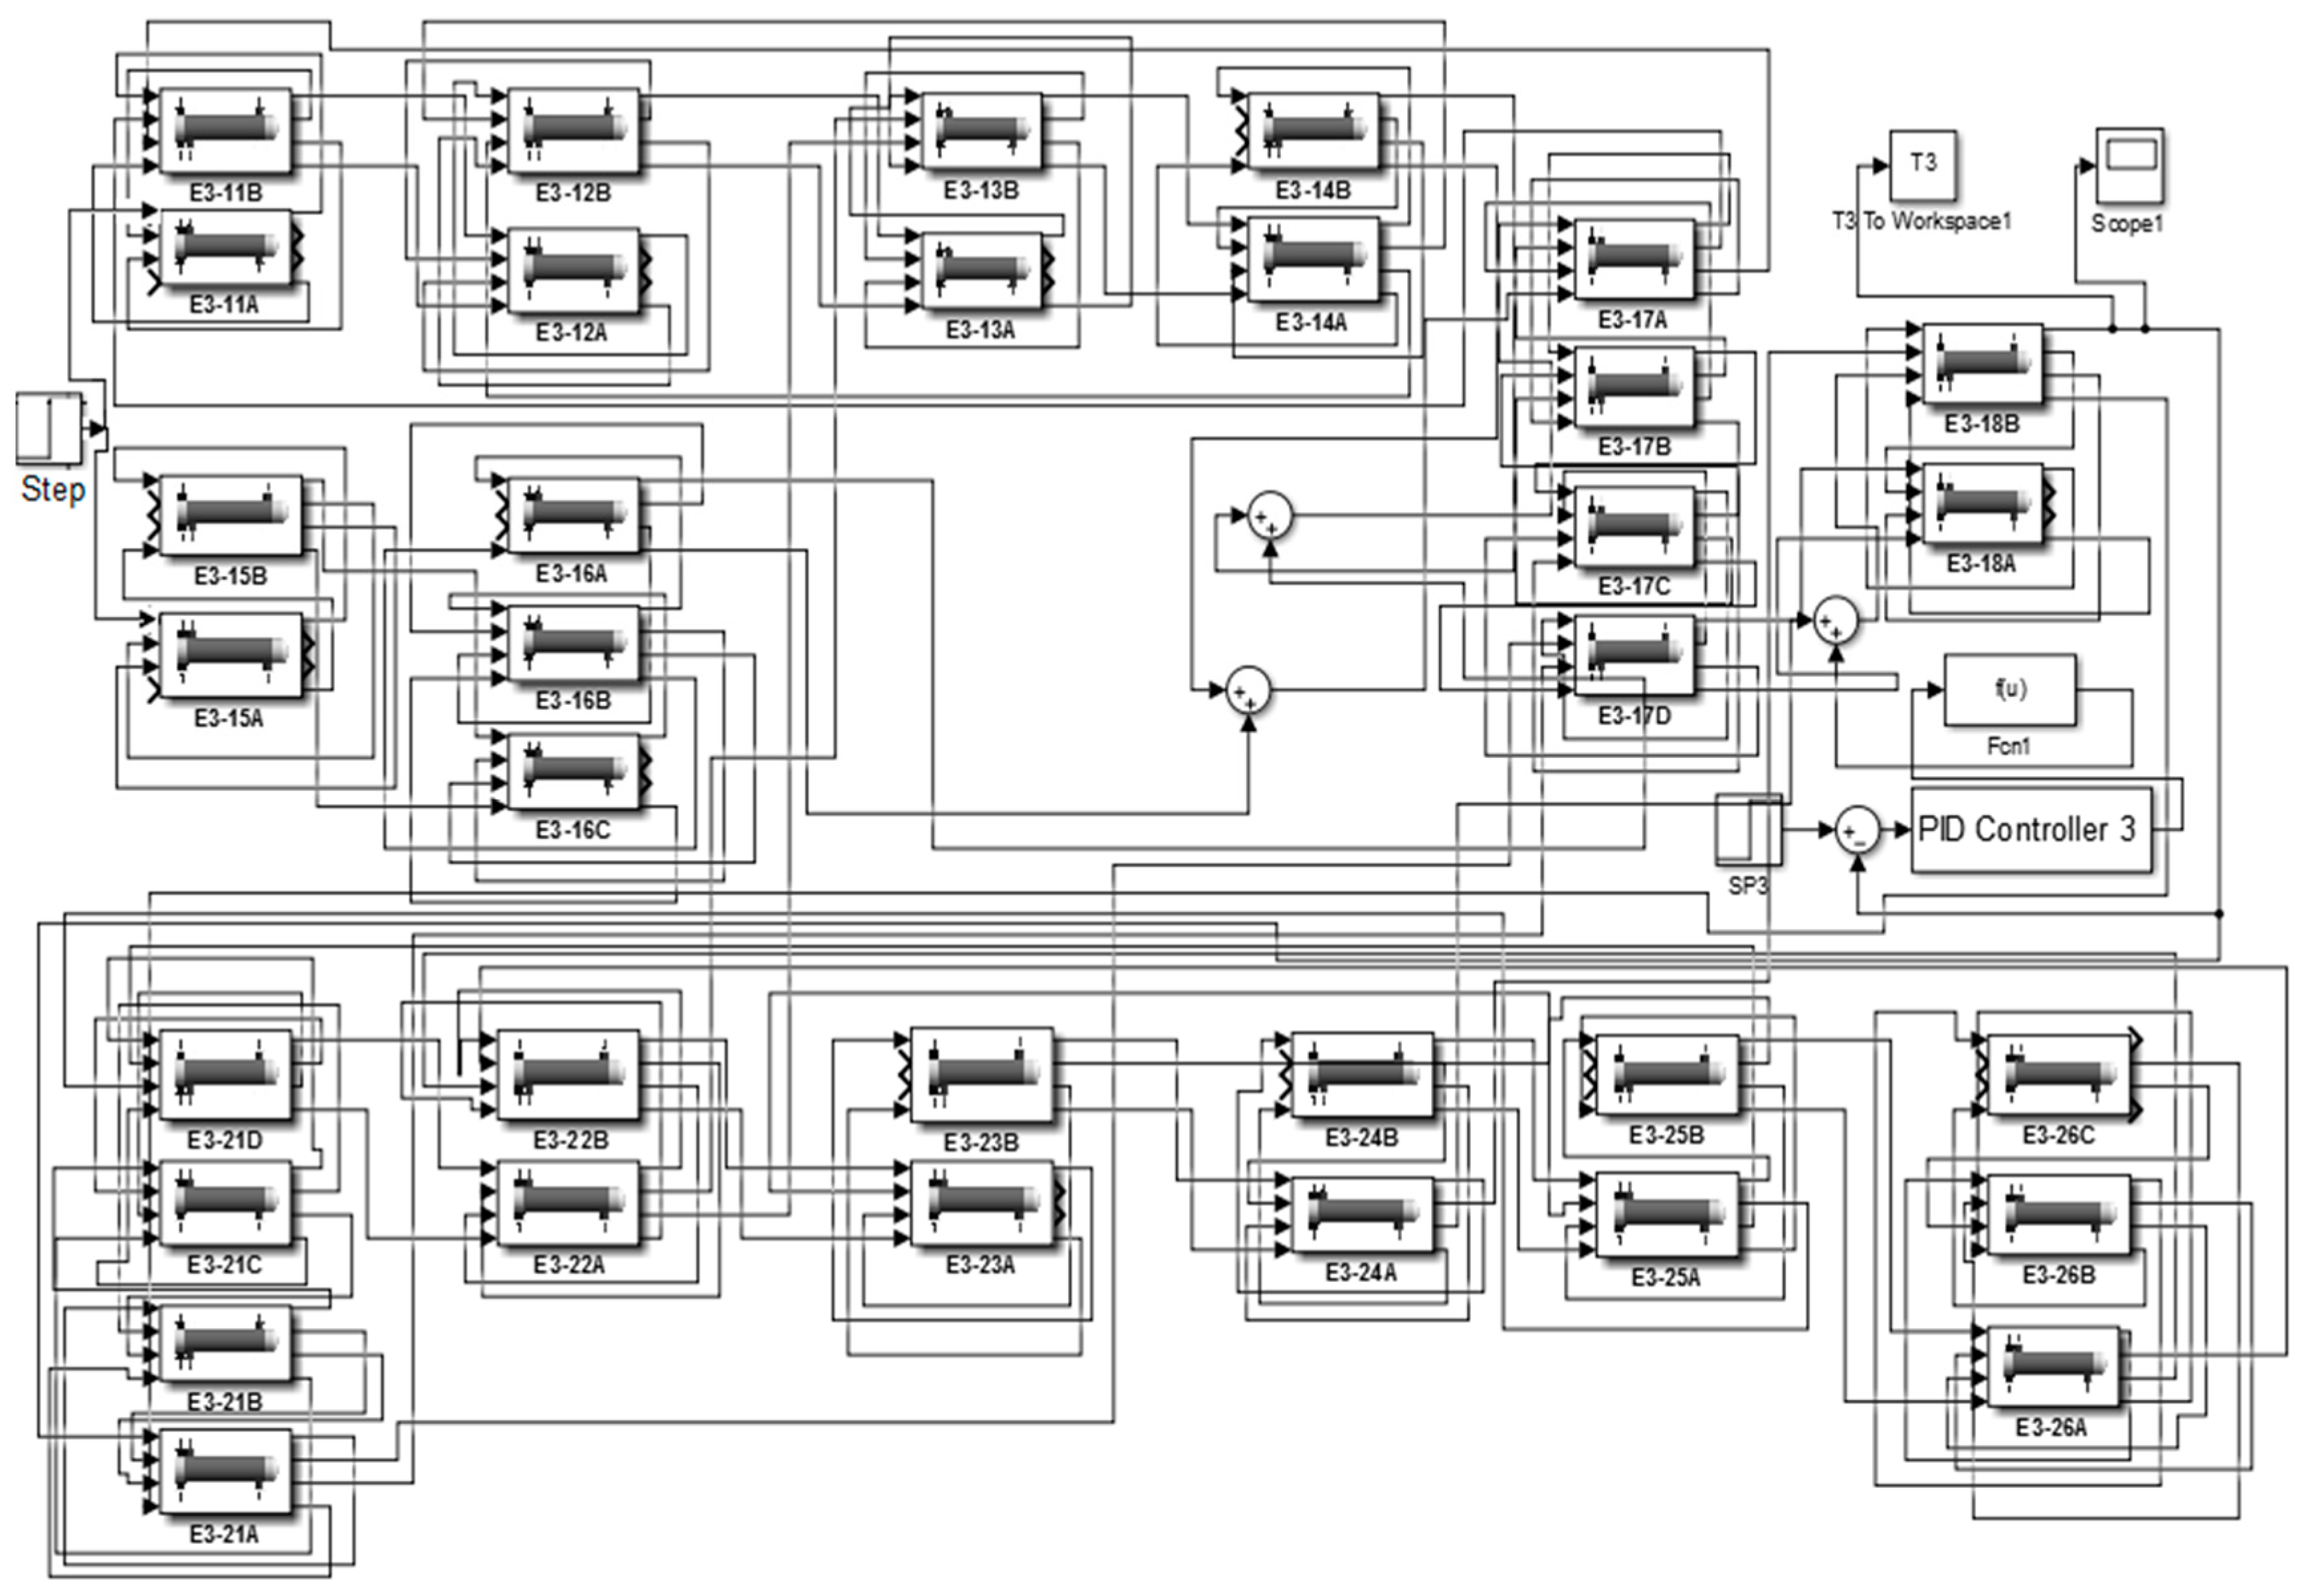
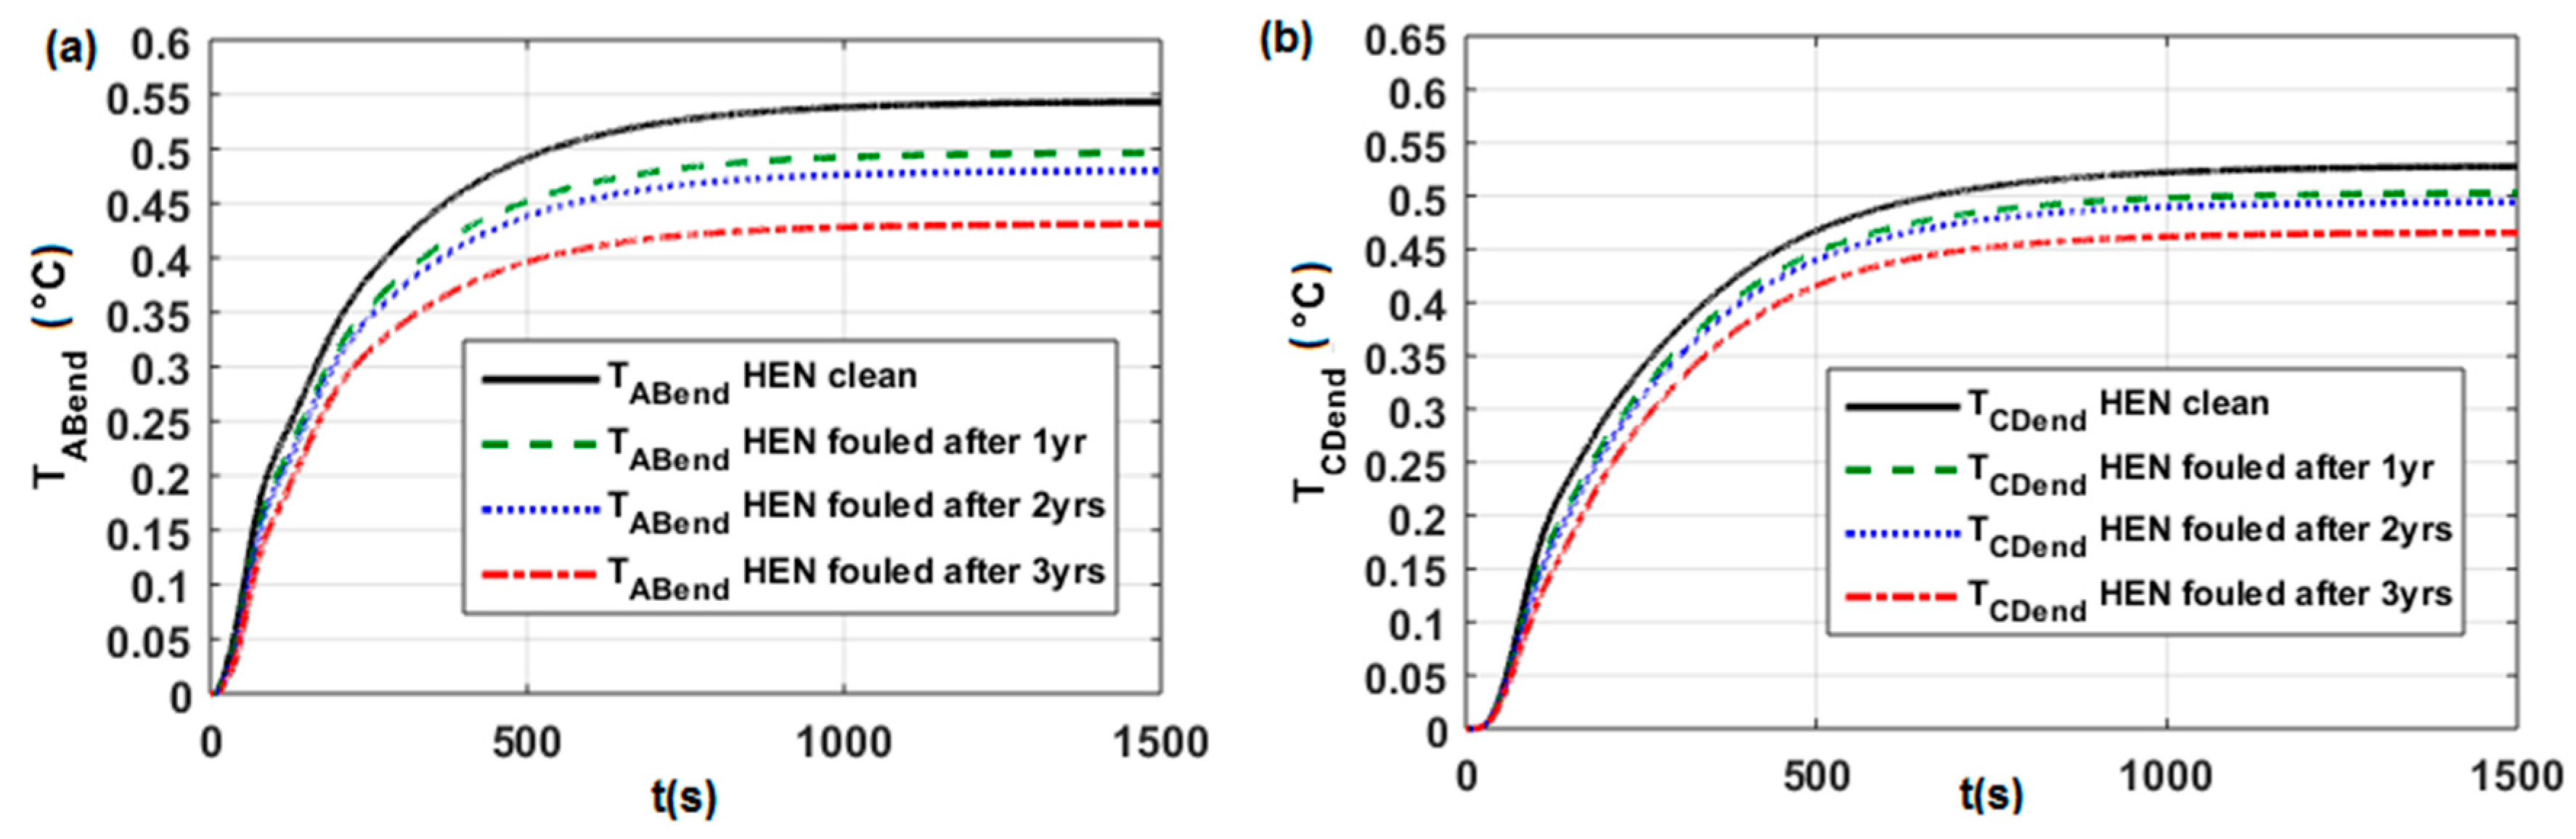
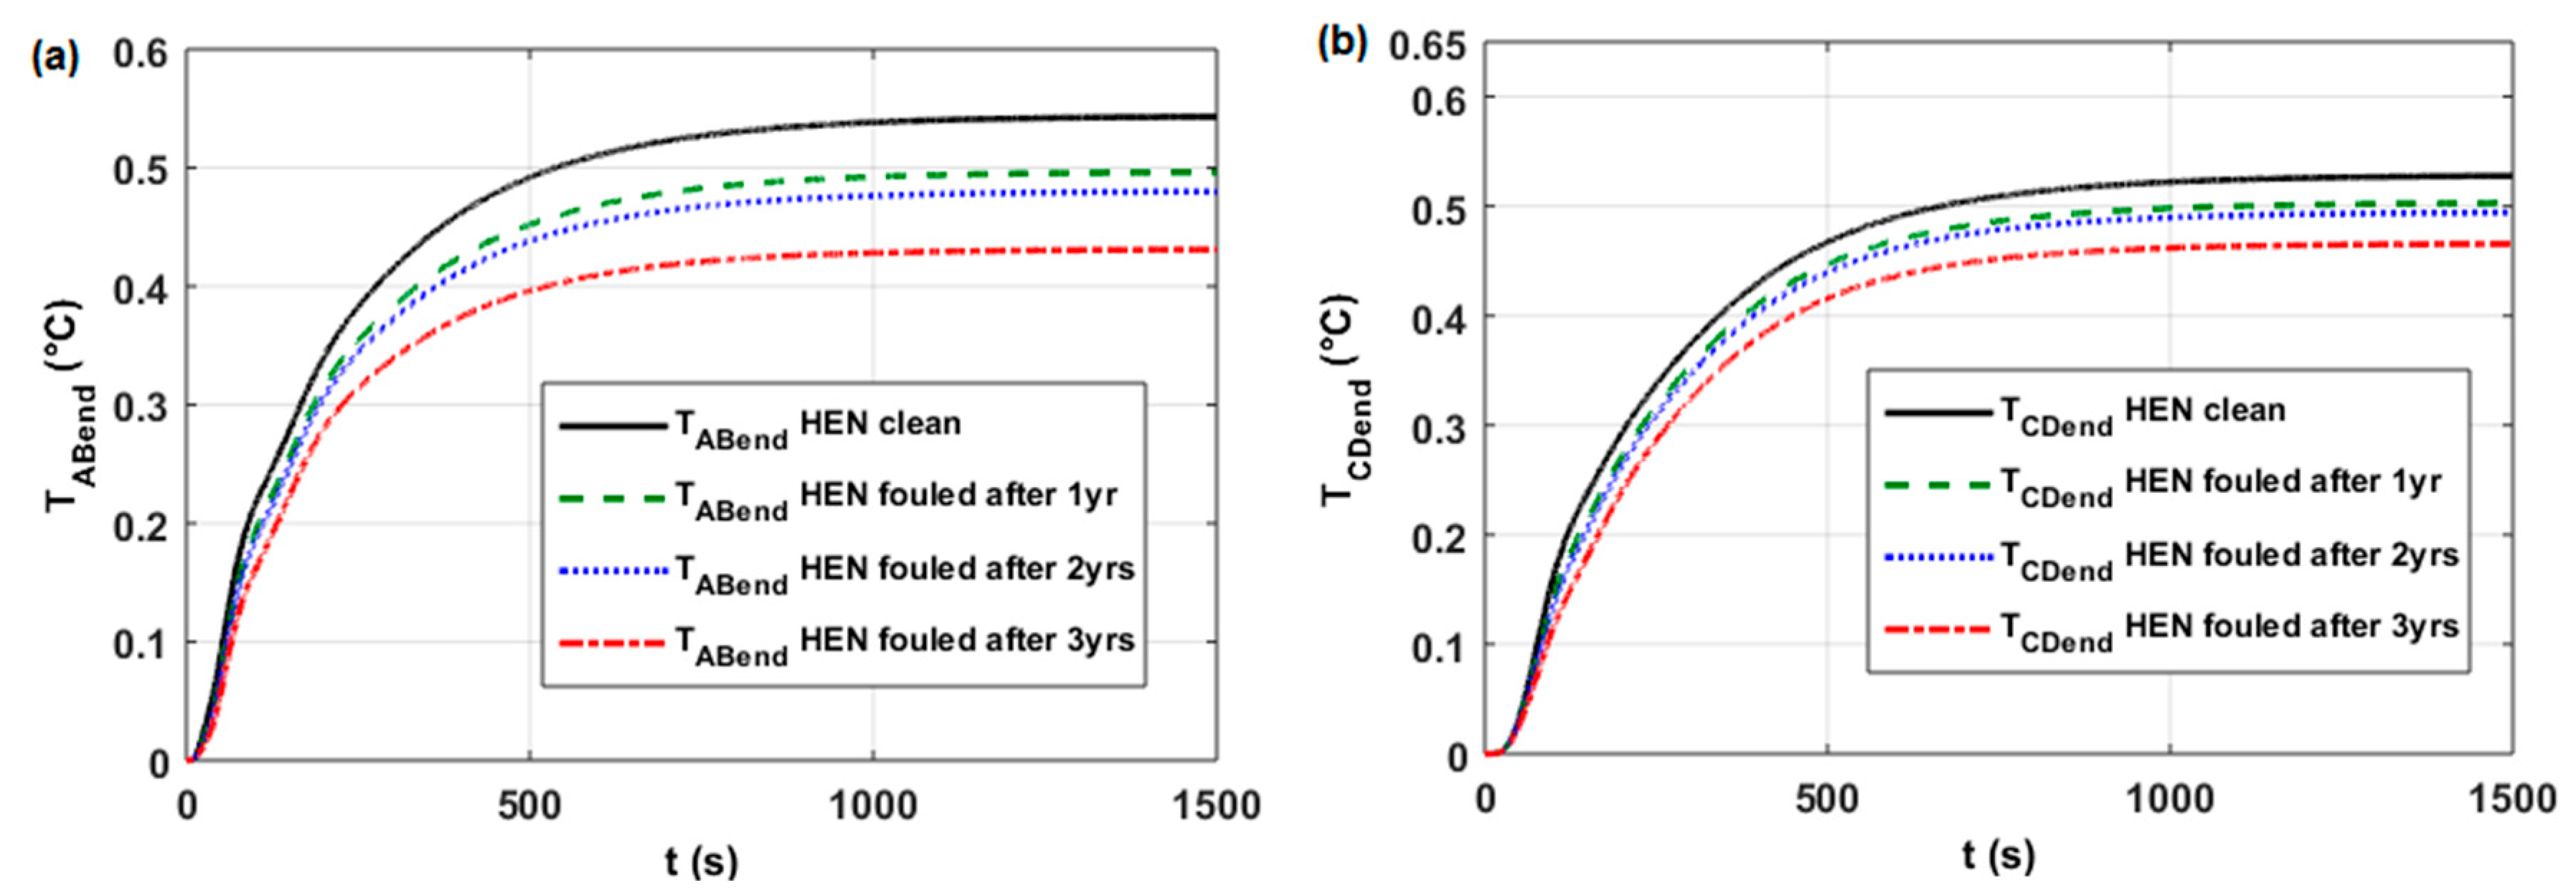
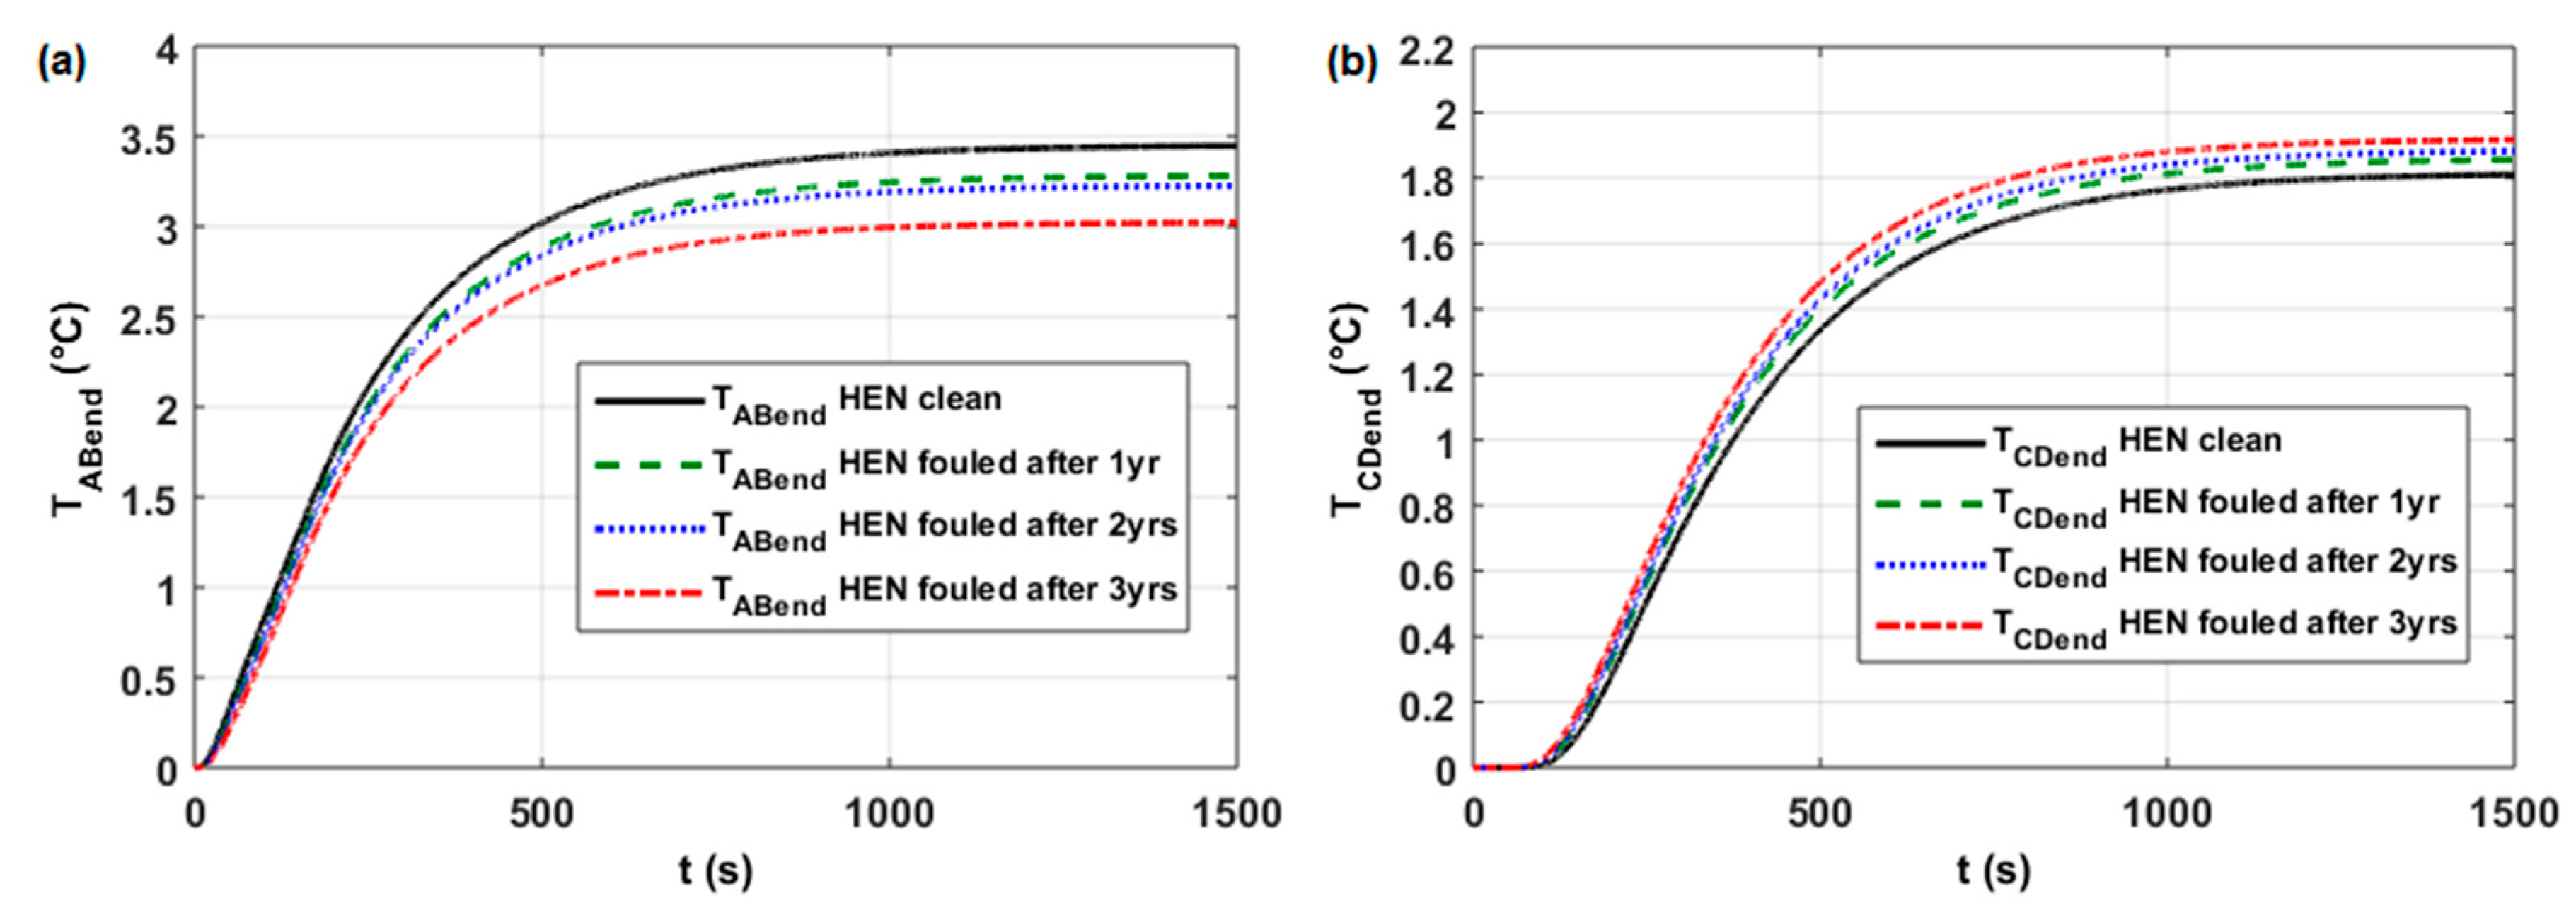
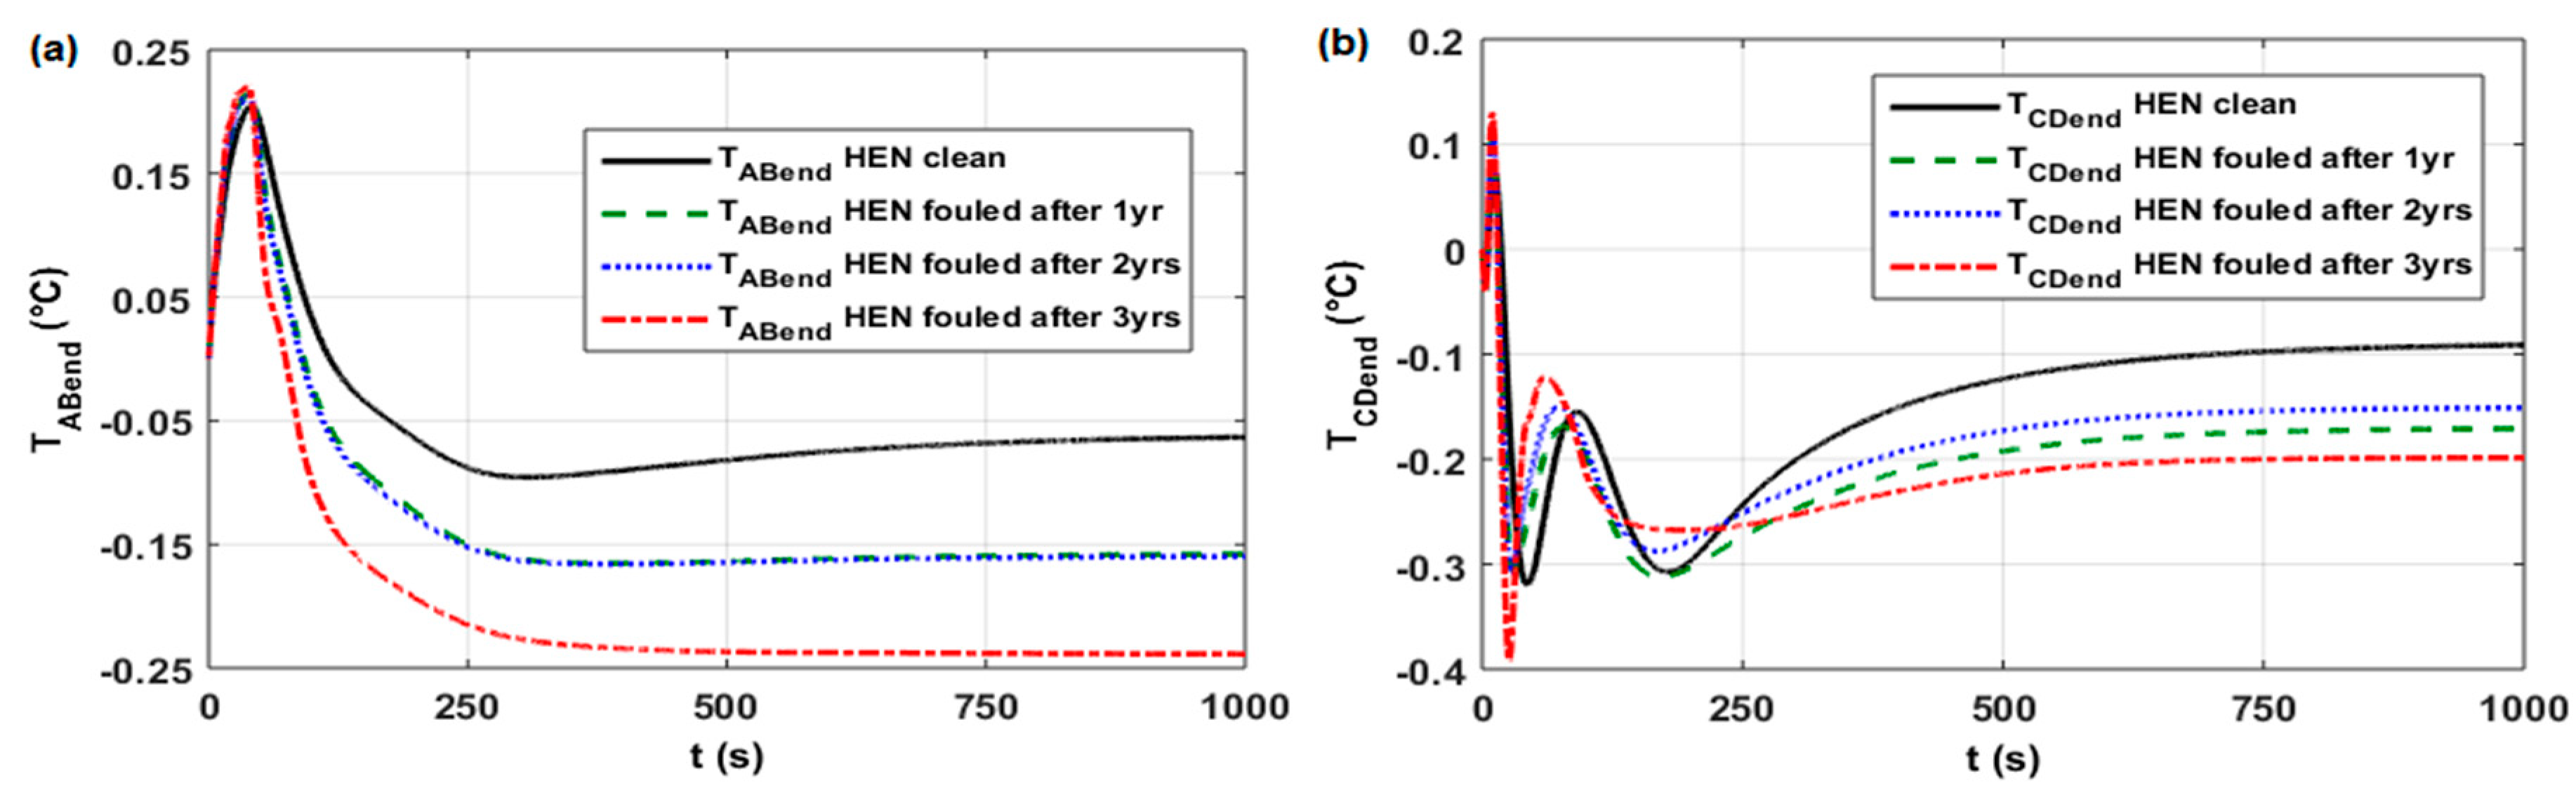
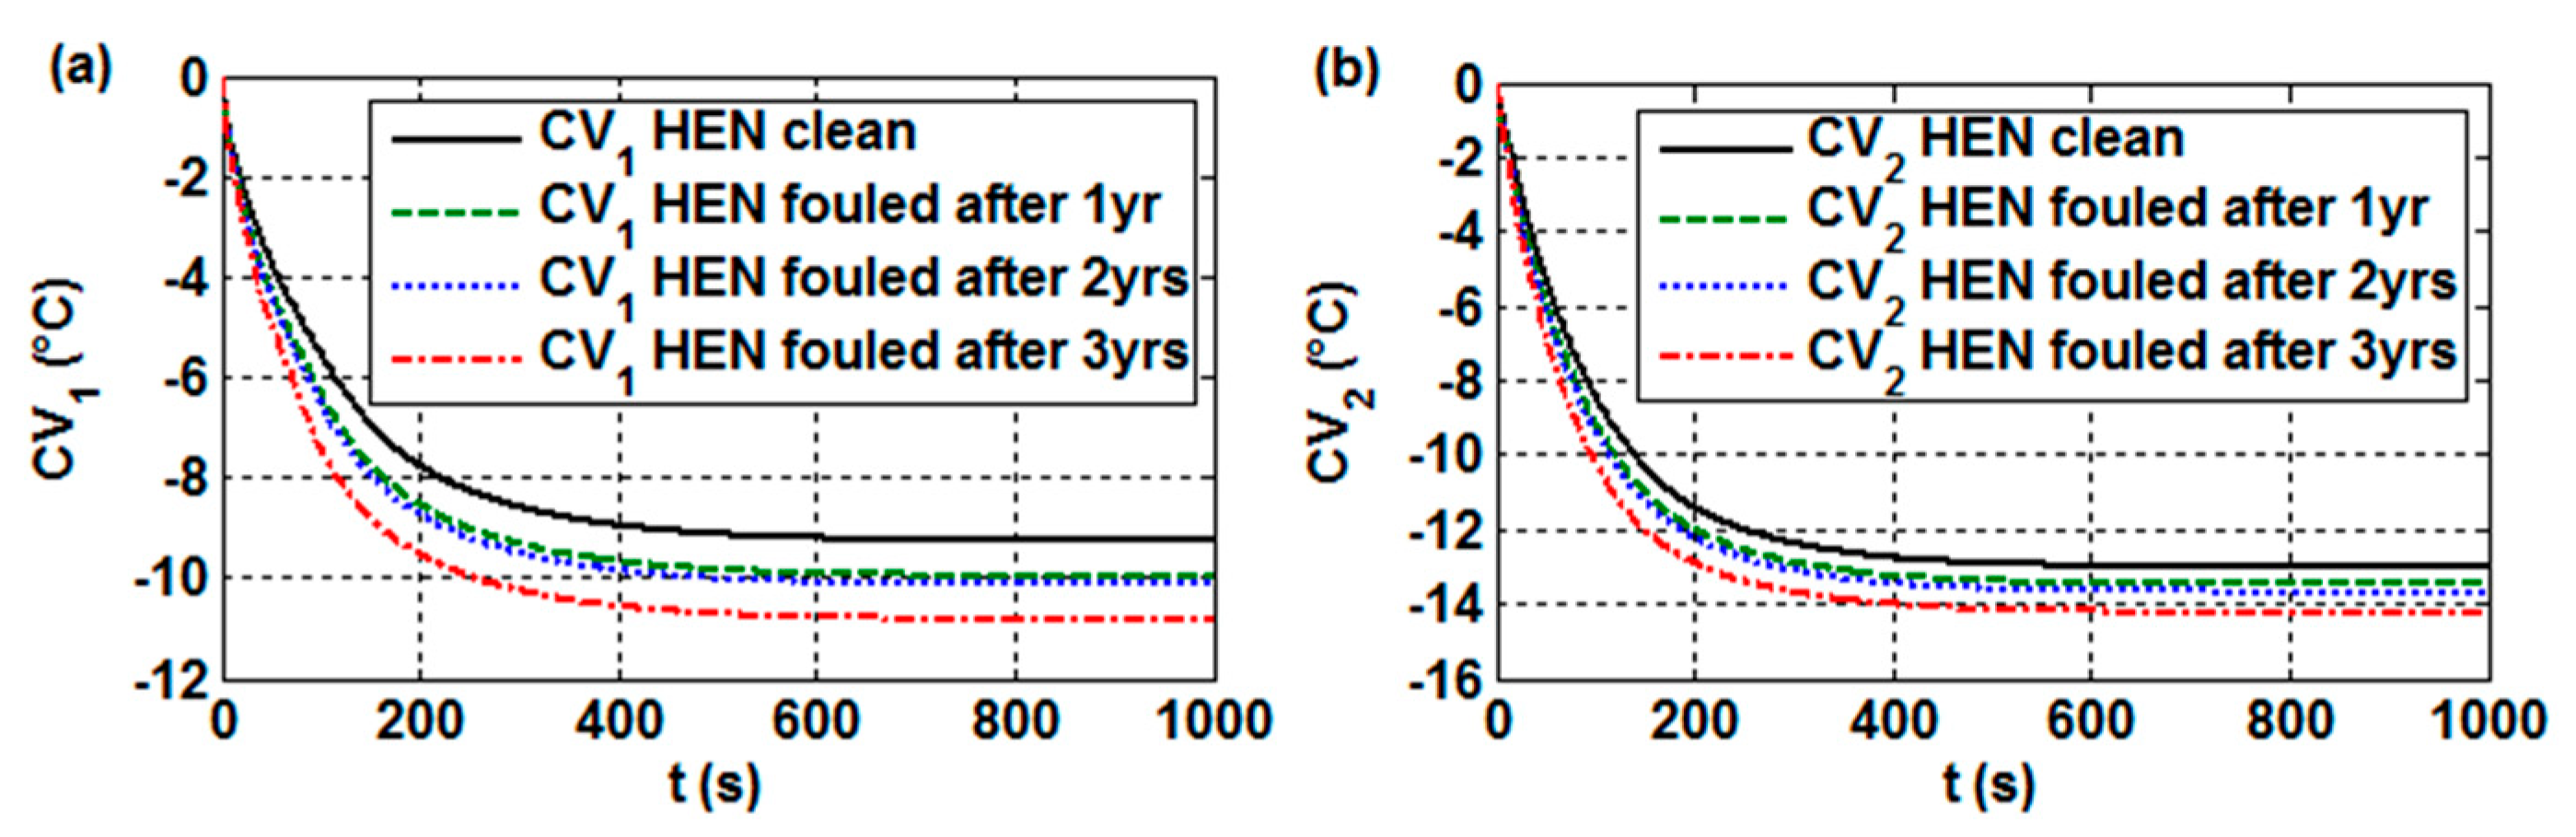
3.3. Dynamic analysis of the HEN
3.3.1. Study the Open-loop Step Responses in Case No. 1
3.3.2. Study the Open-loop Step Responses in Case No. 2
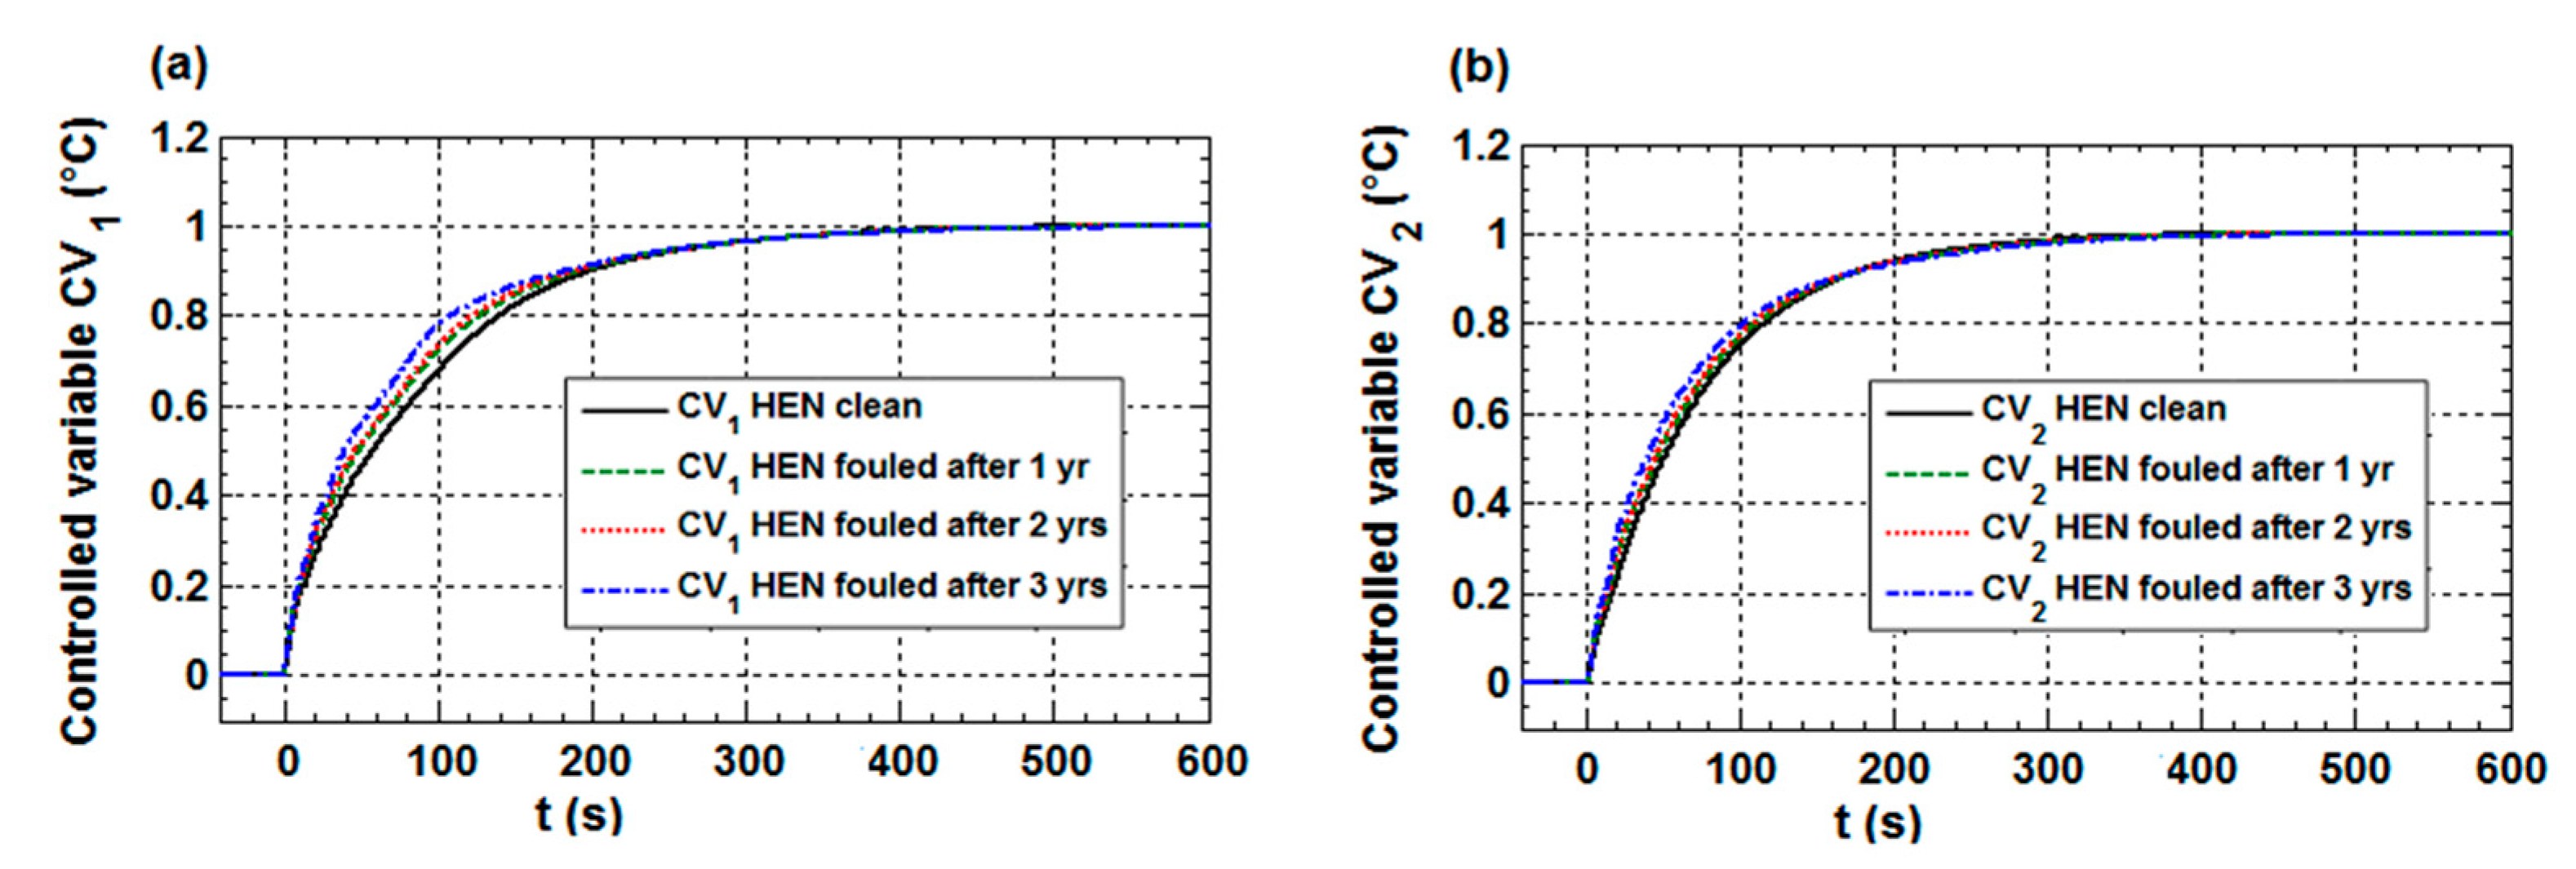
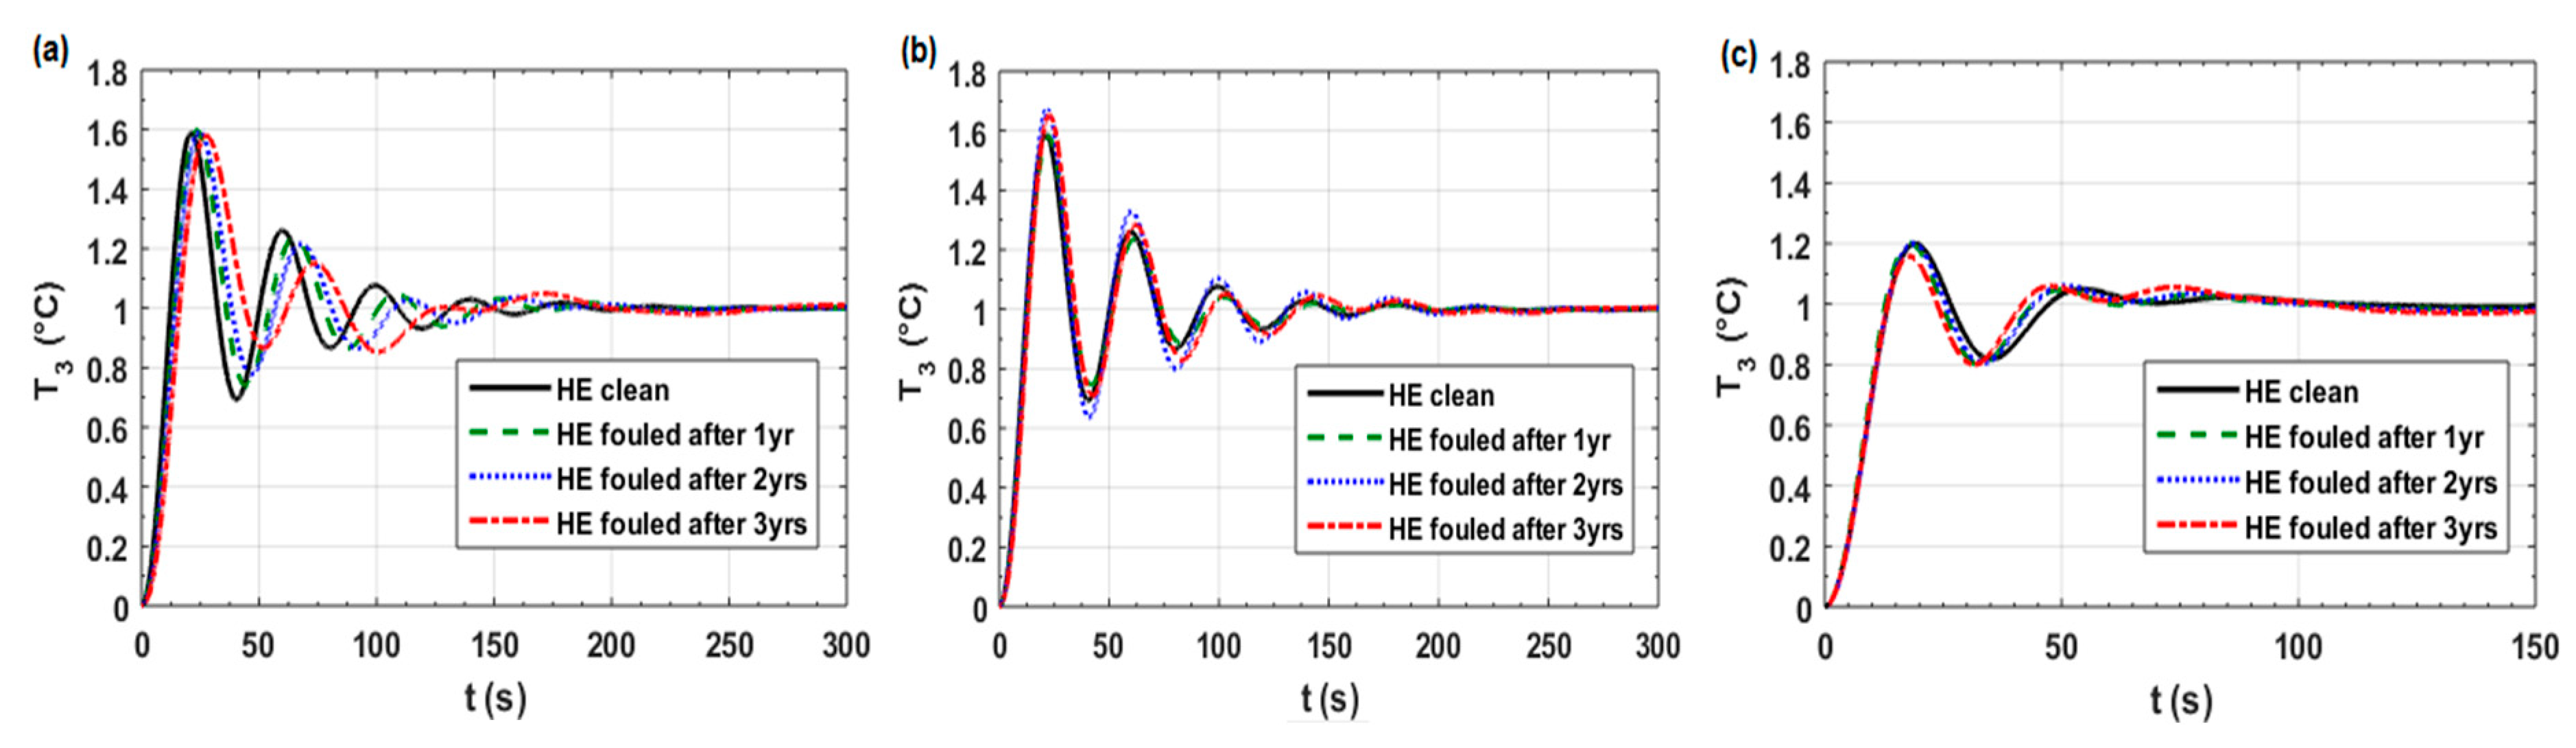
3.4. Closed-loop Control Analysis
4. Discussion
5. Conclusions
Author Contributions
Funding
Conflicts of Interest
Appendix A


| Closed-loop Responses of the Studied HEs [6,21] | Rf after Period of Operation (years) | Base PID Parameters 1 (Kp/Ki/Kd) | Adjusted PID Parameters 2 (Kp/Ki/Kd) | Optimal PID Parameters 3 (Kp/Ki/Kd) | Control-quality Indices | ||||
|---|---|---|---|---|---|---|---|---|---|
| Mp (%) | tp (s) | td (s) | tr (s) | ts (s) | |||||
| for HE E11AB (Figure A1a) |  | 69.8/4.58/255 | - | - | 47.3 67.1 68.9 73.8 | 18.7 26.2 27.5 31.3 | 6.1 9.8 10.3 11.5 | 8.7 12.8 13.4 14.8 | 61.3 157 193 >300 |
| for HE E11AB (Figure A1b) | 0 1 2 3 | - | 69.8/4.58/255 70.7/3.59/334 73.9/3.66/358 88.7/4.18/452 | - | 47.3 47.1 47.6 51.3 | 18.7 24.5 25 25.8 | 6.1 9.4 9.6 9.6 | 8.7 12.4 12.6 12.8 | 61.3 60.6 78.8 92.1 |
| for HE E11AB (Figure A1c) | 0 1 2 3 | - | - | 53.8/1.78/260 53.8/1.42/260 53.8/1.39/260 50.5/1.45/286 | 20 20 20 20 | 19.4 26.9 28.5 34.9 | 6.8 10.9 11.5 12.8 | 10 14.9 15.7 18 | 38.1 56.2 63.3 75 |
| for HE E15AB (Figure A2a) | | 2.44/0.10/13.7 | - | - | 46 44.6 45.4 47.4 | 29.3 36.2 38.1 41.5 | 10.9 12.9 13.4 14.5 | 14.6 17.3 18 19.5 | 70.9 94.9 99.8 145 |
| for HE E15AB (Figure A2b) | 0 1 2 3 | - | 2.44/0.104/13.7 3.38/0.143/19.2 3.54/0.148/20.4 3.88/0.157/22.9 | - | 46 50.6 51 51.7 | 29.3 29.3 29.6 30.4 | 10.9 11 11.1 11.4 | 14.6 14.3 14.5 14.8 | 70.9 75.3 76.8 79.6 |
| for HE E15AB (Figure A2c) | 0 1 2 3 | - | - | 2.30/0.03/13.8 2.48/0.04/13.8 2.76/0.03/13.9 3.05/0.04/17 | 20 19.8 20 20 | 27.7 33.6 32.9 33.2 | 11.3 13.2 13.3 13.3 | 15.5 18.1 18.1 18.1 | 63.2 50 71.9 74.6 |
| for HE E30AB (Figure A3a) | | 38.2/1.924/182 | - | - | 45.5 49.4 51.3 54.3 | 24.6 27.7 29.8 34 | 8.6 10.1 11 12.6 | 12 13.6 14.6 16.6 | 76.4 94.5 105 152 |
| for HE E30AB (Figure A3b) | 0 1 2 3 | - | 38.2/1.924/182 41.5/1.975/209 44.1/2.029/230 49.7/2.157/275 | - | 45.5 47.2 48 49.2 | 24.6 26.2 27.1 28.5 | 8.6 9.5 10 10.7 | 12 12.9 13.4 14.2 | 76.4 65.2 86.3 98.8 |
| for HE E30AB (Figure A3c) | 0 1 2 3 | - | - | 31.6/0.814/184 31.6/0.808/184 31.6/0.808/184 33.3/0.859/213 | 20 20 20 19.2 | 25.1 28.2 30.5 33.5 | 9.3 10.9 11.8 12.9 | 13.4 15.2 16.5 18 | 52.9 55.7 63.7 75.1 |
| for HE E35AB (Figure A4a) | | 32.5/2.371/107 | - | - | 51.2 76.6 88.5 94.5 | 16.2 25.1 34.9 40.8 | 5.1 8.9 12.2 14.3 | 7.3 11.6 15.8 18.5 | 70.9 232 >300 ~ 4 |
| for HE E35AB (Figure A4b) | 0 1 2 3 | - | 32.5/2.371/107 35.8/1.945/158 51.1/2.398/262 62.2/2.714/342 | - | 51.2 53.4 54.9 55.4 | 16.2 22.5 25.9 27.7 | 5.1 8 9.1 9.6 | 7.3 10.7 12.1 12.8 | 70.9 78.2 92.6 99.8 |
| for HE E35AB (Figure A4c) | 0 1 2 3 | - | - | 25.9/0.395/111 25.9/0.386/111 30.4/0.416/139 39.5/0.479/216 | 18.4 20 20 20 | 16.4 25.5 34.2 34.7 | 5.6 9.9 12.7 12.7 | 8.4 13.7 17.9 17.9 | 39.9 58.1 73.9 74.9 |
References
- Diaby, A.L.; Miklavcic, S.J.; Bari, S.; Addai-Mensah, J. Evaluation of crude oil heat exchanger network fouling behavior under aging conditions for scheduled cleaning. Heat Trans. Eng. 2016, 37, 1211–1230. [Google Scholar] [CrossRef]
- Tian, J.; Wang, Y.; Feng, X. Simultaneous optimization of flow velocity and cleaning schedule for mitigating fouling in refinery heat exchanger networks. Energy 2016, 109, 1118–1129. [Google Scholar] [CrossRef]
- Liu, R.; Wang, Y.; Feng, X. Mitigation of fouling in crude preheat trains by simultaneous dynamic optimization of flow rate and velocity distribution. Comput. Aided Chem. Eng. 2017, 40, 817–822. [Google Scholar] [CrossRef]
- Smith, R.; Loyola-Fuentes, J.; Jobson, M. Fouling in heat exchanger networks. Chem. Eng. Trans. 2017, 61, 1789–1794. [Google Scholar] [CrossRef]
- Liu, L.; Fan, J.; Chen, P.; Du, J.; Yang, F. Synthesis of heat exchanger networks considering fouling, aging, and cleaning. Ind. Eng. Chem. Res. 2015, 54, 296–306. [Google Scholar] [CrossRef]
- Trafczynski, M.; Markowski, M.; Alabrudziński, S.; Urbaniec, K. The influence of fouling on the dynamic behavior of PID-controlled heat exchangers. Appl. Therm. Eng. 2016, 109, 727–738. [Google Scholar] [CrossRef]
- Santamaria, F.L.; Macchietto, S. Integration of optimal cleaning scheduling and control of heat exchanger networks undergoing fouling: Model and formulation. Ind. Eng. Chem. Res. 2018, 57, 12842–12860. [Google Scholar] [CrossRef]
- Varga, E.I.; Hangos, K.M.; Szigeti, F. Controllability and observability of heat exchanger networks in the time-varying parameter case. Control Eng. Pract. 1995, 3, 1409–1419. [Google Scholar] [CrossRef]
- Jäschke, J.; Skogestad, S. Optimal operation of heat exchanger networks with stream split: Only temperature measurements are required. Comput. Chem. Eng. 2014, 70, 35–49. [Google Scholar] [CrossRef]
- Bakošová, M.; Oravec, J. Robust model predictive control for heat exchanger network. Appl. Therm. Eng. 2014, 73, 924–930. [Google Scholar] [CrossRef]
- Oravec, J.; Trafczynski, M.; Bakošová, M.; Markowski, M.; Mészáros, A.; Urbaniec, K. Robust model predictive control of heat exchanger network in the presence of fouling. Chem. Eng. Trans. 2017, 61, 337–342. [Google Scholar] [CrossRef]
- Oravec, J.; Bakošová, M.; Trafczynski, M.; Vasičkaninová, A.; Mészáros, A.; Markowski, M. Robust model predictive control and PID control of shell-and-tube heat exchangers. Energy 2018, 159, 1–10. [Google Scholar] [CrossRef]
- Korbel, M.; Bellec, S.; Jiang, T.; Stuart, P. Steady state identification for on-line data reconciliation based on wavelet transform and filtering. Comput. Chem. Eng. 2014, 63, 206–218. [Google Scholar] [CrossRef]
- Narasimhan, S.; Jordache, C. Data Reconciliation and Gross Error Detection: An Intelligent Use of Process Data; Gulf Professional Publishing: Huston, TX, USA, 1999. [Google Scholar]
- Gaddis, E.S.; Schlünder, E.U. Temperature distribution and heat exchange in multipass shell and tube exchangers with baffles. Heat Transf. Eng. 1979, 1, 43–52. [Google Scholar] [CrossRef]
- Markowski, M.; Trafczynski, M.; Urbaniec, K. Validation of the method for determination of the thermal resistance of fouling in shell and tube heat exchangers. Energy Convers. Manage. 2013, 76, 307–313. [Google Scholar] [CrossRef]
- Markowski, M.; Trafczynski, M.; Urbaniec, K. Identification of the influence of fouling on the heat recovery in a network of shell and tube heat exchangers. Appl. Energy 2013, 102, 755–764. [Google Scholar] [CrossRef]
- Ziegler, J.G.; Nichols, N.B. Optimum settings for automatic controllers. Trans. ASME 1942, 64, 759–765. [Google Scholar] [CrossRef]
- Tubular Exchanger Manufacturers Association. Standards of the Tubular Exchanger Manufacturers Association, 8th ed.; TEMA: New York, NY, USA, 1999. [Google Scholar]
- Skogestad, S. Simple analytic rules for model reduction and PID controller tuning. J. Proc. Control 2003, 13, 291–309. [Google Scholar] [CrossRef]
- Trafczynski, M.; Markowski, M.; Alabrudzinski, S.; Urbaniec, K. Tuning parameters of PID controllers for the operation of heat exchangers under fouling conditions. Chem. Eng. Trans. 2016, 52, 1237–1242. [Google Scholar] [CrossRef]
- Borges de Carvalho, C.; Carvalho, E.P.; Ravagnani, M.A.S.S. Dynamic analysis of fouling buildup in heat exchangers designed according to tema standards. Ind. Eng. Chem. Res. 2018, 57, 3753–3764. [Google Scholar] [CrossRef]
- Borges de Carvalho, C.; Carvalho, E.P.; Ravagnani, M.A.S.S. Tuning strategies for overcoming fouling effects in proportional integral derivative controlled heat exchangers. Ind. Eng. Chem. Res. 2018, 57, 10518–10527. [Google Scholar] [CrossRef]
- Markowski, M.; Urbaniec, K. Optimal cleaning schedule for heat exchangers in a heat exchanger network. Appl. Therm. Eng. 2005, 25, 1019–1032. [Google Scholar] [CrossRef]


| HE no. | Fouling Factor Rf × 10−3 (m2K/W) after Period of Operation: | Total Heat Transfer Coefficient for Clean HE U (W/m2K) | HE no. | Fouling Factor Rf × 10−3 (m2K/W) after Period of Operation: | Total Heat Transfer Coefficient for Clean HE U (W/m2K) | ||||
|---|---|---|---|---|---|---|---|---|---|
| 1 year | 2 years | 3 years | 1 year | 2 years | 3 years | ||||
| E1-11AB | 0.903 | 1.118 | 2.235 | 728 | E2-11 | 0.608 | 1.115 | 2.235 | 691 |
| E1-12 | 0.681 | 1.116 | 2.235 | 572 | E2-12AB | 0.701 | 1.116 | 2.235 | 698 |
| E1-13 | 1.011 | 1.118 | 2.235 | 363 | E2-13 | 1.332 | 2.574 | 5.160 | 56 |
| E1-14 | 0.846 | 1.117 | 2.235 | 831 | E2-14 | 0.913 | 1.374 | 2.752 | 346 |
| E1-15 | 0.869 | 1.117 | 2.235 | 633 | E2-15AB | 0.789 | 1.116 | 2.235 | 436 |
| E1-16 | 0.834 | 1.117 | 2.235 | 636 | E2-16 | 0.900 | 1.374 | 2.752 | 518 |
| E1-21 | 1.104 | 1.376 | 2.752 | 546 | E2-21 | 0.678 | 1.116 | 2.235 | 858 |
| E1-22 | 0.700 | 1.116 | 2.235 | 810 | E2-22 | 0.828 | 1.117 | 2.235 | 467 |
| E1-23 | 0.753 | 1.117 | 2.235 | 417 | E2-23 | 0.592 | 1.115 | 2.235 | 891 |
| E1-24 | 0.679 | 1.116 | 2.235 | 648 | E2-24 | 0.926 | 1.117 | 2.235 | 502 |
| E1-25 | 0.951 | 1.375 | 2.752 | 649 | E2-25AB | 0.842 | 1.373 | 2.235 | 673 |
| E1-26 | 0.992 | 1.118 | 2.235 | 898 | E2-26 | 0.931 | 1.375 | 2.752 | 280 |
| E1-27 | 0.913 | 1.373 | 2.752 | 678 | E2-27 | 0.900 | 1.374 | 2.752 | 197 |
| HE no. | Fouling Factor Rf × 10−3 (m2K/W) after Period of Operation: | Total Heat Transfer Coefficient for Clean HE U (W/m2K) | ||
|---|---|---|---|---|
| 1 year | 2 years | 3 years | ||
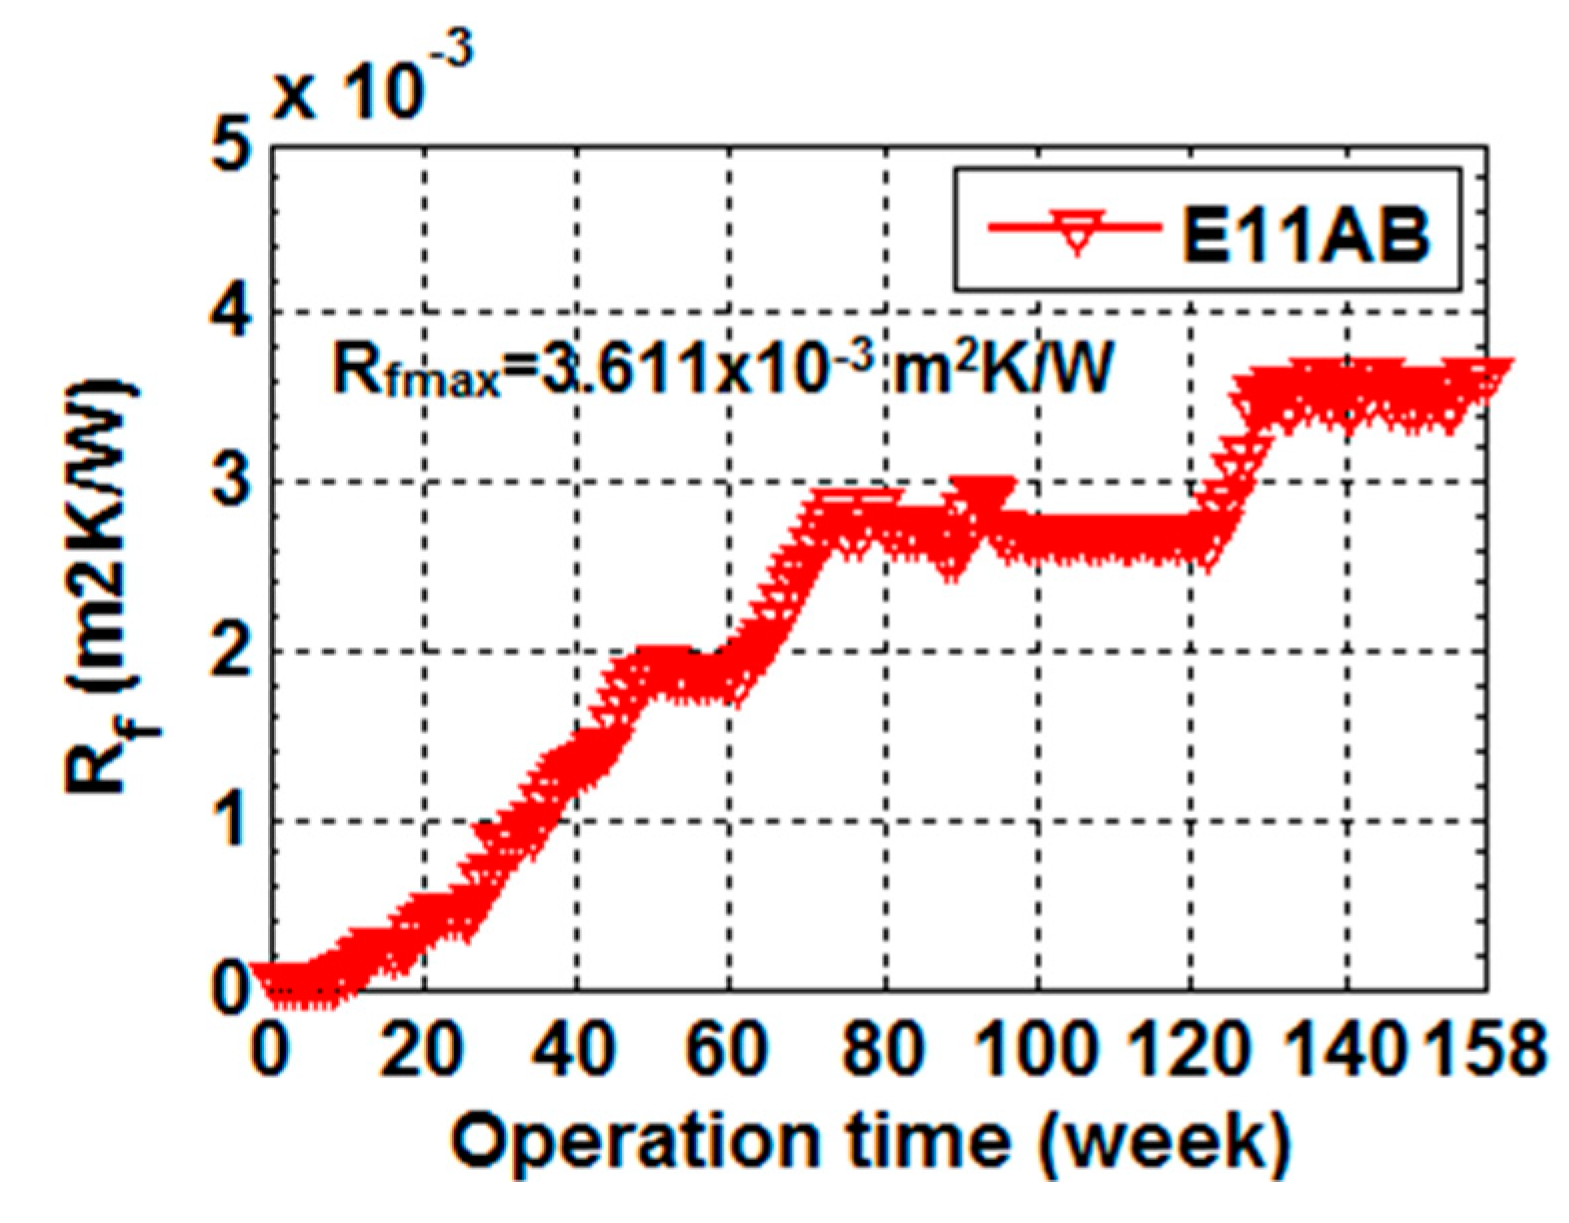
| E3-11AB E3-12AB E3-13AB E3-14AB E3-15AB E3-16ABC E3-17ABCD E3-18AB E3-21ABCD E3-22AB E3-23AB E3-24AB E3-25AB E3-26ABC | 1.869 1.486 0.957 1.563 0.982 1.234 1.623 0.323 1.587 0.128 2.077 0.444 0.677 0.279 | 2.672 2.478 1.522 2.587 1.207 1.894 2.543 0.623 2.452 0.273 4.448 0.699 0.823 1.116 | 3.611 3.437 2.589 3.523 1.694 2.896 3.431 1.196 3.257 0.532 6.075 1.259 1.647 1.628 | 429 434 237 443 294 295 810 745 894 327 383 623 603 410 |
| HEN Operating Condition | Control K0 (°Cs/kg) | Loop 1 t1 (s) | Control K0 (°Cs/kg) | Loop 2 t1 (s) | PID Parameters | PID 1 | PID 2 |
|---|---|---|---|---|---|---|---|
| Rf = 0 (clean) | Kp | −0.8790 | −0.6261 | ||||
| −1.52 | 110 | −2.13 | 96 | Ki | −0.0080 | −0.0065 | |
| Kd | 0 | 0 | |||||
| Rf after 1 year | Kp | −0.8175 | −0.6042 | ||||
| −1.63 | 99 | −2.21 | 89 | Ki | −0.0082 | −0.0068 | |
| Kd | 0 | 0 | |||||
| Rf after 2 years | Kp | −0.8036 | −0.5954 | ||||
| −1.66 | 97 | −2.24 | 87 | Ki | −0.0083 | −0.0069 | |
| Kd | 0 | 0 | |||||
| Rf after 3 years | Kp | −0.7522 | −0.5723 | ||||
| −1.77 | 88 | −2.33 | 79 | Ki | −0.0086 | −0.0072 | |
| Kd | 0 | 0 |
| HEN Operating Condition | Control K0 (°Cs/kg) | Loop 3 td (s) | t1 (s) | PID 3 Parameters | |
|---|---|---|---|---|---|
| Rf = 0 (clean) | Kp | 60.32 | |||
| 0.1566 | 8 | 63 | Ki | 3.771 | |
| Kd | 193.1 | ||||
| Rf after 1 year | Kp | 66.24 | |||
| 0.1494 | 8.5 | 70.1 | Ki | 3.897 | |
| Kd | 225.2 | ||||
| Rf after 2 years | Kp | 78.72 | |||
| 0.1394 | 8.2 | 75 | Ki | 4.801 | |
| Kd | 258.2 | ||||
| Rf after 3 years | Kp | 87.27 | |||
| 0.1288 | 8.7 | 81.5 | Ki | 5.016 | |
| Kd | 303.7 | ||||
| Closed-Loop Responses for Case No. 1 | Rf after Period of Iperation (years) | Base PID Parameters 1 (Kp/Ki/Kd) | Control-Quality Indices | ||||
|---|---|---|---|---|---|---|---|
| Mp (%) | tp (s) | td (s) | tr (s) | ts (s) | |||
| for control loop 1 (Figure 16a) | | −0.8790/−0.0080/0 | 0 0 0 0 | - - - - | - - - - | 139 126 123 108 | 265 263 262 260 |
| for control loop 2 (Figure 16b) | | −0.6261/−0.0065/0 | 0 0 0 0 | - - - - | - - - - | 115 110 108 102 | 214 223 224 229 |
| Closed-Loop Responses for Case No. 2 | Rf after Period of Operation (years) | Base PID Parameters 1 (Kp/Ki/Kd) | Adjusted PID Parameters 2 (Kp/Ki/Kd) | Optimal PID Parameters 3 (Kp/Ki/Kd) | Control-Quality Indices | ||||
|---|---|---|---|---|---|---|---|---|---|
| Mp (%) | tp (s) | td (s) | tr (s) | ts (s) | |||||
| for control loop 3 (Figure 17a) | | 60.3/3.77/193 | - | - | 58.9 59.8 59.5 58 | 21.2 23.4 24.6 27.5 | 8.1 9.1 9.7 10.8 | 10.6 11.9 12.5 14 | 124.6 133.6 134.2 173.2 |
| for control loop 3 (Figure 17b) | 0 1 2 3 | - | 60.3/3.77/193 66.2/3.90/225 78.7/4.80/258 87.2/5.02/304 | - | 58.9 58.3 63.3 65.3 | 21.2 22.2 21.9 23.1 | 8.1 8.6 8.5 9.0 | 10.6 11.2 11 12 | 124.6 126.4 142.6 129.6 |
| for control loop 3 (Figure 17c) | 0 1 2 3 | - | - | 56.8/0.82/237 68.1/0.81/359 71.0/0.85/377 76.8/0.90/553 | 20 20 20 16 | 19.1 18.8 18 18 | 8.0 7.7 8.1 8.0 | 11 10.6 11 10.9 | 54.5 50.2 54.3 50.9 |
| Case Study | The Number of HEs in a Control Loop | The Number of Antecedent HEs | The Level of Fouling Influence on the Control-quality Indices. | ||
|---|---|---|---|---|---|
| on Hot Stream | on Cold Stream | ||||
| Case no. 1 (Figure 2) for control loop 1 for control loop 2 | 13 13 | 9 2 | 11 24 | (see Table 5) negligibly low negligibly low | (Figure 16a) (Figure 16b) |
| Case no. 2 (Figure 3) for control loop 3 | 1 | 7 | 7 | (see Table 6) low | (Figure 17a) |
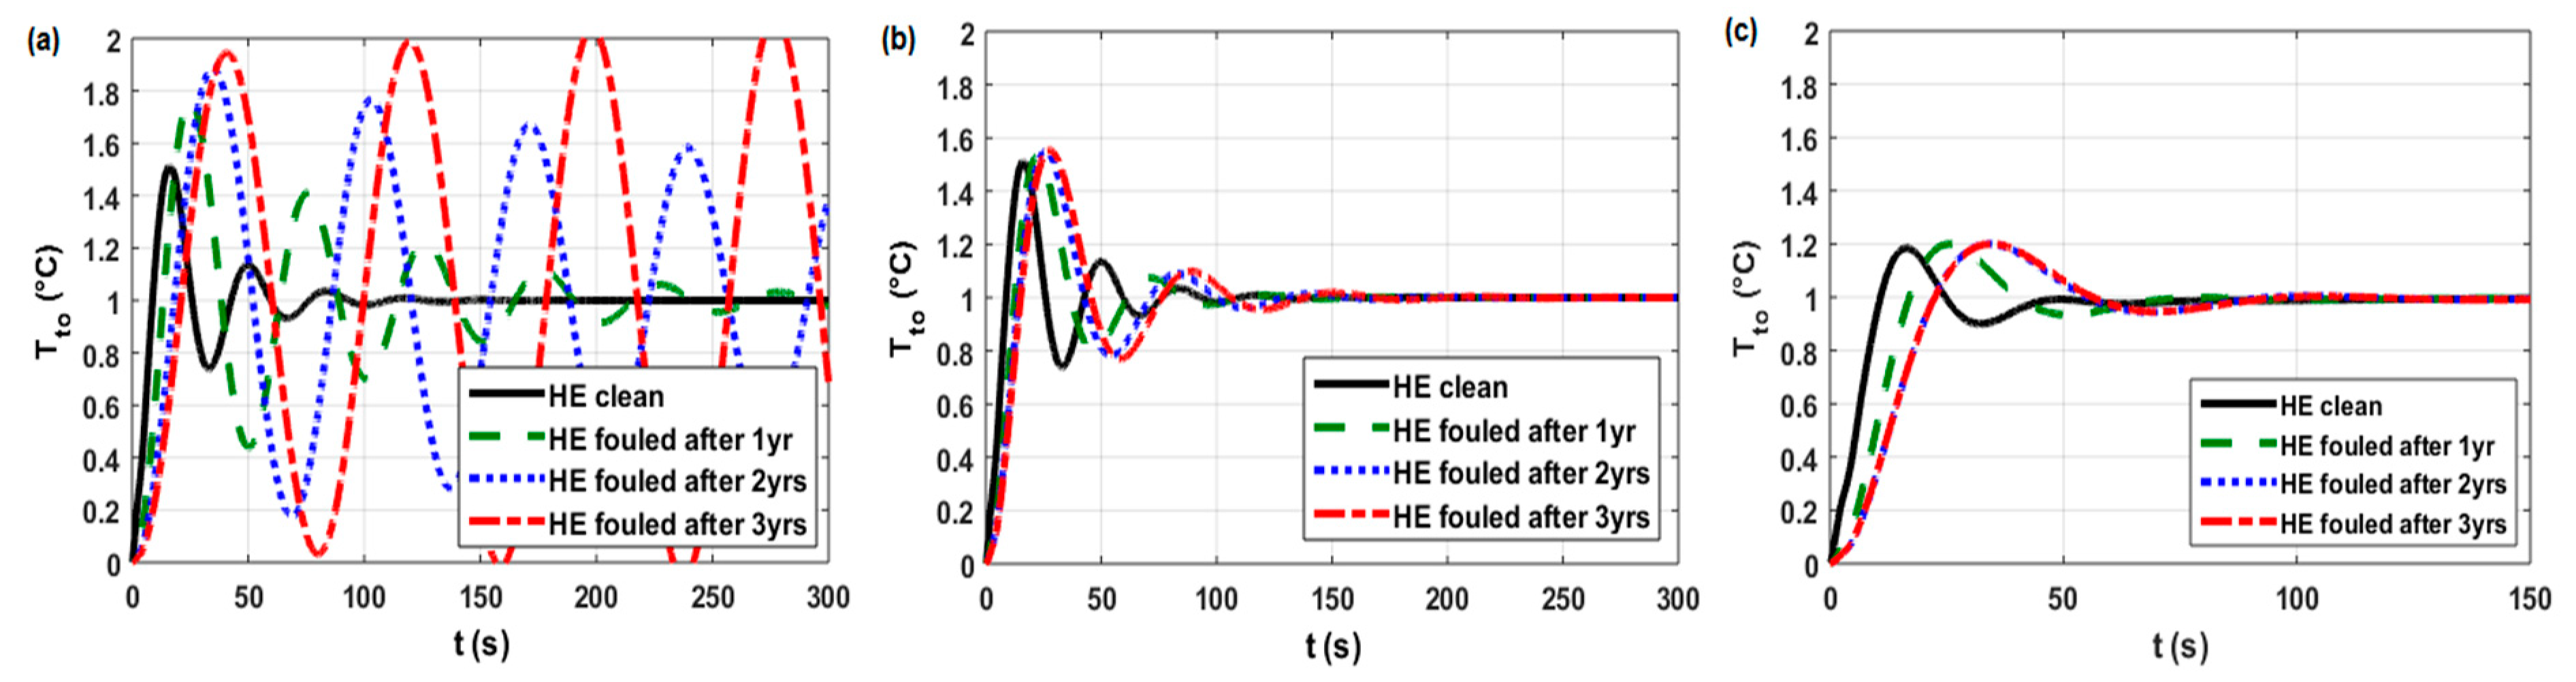
| Cases in work [6] (Figure 18) for HE11 control loop for HE15 control loop for HE30 control loop for HE35 control loop | 1 1 1 1 | 0 2 2 0 | 0 0 2 0 | (see Table A1) high medium medium high | (Figure A1a) (Figure A2a) (Figure A3a) (Figure A4a) |
© 2019 by the authors. Licensee MDPI, Basel, Switzerland. This article is an open access article distributed under the terms and conditions of the Creative Commons Attribution (CC BY) license (http://creativecommons.org/licenses/by/4.0/).
Share and Cite
Trafczynski, M.; Markowski, M.; Kisielewski, P.; Urbaniec, K.; Wernik, J. A Modeling Framework to Investigate the Influence of Fouling on the Dynamic Characteristics of PID-Controlled Heat Exchangers and Their Networks. Appl. Sci. 2019, 9, 824. https://doi.org/10.3390/app9050824
Trafczynski M, Markowski M, Kisielewski P, Urbaniec K, Wernik J. A Modeling Framework to Investigate the Influence of Fouling on the Dynamic Characteristics of PID-Controlled Heat Exchangers and Their Networks. Applied Sciences. 2019; 9(5):824. https://doi.org/10.3390/app9050824
Chicago/Turabian StyleTrafczynski, Marian, Mariusz Markowski, Piotr Kisielewski, Krzysztof Urbaniec, and Jacek Wernik. 2019. "A Modeling Framework to Investigate the Influence of Fouling on the Dynamic Characteristics of PID-Controlled Heat Exchangers and Their Networks" Applied Sciences 9, no. 5: 824. https://doi.org/10.3390/app9050824
APA StyleTrafczynski, M., Markowski, M., Kisielewski, P., Urbaniec, K., & Wernik, J. (2019). A Modeling Framework to Investigate the Influence of Fouling on the Dynamic Characteristics of PID-Controlled Heat Exchangers and Their Networks. Applied Sciences, 9(5), 824. https://doi.org/10.3390/app9050824