Accurate Evaluation of the Average Probability of Error of Pulse Position Modulation in Amplified Optical Wireless Communications under Turbulence


Abstract
1. Introduction
2. PPM Reception
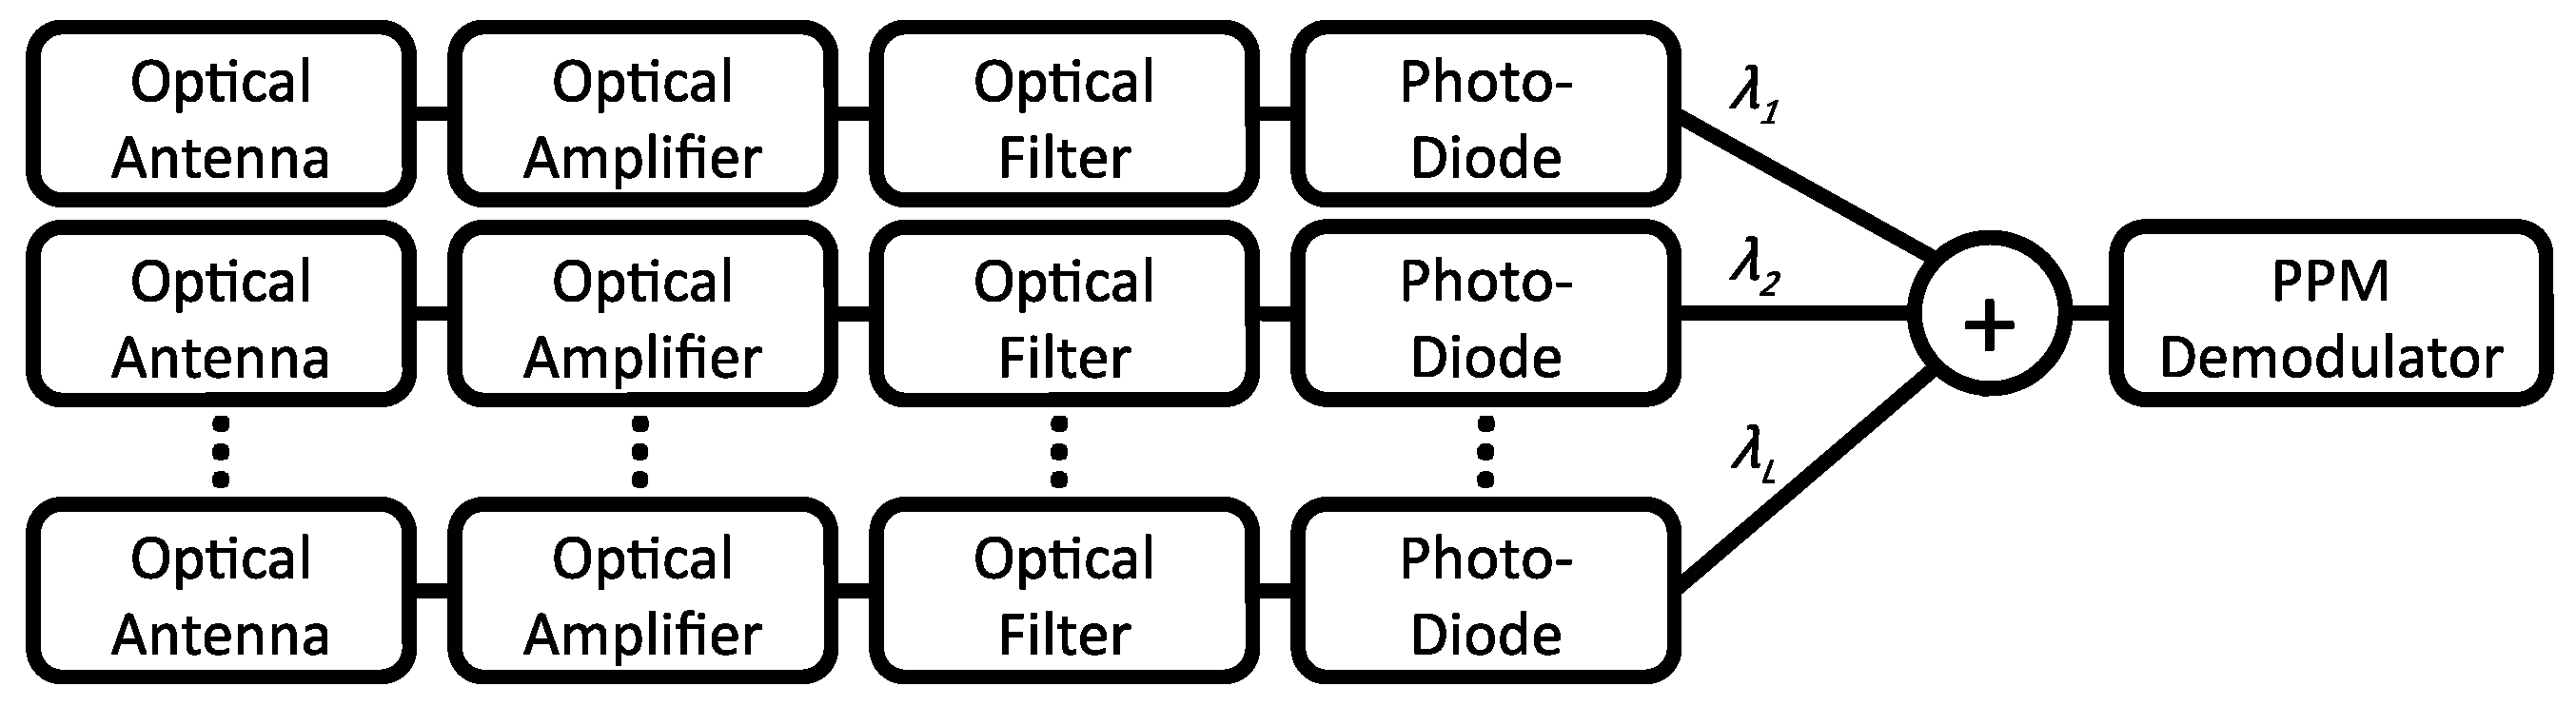
2.1. Receiver Model
2.2. PPM PER
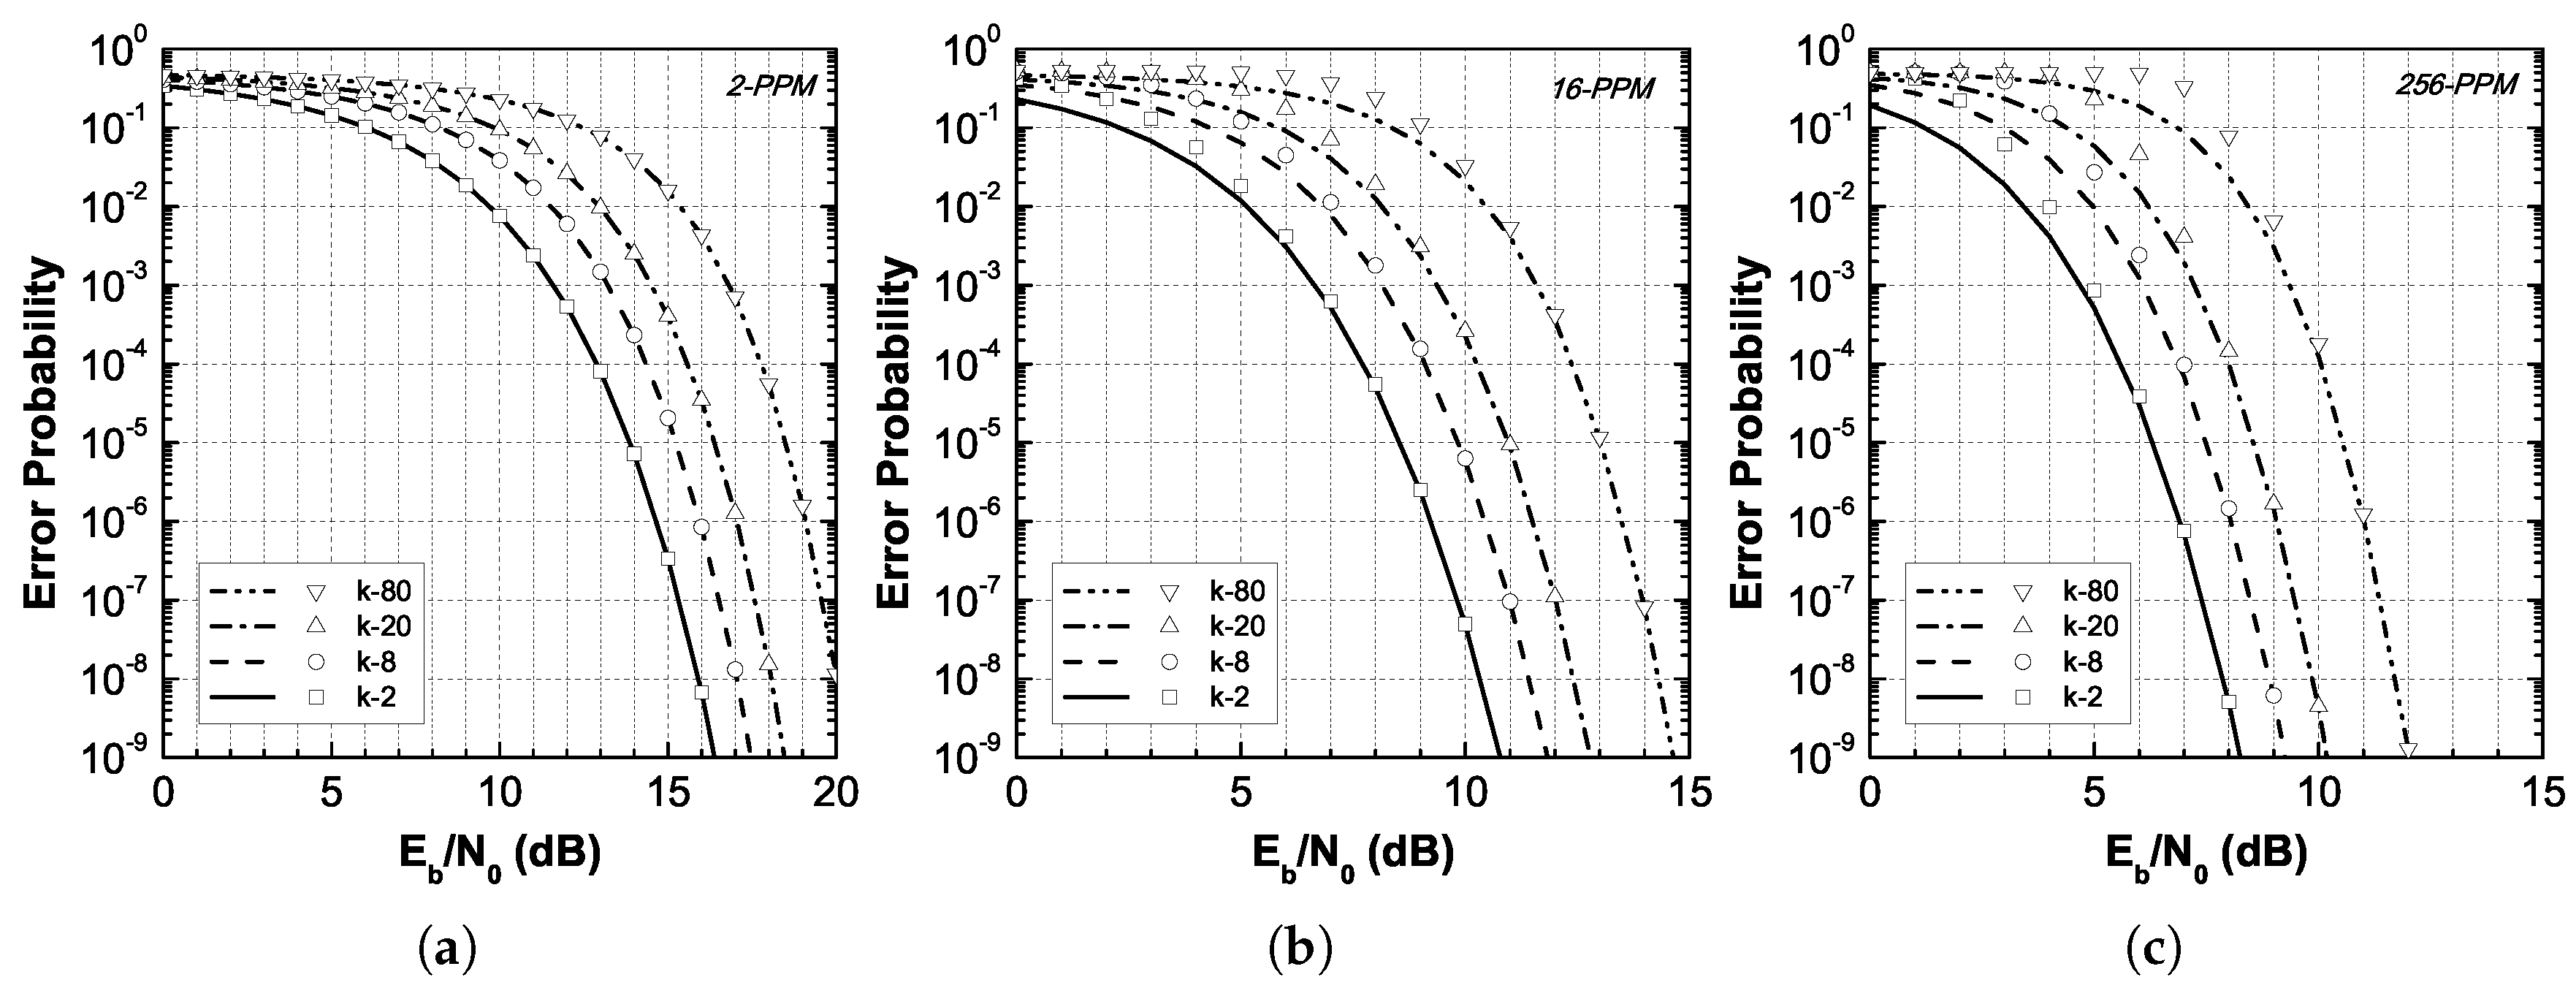
2.3. PER Results
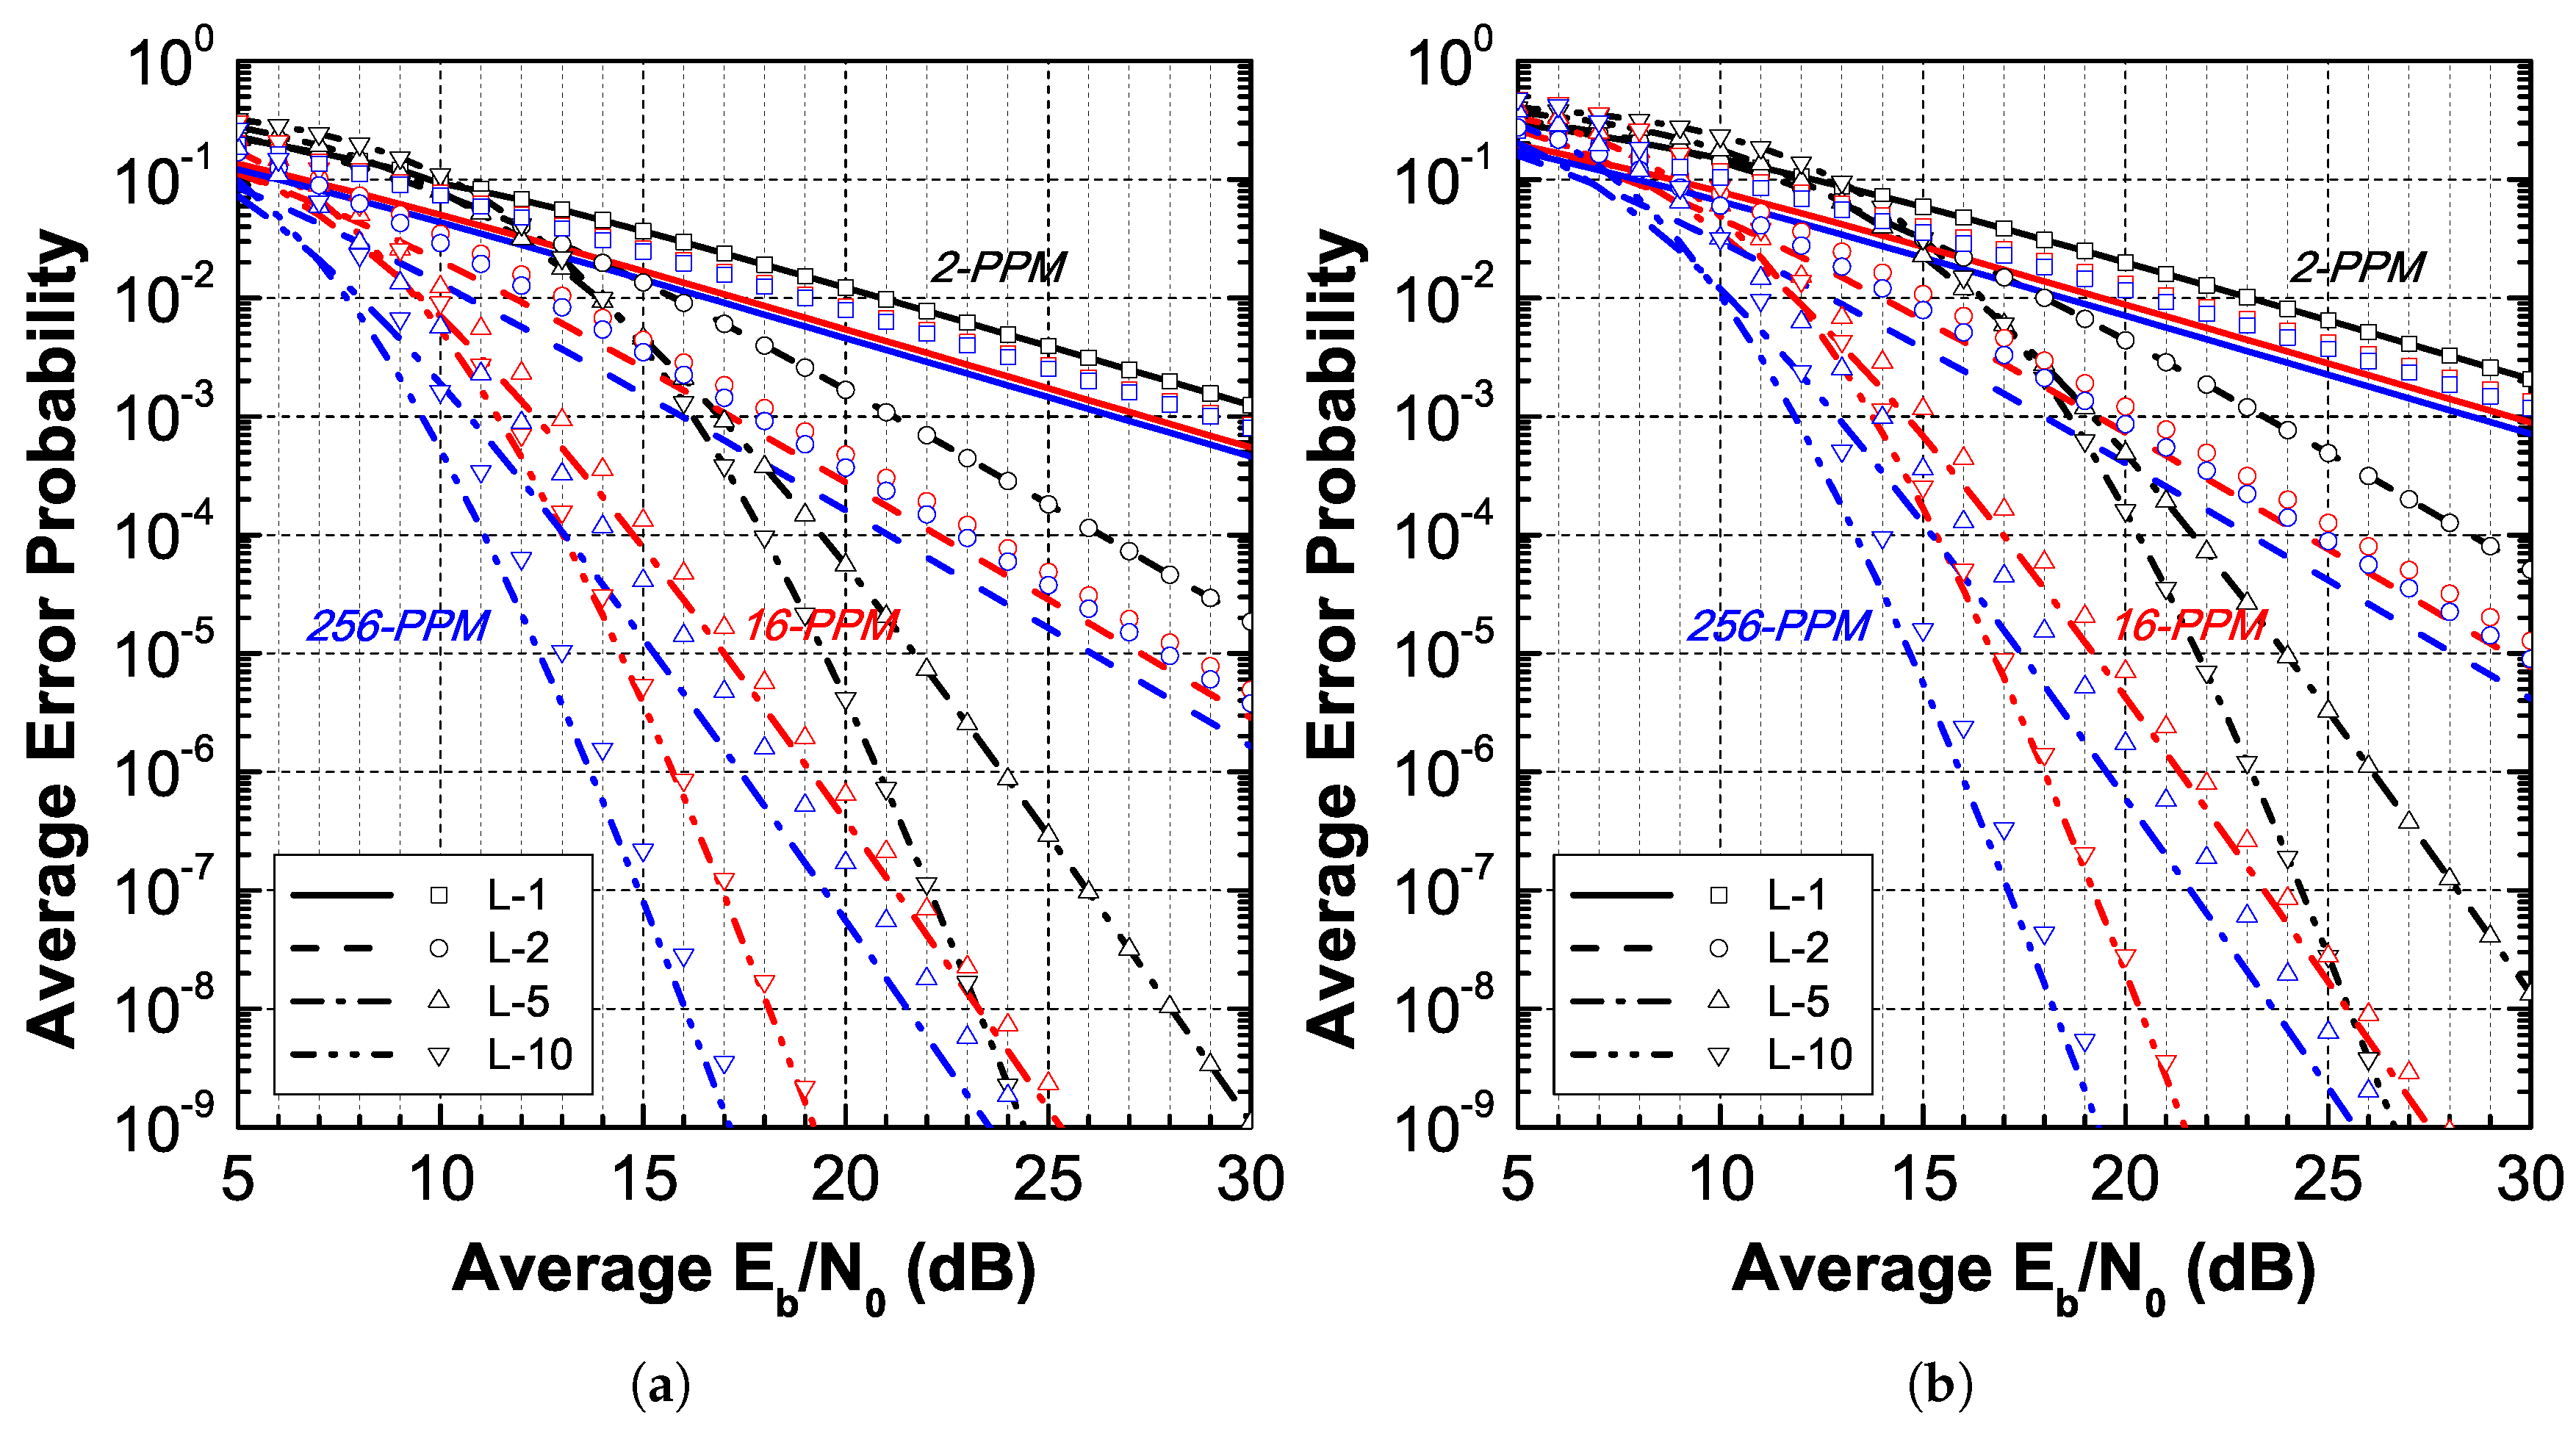
3. Average PER in Turbulent Channels
3.1. Channel Model
3.2. Weak and Moderate Fading
3.3. Strong Fading
4. Conclusions
Author Contributions
Funding
Conflicts of Interest
Abbreviations
| EGC | Equal-gain combiner |
| OSNR | Optical signal-to-noise-ratio |
| OWC | Optical wireless communication |
| PER | Probability of error |
| PPM | Pulse position modulation |
| RV | Random variable |
| SER | Symbol error probability |
References
- Wilson, S.G.; Brandt-Pearce, M.; Cao, Q.; Leveque, J.H. Free-space optical MIMO transmission with Q-ary PPM. IEEE Trans. Commun. 2005, 53, 1402–1412. [Google Scholar] [CrossRef]
- Cvijetic, N.; Wilson, S.G.; Brandt-Pearce, M. Performance Bounds for Free-Space Optical MIMO Systems with APD Receivers in Atmospheric Turbulence. IEEE J. Sel. Areas Commun. 2008, 26, 3–12. [Google Scholar] [CrossRef]
- Phillips, A.J.; Cryan, R.A.; Senior, J.M. Novel laser intersatellite communication system employing optically preamplified PPM receivers. IEE Proc.-Commun. 1995, 142, 15–20. [Google Scholar] [CrossRef]
- Stevens, M.L.; Boroson, D.M. A simple delay-line 4-PPM demodulator with near-optimum performance. Opt. Express 2012, 20, 5270–5280. [Google Scholar] [CrossRef] [PubMed]
- Fletcher, A.S.; Hamilton, S.A.; Moores, J.D. Undersea laser communication with narrow beams. IEEE Commun. Mag. 2015, 53, 49–55. [Google Scholar] [CrossRef]
- Humblet, P.A.; Azizoglu, M. On the bit error rate of lightwave systems with optical amplifiers. J. Lightwave Technol. 1991, 9, 1576–1582. [Google Scholar] [CrossRef]
- Razavi, M.; Shapiro, J.H. Wireless optical communications via diversity reception and optical preamplification. IEEE Trans. Wirel. Commun. 2005, 4, 975–983. [Google Scholar] [CrossRef]
- Karimi, M.; Nasiri-Kenari, M. Free Space Optical Communications via Optical Amplify-and-Forward Relaying. J. Lightwave Technol. 2011, 29, 242–248. [Google Scholar] [CrossRef]
- Kashani, M.A.; Rad, M.M.; Safari, M.; Uysal, M. All-Optical Amplify-and-Forward Relaying System for Atmospheric Channels. IEEE Commun. Lett. 2012, 16, 1684–1687. [Google Scholar] [CrossRef]
- Zhao, W.; Han, Y.; Yi, X. Error performance analysis for FSO systems with diversity reception and optical preamplification over gamma–gamma atmospheric turbulence channels. J. Mod. Opt. 2013, 60, 1060–1068. [Google Scholar] [CrossRef]
- Aladeloba, A.O.; Phillips, A.J.; Woolfson, M.S. Performance evaluation of optically preamplified digital pulse position modulation turbulent free-space optical communication systems. IET Optoelectron. 2012, 6, 66–74. [Google Scholar] [CrossRef]
- Hughes, L.W. A simple upper bound on the error probability for orthogonal signals in white noise. IEEE Trans. Commun. 1992, 40, 670. [Google Scholar] [CrossRef]
- Abramowitz, M.; Stegun, I.A. Handbook of Mathematical Functions with Formulas, Graphs, and Mathematical Tables; Dover: New York, NY, USA, 1964. [Google Scholar]
- Yiannopoulos, K.; Sagias, N.C.; Boucouvalas, A.C.; Peppas, K. Optimal Combining for Optical Wireless Systems With Amplification: The χ2 Noise Regime. IEEE Photonics Technol. Lett. 2018, 30, 119–122. [Google Scholar] [CrossRef]
- Andrews, L.C.; Phillips, R.L. Laser Beam Propagation through Random Media, 2nd ed.; SPIE Press: Bellingham, WA, USA, 2005. [Google Scholar]
- Vetelino, F.S.; Young, C.; Andrews, L.; Recolons, J. Aperture averaging effects on the probability density of irradiance fluctuations in moderate-to-strong turbulence. Appl. Opt. 2007, 46, 2099–2108. [Google Scholar] [CrossRef] [PubMed]
- Jurado-Navas, A.; Garrido-Balsells, J.M.; Paris, J.F.; Puerta-Notario, A. A Unifying Statistical Model for Atmospheric Optical Scintillation. In Numerical Simulations of Physical and Engineering Processes; Awrejcewicz, J., Ed.; IntechOpen: Rijeka, Croatia, 2011; Chapter 8. [Google Scholar]
- Yacoub, M.D. The α-μ Distribution: A Physical Fading Model for the Stacy Distribution. IEEE Trans. Veh. Technol. 2007, 56, 27–34. [Google Scholar] [CrossRef]
- Peppas, K.P. A Simple, Accurate Approximation to the Sum of Gamma-Gamma Variates and Applications in MIMO Free-Space Optical Systems. IEEE Photonics Technol. Lett. 2011, 23, 839–841. [Google Scholar] [CrossRef]


| l (m) | ||
|---|---|---|
| 100 | 16.53 | 14.91 |
| 500 | 4.04 | 1.53 |
| l–100 m | l–500 m | |||||
|---|---|---|---|---|---|---|
| L-2 | L-5 | L-10 | L-2 | L-5 | L-10 | |
| 0.49 | 0.48 | 0.47 | 0.51 | 0.46 | 0.43 | |
| 64.76 | 167.71 | 339.61 | 7.72 | 23.09 | 50.45 | |
| 1.97 | 4.97 | 9.97 | 1.78 | 4.73 | 9.71 | |
© 2019 by the authors. Licensee MDPI, Basel, Switzerland. This article is an open access article distributed under the terms and conditions of the Creative Commons Attribution (CC BY) license (http://creativecommons.org/licenses/by/4.0/).
Share and Cite
Boucouvalas, A.C.; Sagias, N.C.; Yiannopoulos, K. Accurate Evaluation of the Average Probability of Error of Pulse Position Modulation in Amplified Optical Wireless Communications under Turbulence. Appl. Sci. 2019, 9, 749. https://doi.org/10.3390/app9040749
Boucouvalas AC, Sagias NC, Yiannopoulos K. Accurate Evaluation of the Average Probability of Error of Pulse Position Modulation in Amplified Optical Wireless Communications under Turbulence. Applied Sciences. 2019; 9(4):749. https://doi.org/10.3390/app9040749
Chicago/Turabian StyleBoucouvalas, Anthony C., Nikos C. Sagias, and Konstantinos Yiannopoulos. 2019. "Accurate Evaluation of the Average Probability of Error of Pulse Position Modulation in Amplified Optical Wireless Communications under Turbulence" Applied Sciences 9, no. 4: 749. https://doi.org/10.3390/app9040749
APA StyleBoucouvalas, A. C., Sagias, N. C., & Yiannopoulos, K. (2019). Accurate Evaluation of the Average Probability of Error of Pulse Position Modulation in Amplified Optical Wireless Communications under Turbulence. Applied Sciences, 9(4), 749. https://doi.org/10.3390/app9040749