1. Introduction
As cheap but effective defensive weapons, landmines have been widely deployed since World War I. About 100 million landmines remain to be removed in more than 80 countries. These landmines kill or injure approximately 20,000 people every year. More people get poorer because the contaminated land is not suitable for agricultural or industrial production [
1,
2,
3,
4]. However, landmine detection has been a historically difficult problem.
Landmines are 5–30 cm in diameter (including anti-personnel and anti-tank mines), their casing materials vary from plastic to metal, and the burial environments are very complicated. Under these circumstances, even though many techniques have been developed for landmine detection, current researches indicate that no single device can detect landmine to a real performance level. Metal detection based on electromagnetic induction (EMI) can only detect landmines containing a certain amount of metal components, and it may lead to a high rate of false alarm due to metal shreds that are very common on battlefields [
5,
6]. Ground penetrating radar (GPR) images geophysical subsurface by acquiring reflected radar signals that are related to underground dielectric variations and it has a larger detection depth when compared to EMI method, but it also may cause a high false-positive detection rate due to the existences of big rocks, animal burrows, and roots [
7,
8]. The nuclear quadrupole resonance method observes the presence of abundant nitrogen in the explosives (TNT and DNT) of the mine, is why this device is very expensive and difficult to operate [
9]. Dogs and rats have also been trained to sense the explosive vapor that is diffused from the mine for their remarkable sense of smell, but the training time is long and the detection result is dependent on individual animal’s work status [
10]. Other methods, like X-ray backscatter and electric impedance tomography (EIT), are limited by the lack of safety involved in X-ray radiation [
11] and detection depth [
12].
Mine prodders can be traced to World War I and they are still most common supplementary tools in landmine detection because of their adaptability on detecting metal or nonmetal landmines that are buried in complex circumstances [
13,
14,
15,
16,
17,
18]. Generally, prodding a landmine with a force of 25 N is unlikely to detonate a mine, though 50 N is regarded to be “safe” by some authorities [
19]. A conventional prodder is usually a steel stick that is 30 cm in length. After the rain has softened the soil, deminers use the prodder to inspect subsurface of suspect area by poking the ground gently to contact the buried object to sense whether it is a landmine by their senses of touch and sound. Therefore, in recent years, many novel prodders with force feedback have been developed to explore new solutions for landmine detection by combining sensors with prodders [
20,
21,
22,
23,
24,
25].
Giovanni Borgioli et.al. introduced a sensorized prodder to detect landmines that are buried in shallow soil based on their mechanical feature of big compliance when compared to stone, root, and other clutters [
26]. This prodder consists of three main parts: an electromechanical actuator, a thin steel rod, and an accelerometer that is fixed on it. After the steel rod is inserted in to the soil to obtain contact with the buried object to form a prodder-object coupling system, an external electronic unit provides power supply and excitation signals to drive the actuator to stimulate the buried object, and the vibration signal that is measured by the accelerometer mounted on the rod is transmitted to the signal processing unit for characteristic analysis. The tests that were carried out in the laboratory and an outdoor test bed validated that the buried objects’ vibration responses are well distinguishable both in the frequency range and vibration intensity due to the landmine having a larger compliance when compared to roots, stones, and other rigid clutters for the landmine structure contains an air cavity between the explosive cavity and upper casing.
Since the vibration response is the key feature in distinguishing landmine from other rigid buried objects. When compared to the Ref. [
26], we further studied the theoretical model of the prodder-object coupling system to investigate the effects of system parameters on the measured response signal features in this paper. A numerical analysis method is proposed to quantitatively investigate the resonance behavior of the prodder-object system and their influencing factors. The calculation result met well with the simulation and experimental data published in [
26], which verifies the feasibility of this proposed numerical method. Based on the analysis results regarding system sensitivity, an optimal design for a better performing prodder is proposed, and the measured signal strength can increase 122.78% theoretically, which means greater depth of detection can be acquired, and a simulation experiment is conducted to verify the proposed optimal design with the optimization function of Adams software. This analysis procedure provides a reference for developing a good performing prodder.
2. Modeling of the Prodder-Object System and the Numerical Analysis Method
As shown in
Figure 1a, the prodder that is described in Ref. [
26] is composed of seven components, namely, (1) electromechanical actuator; (2) adjusting load spring; (3) aluminum cylinder for mechanical connection between springs; (4) aluminum cylinder for mechanical connection between spring and steel rod; (5) steel rod; (6) triaxial accelerometer with the y-axis aligned with the steel rod; and, (7) shell of the prodder.
The air cavity between a thin upper casing and the explosive makes the landmine structure more compliant than other buried clutters, such as rocks, tree roots, metal shreds, etc. The prodder is designed to distinguish landmines from those clutters by sensing buried objects’ resonance behavior, including vibration intensity and frequency response.
In the detection procedure, the rigid steel rod is inserted into soil to get direct contact with the buried object to form a prodder-object coupling system. Subsequently, a programmable data acquisition board generates a chrip signal to control a pulsewidth-modulated (PWM) power driver that excites the electromechanical actuator of the prodder to vibrate. The steel rod stimulates the buried object with the mechanical force output from the actuator resultantly. For safety consideration, the output force of the prodder should be controlled below 10 N by adjusting the PWM power driver current. Meanwhile, the acceleration of the contact point is measured by a light silicon MEMS accelerometer that is mounted on the steel rod and then transmitted to the acquisition board for data analysis. After Analogue-to-Digital (A/D) conversion, filtering and Fast Fourier Transformation (FFT) processing of the measured data, the frequency response of the buried object can be acquired. Landmine structure is typically much more compliant than those rigid clutters, thus the vibration intensity of landmine would be much larger and its natural frequency would focus on the low frequency band when compared to other rigid clutters. Since these two resonance behaviors are the key features in distinguishing landmines from other rigid clutters, the resonance mechanism of the prodder-object coupling system should be further studied to make the influencing factors and their influencing mechanism clear.
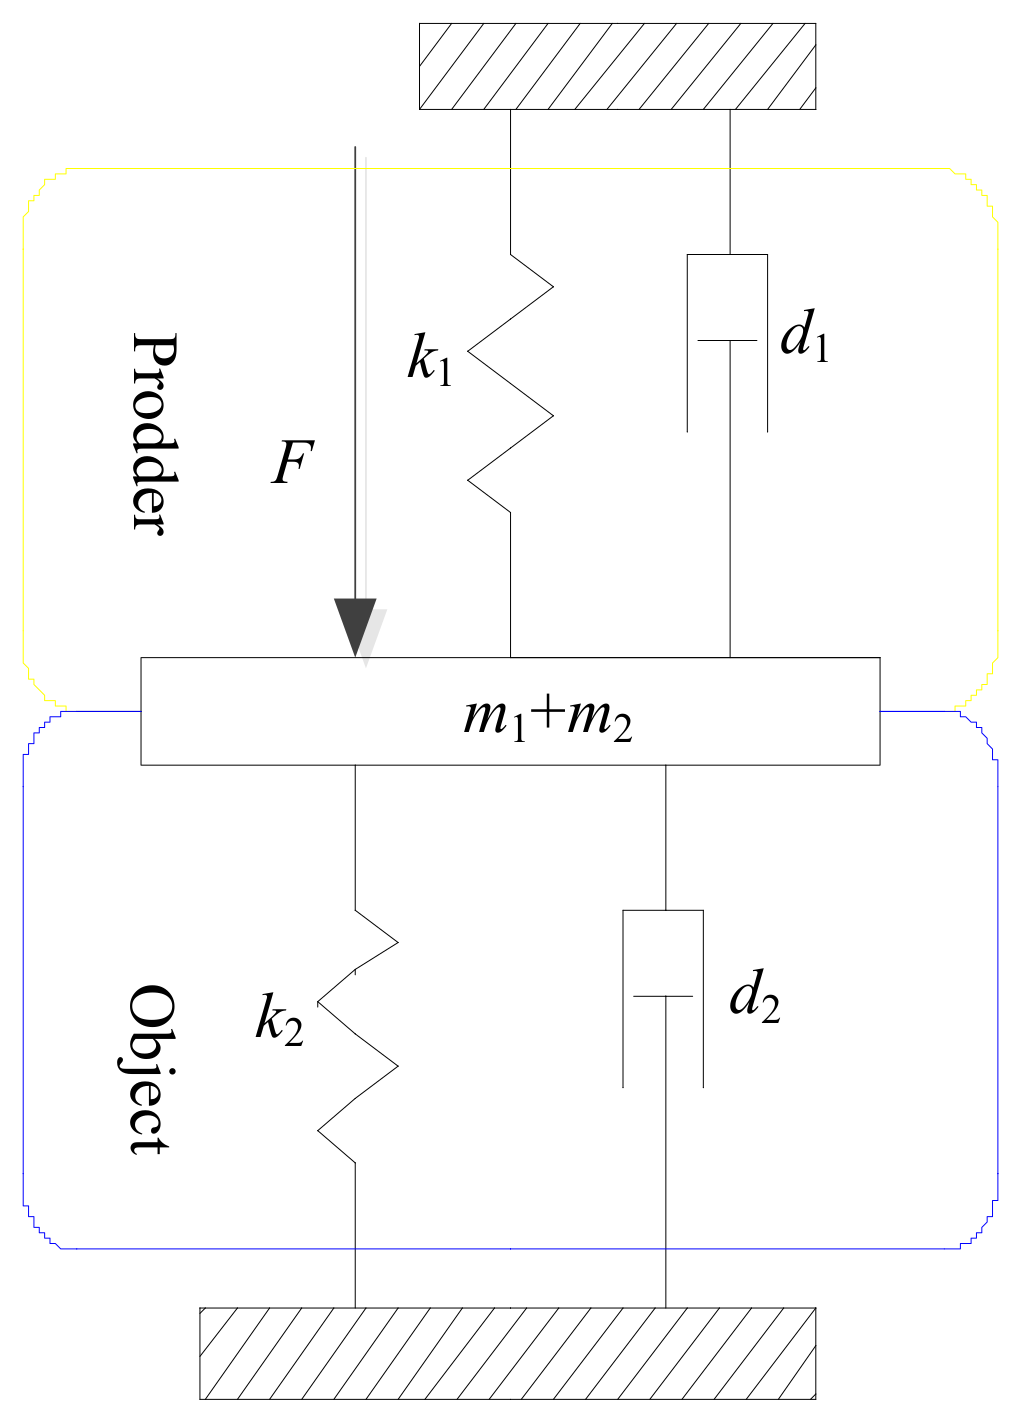
The kinetic model of this prodder-object system can be obtained by lumped parameter method; this method has been used to investigate acoustic landmine detection [
27,
28]. As indicated in
Figure 1b,
k1 and
c1 represent the stiffness and damping constants of adjusting spring respectively; and,
k2 and
c2 represent the viscoelastic parameters of the moving part of buried object’s upper casing; Stiffness constant
k3 and damping constant
c3 of the prodder-object coupling part are equivalent to the viscoelastic constants of steel rod. While
m1 and
m2 represent the mass of the moving parts of prodder and buried object respectively.
According to the lumped model that is shown in
Figure 1b and linear vibration theory, we can obtain the following kinetic equations:
The above equations in matrix form can be written, as follows:
where
X = diag(
x1,
x2) is the displacement matrix dependent on the moving part of prodder and buried object, thus
and
are the corresponding velocity and acceleration matrixes, respectively; while
,
,
,
.
After being Fourier transformed, the matrix Equation (2) can be written, as follows:
Accordingly,
Z(
ω), the impedance matrix of Equation (3), can be written as the following equation:
Subsequently, det
Z(
ω) and
adjZ(
ω), the determinant and adjoint matrixes of
Z(
ω), respectively, can be written, as follows:
Afterwards, the system frequency response function
H(
ω) can be written, as follows:
In the 2·2 matrix
H(
ω),
Hlp(
ω) is the transfer function between the
l th and
p th component of the system. In this case,
H12(
ω), the transfer function between prodder and buried object, can be written, as follows:
where
;
;
;
;
; and,
.
3. Numerical Analysis of the Influencing Mechanisms of Prodder-Object System Parameters
3.1. Verification of the Mathematical Analysis Method
For testing the numerical analysis method, the results of mathematical analysis and experiments are compared. The data reported in
Table 1 are the measured mechanical parameters of the prodder-object system, a plastic box with a diameter of 95 mm is used as the non-metallic landmine simulant, since the effects of a hollow plastic cap that simulates the upper casing of a landmine [
26].
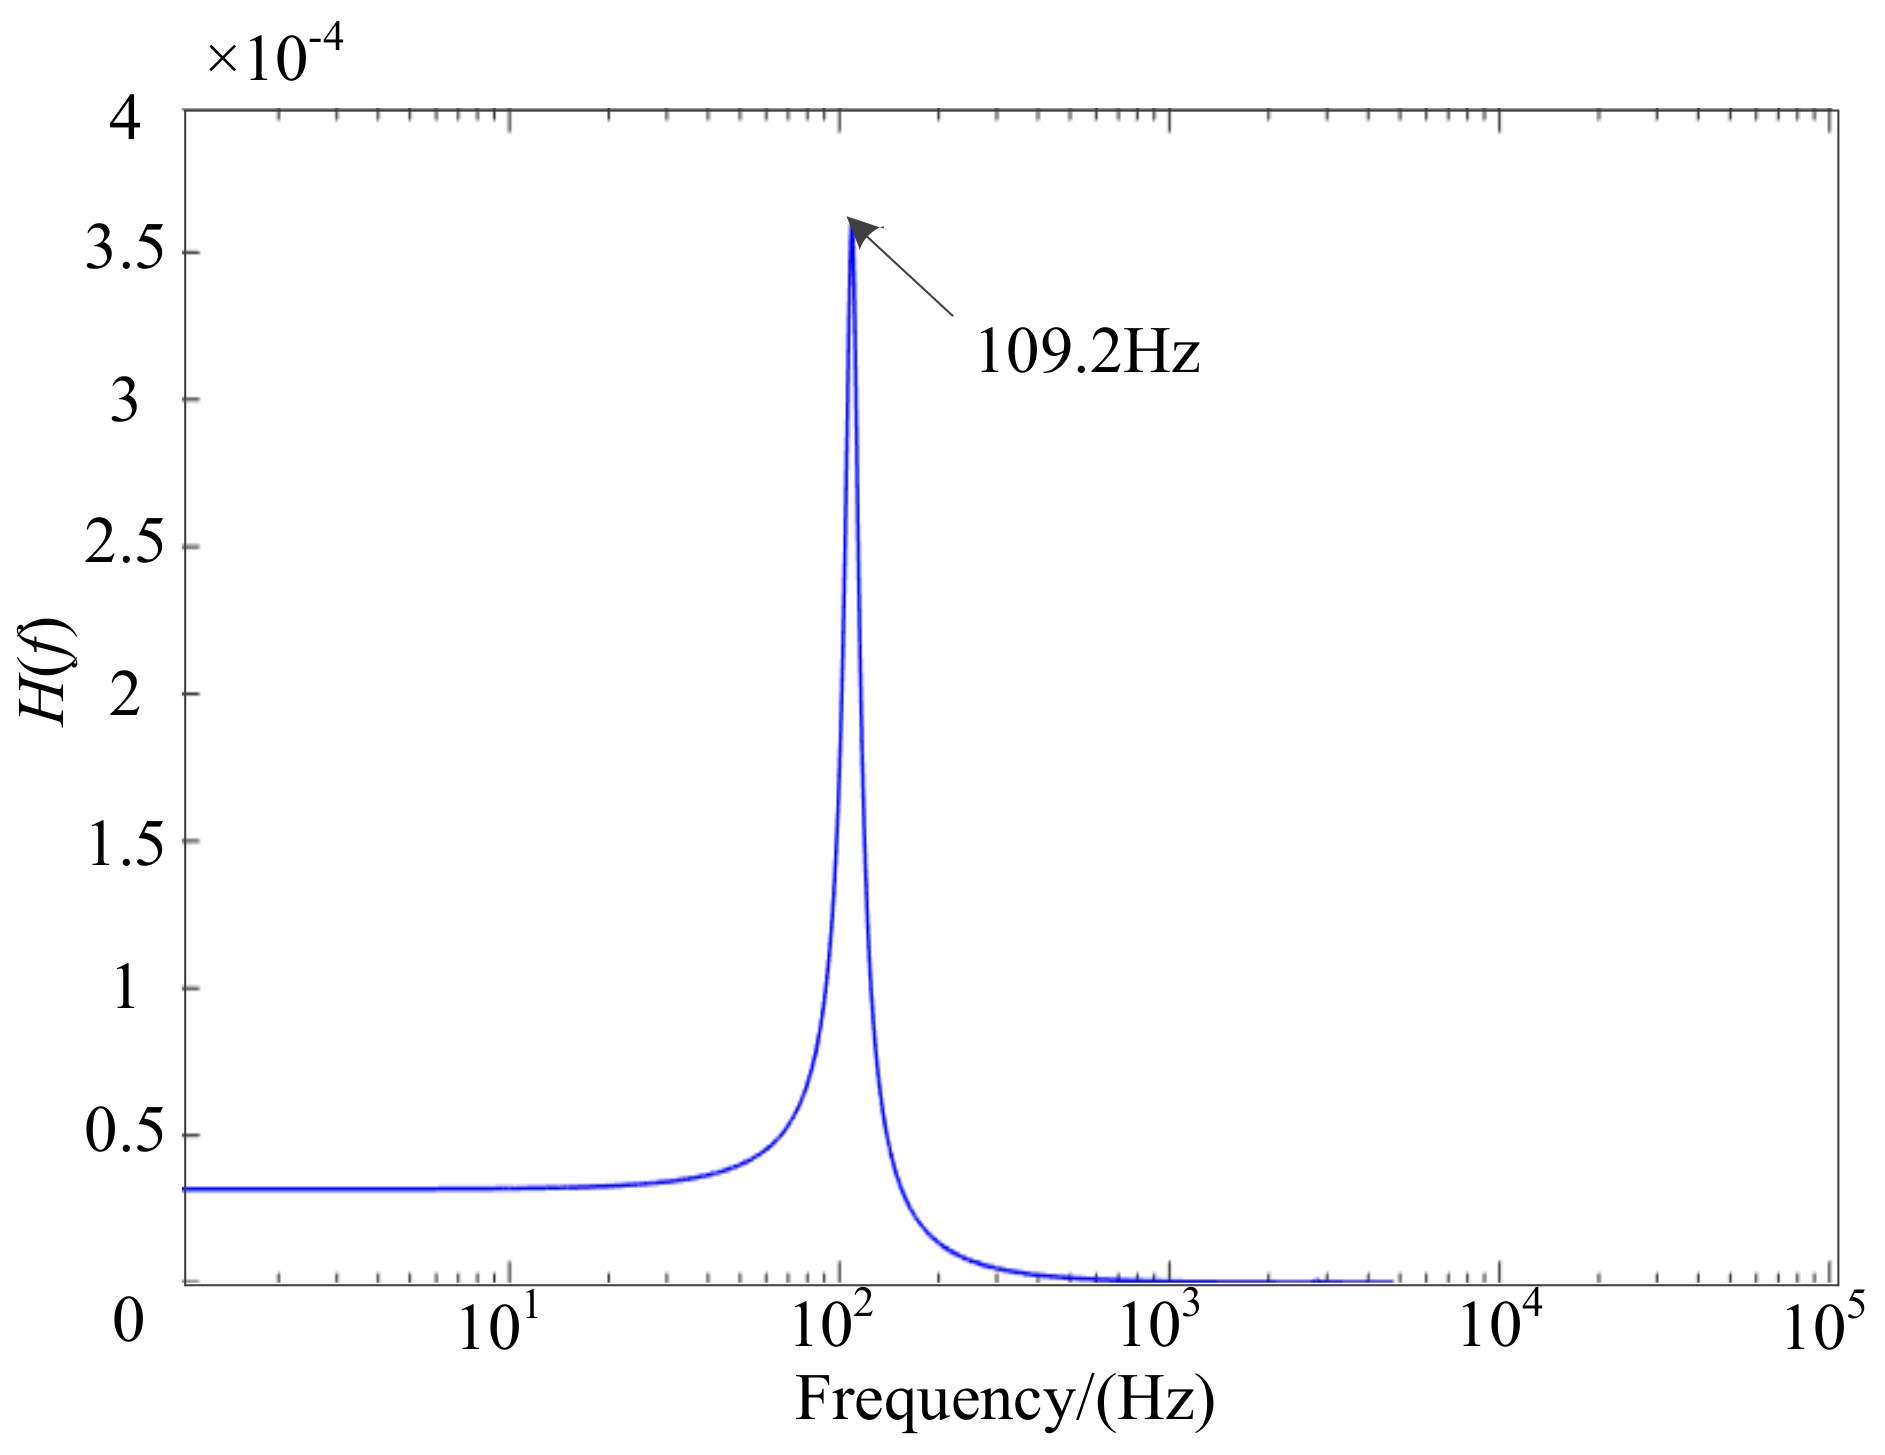
After substituting all of the above data into Equation (8), the calculated frequency response of the plastic box is shown in
Figure 2. The resultant main resonance frequency is 109.2Hz, meeting well with the result 110 Hz that is published in Ref. [
26], which validates our mathematical analysis method.
3.2. Effects of Prodder Components on the Vibrational Characteristics of Buried Object
The resonance behavior of prodder-object system is the most important feature in distinguishing a buried landmine. However, the influencing mechanisms of prodder’s each component on the buried object’s vibrational characteristics are not clear. On the other hand, the amplitude at resonance frequency is equivalent to the measured signal strength, but the object’s vibration intensity usually diminishes with the increase of burial depth, which indicates that a better performing prodder should acquire greater signal strength under the same condition. Therefore, in the following sections, the effects of prodder’s each component on the measured signal are quantitatively analyzed with the proposed mathematical method to explore the optimal design parameters for a better performing prodder.
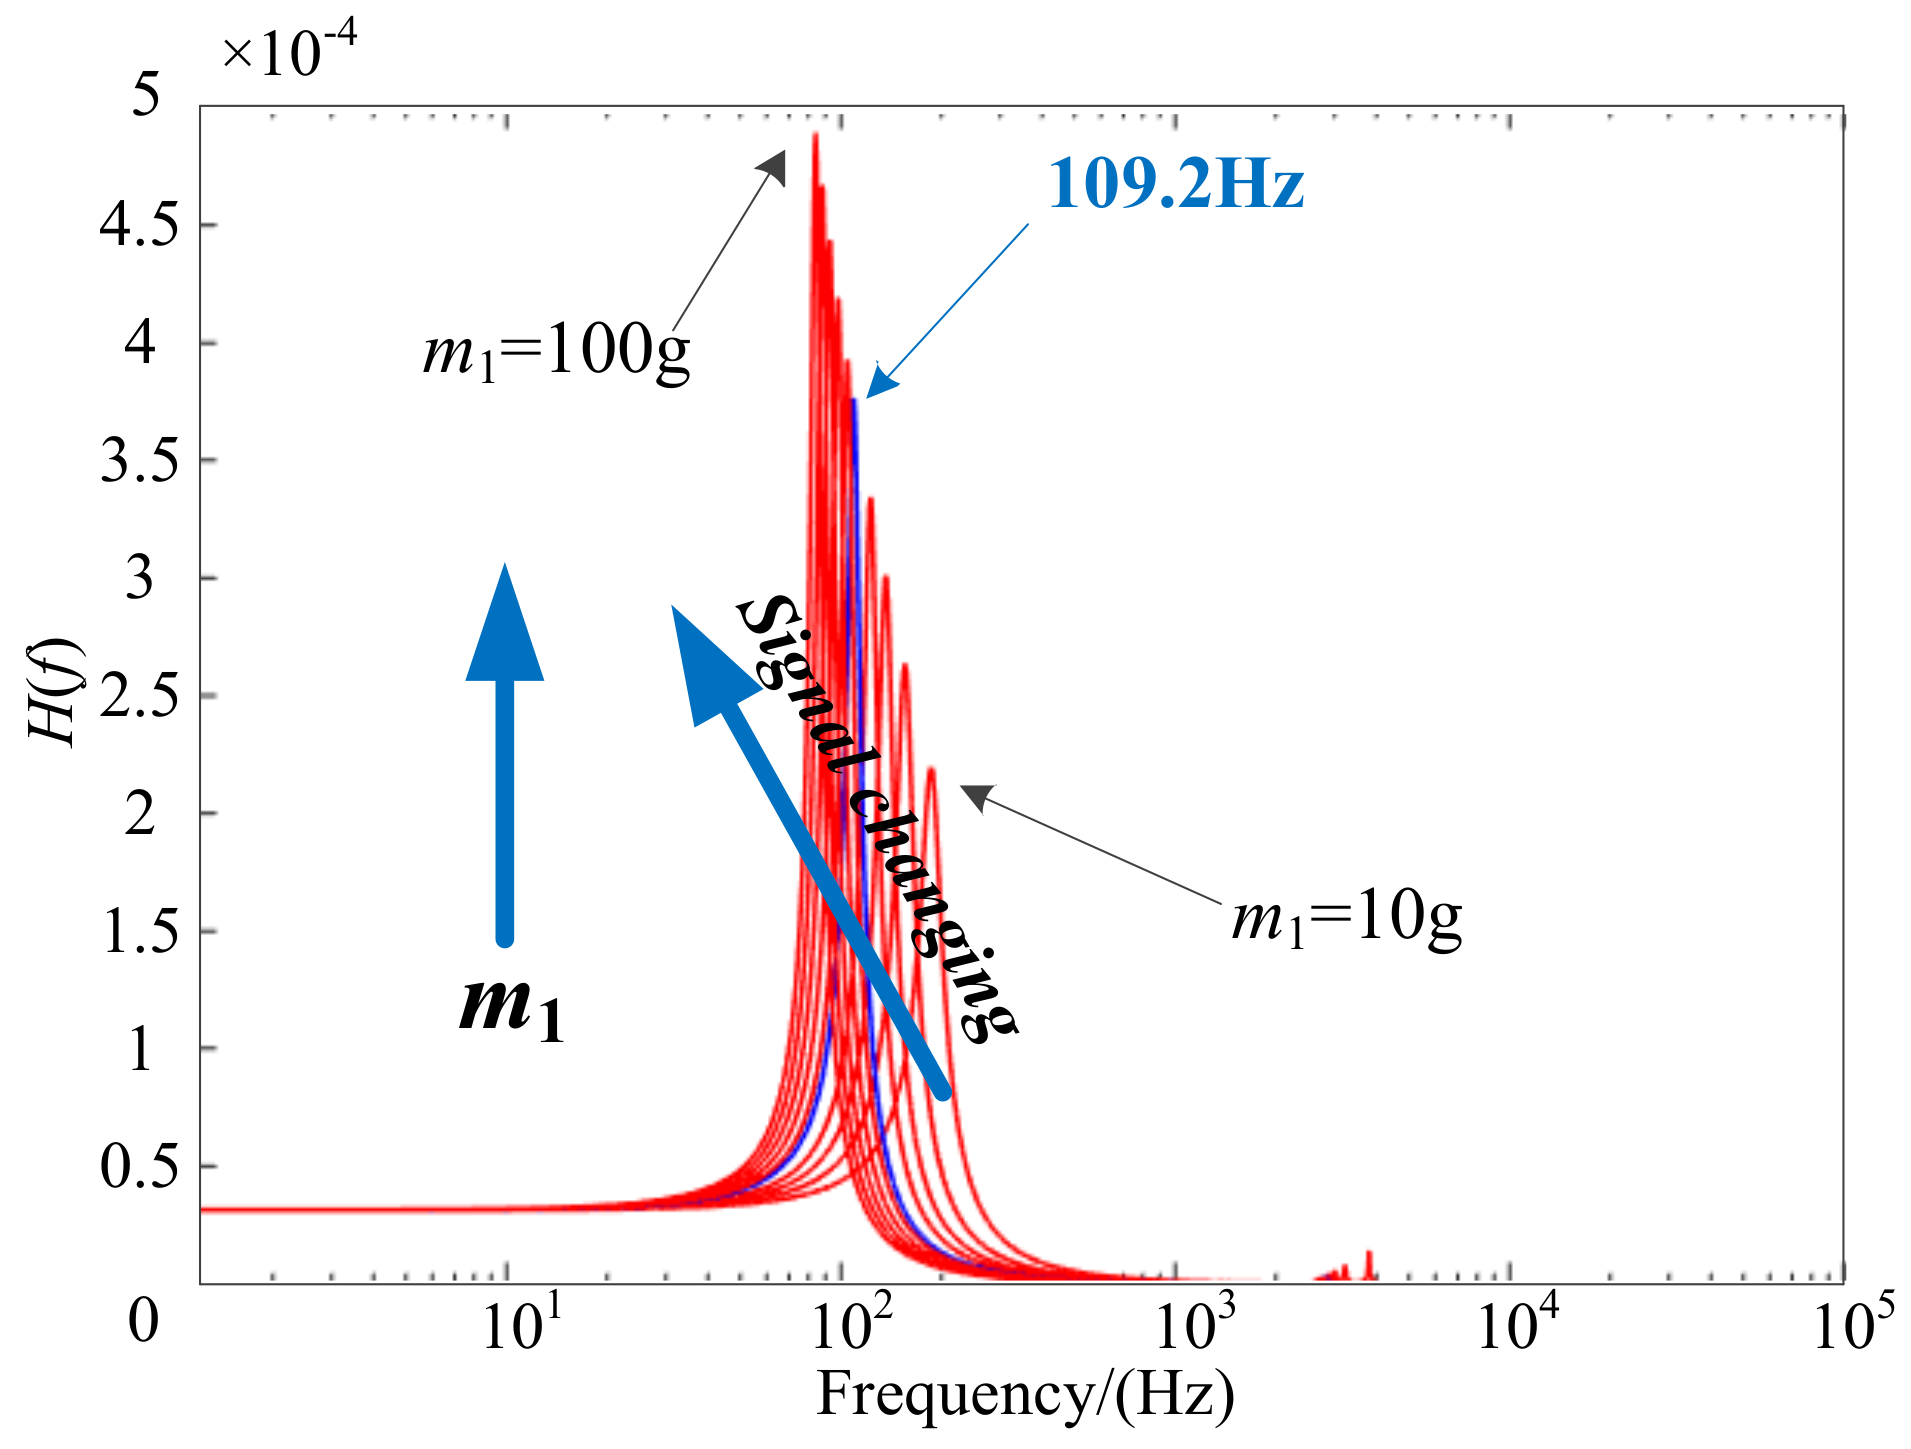
3.2.1. Effects of m1, the Mass of the Moving Part of Prodder
Parameter
m1 represents the mass of the moving part of prodder, which includes the total mass of steel rod, accelerometer, actuator’s mobile part, adjusting springs, and aluminum cylinders. As shown in
Figure 3, the resulting vibration intensity at the main resonance frequency of the plastic box increases by adjusting the value of
m1 from 10 g (mass of accelerometer) up to 100 g, while the other parameter values did not change, which indicates that the value of
m1 should be reasonably large to obtain greater signal strength.
3.2.2. Effects of k1, the Stiffness of Adjusting Load Spring
Figure 4 shows that both the intensity and frequency features of the plastic box vibration change little when the value of
k1 is variable from 600 N/m to 30 kN/m. It demonstrates that, with adjusting spring, which as an energy storage element, the effect of its stiffness on the measured signal could be ignored.
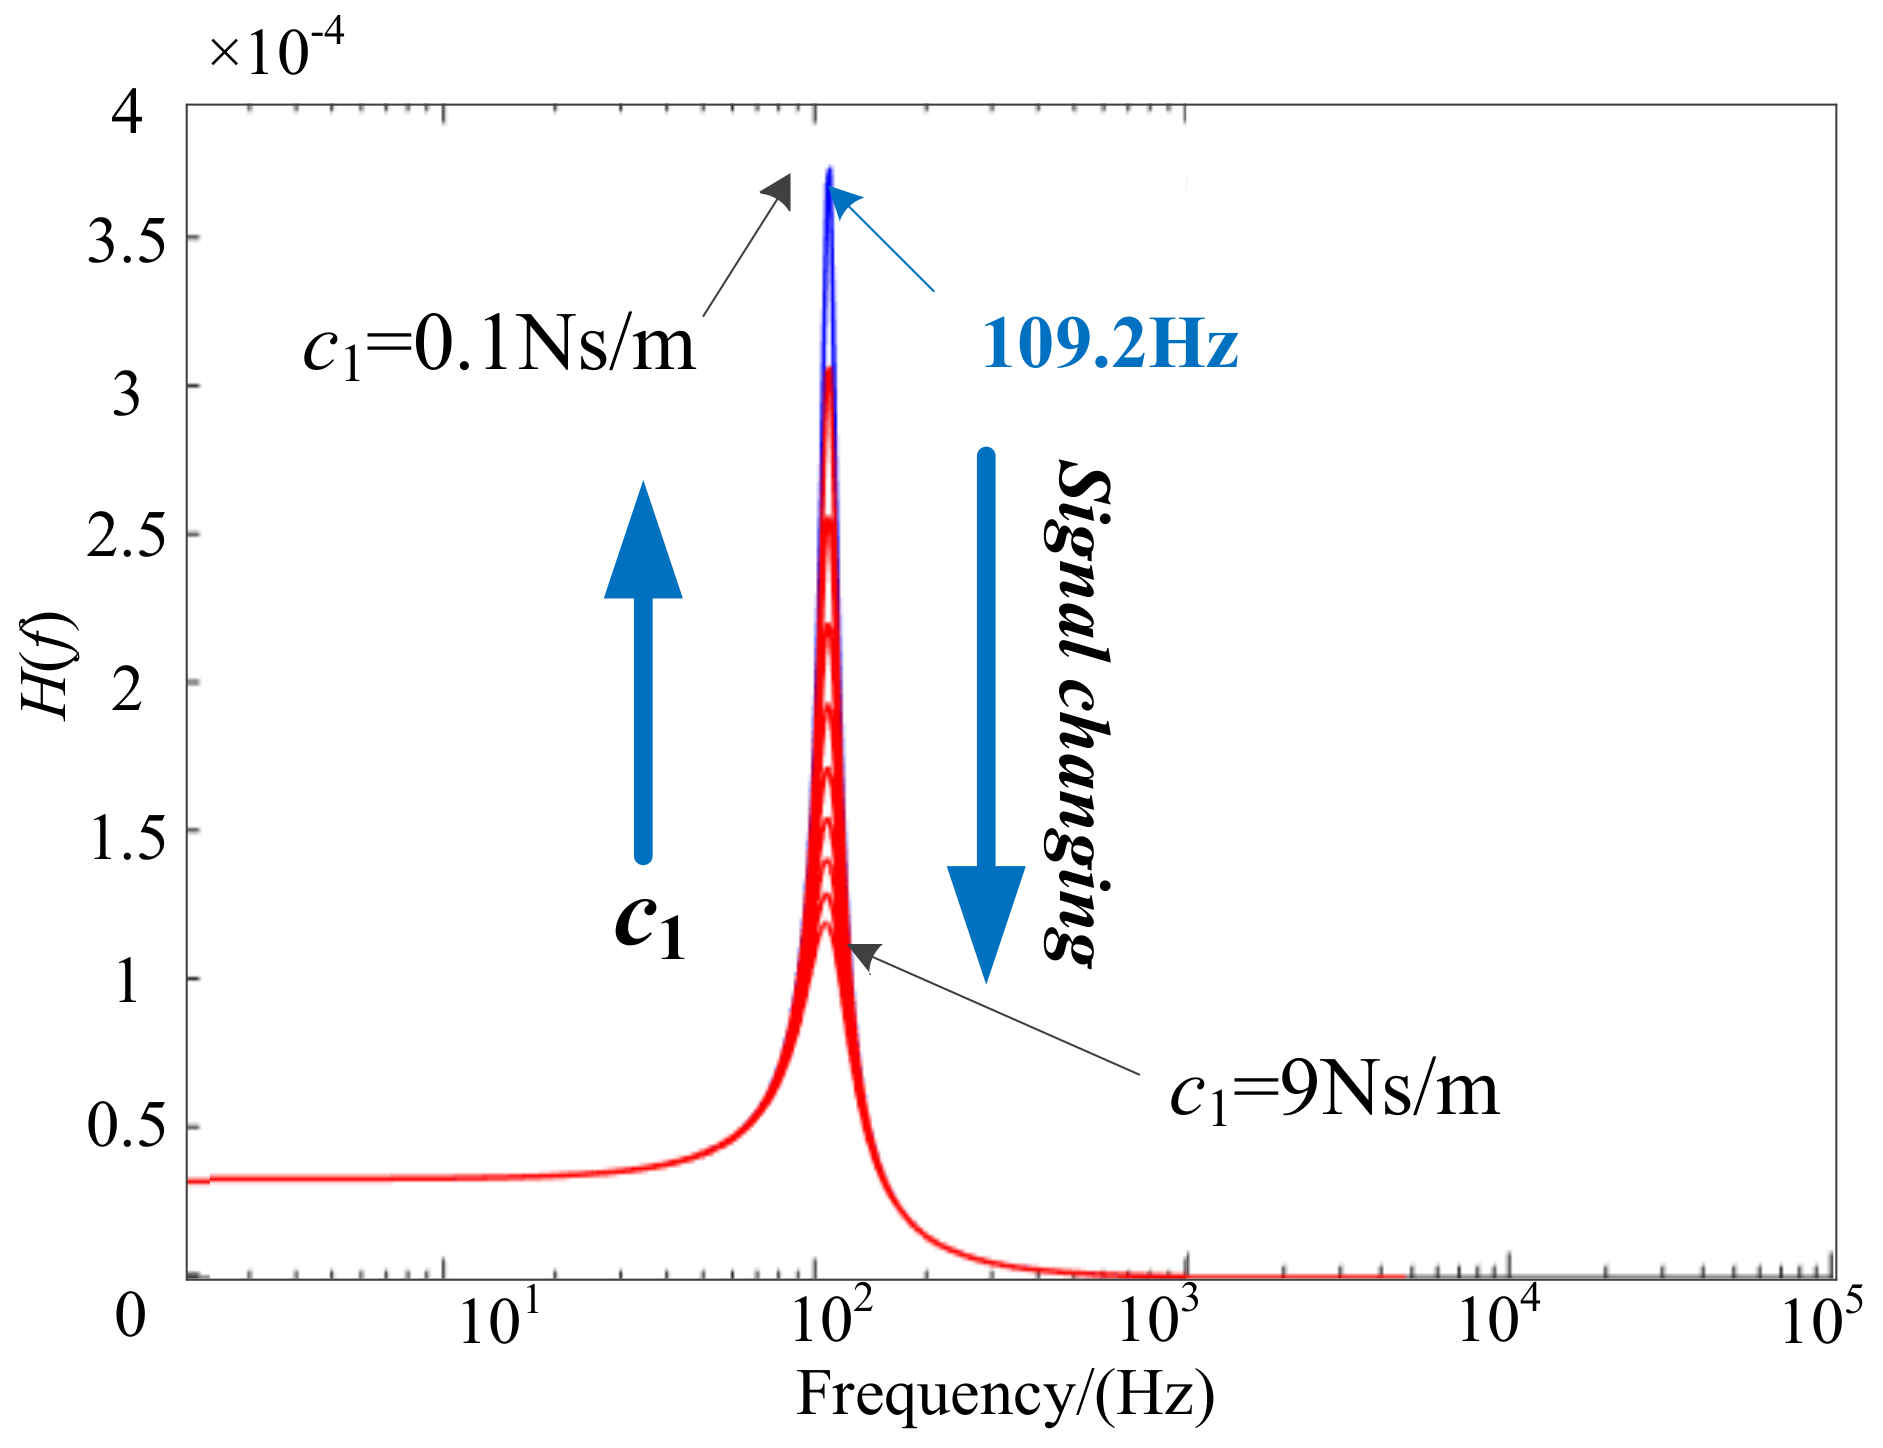
3.2.3. Effects of c1, the Damping Coefficient of the Adjusting Spring
With the value of damping coefficient
c1 increasing from 0.1 Ns/m to 9 Ns/m, the resonance frequency of the plastic box remains unchanged, while the vibration intensity decreases a lot, as shown in
Figure 5.
Ideally, the adjusting spring is used as an energy storage element without changing the magnitude of the output force that is exported from electromechanical actuator. However, in practice, there is still a part of energy consumed by the damping effect of the spring. Thus, damping coefficient of the adjusting spring should be small enough to acquire better detection performance.
3.3. Effects of the Prodder-Object Coupling Part on Plastic Box Vibrational Characteristics
The lumped model shown in
Figure 1b is a two-degree freedom mechanical model that has two resonance frequencies, namely the main resonance frequency and a higher second resonance frequency, as introduced by the coupling part (steel rod). The values of
k3 and
c3 are uncertain when the rod and the measured object are not in good contact. Moreover, the value of
c3 is difficult to measure. Therefore, it is necessary to analyze the effects of the coupling part on the measured signal characteristics.
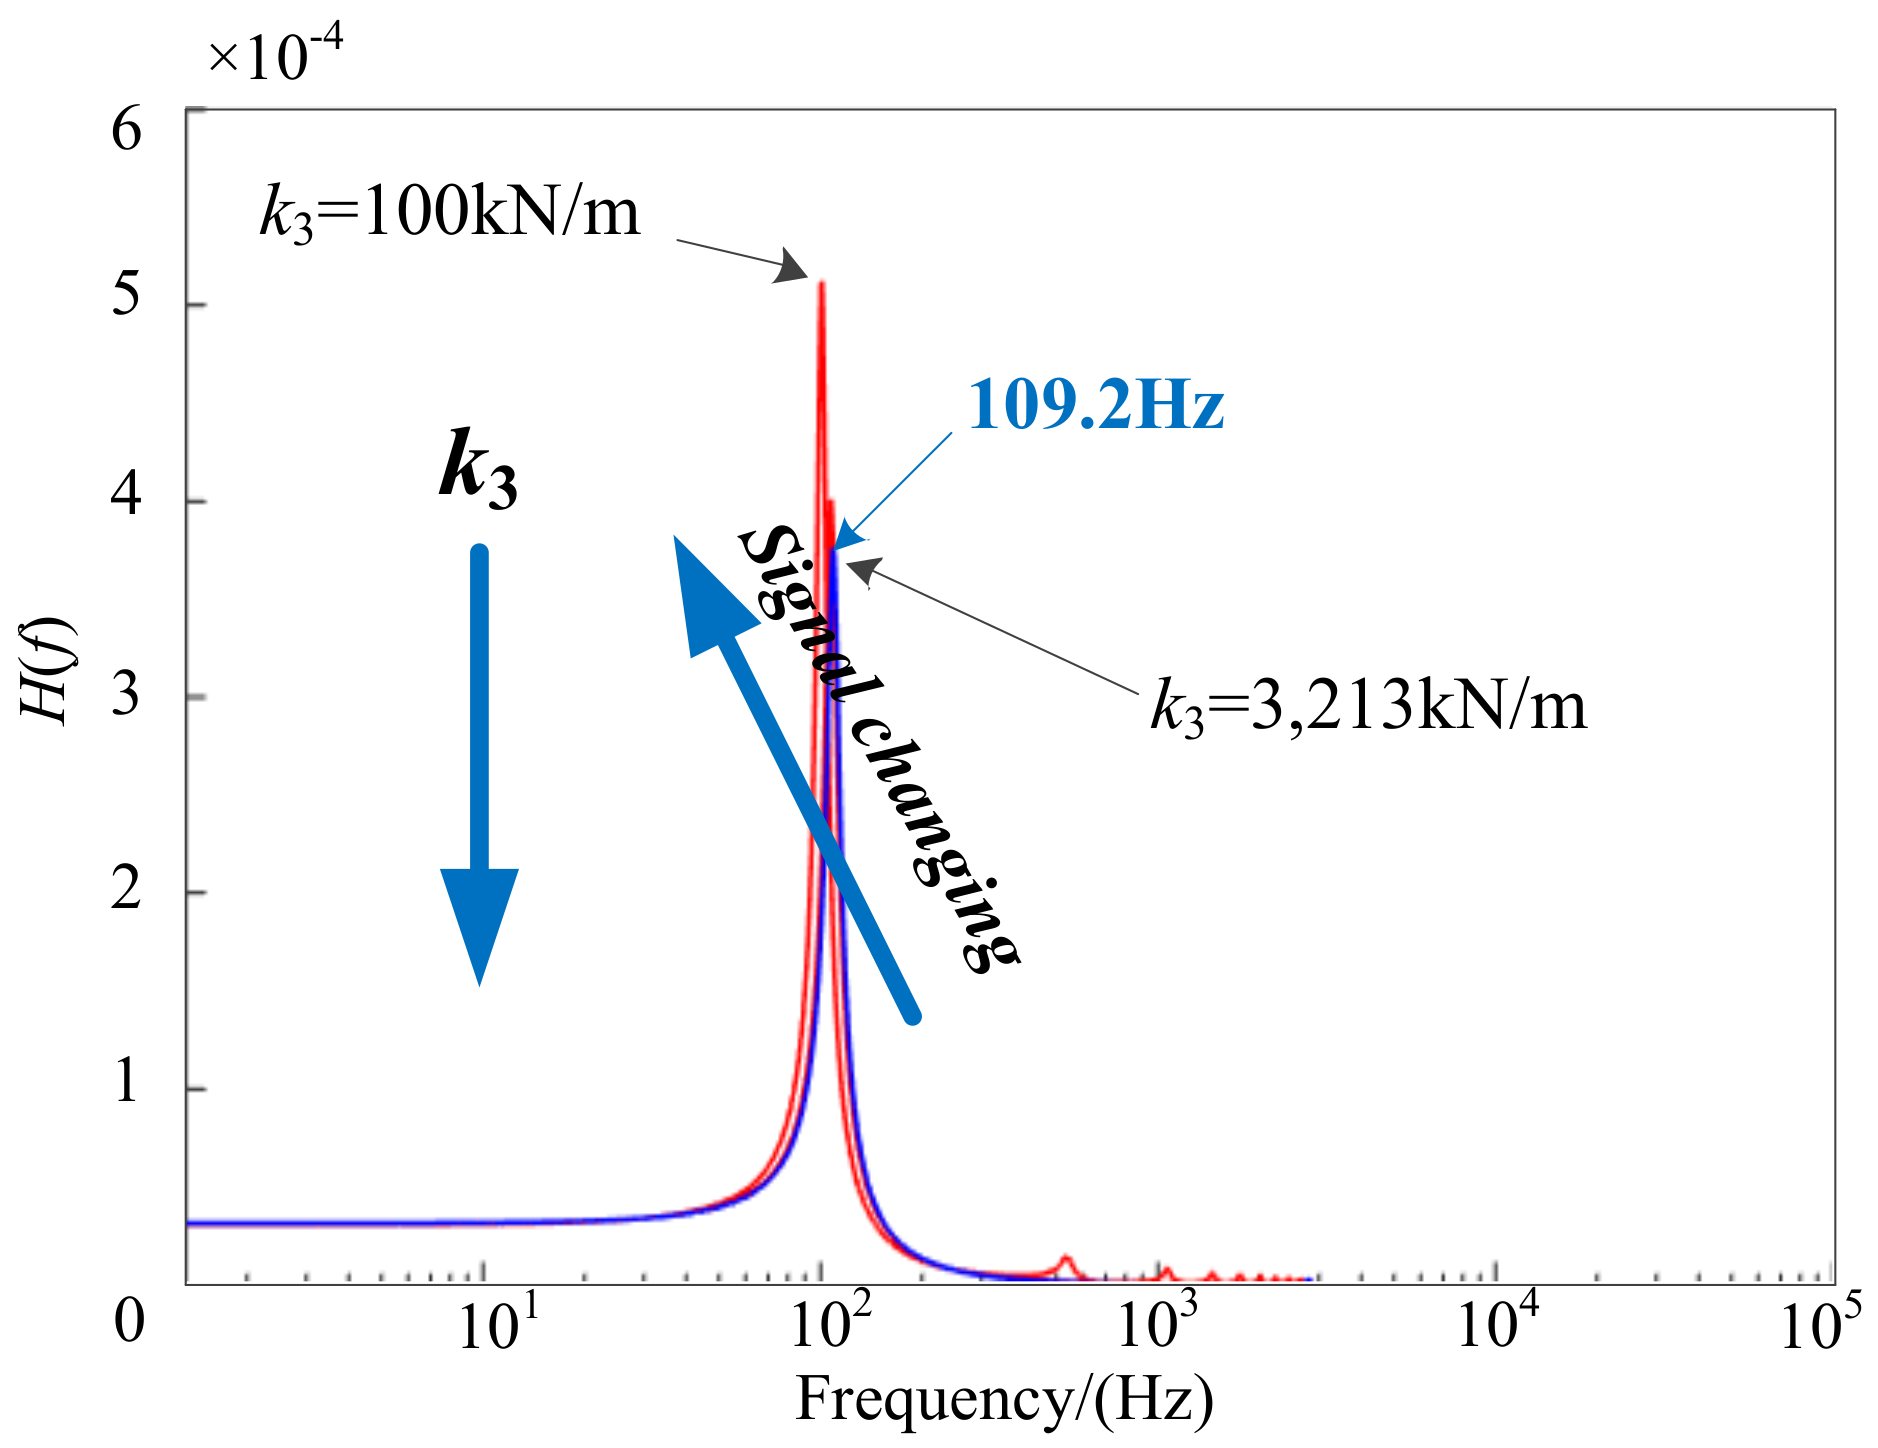
3.3.1. Effects of k3, the Stiffness of Steel Rod
As shown in
Figure 6, when the value of
k3 is increasing from 100 kN/m to 3213 kN/m, the main resonance frequency of the plastic box increases slightly while the related amplitude decreases, which means that a steel rod with smaller stiffness may lead to greater measured signal strength. Thus, steel rods for a better performing prodder should have smaller stiffness.
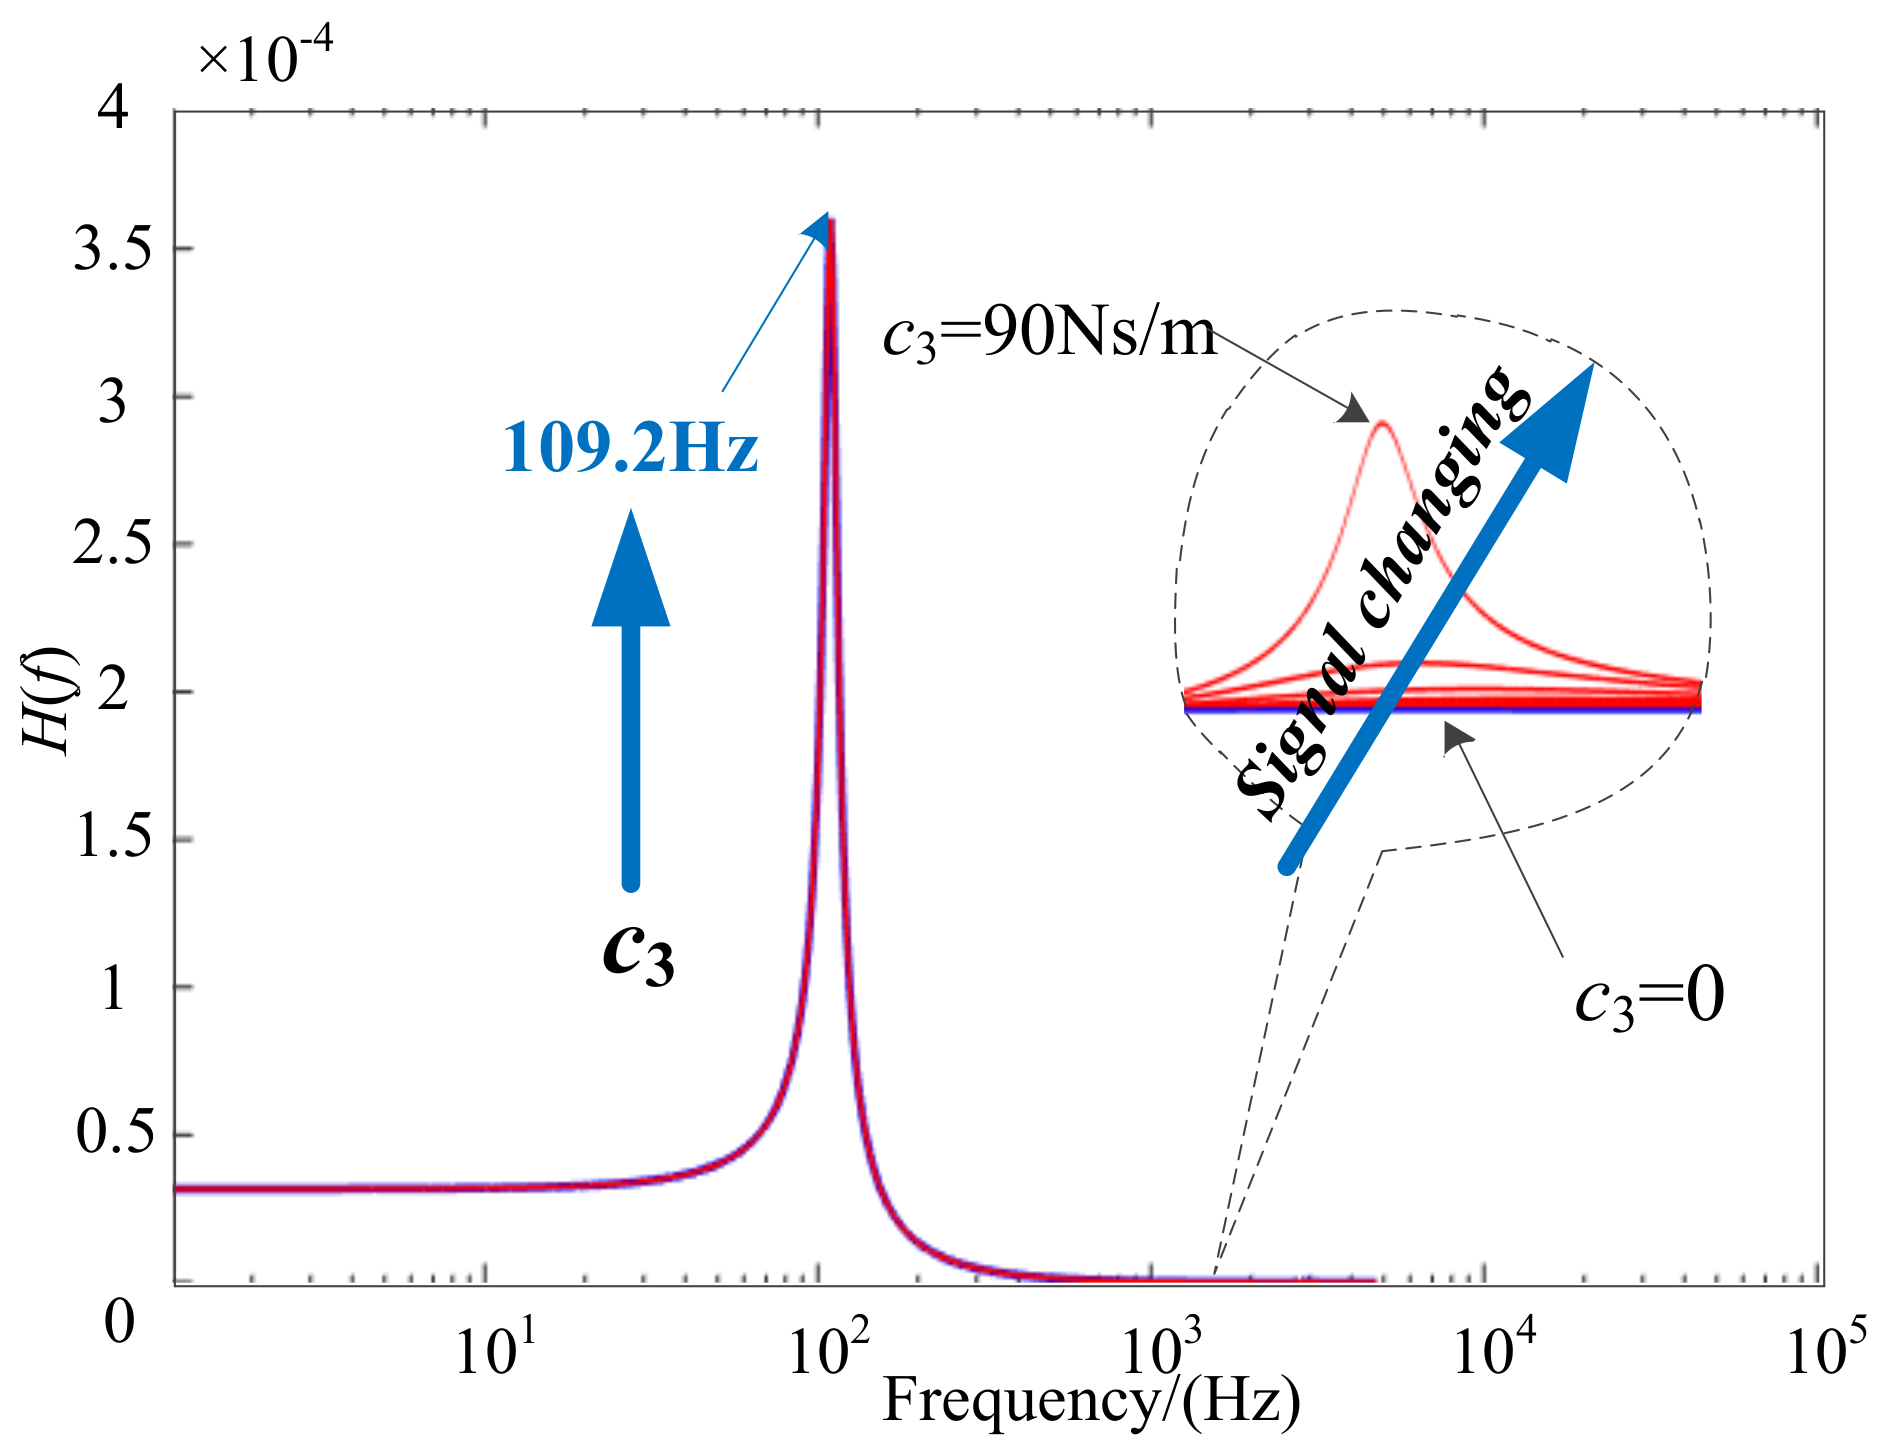
3.3.2. Effects of c3, the Damping Coefficient of the Steel Rod
Figure 7 shows that the main resonance frequency and vibration intensity of the plastic box remain the same, while the amplitude at the second resonance frequency increases with the value of
c3 increasing from 0 up to 90 Ns/m. It can be seen that the damping effect of the coupling part only introduces a second resonance frequency without changing the amplitude of the measured signal, and when the prodder contacts well with buried object, the smallest damping effect of the coupling part can be achieved.
Figure 8 represents the one-degree freedom model that ignores the coupling effects of the steel rod. In this case, the output force from the actuator is directly applied to the measured object.
The dynamic equation of the one-degree freedom model can be illustrated as:
Subsequently, the frequency response function of this one-degree freedom system can be written, as follows:
As shown in
Figure 9, the theoretical frequency response of the plastic box can be easily obtained by calculating Equation (10). The calculated main resonance frequency is 110 Hz, which is consistent with the main resonance frequency of the two-degree freedom mechanical model that is shown in
Figure 1b. It indicates that the mechanical model shown in
Figure 1b has two degrees of freedom is due to the coupling effects of the steel rod, and it would attenuate to a one-degree freedom model as the decrease of the rod’s damping coefficient.
3.4. Effects of Buried Object’S Parameters on the Measured Signal Features
Since the landmine is buried in soil, the actual value of stiffness k2 and damping coefficient c2 might be significantly influenced by the varying environmental conditions, such as burial depth, moisture, particle size, and porosity of soil. Meanwhile, different landmines may have different viscoelastic coefficients. Obviously, the measured signal characteristics would be influenced by parameters of landmine and soil conditions. In the following part, the viscoelastic coefficients of buried object are analyzed quantitatively with the same mathematical method.
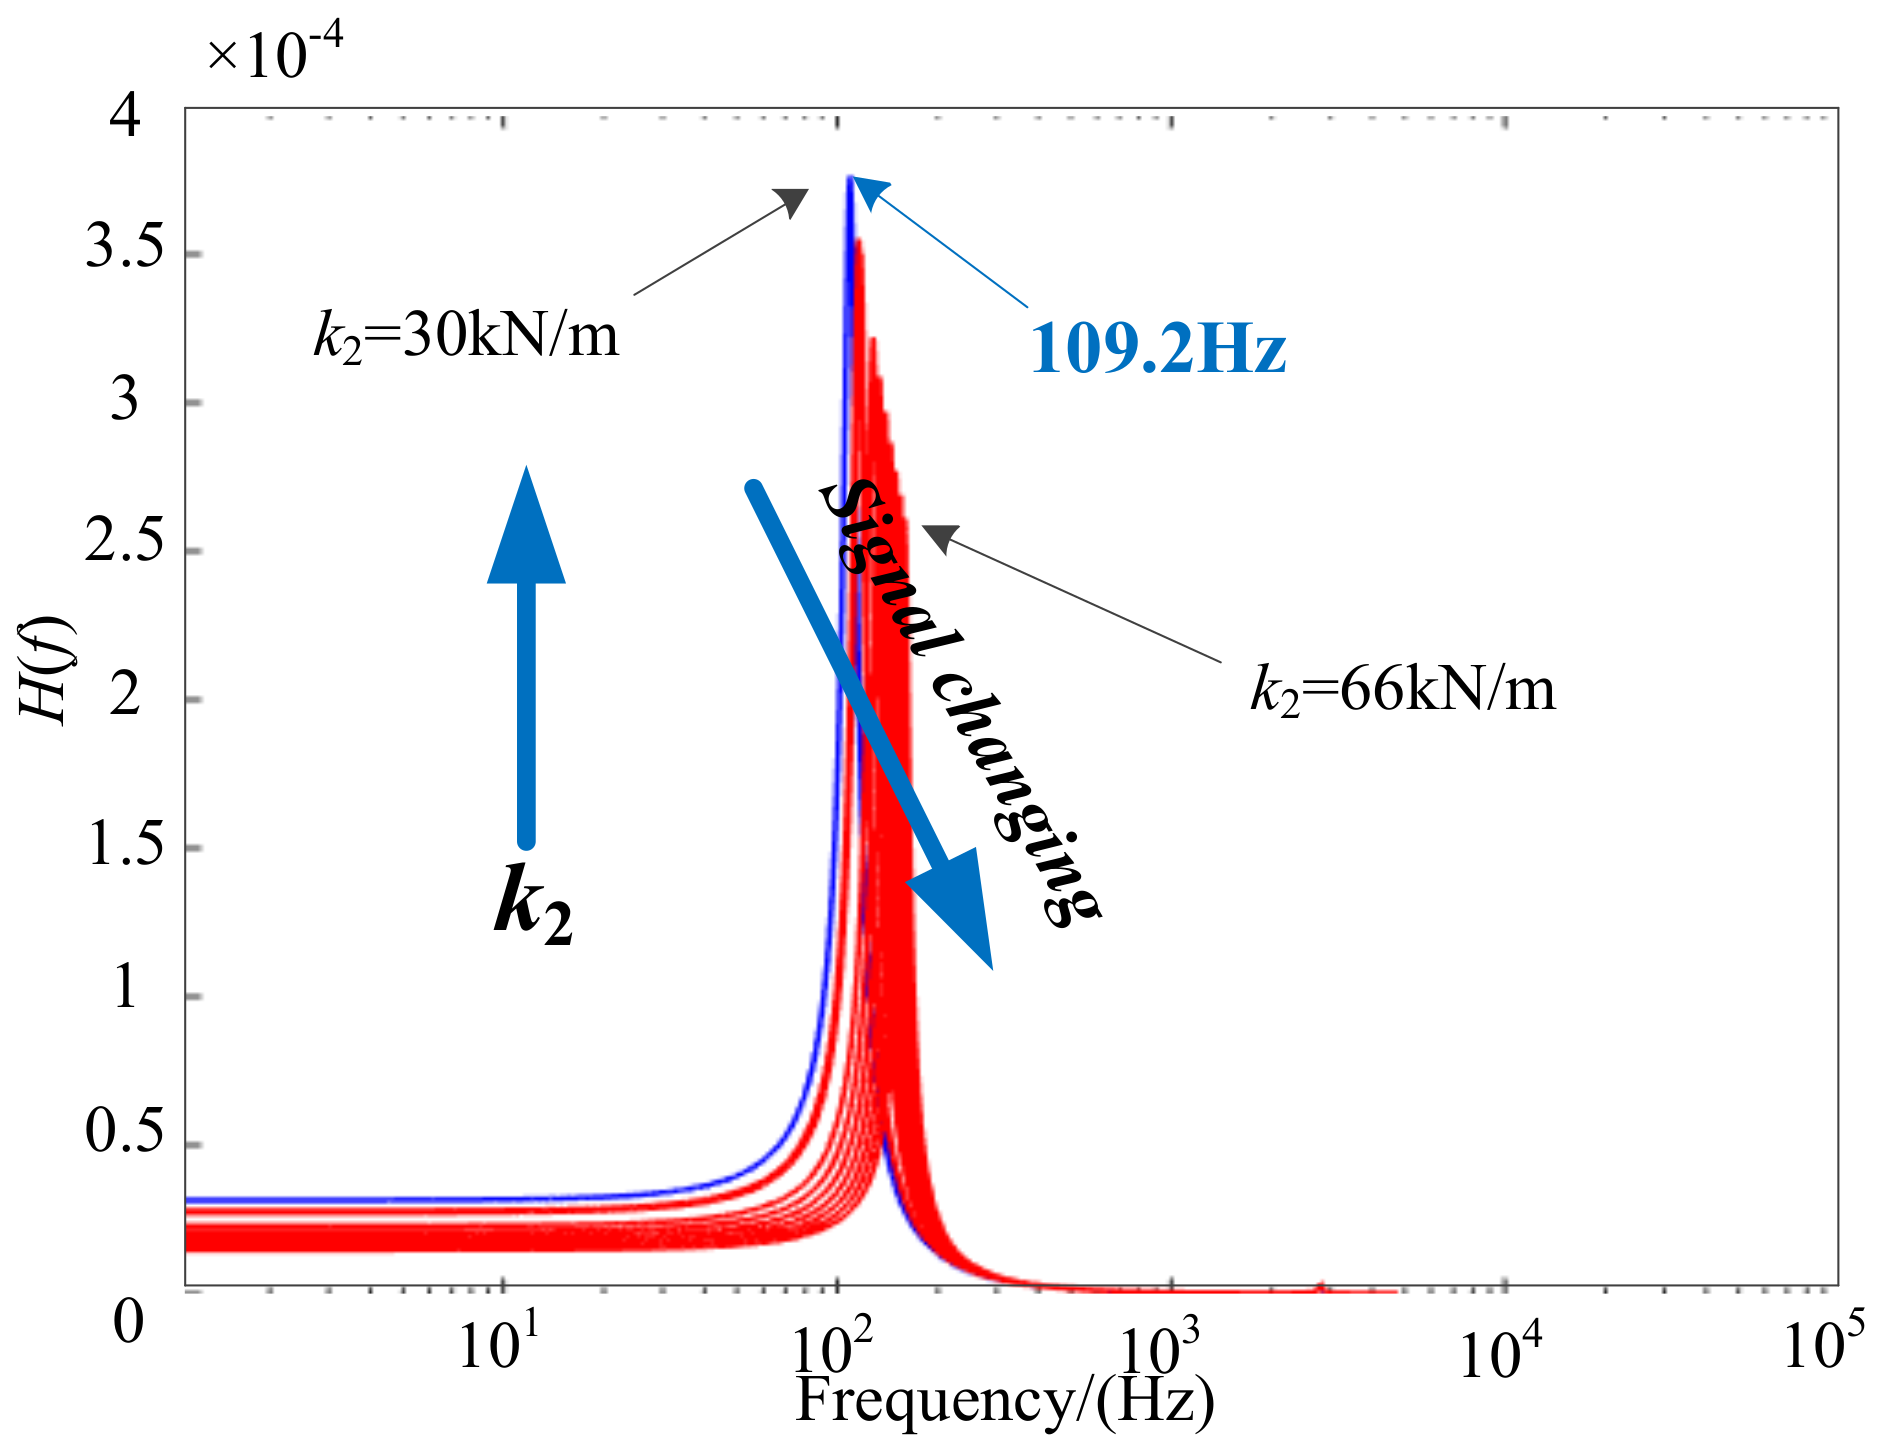
3.4.1. Effects of k2, the Stiffness of the Moving Part of Plastic Box
Figure 10 shows the effects of landmine upper casing stiffness
k2 on the measured signal features, the amplitude of the measured signal decrease, while the related resonance frequency increases as the value of
k2 increases from 30 kN/m up to 66 kN/m. Since the casing stiffness of the plastic landmines are smaller than the stiffness of metal landmines [
26], according to the analysis results above, the prodder may have better performance in the detection of non-metallic landmines that cannot be detected by the common device, for example, metal detector.
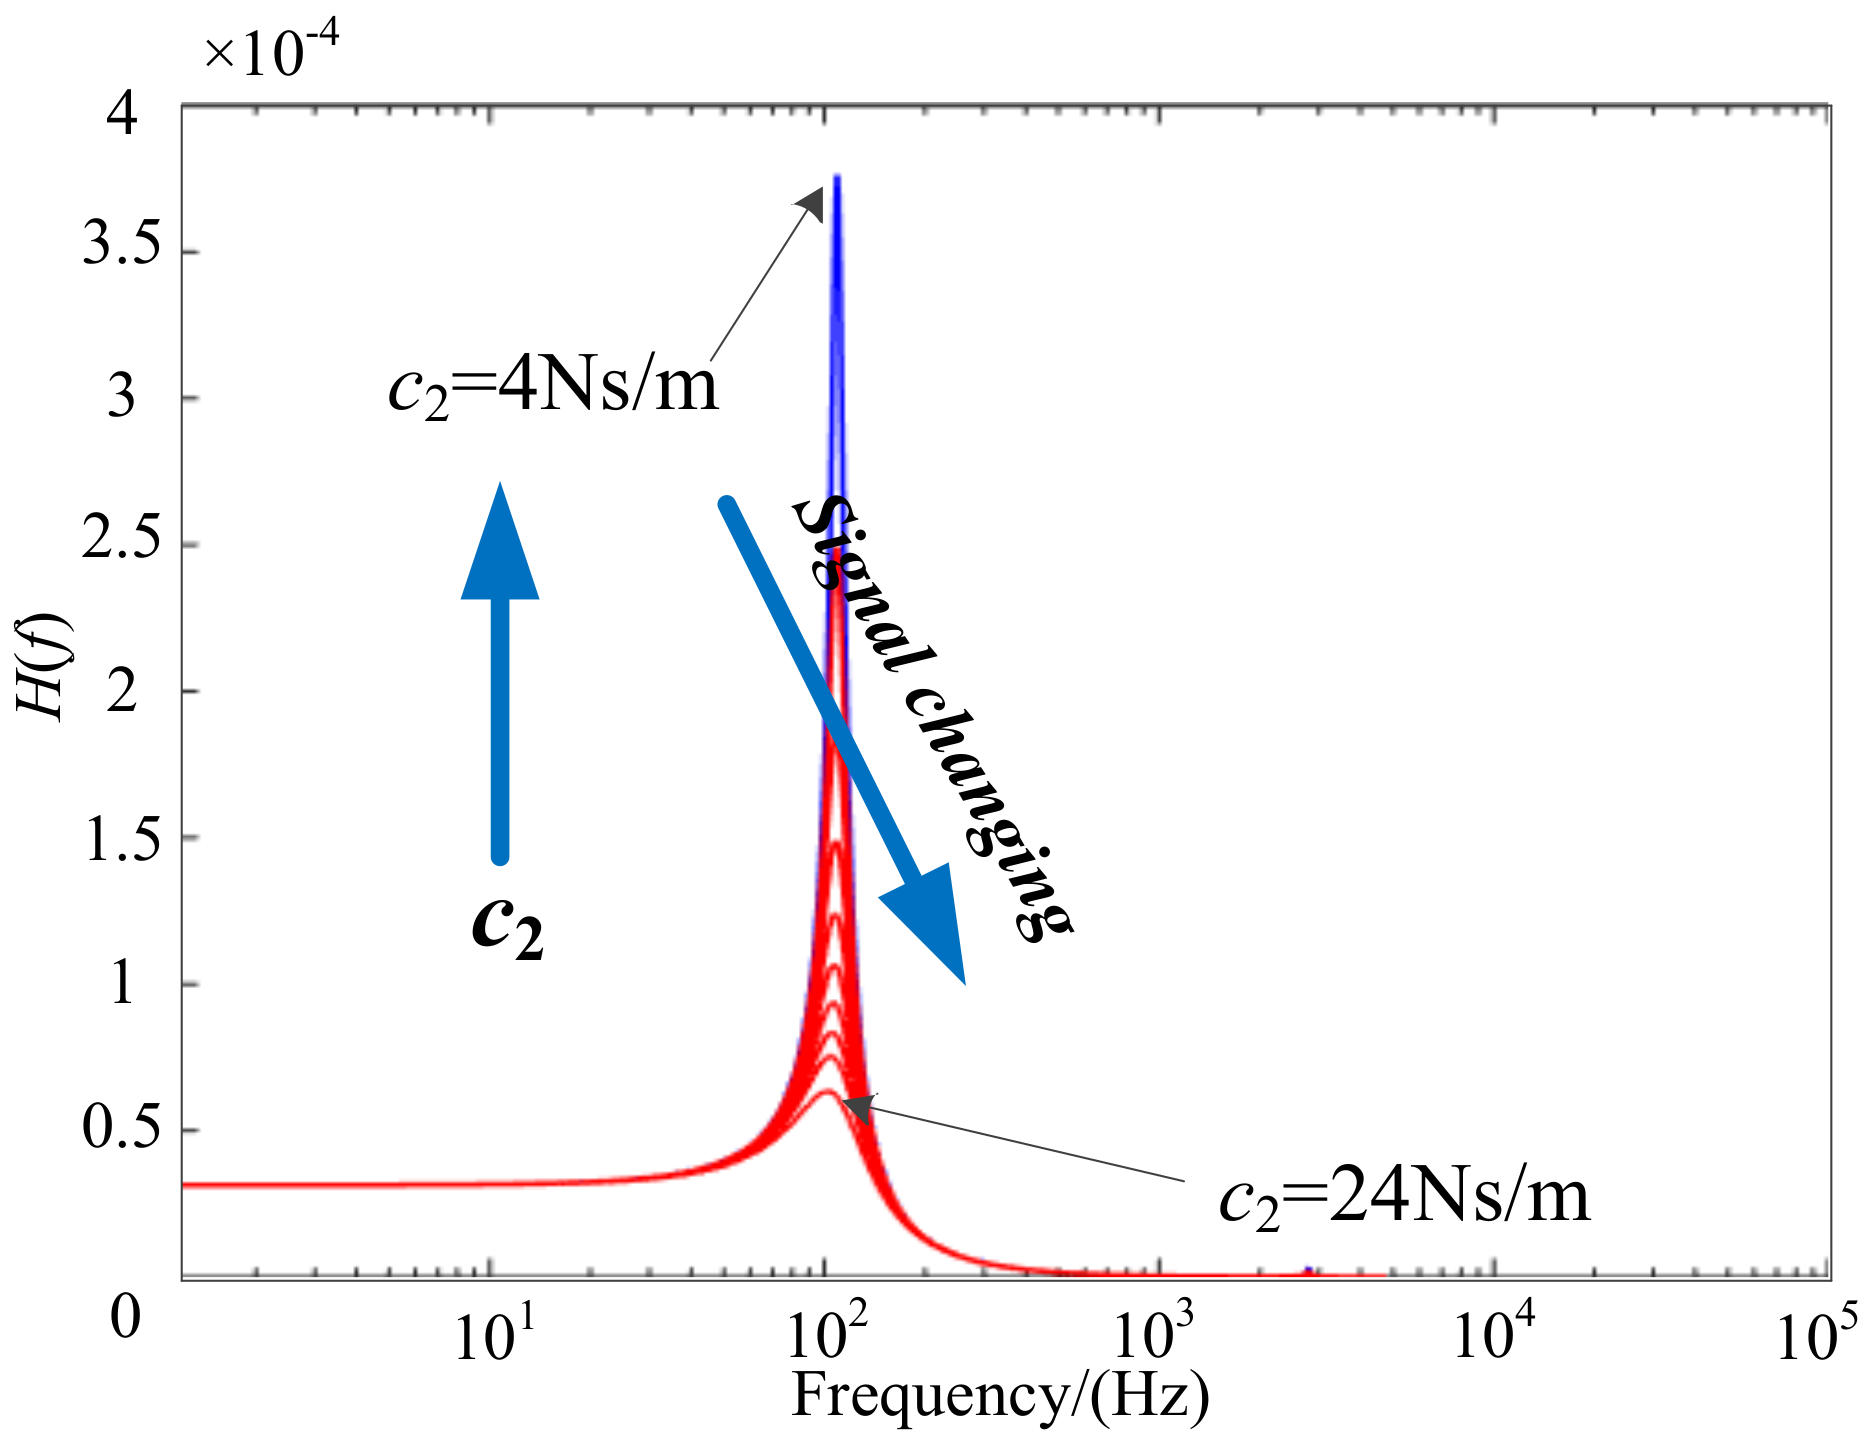
3.4.2. Effects of c2, the Damping Coefficient of the Moving Part of Plastic Box
Figure 11 shows the upper casing damping effects on the measured signal characteristics; the amplitude at the main resonance frequency decreases significantly as the value of
c2 increases from 4 Ns/m up to 24 Ns/m. This is due to the significant amount of vibrational energy that can be consumed by damping effects. However, the actual value of damping coefficient
c2 increases with the burial depth. As a result, the signal strength, namely the amplitude at main resonance frequency of buried landmine, would decrease with burial depth. These results are consistent with the experimental results in Ref. [
26]. It highlights the importance of designing an optimized prodder that can obtain larger signal strength to achieve a greater depth of detection.
According to the analysis above, the effects of each prodder’s component on buried landmine’s vibrational characteristics can be summarized in
Table 2 as the relevant parameter values increase. The notation “↑” represents an increase, “↓” represents a decrease, and “—” means no influence.
4. Evaluation of the Optimized Design
On the basis of the above analysis results, an optimized prodder with parameter values of
m1 = 0.1 kg,
k1 = 1818 N/m,
c1 = 0.1 Ns/m, and
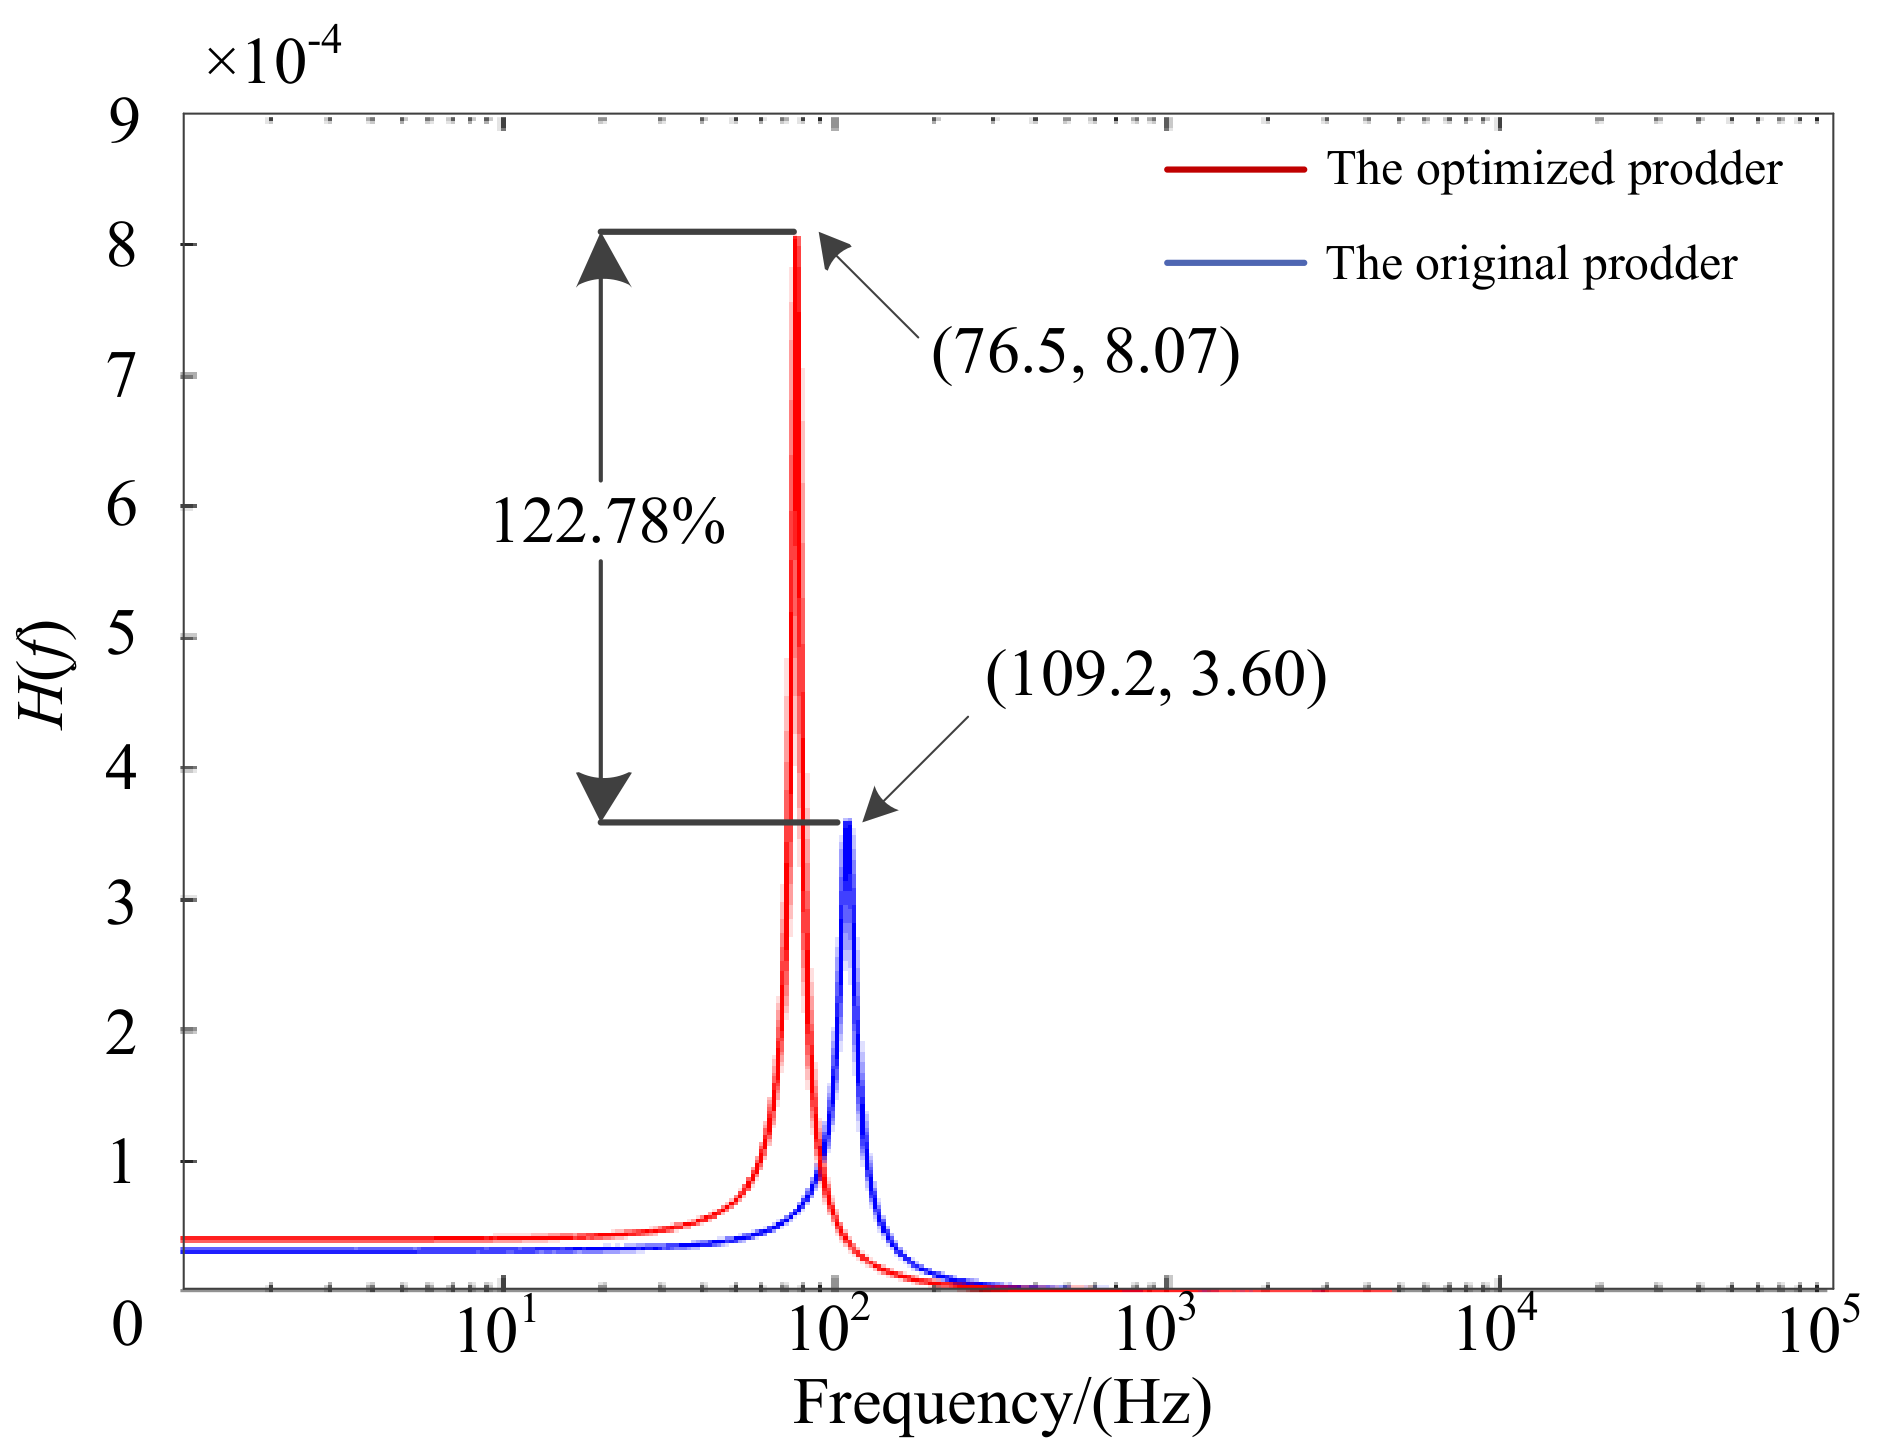
k3 = 100 kN/m can obtain greater signal strength and larger detection depth. As shown in
Figure 12, the plastic box’s theoretical resonance vibration intensity, as measured with the optimized prodder, is 8.07 × 10
−4, while the same value that was measured with the original prodder is 3.60·10
−4, thus the signal strength increases by approximately 122.78%.
Finally, Adams, which is a widely used multi-body dynamics simulation software, is used to conduct a simulation experiment to verify the numerical analysis results. The optimization function of this software allows for users to obtain the optimal parameter values for the design objectives within certain constraints. As shown in
Figure 13a, a parametric dynamics model explaining the working principle of prodder is built in the Adams software. According to the above analysis results,
k1 has few influence on the measured signal, smaller values for the damping coefficients
c1 and
c3 tend to enhance performance. Therefore,
k3 and
m1, the viscoelastic coefficients of steel rod and the mass of the moving part of prodder, are set as key design variables. The objective function is the mean value of the variance between the time domain vibration data measured with the original and new designed prodders. It is obvious that the maximum value of the objective function corresponds to the strongest difference of vibration intensity, as measured by these two prodders. The corresponding parameter values are optimal in the design of better performing prodder. The optimization result is shown in
Figure 13b and the theoretical main resonance frequencies of vibration signal measured by the original and optimized prodders are 109.27Hz and 76.5Hz, respectively, which perfectly meets with the numerical analysis results that are shown in
Figure 12. Due to Adams software taking earth gravity into account, the vibration intensity of simulation results increases 161.56%, which is larger than the numerical analysis result of 122.78%, but they are of the same order. The corresponding values for
k3 and
m1 are 100 kN/m and 0.1 kg, respectively, which are equal to the results deduced by the mathematical method, which verifies this numerical analysis method and the optimal design. It should be noted that the value ranges of the above parameters are selected experientially, mainly for studying the parameter’s effect on the prodder’s performance. This paper principally provides an optimization analysis method for developing a better performance prodder used for landmine detection.
5. Conclusions
Based on the working principle of a sensorized prodder that is used for landmine detection, a mathematical analysis method is proposed to analyze the influences of each of the prodder’s components on the measured signal. The calculated results meet well with the published electromechanical analogy simulation results and experimental results respectively, proving the feasibility of the proposed numerical analysis method. According to the analysis results, we can draw the following conclusions:
If the mass of the moving part of prodder increases, the main resonance frequency of the measured signal would decrease while the corresponding vibration intensity would increase. Therefore, the mass of the moving part of prodder should be reasonable large to acquire greater signal strength to obtain larger detection depth.
The stiffness of prodder’s adjusting spring has no effect on the vibrational characteristics of the measured object, but the damping effect of spring can attenuate the vibration intensity. Thus, the spring of an optimized prodder should have a smaller damping coefficient.
The steel rod’s coupling effects generate a second resonance of the measured signal, while its influence on the main resonance vibration could be ignored. However, the measured signal strength would decrease with the increase of the stiffness of the steel rod. As a result, a better performing prodder should adopt a steel rod with smaller stiffness, for example, a hollow steel rod with conic-shaped tip.
The analysis results of the effects of the measured object’s stiffness and damping coefficient show that the theoretical signal strength for the plastic mine is larger than the related value for metal mine, which indicates that the prodder might be better suited for non-metallic landmine detection.
According to the above analysis results, when the mass of the prodder’s moving part is 0.1 kg, the adjusting spring is still the same, and the stiffness of the rod is 100 kN/m, the measured signal strength would increase approximately 122.78% resultantly, which means that a greater depth of detection could be achieved, and this optimal design is verified by the simulation experiment that was conducted with the optimization function of Adams software. It should be mentioned that, although many prodders have been proposed, prodder with force feedback is more of an exploration solution for landmine detection and is under consideration by some mine clearance organizations at this stage for its safety as a contact method. However, this optimized prodder could be of considerable interest in landmine detection training, other shallow buried landmine detection, and nondestructive testing for structural health. In our future work, we will develop an optimized prodder and dedicate it to these fields.
Author Contributions
Conceptualization, J.Z. and Z.W.; methodology, Z.W.; writing-original draft preparation, Z.W.; writing-review and editing, J.L.; project administration, C.W.; simulation experimental validation, H.M.
Funding
This research was funded, in part, by the NATIONAL NATURAL SCIENCE FOUNDATION OF CHINA, grant number 61773249; the NATURAL SCIENCE FOUNDATION OF SHANGHAI, grant number 16ZR1411700; the SCIENCE AND TECHNOLOGY ON NEAR-SURFACE DETECTION LABORATORY, grant numbers 6142414090117, TCGZ2017A006; and the NATIONAL YOUTH FUNDATION OF CHINA, grant number 41704123.
Acknowledgments
Thanks are due to Ziyang Song and Zhiwen Yuan for their valuable discussion and help.
Conflicts of Interest
The authors declare no conflict of interest.
References
- Kowalenko, K. Saving lives, one land mine at a time. IEEE Inst. 2004, 28, 10–11. [Google Scholar]
- Geoff, H. The economics of landmine clearance: Case study of Cambodia. J. Int. Dev. 2000, 12, 219–225. [Google Scholar]
- Meier, R., III; Smith, W.K. Landmine injuries and rehabilitation for landmine survivors. Phys. Med. Rehabil. Clin. N. Am. 2002, 13, 175–187. [Google Scholar] [CrossRef]
- Gibson, J.; Barns, S.; Cameron, M.; Lim, S.; Scrimgeour, F.; Tressler, J. The value of statistical life and economics of landmine clearance in developing countries. World Dev. 2007, 35, 512–531. [Google Scholar] [CrossRef]
- Kim, B.; Yoon, J.W.; Lee, S.E.; Han, S.H.; Kim, K. Pulse-induction metal detector with time-domain bucking circuit for landmine detection. Electron. Lett. 2015, 51, 159–161. [Google Scholar] [CrossRef]
- Collins, L.; Gao, P.; Tantum, S. Model-based statistical signal processing using electromagnetic induction data for landmine detection and classification. In Proceedings of the 11th IEEE Signal Processing Workshop on Statistical Signal Processing, Singapore, 8 August 2001. [Google Scholar]
- Carin, L. Ground-Penetrating Radar (Paper I). Alternatives for Landmine Detection. Available online: https://www.rand.org/pubs/monograph_reports/MR1608.html (accessed on 18 February 2003).
- Takahashi, K.; Igel, J.; Preetz, H.; Sato, M. Influence of heterogeneous solis and clutter on the performance of ground-penetrating radar for landmine detection. IEEE Trans. Geosci. Electron. 2014, 52, 3464–3472. [Google Scholar]
- Tan, Y.Y.; Tantum, S.L.; Collins, L.M. Landmine detection with nuclear quadrupole resonance. In Proceedings of the IEEE International Geoscience and Remote Sensing Symposium, Toronto, ON, Canada, 24–28 June 2002. [Google Scholar]
- Bach, H.; Ian, M.G.; Conny, A.; Rebecca, S. Improving mine detection dogs: An overiew of the GICHD dog program. In Proceedings of the International Conference on Requirements and Technologies for the Detection, Removal and Neutralization of Landmines and UXO, Brussels, Belgium, 15–18 September 2003. [Google Scholar]
- Harding, G. X-ray scatter tomography for explosives detection. Radiat. Phys. Chem. 2004, 71, 869–881. [Google Scholar] [CrossRef]
- Church, P.; McFee, J.E.; Gagnon, S.; Wort, P. Electrical impedance tomographic imaging of buried landmines. IEEE Trans. Geosci. Remote Sens. 2006, 44, 2407–2420. [Google Scholar] [CrossRef]
- Gasser, R.; Thomas, T.H. Prodding to detect mines: A technique with a future. In Proceedings of the Second International Conference on Detection of Abandoned Land Mines, Edinburgh, UK, 12–14 October 1998. [Google Scholar]
- Hussein, E.M.; Waller, E.J. Landmine detection: The problem and the challenge. Appl. Radiat. Isot. 2000, 53, 557–563. [Google Scholar] [CrossRef]
- Machler, P. Detection technologies for anti-personnel mines. In Proceedings of the Symposium on Autonomous Vehicles in Mine Countermeasures, Monterey, CA, USA, 4–6 April 1995. [Google Scholar]
- Maki, H.K. Mine detection and sensing technologies-new development potentials in context of humanitarian demining. In Proceedings of the 27th Annual Conference of the IEEE Industrial Electronics Society, Denver, CO, USA, 29 November–2 December 2001. [Google Scholar]
- Frigui, H.; Gader, P.; Keller, J. Fuzzy clustering for land mine detection. In Proceedings of the 1998 Conference of the North American Fuzzy Information Processing Society, Pensacola Beach, FL, USA, 20–21 August 1998. [Google Scholar]
- Russell, K. Contact Methods. Alternatives for Landmine Detection. Available online: https://www.rand.org/content/dam/rand/pubs/monograph_reports/MR1608/MR1608.appw.pdf (accessed on 18 February 2003).
- Russell, G. Technology for Humanitarian Landmine Clearance. Ph.D. Thesis, University of Warwick, Coventry, UK, 2000; p. 70. [Google Scholar]
- Ishikawa, J.; Iino, A. A study on prodding detection of antipersonnel landmine using active sensing prodder. In Proceedings of the International Symposium “Humanitarian Demining 2010”, Sibenik, Croatia, 27–29 April 2010. [Google Scholar]
- Gallagher, P.J. Characteristic Discriminating Landmine Hand Prodder. U.S. Patent 5,754,494, 19 May 1998. [Google Scholar]
- Uno, M.A.; Kimura, T.; Kato, M. Method and Apparatus for Detecting and Discriminating Objects under the Ground. U.S. Patent 5,672,825, 30 September 1997. [Google Scholar]
- Borza, M.A. Prodder with Force Feedback. U.S. Patent 6,386,036, 14 May 2003. [Google Scholar]
- Steinway, W.; Scott, W. Mine Detection using Radar Vibrometer. U.S. Patent 7,183,964, 27 February 2007. [Google Scholar]
- Fernandez, R.; Montes, H.; Armada, M. Intelligent multisensory prodder for training operators in humanitarian demining. Sensors 2016, 16, 965. [Google Scholar] [CrossRef] [PubMed]
- Borgioli, G.; Bulletti, A.; Calzolai, M.; Capineri, L. A new sensorized prodder device for the detection of vibrational characteristics of buried objects. IEEE Trans. Geosci. Remote Sens. 2014, 52, 3440–3452. [Google Scholar] [CrossRef]
- Donskoy, D.; Ekimov, A.; Sedunov, N.; Tsionskiy, M. Nonlinear seismo-acoustic land mine detection and discrimination. J. Acoust. Soc. Am. 2002, 111, 2705–2713. [Google Scholar] [CrossRef]
- Donskoy, D.; Reznik, A.; Zagrai, A.; Ekimov, A. Nonlinear vibrations of buried landmines. J. Acoust. Soc. Am. 2004, 117, 690–700. [Google Scholar] [CrossRef]
© 2019 by the authors. Licensee MDPI, Basel, Switzerland. This article is an open access article distributed under the terms and conditions of the Creative Commons Attribution (CC BY) license (http://creativecommons.org/licenses/by/4.0/).


