Abstract
Two schemes are mainly used for coding sounds in cochlear implants: Fixed-Channel and Channel-Picking. This study aims to determine the speech audiometry scores in noise of people using either type of sound coding scheme. Twenty normal-hearing and 45 cochlear implant subjects participated in this experiment. Both populations were tested by using dissyllabic words mixed with cocktail-party noise. A cochlear implant simulator was used to test the normal-hearing subjects. This simulator separated the sound into 20 spectral channels and the eight most energetic were selected to simulate the Channel-Picking strategy. For normal-hearing subjects, we noticed higher scores with the Fixed-Channel strategy than with the Channel-Picking strategy in the mid-range signal-to-noise ratios (0 to +6 dB). For cochlear implant users, no differences were found between the two coding schemes but we could see a slight advantage for the Fixed-Channel strategies over the Channel-Picking strategies. For both populations, a difference was observed for the signal-to-noise ratios at 50% of the maximum recognition plateau in favour of the Fixed-Channel strategy. To conclude, in the most common signal-to-noise ratio conditions, a Fixed-Channel coding strategy may lead to better recognition percentages than a Channel-Picking strategy. Further studies are indicated to confirm this.
1. Introduction
In 2012, cochlear implants (CIs) had successfully restored partial hearing to over 324,200 deaf people worldwide [1]. In most cases, users of modern CIs perform well in quiet listening conditions. Four CI manufacturers are presently on the French market: Cochlear® and Neurelec®/Oticon Medical® for Channel-Picking (CP) strategies and Advanced Bionics® and Med-El® for Fixed-Channel (FC) strategies. For most CI users, performances for speech perception significantly decrease in noisy environments [2].
All modern sound coding strategies are based on the analysis of acoustic information by a bank of band-pass filters and each strategy has its own philosophy [3].
Two coding schemes are mainly in use. FC strategies transmit all available channels to the electrodes, which usually stimulate at a high rate. CP strategies (sometimes called n-of-m strategies) use various stimulation rates (a high, medium or low rate), estimate the outputs of all the available channels (m) and select a subset of channels (n) with the largest amplitudes.
The present study focuses on the relative contribution of FC strategies and CP strategies on syllable recognition in noise. We wish to compare the efficiency of the FC and CP coding strategies, first in simulation and secondly with CI users.
1.1. Sound Coding Strategies
In practice, a wide variation of outcomes is observed amongst implanted patients, which is probably linked to the duration of deafness, the age at implantation, the age at onset of deafness, the duration of implant use and the patient’s social environment [4].
Some studies showed a superiority of an FC strategy over a CP strategy particularly in noise [5]. Others like Skinner et al. and Kiefer et al. [6,7] showed a positive difference, for speech recognition, in favour of the Advanced Combination Encoder (ACE) (CP strategy) over Continuous Interleaved Sampling (CIS) (FC strategy) and Spectral Peak Picking (SPEAK) (CP strategy) [6]. Brockmeier et al. [8] compared the musical activities and perception of cochlear implant users and concluded that CIS, SPEAK and ACE did not differ significantly. No clear advantage for a particular coding scheme has been identified yet.
The number of spectral channels required for speech recognition depends on the difficulty of the listening situation for both FC and CP strategies [9,10]. For FC strategies, all channels are transmitted to the corresponding electrodes, usually between 12 and 16, leading to a relatively large amount of spectral information that may be blurred by the current spread in the cochlea. When the stimulation rate is high, some results suggest that this rate may be beneficial to speech perception [11]. Another feature of the strategies lies in the non-overlapping (interleaved) pulse delivery; pulses are brief with a minimum delay between them and rapid variations in speech can be tracked [12].
1.2. Influence of Noise
The assessment of the performance of CI users in noise has become of great interest as it is considered to be representative of daily listening conditions.
In noise, the natural gaps in speech are filled and speech envelopes are distorted making speech recognition more difficult. The CP coding strategies may select noise-dominated channels, instead of the dominant speech channels, at low signal-to-noise ratios (SNRs) [13]. Unlike the CP strategies, FC strategies transmit the information of all available channels leaving the task of selecting the informational cues to the auditory system.
The presence of noise reduces the effective dynamic range for CI users by compressing the region of audibility into the upper position of the dynamic range [14]. Good speech perception in noise is a target in the management of deafness [15,16,17,18] and this aspect is also of great importance when CI coding strategies are concerned. Thus, tests in noise are more sensitive to changes in the fitting parameters and more ecological than tests in quiet conditions.
1.3. Simulation with Normal-Hearing Subjects
Considering the heterogeneity in a group of CI users, it is usually difficult to draw strong conclusions. Additionally, as the FC and CP strategies are fitted to each group of CI users, the heterogeneity of the populations is increased.
On the contrary, a simulation work, which can be done with NH subjects, allows greater homogeneity of the participants. In this case, the same subject can face different situations [19], such as coding schemes and SNRs, allowing one to focus on different controllable features such as time and amplitude cues and to ensure efficient paired comparisons. However, the results observed with NH listeners cannot be directly extrapolated to CI users and many studies have been conducted on this subject. Dorman extensively studied this matter in 2000 [20,21] and stated that “performance of the NH listeners established a benchmark for how well implant recipients could perform if electrode arrays were able to reproduce, by means of the cochlea, the stimulation produced by auditory stimulation of the cochlea and if patients possessed neural structures capable of responding to the electrical stimulation” [22]. They also indicated that the best CI users achieved scores that were within the ranges of scores observed with NH subjects. On the contrary, other authors point out the limitations of using vocoders to simulate electric hearing and the importance of making experiments with CI users [23].
Consequently, both approaches (with CI and NH subjects) seem necessary; with NH subjects, we can evaluate the consequences of the coding strategies and with CI users we can evaluate the real aspect on a clinical point of view. Practically, for a given strategy, several fitting procedures are recommended by the manufacturers and each CI is fitted to the patient.
2. Material & Methods
2.1. Participants
The work presented in this paper follows a previous pilot study [24] and was approved by the French Ethics Committee “Sud-Est 2” (August, 27, 2014, ID-RCB: 2014-A00888-39), under the supervision of the HCL (Civil Hospitals of Lyon). The participants were recruited between November 2014 and April 2016. They were all informed at least a week before entering the study, verbally and in writing and they filled out a consent form.
2.1.1. Normal-Hearing Subjects
Twenty NH subjects participated in this experiment. Their age ranged from 18 to 33 years old, with an average of 25 years. They were recruited among the students of the Claude Bernard Lyon 1 University, through a recruitment notice sent via email. An otologic examination was performed before entering the study in order to exclude subjects with previous pathologies or deafness. All these subjects were considered to have normal hearing according to recommendations of the International Bureau for Audio-Phonology, as their auditory thresholds were below 20 dB HL for all frequencies between 250 and 8000 Hz.
2.1.2. Cochlear Implant Subjects
Forty-five CI users were included in this study. Their ages ranged from 18 to 60 years old, with an average of 37 years. They were recruited in the general population of CI users who have their classical follow-up examination in our tertiary referral centre. Nineteen subjects were fitted with an FC strategy (Advanced Bionics® and Med-El®) and twenty-six had a CP strategy (Cochlear® and Neurelec®/Oticon Medical®); the CI population was constituted of two groups (one for each coding scheme). CI users included in the experiment were people implanted unilaterally and bilaterally. In the case of people with bilateral implantation, only one implant was tested: the one giving the best outcomes according to the patient. Demographic details are indicated in Appendix A.
2.2. Stimuli
The acoustic material incorporates Fournier’s lists mixed in with a cocktail-party noise.
2.2.1. Fournier’s Disyllabic Lists
These lists were adapted to test the participants. They were created by Jean-Etienne Fournier in 1951 and are approved by the French National College of Audiology (C.N.A.). Forty lists with a male voice are available and each list is constituted of 10 two-syllable common French words (e.g., le bouchon = the cork), leading to 20 syllables per list. They are a French equivalent to the American Spondee lists (e.g., baseball). The recognition step was one syllable (5%).
2.2.2. Noise
In this study, we used cocktail-party noise. It was a voice mix of eight French-speaking people, four males and four females. This kind of noise was sufficiently heterogeneous for the task and the masking was rather invariable throughout a session.
2.3. Hardware
Stimuli were recorded on a CD (44.1 kHz sampling frequency, 16-bit quantization) and presented using a PHILIPS CD723 CD player connected to a Madsen orbiter 922® Clinical audiometer to control the general volume and the SNR. The sound was delivered in free field with two JBSYSTEMS ISX5 loudspeakers for CI users and with a TDH 39 headset for NH subjects. Devices used in our experiment are regularly calibrated and checked according to the NF EN ISO 8253 standard.
2.4. Experimental Conditions and Procedures
For the two groups of subjects, the experiment consisted in speech audiometry in noise with one syllable as the error unit. For a fixed speech level of 60 dB SPL, the maximum level delivered was below 65 dB SPL. According to the conditions requested by the ethics committee, it did not exceed the 80 dB SPL limitation recommended for professional noise exposure.
2.4.1. Normal-Hearing Subjects
Processed stimuli were delivered to only one ear, as in the experiment conducted with CI users. Furthermore, we chose to test the subjects in the right ear considering a lateralization of the treatment of sounds and especially that speech understanding seems associated with the left hemisphere activity [25,26].
For a fixed speech level of 60 dB SPL, five SNR were tested for each sound-coding scheme [FC and CP (8 out of 20)]. The lower SNR was −3 dB and the higher was +9 dB with 3 dB steps between each tested SNR. For the SNR of +9 dB, the recognition percentage was 100%. Each combination (coding scheme + SNR) was assigned to a Fournier’s list so that the lists were not repeated. Each session started with a short training period to help the listener understand the instructions. Then the 10 noise and coding scheme conditions were randomly presented to each subject (1 list per condition: 5 SNRs and 2 coding schemes). The sessions lasted about 15 min (plus half an hour for the auditory check).
2.4.2. Cochlear Implant Users
The procedure was slightly different with the CI users as the task was more difficult for them than for the NH subjects. The speech level was fixed to 60 dB SPL. Most of the CI users did not reach the 100% recognition score; the percentage regularly increased with the SNR. The SNRs were presented from +18 dB to −3 dB with 3 dB steps. Only one strategy (corresponding to their CI) could be tested with a patient. Lists were presented in increasing order of difficulty (from +18 dB to −3 dB of SNR) to avoid discouragement effects; this procedure was the same for both coding schemes.
CI users were tested at the beginning of their periodical clinical check-up and device setting, which occurs at the “CRIC” (Cochlear Implant Setting Centre) located in the ORL department of the Edouard-Herriot hospital. The patient follow-up consists of an appointment with a speech therapist, a setting of the implant parameters by an audiologist and a clinical examination by a physician.
The following tasks were realized in our work:
- verification of the patient’s medical file;
- a short training session to help the patient understand the instructions.
2.5. Implant Simulation
For the simulation of “CI like” speech processing, we used a vocoder implemented in Matlab® (MathWorks, Natick, MA) to simulate an FC and a CP coding strategy. We did not simulate channel interaction in this study.
A diagram representing the signal processing performed by the vocoder is shown in Figure 1. The different steps of the signal processing are as follows:
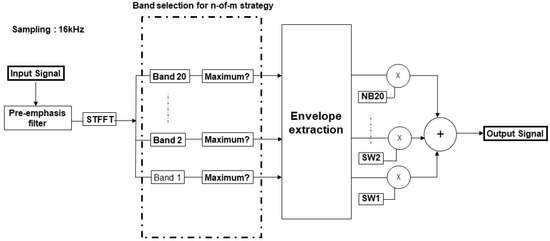
Figure 1.
Block diagram representing the signal processing performed by the n-of-m simulator.
- The input signal goes through a pre-emphasis filter, which is a high-pass filter (cut-off frequency 1.2 kHz and slope 3 dB/octave).
- The signal is then sampled (16 kHz sampling frequency, 16 bit quantization). A short-term fast Fourier transform (STFFT) is applied to the samples and the frame length is 128 points (8 ms). There is a frame overlap of 6 ms (75% overlap) and a set of pulses is calculated for each frame. Sixty-four spectral bins are extracted in each frame (amplitude and phase). The step between two bins is 125 Hz.
- The spectral bins are then grouped into frequency bands that are logarithmically distributed, according to ear physiology [27]. Considering the usual values taken in CI, we used 20 bands (leading to 20 channels). The corresponding mapping is shown in Table 1.
 Table 1. Centre and cut-off frequencies of the vocoder coding.
 - In each band, the energy is calculated using the Parseval’s formula (the squares of the amplitude of each beam are added). In the FC coding, all the channels were taken. For the CP coding strategy, only the eight most energetic channels were kept. The value n = 8 is a standard in CIs [28].
- Each channel is represented by a narrowband spectrum coming from a white noise spectrum. The amplitude of the narrowband follows the energy detected in the corresponding channel. The synthesis filters covered the corresponding analysis bands but were 70 Hz narrower (35 Hz less on each side). Moreover, filters used here were 20th order Butterworth bandpass filters to avoid channel interaction. The first two-channels were represented by sine waves.
- The output signal is obtained by summing the selected channels (8 for the CP strategy; 20 for the FC strategy).
2.6. Mathematical Analysis of the Data
2.6.1. Comparison of the Percentages
The score for each test was the number of correctly repeated syllables (20 syllables per condition) expressed as a percentage.
In the case of NH subjects, we used a two-way repeated-measure ANOVA (coding scheme × SNR). For CI users, we used a two-way mixed model ANOVA [coding scheme × SNR] on intelligibility scores. Because the groups were relatively small and the data were not normally distributed, all the post-hoc analyses were performed with non-parametrical tests: Mann–Whitney’s test for unpaired data and Wilcoxon’s test for paired data.
We also calculated the Cohen’s d term as an effect size index for each average score tested [29]. Cohen’s d is a quantitative measure of the magnitude of a phenomenon: a large absolute value indicates a strong effect. Cohen’s d is defined as the difference between two means divided by a standard deviation for the data.
2.6.2. Curve Fitting with a Sigmoid Function
The recognition percentages versus the SNR can be classically represented by a sigmoid curve regression (Figure 2).
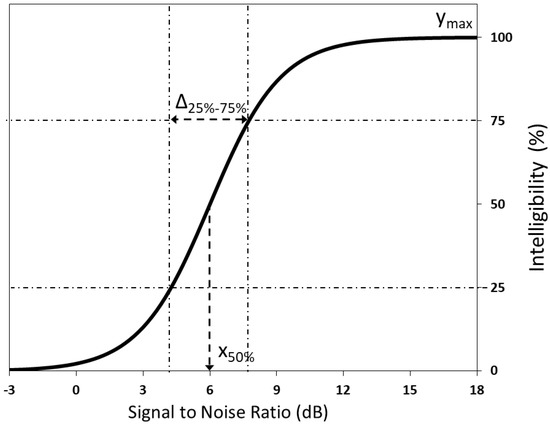
Figure 2.
Fitting of the recognition percentages by a sigmoid curve.
Three parameters were considered on this curve:
- the SNR corresponding to 50% of the maximum recognition denoted here by x50%;
- the “slope” (SNR interval, given in dB, between 25 and 75% of the maximum recognition) which is denoted here by Δ25–75%;
- the top asymptote ymax showing the maximum recognition score.
These analytical values are represented on the sigmoid curve. The minimum recognition is 0% (measured for SNR = −3 dB). Thus, the sigmoid equation is
where
- y is the recognition percentage,
- x is the SNR,
- a is ymax,
- c is x50%, and
- b is linked to the slope: b = 2.2/Δ25–75% => Δ25–75% = 2.2/b.
2.6.3. Bonferroni Correction
We considered the Bonferroni correction as an indicator but we did not adjust our probability (p) thresholds because of the small number of comparisons and the indicative orientation of this work [30]. The main objective was to look for clues that will need to be further investigated in the future. Streiner et al. [31] “advise against correcting in these circumstances but with the warning that any positive results should be seen as hypothesis generating, not as definitive findings.” Consequently, to avoid overcorrection, we used the Holm–Bonferroni method, which adjusts the rejection criteria of each of the individual comparisons. The lowest p-value is evaluated first with a Bonferroni correction involving all tests. The second is evaluated with a Bonferroni correction involving one less test and so on for the other tests. Holm’s approach is more powerful than the Bonferroni approach but it still keeps control on the Type 1 error.
3. Results
3.1. Normal-Hearing Subjects
3.1.1. Recognition Percentages
The results of syllable recognition versus the SNR are shown in Figure 3. Significant differences are indicated by an asterisk.
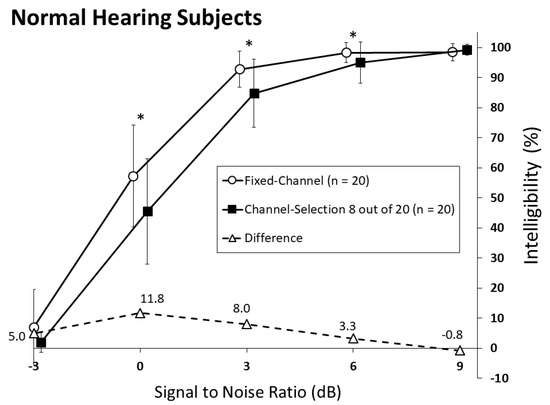
Figure 3.
Syllable recognition function of the signal-to-noise ratio by NH subjects with the CI simulator using both strategies. Bars indicate the standard deviation. The asterisks indicate the significant differences (5% threshold).
3.1.2. Statistical Analysis
The ANOVA showed a significant effect of the SNR [F (4,95) = 519; p < 10−4] and of the coding scheme [F (1,95) = 16; p < 10−4]; there was no significant interaction between them [F (4,95) = 1.95; p = 0.11]. Consequently, a post-hoc analysis was performed for the coding scheme.
For each SNR, comparisons were made with paired Wilcoxon’s tests (on the 20 subjects who participated in the experiment). In the whole experiment, we had five paired series (one for each SNR); for each paired series we had 20 pairs of values (one per subject). For the extreme SNR values (−3 dB and +9 dB), the recognition percentages were not significantly different between FC and CP (Table 2). P-values were below 5% for the SNRs 0 dB, +3 dB and +6 dB.
Table 2.
Percentage comparisons for normal-hearing subjects between the simulation strategies.
Using the Holm–Bonferroni correction, the first corrected decision threshold was 1% and differences become not significant since the lowest p-value was 0.019. For SNRs +3 and 0 dB, differences were close to significance and worth further investigation; additionally, the Cohen’s effect sizes were respectively strong (0.89) and medium (0.68). This coheres with the general ANOVA results.
3.1.3. Sigmoid Parameters
The comparison of the sigmoid parameters (Table 3) showed that the x50% values were different between FC and CP (p = 0.038). No differences were found for the slope and the plateau. Considering the Holm–Bonferroni correction, the first adjusted decision threshold was 1.7%. The effect size for x50% was strong (0.85).
Table 3.
Comparison of the sigmoid parameters, for normal-hearing listeners.
3.2. Cochlear Implant Users
3.2.1. Recognition Percentages
CI users with FC stimulations and with CP have been gathered into two groups (FC and CP); percentages are shown in Figure 4.
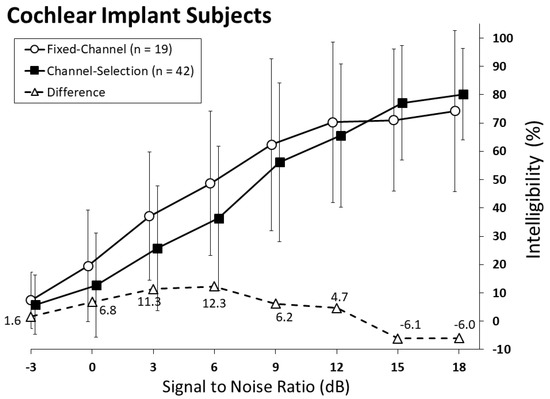
Figure 4.
Syllable recognition function of the signal-to-noise ratio by CI users. Bars indicate the standard deviation. The asterisks indicate the significant differences (5% threshold).
3.2.2. Statistical Analysis
The ANOVA indicated a significant effect of SNR [F (1,301) = 146; p < 10−4] but not for the coding scheme [F (1,43) = 0.66; p = 0.42]. A significant interaction was seen between them [F (1,301) = 2.23; p = 0.032], which may need further investigation.
The recognition percentages are indicated in Figure 4 and Table 4. We can see that the plateau was not reached for high SNRs and an inversion of the performances may be noticed between CP and FC at +15 dB.
Table 4.
Percentage comparisons for cochlear implant users between the coding strategies.
3.2.3. Sigmoid Parameters
Gathering the four implants according to their coding schemes (FC and CP), Mann–Whitney’s tests indicated a significant difference only for x50% (p = 0.042) (Table 5). After considering the Holm–Bonferroni correction, this difference needs to be discussed. The effect size was medium (0.73).
Table 5.
Comparison of the analytical values, for cochlear implant users.
We also looked for a possible link between x50% and ymax (Figure 5). The scatter plot indicates that all the situations can be observed with every implant. No correlation was seen for any manufacturer (pMed-El = 0.62, pAdvanced Bionics = 0.47, pCochlear = 0.055, pNeurelec = 0.55).
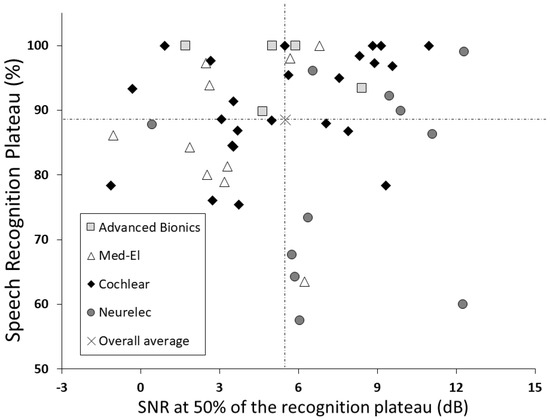
Figure 5.
Speech recognition plateau versus the x50% parameter for cochlear implant users.
4. Discussion
Several items have been considered in this study: the coding scheme, the influence of noise and the simulation of CI coding in NH subjects.
4.1. On the Coding Strategy
The choice of a coding strategy is a delicate matter and some studies have shown that CI users have a subjective preference for a particular strategy that is not always the one that yields the best performances [32].
Additionally, many technical parameters concerning the coding scheme, such as stimulation rate, gain control, update rate and filter settings, influence the final results and have an effect on the performances related to the coding strategy [28,33].
It is interesting to note that the four manufacturers have taken different stimulation strategies and the results are dispersed; it is therefore difficult to draw definitive conclusions. For any manufacturer, all coding strategies can be implemented within the processor.
From our results with NH listeners, the Bonferroni correction lowered the significance limit but the Cohen analysis indicated that the differences were reliable. The FC strategy presented better recognition percentages than CP, particularly in the SNR range 0 to +6 dB with effect sizes medium (0 and +6 dB) and strong (+3 dB). Moreover, the comparison between the x50% highlighted a strong effect size in favour of the FC strategy.
Of course, our results only stand for a CP strategy with an extraction of 8 channels out of 20 and an FC strategy with 20 channels. However, this seems to be an interesting hint, as the conditions and the subjects were the same for both strategies (CP or FC), used the same random approach, had the same SNRs and had the same signal processing (window length, sampling rate, channel band-pass, quantization, etc.), the subjects were of the same type (range of age, education, etc.) and we were able to use paired comparisons. However, this simulates an “ideal case” where there is no channel interaction and no pitch-shift due to the insertion depth of the electrode array and where all the channels are functional. This is why these results should not be taken on their own without taking into account the experiment conducted with the CI subjects.
With the CI subjects, considering the non-saturation of the percentages, we raised the SNR up to +18 dB and FC led to, albeit not significant, higher scores than CP in the 0–12 dB range. A small inversion of the results was also observed above +12 dB SNR, which can be linked to the significant interaction between SNR and coding scheme. Nevertheless, results are to be taken with caution, considering the wide dispersion of the results and the comparison of relatively small and unbalanced groups. Because of the difference in the number of included patients in each group, we used nonparametric tests to compare them; they are well adapted for this kind of comparisons. While they are generally less powerful than parametric tests, they are more robust. However, like in the experiment with NH subjects, the comparison between the x50% showed an interesting difference in favour of the FC strategies. With a medium effect size, this result would be worth investigating further in another study.
Our results are consistent with studies that showed a superiority of the FC strategy over the CP strategy, particularly in noise [5]. This was less true when CP strategies, such as ACE, with a high stimulation rate were introduced [6,7]. No clear advantage for a particular coding scheme can be identified taking all the literature on the subject.
In many studies, when the FC strategy was used, the stimulation rate was an important factor as the possibility to follow the quick changes in the signal helps the recognition performances mostly for consonants [34,35].
4.2. Cochlear Implant Users and Normal-Hearing Subjects
Despite the fact that the groups of CI users were heterogeneous, the general recognition behaviour was the same for CI users and NH subjects, whatever implant was used. With NH listeners, for a SNR of +9 dB, the 100% recognition level was reached.
With CI users, the plateau was not always reached with a SNR of +18 dB; additionally, it was below the 100% measured with NH subjects. For a +9 dB SNR (maximum tested in simulation), the CI users’ performances were below the scores observed with NH subjects; the mean scores with CI users ranged from 50 to 75%; this is consistent with previous studies [36].
The same results were also seen with the x50% (sigmoid fitting), which was better in NH subjects than with CI users.
With the CI users, an inversion occurred between +12 and +15 dB SNR and it was also seen for +18 dB SNR; performances observed with a CP strategy were higher than the performances with an FC strategy.
The reliability of the data obtained from CI users is a real issue. Is there a link between the plateau and the x50%? The scatter point diagram of the four CI user populations is shown in Figure 5. It shows that, for each manufacturer, all possibilities exist, either with a good plateau and a poor x50% or vice versa. All intermediate situations were found and the correlation coefficients were not significantly different from zero.
As the very goal is to provide an opportunity for every CI user to hear in everyday life [28], the work ahead is important. The efficiency of a CI is affected by many factors such as the recognition and linguistic skills, the degrees of nerve survival and the technical choices that are made when fitting the device and the variations are wide with every subject.
4.3. Listening in Noise
Listening in noise is a clear challenge, which is not handled in the same way by CI users and NH people. Noise flattens the spectrum and the subsequent structures in the auditory system do not react identically [37]. The study of speech recognition in noise has become of great interest as it is present in daily listening conditions. Additionally, we can see the coding behaviour for different SNRs (floor and ceiling effect and intermediate situation).
In this study, the CI user group was older on average than the NH group. In general, older people have lower speech perception scores in noise, even with normal or age-related hearing, compared to young people. However, the purpose of the study was to test both groups and see if a similar trend (between FC and CP coding schemes) could emerge and not to compare CI users with NH subjects.
Another finding was the effect of noise on performances for each strategy, which makes this study interesting in that each manufacturer can set any coding scheme on their devices. Consequently, it is worthwhile to evaluate the results through different approaches. Our work may suggest that the strategy is noise-dependent.
The number of channels needed to understand speech in noise or in quiet is an important issue. Studies have indicated that, when speech is processed in the same manner as in CIs and presented in quiet to NH listeners, sentence recognition scores are higher than 90% with as few as 4 channels [38,39]. In the literature, results show that more channels are needed to understand speech in noise than in quiet [10] but selecting more than 12 channels may not yield significant improvements on the recognition performances [21]. These considerations orientated the choice of our parameters.
In noise, performances of CI users reach a plateau as the number of channel increases; for NH subjects performances continue to increase (up to 100%), suggesting that, CI subjects could not fully utilize the spectral information provided by the number of electrodes, possibly because of the channel interaction [38]. As indicated above, trends are similar for NH and CI listeners but results are not interchangeable. It is sensible to say that more channels imply more information but this also implies more overlap between the electrodes. This conflict needs to be studied in the future; we can simulate channel interaction with NH subjects.
The acoustical material (in our case the Fournier’s lists and the cocktail party noise) seemed to be well adapted to the situation.
5. Conclusions
A simulation study of NH listeners measured syllable recognition in a noisy environment, using both Fixed-Channel and Channel-Picking coding schemes. The results were also compared with CI users’ performances. CI users were divided into two groups corresponding to the coding schemes available. Twenty NH subjects and 45 CI users participated in this experiment. The acoustic material was the Fournier French dissyllabic lists mixed with a cocktail-party noise.
The results obtained in the simulation with the NH subjects indicated an advantage of the fixed-channel strategy over the channel-picking coding in a middle SNR range (from 0 to +6 dB); parameters (patients, technology and protocol) were well controlled in this approach. This trend was confirmed using the sigmoid curve regression. The results seemed similar with the CI users.
Nevertheless, results were less reliable with CI users, probably due to the wide dispersion in the patients’ results. Additionally, an inversion of the coding strategy was seen with high SNRs, with CI users. This aspect should be examined in the future, considering its practical application and we need to consider the physiological and electrical phenomena involved in a multichannel stimulation such as channel interaction. Simulation and tests with CI users are useful as they give two complementary insights into the difficult task of determining an “optimal” sound coding strategy to enhance the auditory performance of CI users.
Author Contributions
Conceptualization, C.B.-V., E.T. and S.G.; formal analysis, P.A.C. and S.G.; investigation, P.A.C.; methodology, P.A.C., C.B.-V. and S.G.; resources, E.T.; software, P.A.C. and F.M.; supervision, C.B.-V, E.T. and S.G.; visualization, P.A.C. and C.B.-V; writing—original draft preparation, P.A.C. and C.B.-V; writing—review and editing, P.A.C., C.B.-V, F.M., R.H., E.T. and S.G.
Funding
This research received no external funding.
Acknowledgments
The authors would like to thank the people and institutions who participated in this study: Kevin Perreault who initiated the work, Charles-Alexandre Joly and Fabien Seldran for their scientific contribution, Evelyne Veuillet for contacts with the ethic-committee, the members of the CRIC team of the Edouard Herriot University hospital of Lyon for their collaboration, the normal-hearing subjects and the cochlear implant users who entered the study and the Hospitals of Lyon and the Polytechnic School of Lyon for their administrative support.
Conflicts of Interest
The authors declare no conflict of interest.
Appendix A
Table A1.
Demographic details for cochlear implant users.
Table A1.
Demographic details for cochlear implant users.
| Characteristic | N |
|---|---|
| Gender | |
| Male | 23 |
| Female | 22 |
| Ear | |
| Right | 32 |
| Left | 13 |
| Origin of deafness | |
| Congenital | 17 |
| Acquired | 18 |
| Unknown | 10 |
| Age in years at implantation | |
| 1–5 years | 9 |
| 6–10 years | 3 |
| 11–20 years | 6 |
| >20 years | 27 |
| Duration in years of implant use | |
| 1–5 years | 14 |
| 6–10 years | 14 |
| 11–15 years | 7 |
| 16–20 years | 9 |
| >20 years | 1 |
| Duration of deafness in years | |
| 1–10 years | 4 |
| 11–20 years | 18 |
| 21–30 years | 4 |
| 31–40 years | 8 |
| >40 years | 5 |
| Unknown | 7 |
| Cochlear implant | |
| Cochlear | 13 |
| Med-El | 12 |
| Advanced Bionics | 7 |
| Neurelec/Oticon Medical | 13 |
| Coding strategy | |
| Channel-picking (SPEAK, ACE…) | 26 |
| Fixed-channel (FS4, HiRes…) | 19 |
References
- NIDCD. Available online: https://www.nidcd.nih.gov/ (accessed on 14 June 2017).
- Fetterman, B.L.; Domico, E.H. Speech recognition in background noise of cochlear implant patients. Otolaryngol. Head Neck Surg. 2002, 126, 257–263. [Google Scholar] [CrossRef] [PubMed]
- Clark, G. Cochlear Implants: Fundamentals and Applications; Springer Science & Business Media: New York, NY, USA, 2006; ISBN 978-0-387-21550-1. [Google Scholar]
- Blamey, P.; Artieres, F.; Başkent, D.; Bergeron, F.; Beynon, A.; Burke, E.; Dillier, N.; Dowell, R.; Fraysse, B.; Gallégo, S.; et al. Factors affecting auditory performance of postlinguistically deaf adults using cochlear implants: An update with 2251 patients. Audiol. Neurotol. 2013, 18, 36–47. [Google Scholar] [CrossRef] [PubMed]
- Kiefer, J.; Müller, J.; Pfennigdorff, T.; Schön, F.; Helms, J.; von Ilberg, C.; Baumgartner, W.; Gstöttner, W.; Ehrenberger, K.; Arnold, W.; et al. Speech understanding in quiet and in noise with the CIS speech coding strategy (MED-EL Combi-40) compared to the multipeak and spectral peak strategies (nucleus). ORL J. Otorhinolaryngol. Relat. Spec. 1996, 58, 127–135. [Google Scholar] [CrossRef] [PubMed]
- Kiefer, J.; Hohl, S.; Stürzebecher, E.; Pfennigdorff, T.; Gstöettner, W. Comparison of speech recognition with different speech coding strategies (SPEAK, CIS and ACE) and their relationship to telemetric measures of compound action potentials in the nucleus CI 24M cochlear implant system. Audiology 2001, 40, 32–42. [Google Scholar] [CrossRef] [PubMed]
- Skinner, M.W.; Holden, L.K.; Whitford, L.A.; Plant, K.L.; Psarros, C.; Holden, T.A. Speech recognition with the nucleus 24 SPEAK, ACE and CIS speech coding strategies in newly implanted adults. Ear Hear 2002, 23, 207–223. [Google Scholar] [CrossRef] [PubMed]
- Brockmeier, S.J.; Grasmeder, M.; Passow, S.; Mawmann, D.; Vischer, M.; Jappel, A.; Baumgartner, W.; Stark, T.; Müller, J.; Brill, S.; et al. Comparison of musical activities of cochlear implant users with different speech-coding strategies. Ear Hear 2007, 28, 49S–51S. [Google Scholar] [CrossRef] [PubMed]
- Dorman, M.F.; Loizou, P.C.; Spahr, A.J.; Maloff, E. A comparison of the speech understanding provided by acoustic models of fixed-channel and channel-picking signal processors for cochlear implants. J. Speech Lang. Hear. Res. 2002, 45, 783–788. [Google Scholar] [CrossRef]
- Shannon, R.V.; Fu, Q.-J.; Galvin, J. The number of spectral channels required for speech recognition depends on the difficulty of the listening situation. Acta Otolaryngol. Suppl. 2004, 124, 50–54. [Google Scholar] [CrossRef]
- Verschuur, C.A. Effect of stimulation rate on speech perception in adult users of the Med-El CIS speech processing strategy. Int. J. Audiol. 2005, 44, 58–63. [Google Scholar] [CrossRef]
- Wilson, B.S.; Finley, C.C.; Lawson, D.T.; Wolford, R.D.; Eddington, D.K.; Rabinowitz, W.M. Better speech recognition with cochlear implants. Nature 1991, 352, 236–238. [Google Scholar] [CrossRef]
- Qazi, O.U.R.; van Dijk, B.; Moonen, M.; Wouters, J. Understanding the effect of noise on electrical stimulation sequences in cochlear implants and its impact on speech intelligibility. Hear. Res. 2013, 299, 79–87. [Google Scholar] [CrossRef] [PubMed]
- Garnham, C.; O’Driscoll, M.; Ramsden, R.; Saeed, S. Speech understanding in noise with a Med-El COMBI 40+ cochlear implant using reduced channel sets. Ear Hear 2002, 23, 540–552. [Google Scholar] [CrossRef] [PubMed]
- Hu, Y.; Loizou, P.C. A new sound coding strategy for suppressing noise in cochlear implants. J. Acoust. Soc. Am. 2008, 124, 498–509. [Google Scholar] [CrossRef] [PubMed]
- Jeanvoine, A.; Gnansia, D.; Truy, E.; Berger-Vachon, C. Contribution of Noise Reduction Algorithms: Perception Versus Localization Simulation in the Case of Binaural Cochlear Implant (BCI) Coding. In Emerging Trends in Computational Biology, Bioinformatics and System Biology; Elsevier Inc.: Amsterdam, The Netherlands, 2015; pp. 307–324. [Google Scholar]
- Wang, Q.; Liang, R.; Rahardja, S.; Zhao, L.; Zou, C.; Zhao, L. Piecewise-Linear Frequency Shifting Algorithm for Frequency Resolution Enhancement in Digital Hearing Aids. Appl. Sci. 2017, 7, 335. [Google Scholar] [CrossRef]
- Kallel, F.; Frikha, M.; Ghorbel, M.; Hamida, A.B.; Berger-Vachon, C. Dual-channel spectral subtraction algorithms based speech enhancement dedicated to a bilateral cochlear implant. Appl. Acoust. 2012, 73, 12–20. [Google Scholar] [CrossRef]
- Seldran, F.; Gallego, S.; Thai-Van, H.; Berger-Vachon, C. Influence of coding strategies in electric-acoustic hearing: A simulation dedicated to EAS cochlear implant, in the presence of noise. Appl. Acoust. 2014, 76, 300–309. [Google Scholar] [CrossRef]
- Dorman, M.F.; Loizou, P.C.; Fitzke, J.; Tu, Z. Recognition of monosyllabic words by cochlear implant patients and by normal-hearing subjects listening to words processed through cochlear implant signal processing strategies. Ann. Otol. Rhinol. Laryngol. Suppl. 2000, 185, 64–66. [Google Scholar] [CrossRef]
- Loizou, P.C.; Dorman, M.F.; Tu, Z.; Fitzke, J. Recognition of sentences in noise by normal-hearing listeners using simulations of speak-type cochlear implant signal processors. Ann. Otol. Rhinol. Laryngol. Suppl. 2000, 185, 67–68. [Google Scholar] [CrossRef]
- Dorman, M.F.; Loizou, P.C.; Fitzke, J. The identification of speech in noise by cochlear implant patients and normal-hearing listeners using 6-channel signal processors. Ear Hear 1998, 19, 481–484. [Google Scholar] [CrossRef]
- Winn, M.B.; Rhone, A.E.; Chatterjee, M.; Idsardi, W.J. The use of auditory and visual context in speech perception by listeners with normal hearing and listeners with cochlear implants. Front. Psychol. 2013, 4, 824. [Google Scholar] [CrossRef]
- Perreaut, K.; Gallego, S.; Berger-Vachon, C.; Millioz, F. Influence of Microphone Encrusting on the Efficiency of Cochlear Implants Preliminary Study with a Simulation of CIS and “n-of-m” Strategies. AMSE J. Ser. Model. C 2014, 75, 199–208. [Google Scholar]
- Hornickel, J.; Skoe, E.; Kraus, N. Subcortical Laterality of Speech Encoding. Audiol. Neurotol. 2009, 14, 198–207. [Google Scholar] [CrossRef]
- Zatorre, R.J.; Belin, P.; Penhune, V.B. Structure and function of auditory cortex: Music and speech. Trends Cogn. Sci. (Regul. Ed.) 2002, 6, 37–46. [Google Scholar] [CrossRef]
- Traunmüller, H. Analytical expressions for the tonotopic sensory scale. J. Acoust. Soc. Am. 1990, 88, 97–100. [Google Scholar]
- Wouters, J.; McDermott, H.J.; Francart, T. Sound Coding in Cochlear Implants: From electric pulses to hearing. IEEE Signal Process. Mag. 2015, 32, 67–80. [Google Scholar] [CrossRef]
- Sullivan, G.M.; Feinn, R. Using Effect Size—Or Why the P Value Is Not Enough. J. Grad. Med. Educ. 2012, 4, 279–282. [Google Scholar] [CrossRef]
- Armstrong, R.A. When to use the Bonferroni correction. Ophthalmic Physiol. Opt. 2014, 34, 502–508. [Google Scholar] [CrossRef]
- Streiner, D.L.; Norman, G.R. Correction for multiple testing: Is there a resolution? Chest 2011, 140, 16–18. [Google Scholar] [CrossRef]
- Skinner, M.W.; Arndt, P.L.; Staller, S.J. Nucleus 24 advanced encoder conversion study: Performance versus preference. Ear Hear 2002, 23, 2S–17S. [Google Scholar] [CrossRef]
- Kallel, F.; Laboissiere, R.; Ben Hamida, A.; Berger-Vachon, C. Influence of a shift in frequency distribution and analysis rate on phoneme intelligibility in noisy environments for simulated bilateral cochlear implants. Appl. Acoust. 2013, 74, 10–17. [Google Scholar] [CrossRef]
- Riss, D.; Hamzavi, J.-S.; Blineder, M.; Flak, S.; Baumgartner, W.-D.; Kaider, A.; Arnoldner, C. Effects of stimulation rate with the fs4 and hdcis coding strategies in cochlear implant recipients. Otol. Neurotol. 2016, 37, 882–888. [Google Scholar] [CrossRef] [PubMed]
- Wilson, B.S.; Sun, X.; Schatzer, R.; Wolford, R.D. Representation of fine structure or fine frequency information with cochlear implants. Int. Congr. Ser. 2004, 1273, 3–6. [Google Scholar] [CrossRef]
- Dorman, M.F.; Loizou, P.C. The identification of consonants and vowels by cochlear implant patients using a 6-channel continuous interleaved sampling processor and by normal-hearing subjects using simulations of processors with two to nine channels. Ear Hear 1998, 19, 162–166. [Google Scholar] [CrossRef] [PubMed]
- Aguiar, D.E.; Taylor, N.E.; Li, J.; Gazanfari, D.K.; Talavage, T.M.; Laflen, J.B.; Neuberger, H.; Svirsky, M.A. Information theoretic evaluation of a noiseband-based cochlear implant simulator. Hear. Res. 2015, 333, 185–193. [Google Scholar] [CrossRef] [PubMed]
- Friesen, L.M.; Shannon, R.V.; Baskent, D.; Wang, X. Speech recognition in noise as a function of the number of spectral channels: Comparison of acoustic hearing and cochlear implants. J. Acoust. Soc. Am. 2001, 110, 1150–1163. [Google Scholar] [CrossRef] [PubMed]
- Loizou, P.C.; Dorman, M.; Tu, Z. On the number of channels needed to understand speech. J. Acoust. Soc. Am. 1999, 106, 2097–2103. [Google Scholar] [CrossRef] [PubMed]
© 2019 by the authors. Licensee MDPI, Basel, Switzerland. This article is an open access article distributed under the terms and conditions of the Creative Commons Attribution (CC BY) license (http://creativecommons.org/licenses/by/4.0/).