Abstract
Milling is a kind of interrupted cutting. When the tool cuts into the workpiece, it is often accompanied by instantaneous impact, which results in impact vibration of the milling system. Meanwhile, tool wear will occur gradually on flank face with the cutting progress. The impact vibration and tool wear affect the morphological characteristics of machined surfaces. In the present work, the instantaneous impact force is obtained by introducing the italic impact model of single degree of freedom, and the free vibration in the x and y directions under the impact force is obtained by combining the damped vibration equation. The cutting vibration in the x and y directions is obtained by solving the dynamic equation of the milling system with the fourth-order Runge–Kutta method. The equation of the cutting edge is modified according to the tool flank wear, and the machined surface topography considering the dynamic characteristics of cutting system and tool flank wear is obtained by combining the Z-MAP algorithm. The verification milling experiment was carried out on the hardened steel Cr12MoV workpiece. The simulation results are in good agreement with the experimental results. The research results have important guiding significance for the reasonable selection of processing parameters in actual production.
1. Introduction
The operational performance of parts (fatigue performance, wear resistance, corrosion resistance) is controlled by surface integrity [1,2]. The formation mechanism of machined surface topography is an important part of surface integrity research. Ball end milling cutter is widely used in the complex surface finishing of important parts in aerospace, die and automobile industry because of its strong adaptability. Due to the high surface quality requirements of these products, extensive research work has been carried out around this milling process [3,4]. The cutting edges geometry of the ball-end milling cutter is complex, and the contact point between the cutting edges and the workpiece is constantly changing during milling. In addition, the dynamic characteristics of the milling process are complex [5]. It is difficult to study the surface quality of the machine by traditional experimental methods. Therefore, it is necessary to simulate the surface topography.
Mizugaki et al. [6,7] established a theoretical model for predicting the surface topography during milling. The effects of the shape of cutting edge, the tilting tool orientation, the tool eccentricity and the interference area of tool flank face on the surface topography were studied. However, the simulation results of surface topography considering the shape of cutting edge, the tilting tool orientation and the tool eccentricity were not verified by experiments. Bouzakis et al. [8] developed a simulation algorithm considering milling kinematics to determine the shape of the undeformed chip, cutting force, tool deformation and surface topography. The effects of different milling methods, the tilting tool orientation, feed rate and radial cutting width on surface morphology were investigated. Based on the assumption that the envelope of the cutting edge of the ball-end milling cutter is approximated, a hemisphere when the spindle speed is much larger than the feed speed, Jung et al. [9,10] defined three types of ridges to represent the scallop-height of surface, and proposed a ridge model to predict the surface morphology and roughness. The surface morphology characteristics of one-way feeding and reciprocating feeding are studied. It was found that one-way feeding can obtain smaller surface roughness than reciprocating feeding. Based on a Z-map model, Liu et al. [11] developed a comprehensive simulation system for predicting surface topography and roughness characteristics during finishing milling. The influence of tool eccentricity and wear on surface morphology and roughness was studied by modifying tool center movement and the shape of cutting edge. It was found that tool wear and tool eccentricity have little effect on surface morphology and roughness, but the prediction model of surface quality considering tool wear and tool eccentricity is closer to the experimental value. Buj-Corral et al. [12] established a mathematical model for predicting the surface topography and roughness by constructing surface topography into a functional relationship between cutting parameters and tool geometry parameters. Xu et al. [13] proposed an improved surface topography simulation algorithm based on a Z-map model. The effects of cutting feed rate, cutting width, the tilting tool orientation and tool runout on surface quality were studied. By solving the cycloidal equation of cutting edge and the feed plane equation, the intersection points of all feed planes and the cycloidal trajectory of cutting edge are determined. Then, the surface morphology of five-axis milling process is obtained by an intersection points matrix [14]. The effects of the tilting tool orientation, tool lead angle and tool eccentricity on surface morphology were studied. However, the proposed model had lower accuracy. Li et al. [15] established a five-axis milling surface topography analysis model considering positioning error, spindle error, machine tool geometry error and tool deformation. The above surface morphology model does not take into account the tool vibration with time-varying characteristics, and can not correlate it with the dynamic response of the milling process.
Cutting vibration and tool wear have a significant influence on the surface quality in cutting process, which has attracted the wide attention of researchers. Arizmendi et al. [16] and Jiang et al. [17] used eddy current displacement sensors to obtain tool vibration displacement during milling. Then, the equation of cutting edges trajectory was modified based on the vibration displacement data, and the prediction model of surface topography considering tool vibration was established. Costes et al. [18] used a laser displacement sensor to obtain tool vibration displacement in the cutting process, and established the milling morphology prediction model considering the tilting tool orientation and the tool vibration. Whether an eddy current displacement sensor or a laser displacement sensor, the accuracy of data acquisition is affected by spindle speed. Therefore, this method is not suitable for high-speed and ultra-high-speed machining. Based on the tool-tip trajectory equation, Peng et al. [19] established a micro-ball-end milling morphology prediction model considering the tilting tool orientation, vibration, eccentricity and deformation. However, the vibration of the cutter in the axial direction was only considered in the surface topography model, while the vibration in the radial direction was ignored. Since the tool stiffness in the axial direction is much greater than that in the radial direction, the vibration amplitude in the radial direction is larger. If the radial vibration is neglected, the simulation precision of the surface morphology will be reduced. Chen et al. [20] established a surface morphology prediction model for micro-milling considering kinematics, tool eccentricity and dynamic regeneration. Lu et al. [21] established a surface morphology prediction model for micro-milling considering scale effect, multiple regenerative effect and tool deformation. Yang et al. [22] investigated the influences of milling vibrations on the machined surface topography. Zhang et al. [23,24] proposed a simulation model of surface topography in multi-axis ball-end milling considering tool wear. The effects of feed rate and the tilting tool orientation on surface topography were studied, but the effects of different tool wear on surface topography were not clearly revealed, which need to be further explored. Omar et al. [25] established a mathematical model that can predict cutting force and surface morphology at the same time. The effects of tool eccentricity, tool deformation, system dynamics, flank wear and the tilting tool orientation on surface quality were studied. The simulation result was in good agreement with the experimental result, which verified the accuracy of the simulation mathematical model.
Milling is a kind of interrupted cutting. Cutting impact vibration and cutting vibration caused by a nonlinear change of chip thickness exist in the process of cutting tool material removal. Meanwhile, tool wear will occur gradually on a flank face with the cutting progress. The morphological characteristics of machined surfaces are controlled by the dynamic characteristics of the cutting system and the tool flank wear of time variation. The influence of dynamic characteristics of cutting system and tool wear on surface morphology has not been taken into account in the morphology prediction model established in the existing literature. In the present study, the machined surface topography considering the dynamic characteristics of cutting system and tool flank wear is established. The research results have important guiding significance for the reasonable selection of processing parameters in actual production.
2. The Kinematic Trajectory Equation of Cutting Edges
The establishment of the trajectory equation of any cutting point on the cutting edge in the milling process is the basis and key to the simulation modeling of the surface topography of the ball-end milling cutter. Therefore, the rectangular coordinate system as shown in Figure 1 is introduced.
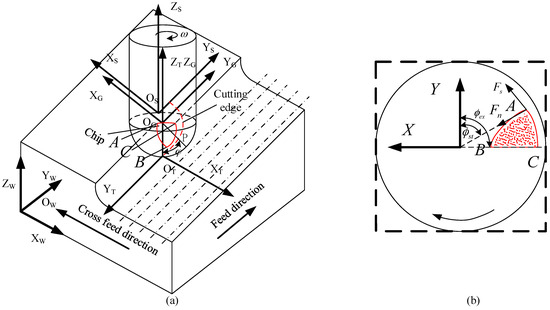
Figure 1.
Reference coordinate system of the kinematic trajectory, (a) the cutter workpiece engagement; (b) the overhead view of the cutter workpiece engagement.
The workpiece coordinate system OWXWYWZW ({W} for short) is a reference coordinate system fixed on the workpiece. The tool rotation coordinate system OTXTYTZT ({T} for short) rotates with the tool. The tool coordinate system OGXGYGZG ({G} for short) translates and vibrates with the tool. The spindle coordinate system OSXSYSZS ({S} for short) moves along the feed direction with the spindle. is the normal contact force. is the tangential contact force. and are the entry and exit angles of the cutter to and from the cut, respectively. is the axial position angle.
Taking ball-end milling cutter as the research object, the homogeneous coordinates of any point P on the cutting edge in {T} can be expressed as follows:
where is axial position angle, is helix angle of tool, and is tool radius.
Meanwhile, tool wear will occur gradually on the flank face and rake face with the cutting progress. Since tool flank wear has a significant influence on the surface topography, the effect of tool flank wear on the surface topography is researched. The geometric relationship between the flank wear and the discrete points of the cutting edge is shown in Figure 2.
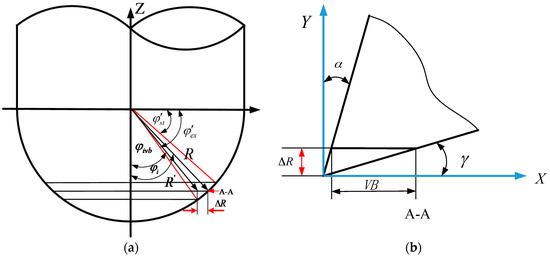
Figure 2.
Schematic diagram of flank wear (a) the position change of cutting edge with tool wear; (b) the relationship between the radial radius variation and tool flank wear.
The homogeneous coordinates of any point P on the cutting edge with wear in {T} can be expressed as follows:
where and are the clearance angle and the rake of the cutting tool.
The coordinate transformation matrix from {T} to {G} at any point P on the cutting edge can be expressed as follows:
where , is the initial entrance angle of the tool, is the teeth number, and is the angular velocity of the tool.
The stiffness of workpiece is much higher than that of the cutter-spindle cutting system for the milling process of automobile panel die. Therefore, the vibration of machining process mainly occurs in the tool-spindle cutting system. Meanwhile, because the stiffness of the ball-nose cutter in the axial direction is far greater than that in the radial direction, the vibration of the cutter in the axial direction is neglected:
where and are the vibration caused by cutting impact. and are the vibration caused by stable cutting. Detailed solutions of the two kinds of cutting vibration are given in Parts 3 and 4.
The coordinate transformation matrix from {G} to {S} can be expressed as follows:
The most basic of the tool path mode is unidirectional or bi-directional in the milling process. The tool path mode of one-way is selected in this paper. The transformation matrix from the spindle coordinate system to the workpiece coordinate system is shown in Equation (9):
where is the number of feeds in the cross-feed direction. is the feed rate of the tool. is the cut width. is the tilt angle of the workpiece. is the coordinate value of the origin of the machine tool spindle coordinate system in the workpiece coordinate system during the first feed of the tool.
The machined surface topography is obtained by cross-calculation between the space motion envelope of the tool and Boolean of the workpiece. The space motion envelope of the tool can be expressed by Equation (10):
where represents the product of the transformation matrix of tool motion space at each moment. and are window functions, which are used to judge the tool wear area. The expression is shown in Equation (11):
where and are the minimum and maximum axial position angles of tool wear, respectively.
The precise sweep surface mathematical model can be obtained by substituting the sweep surface model of the cutting edge in the tool coordinate system into Equation (10), as shown in Figure 3.
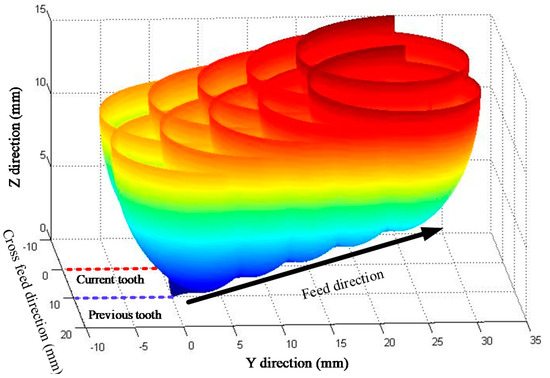
Figure 3.
Swept surfaces of one cutting edge along two adjacent tool paths.
3. Milling Dynamics Equation
The cutter has more flexibility than the workpiece in the process of milling automobile mould, so the cutter is considered a flexible body and the workpiece a rigid body. A two-degree-of-freedom spring-damper-mass system model is established, as shown in Figure 4:
where , , , , , are vibration acceleration, vibration velocity and vibration displacement of the cutting system. , , , , , and are the mass, structural damping, and stiffness matrices of the cutting system in the x and y direction.
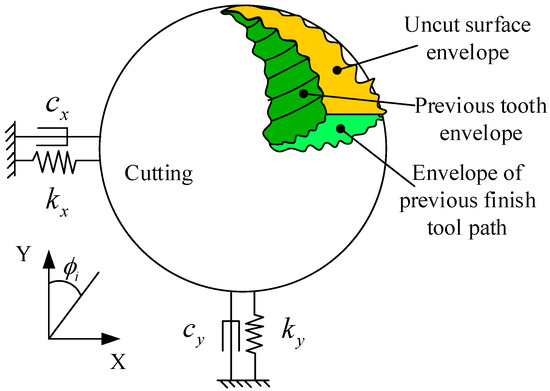
Figure 4.
Two-degree-of-freedom spring-damper-mass system model.
The cutting vibration in the x and y directions is obtained by solving the milling process dynamics with the fourth-order Runge–Kutta method. Taking the differential equation in Equation (12) as an example, the solving process of vibration in x direction is as follows:
We set equals , Equation (13) can be descended to one-order differential equation:
The function Ode45 in MATLAB (R2014a, MathWorks, Natick, MA, USA) is used to solve differential equations. The function Ode45 belongs to the explicit Runge–Kutta algorithm and has fourth-order accuracy. Choosing a small time interval can obtain a more accurate solution, but it will increase the operation time. Therefore, the optimum selection principle of is as follows:
where is the maximum natural frequency of the milling system.
4. Mathematical Model of Impact Force
The instantaneous impact force is often generated during the cutting edge cutting into the workpiece, which makes the cutting system produce impact vibration and affects the machined surface morphology. Therefore, the instantaneous impact force model is established based on the italic collision model of single degree of freedom. The geometric relationship of impact force is shown in Figure 1a.
4.1. The Normal Contact Force Model
The contact collision process can be regarded as a continuous dynamics problem, and the collision force can be obtained by equivalent spring damping model [26]. The solution formula of the normal contact force is as follows:
where is the stiffness coefficient, and is the elastic deformation of collision object. is the index of penetration depth. is the damping coefficient. is the relative velocity of two objects. is the hysteretic damping factor. The solution of related parameters in Equation (16) is detailed in Ref. [27].
4.2. The Tangential Contact Force Model
The two contact objects will produce relative motion during the italic collision, which will generate friction in the tangential direction. The tangential contact force model is obtained based on Coulomb friction force:
The tangential and normal contact forces are transformed into the x and y directions, as shown in Equation (18):
Impact vibration can be regarded as single mass attenuation vibration. The damped vibration equation in the x direction is as follows:
The solution of the homogeneous differential equation is as follows:
5. The Simulation Arithmetic of Surface Topography
The Z-map method is used to predict the three-dimensional morphology of milling process in this paper. Firstly, the workpiece is discretized to get three-dimensional mesh points on the workpiece surface. Afterwards, the appropriate time step is selected to ensure that only one mesh point falls on a space surface swept by the cutting edge within the unit time step. Comparing the position relationship between the edge curve and the mesh points on the workpiece surface, the mesh points above the edge curve are discarded, and the coordinate value of the cutting edges discrete point Z is replaced by the height value of the corresponding mesh points in the workpiece discrete point H matrix. The three-dimensional surface topography is drawn by the H matrix after the cutting is completed. The detailed algorithm flow chart is shown in Figure 5. The surface morphology of the oblique-plane is shown in Figure 6.
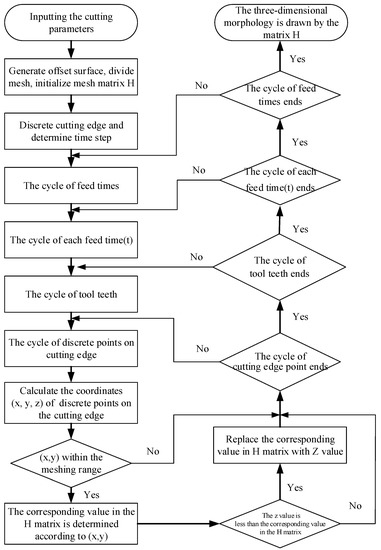
Figure 5.
The detailed algorithm flow chart.
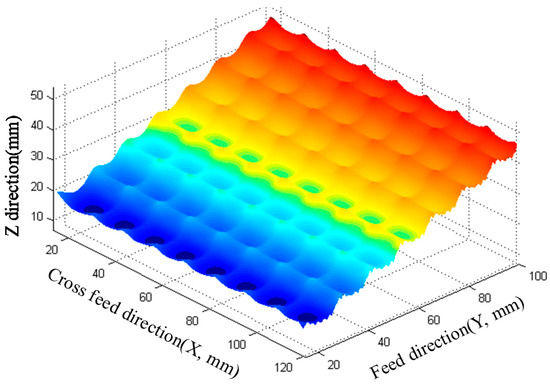
Figure 6.
The surface morphology of the oblique-plane.
6. Experimental Set-Up
6.1. Experimental Equipment
The VDL-1000E three-axis CNC (Computerized Numerical Control) machine tool produced by Dalian machine tool group (Dalian, China) was used. The solid carbide ball end mill is SH300-B2-10015-H produced by the Xiamen Golden Heron Company (Xiamen, China) with a diameter of 10 mm and the tooth number of 2. Cr12MoV hardened steel with 45 HRC (Rockwell hardness) hardness was selected as experimental material. A PCB accelerometer with sensitivity of 10.42 mv/g was used to collect the acceleration signals during cutting. The modal parameters of the milling system were obtained by modal tests with a sensitivity of 3.41 pC/N force hammer. An experimental site is shown in Figure 7. The tool flank wear states were observed by a super deep scene 3D microscope with VHX-1000(KEYENCE, Osaka, Japan), as shown in Figure 8. The surface morphology of the machined workpiece was measured by a Taylor Hobson white-light interferometer (Taylor Hobson, Leicester, UK) with a CCI Map. The experimental scheme is presented in Table 1.
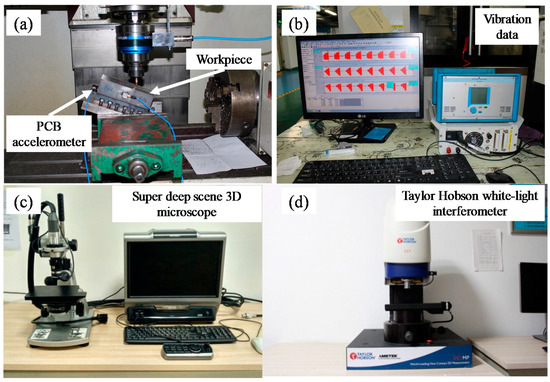
Figure 7.
Experimental site (a) cutting process; (b) the collection of vibration data; (c) measurement of tool wear; (d) measurement of surface morphology.
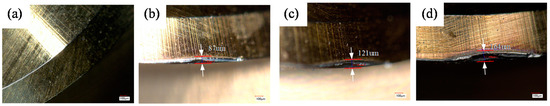
Figure 8.
Ball-end milling cutters with different wear states (a) VB = 0; (b) VB = 87um; (c) VB = 121 um; (d) VB = 164 um. VB—the tool wear.

Table 1.
The experimental scheme.
6.2. Experimental Analysis
Since the vibration of the cutting system is mainly affected by the first-order modal parameters, only the first-order modal parameters of the cutting system (natural frequency, damping ratio, stiffness) are obtained in this paper, as shown in Table 2.
Table 2.
The first-order modal parameters.
The cutting force coefficient was obtained by analyzing the experimental cutting force data with the average milling force method, and the results are shown in Table 3.
Table 3.
The cutting force coefficients.
7. Results
The cutting impact vibration with the cutting parameters (Test 1) in the the x and y directions are shown in Figure 9.
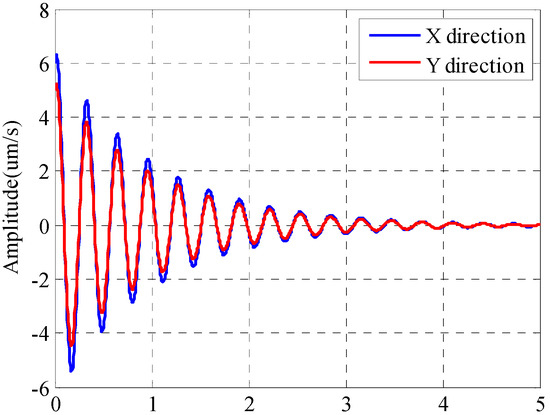
Figure 9.
Impact vibration.
The simulation results of maximum cutting vibration values with/without impact vibration are compared with the experimental results for cutting parameters (Test 1–5) as shown in Figure 10. The maximum cutting vibration values in the x direction were changed into absolute values.
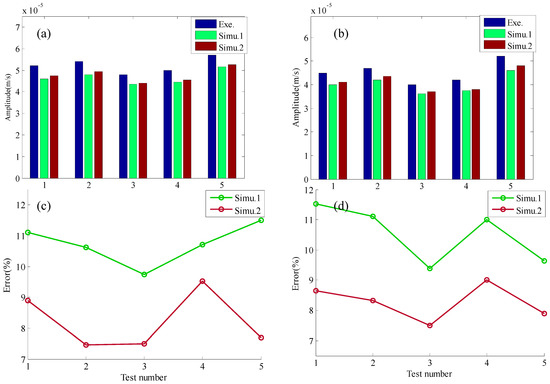
Figure 10.
Simulation (Simu.1 and Simu.2) and experiment (Exe.) of cutting vibration: Simu.1-cutting vibration without impact vibration; Simu.2-cutting vibration with impact vibration; cutting vibration (a) x direction, (b) y direction; error (c) x direction, (d) y direction.
As seen in Figure 10, the simulation results of cutting vibration considering impact vibration (Simu.2) are more precise. The simulation error of cutting vibration in the x direction can be reduced by 33.13% in maximum (Test 5). The simulation error of cutting vibration in the y direction can be reduced by 25.02% at the maximum (Test 2).
The simulation results of total cutting vibration with cutting parameters (Test 1) in the x and y directions are shown in Figure 11a,c. Cutting vibration obtained from cutting experiments is shown in Figure 11b,d.
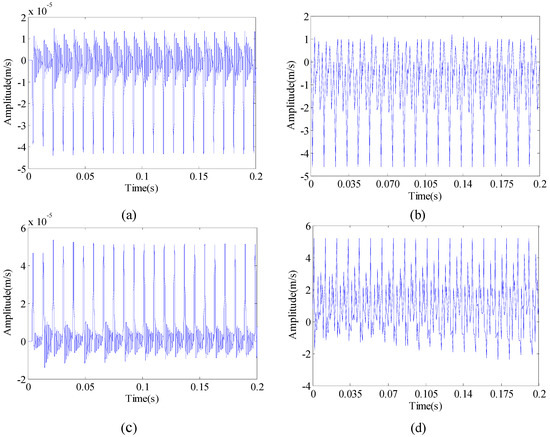
Figure 11.
Simulation and experiment of cutting vibration. (a) simulation in the x direction; (b) experiment in the x direction; (c) simulation in the y direction; (d) experiment in the y direction.
It can be found from Figure 11 that the vibration signal obtained by simulation and experiment has a good consistency in both trend and value. Therefore, the vibration simulation data can be used to simulate the dynamic characteristics of the machining process, which lays a foundation for studying the influence of milling vibration on the surface morphology.
The simulation and experimental results of surface morphology and roughness for cutting parameters (Test 1) are shown in Figure 12.
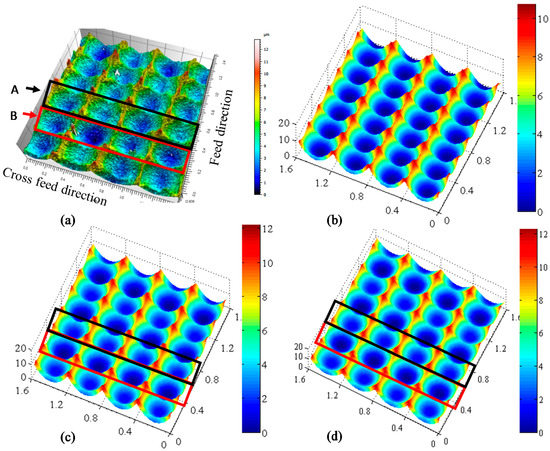
Figure 12.
Surface morphology (a) experiment (Ra = 0.273 um); (b) without cutting vibration (Ra = 0.221 um); (c) without impact vibration (Ra = 0.240 um); (d) with cutting vibration (Ra = 0.247 um)
It can be seen from Figure 12 that the dynamic characteristics of the cutting system affect the texture structure of the machined surface. Due to the influence of cutting system vibration, the cutting contour of adjacent surface topologies in the feed direction is different, which is caused by the slight up–down displacement of the two edges of the ball-end milling cutter, as shown in Figure 12a. A is the surface profile formed when the vibration of the cutting system is maximum, and B is the surface profile formed when the vibration of the cutting system is minimum. It can be seen from Figure 12 b–d that, when the vibration of cutting system is considered, the surface topography obtained by simulation is closer to that obtained by actual machining process. Meanwhile, it is found that the impact vibration has little effect on the texture structure of the surface morphology but affects the scallop-height of the machined surface. The reasons for the difference in surface morphology between the simulated and experimental are as follows: (1) the cut-in phase angle is random in the experiment process; and (2) the surface topography model does not take into account the tool deformation. When the dynamic characteristics of cutting system are not considered, the simulation error of surface roughness is 19.05%. When only the vibration caused by a nonlinear change of chip thickness is considered, the surface roughness error is 12.09%. When the vibration of cutting system with cutting impact vibration is considered, the error of surface roughness is 9.52%.
The simulation and experimental results of surface roughness at different tool wear for cutting parameters (Test 1) are shown in Figure 13.
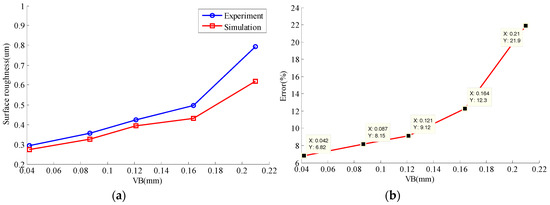
Figure 13.
Simulation and experiment of surface roughness at different tool wear. VB—the tool wear. (a) effect of tool wear on surface roughness; (b) error.
It can be seen from Figure 13 that the surface roughness increases with the increase of tool wear. When the tool wear amount is less than 0.164 mm, the surface roughness increases more slowly. When tool wear increases from 0.164 mm to 0.21 mm, the increase rate of surface roughness is close to 50%. When the tool wear is less than 0.164 mm, the maximum error between the surface roughness simulation and the experimental measurement is 12.3%, which is within the acceptable range. When the tool wear is 0.21 mm, the maximum error between the surface roughness simulation and the experimental measurement is 21.9%. The reason is that the cutting edge near the tool tip induces micro-chipping.
The simulation and experimental results of surface morphology at different tool wear for cutting parameters (Test 1) are shown in Figure 14.
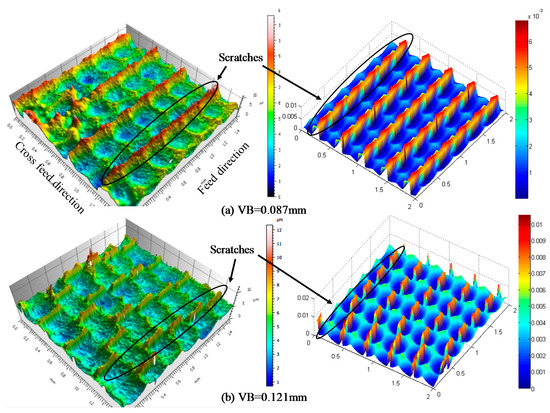
Figure 14.
Surface morphology at different tool wear, Ra(um) (a) experiment—0.356; simulation—0.372;(b) experiment—0.424; simulation—0.395.
It can be seen from Figure 14 that, with the increase of tool wear, the texture structure of the workpiece surface changes and the maximum scallop height on the surface increases accordingly. Meanwhile, the texture asperities grow and the grooves deepen with tool wear in the experiments. The worn tool causes scratches on the machined surface, which leads to deterioration of the machined surface. It is found that the scratch width of simulation is larger than that of the experiment. The reason is that the tool wear is assumed to be the same in the wear area in the simulation process, which is inconsistent with the actual situation.
8. Conclusions
Based on the Z-MAP method, a prediction model of machined surface topography considering dynamic characteristics of the cutting system and tool flank wear is established. The effects of cut-in impact and tool wear on surface morphology and roughness are studied based on the theoretical model. The verification milling experiment was carried out on the hardened steel Cr12MoV workpiece. The main results and conclusions are summarized as follows:
- The simulated surface texture and roughness are in good agreement with the experimental measurements, which verifies the correctness of the surface morphology prediction model. The reasons for the difference in surface morphology between the simulated and experimental are as follows: (1) the cut-in phase angle is random in the experiment process; (2) the surface topography model does not take into account the tool deformation; (3) the tool wear is assumed to be the same in the wear area in the simulation process.
- The prediction model of surface topography considering cut-in impact has higher accuracy, and the error of surface roughness is reduced from 12.09% to 9.52%.
- With the increase of tool wear, the texture structure of the workpiece surface changes and the maximum scallop height on the surface increases accordingly. Meanwhile, the texture asperities grow and the grooves deepen with tool wear in the experiments. The worn tool causes scratches on the machined surface, which leads to deterioration of the machined surface.
- The surface roughness increases with the increase of tool wear. However, the growth rate of surface roughness has a nonlinear relationship with tool wear. When the tool wear is less than 0.164 mm, the surface roughness simulation results are in good agreement with the experimental results. When the tool wear is 0.21 mm, the maximum error between the surface roughness simulation and the experimental measurement is 21.9%. The reason is that the cutting edge near the tool tip induces micro-chipping.
Author Contributions
The idea of this project was conceived by H.G., C.Y. and H.G. consulted to relevant high-level papers on aspects of surface topography, and wrote this project. X.L. and Y.N. reviewed this project and proposed constructive guidance to make the article more complete.
Funding
This project is supported by the National Natural Science Foundation of China (NSFC) (No. 51575147) and the Projects of International Cooperation and Exchanges NSFC (No. 51720105009), and the Science Funds for the Young Innovative Talents of HUST (No.201507).
Conflicts of Interest
The authors declare no conflict of interest.
References
- Yue, C.; Gao, H.; Liu, X.; Liang, S. Part Functionality Alterations Induced by Changes of Surface Integrity in Metal Milling Process: A Review. Appl. Sci. 2018, 8, 2550. [Google Scholar] [CrossRef]
- M’Saoubi, R.; Outeiro, J.C.; Chandrasekaran, H.; Dillon, O.W., Jr.; Jawahir, I.S. A review of surface integrity in machining and its impact on functional performance and life of machined products. Int. J. Sustain. Manuf. 2008, 1, 203–236. [Google Scholar] [CrossRef]
- Liu, X.; Gao, H.; Yue, C.; Li, R.; Jiang, N.; Yang, L. Investigation of the milling stability based on modified variable cutting force coefficients. Int. J. Adv. Manuf. Technol. 2018, 96, 2991–3002. [Google Scholar] [CrossRef]
- Yue, C.; Liu, X.; Ding, Y.; Liang, S.Y. Off-line error compensation in corner milling process. Proc. Inst. Mech. Eng. Part B J. Eng. Manuf. 2018, 232, 1172–1181. [Google Scholar] [CrossRef]
- Yue, C.; Gao, H.; Liu, X.; Liang, S.Y. A review of chatter vibration research in milling. Chin. J. Aeronaut. 2019, in press. [Google Scholar] [CrossRef]
- Mizugaki, Y.; Hao, M.; Kikkawa, K.; Nakagawa, T. Geometric generating mechanism of machined surface by ball-nosed end milling. CIRP Ann. 2001, 50, 69–72. [Google Scholar] [CrossRef]
- Mizugaki, Y.; Kikkawa, K.; Terai, H.; Hao, M.; Sata, T. Theoretical estimation of machined surface profile based on cutting edge movement and tool orientation in ball-nosed end milling. CIRP Ann. 2003, 52, 49–52. [Google Scholar] [CrossRef]
- Bouzakis, K.D.; Aichouh, P.; Efstathiou, K. Determination of the chip geometry, cutting force and roughness in free form surfaces finishing milling, with ball end tools. Int. J. Mach. Tool Manuf. 2003, 43, 499–514. [Google Scholar] [CrossRef]
- Jung, T.S.; Yang, M.Y.; Lee, K.J. A new approach to analysing machined surfaces by ball-end milling, part I. Int. J. Adv. Manuf. Technol. 2005, 25, 833–840. [Google Scholar] [CrossRef]
- Jung, T.S.; Yang, M.Y.; Lee, K.J. A new approach to analysing machined surfaces by ball-end milling, part II. Int. J. Adv. Manuf. Technol. 2005, 25, 841–849. [Google Scholar] [CrossRef]
- Liu, X.; Soshi, M.; Sahasrabudhe, A.; Yamazaki, K.; Mori, M. A geometrical simulation system of ball end finish milling process and its application for the prediction of surface micro features. J. Manuf. Sci. Eng. 2006, 128, 74–85. [Google Scholar] [CrossRef]
- Buj-Corral, I.; Vivancos-Calvet, J.; Domínguez-Fernández, A. Surface topography in ball-end milling processes as a function of feed per tooth and radial depth of cut. Int. J. Mach. Tool Manuf. 2012, 53, 151–159. [Google Scholar] [CrossRef]
- Xu, J.; Zhang, H.; Sun, Y. Swept surface-based approach to simulating surface topography in ball-end CNC milling. Int. J. Adv. Manuf. Technol. 2017, 98, 1–12. [Google Scholar] [CrossRef]
- Lazoglu, I. 3D surface topography analysis in 5-axis ball-end milling. CIRP Ann. 2017, 66, 133–136. [Google Scholar]
- Bo, L.; Yanlong, C.; Wenhua, C.; Jun, P. Geometry simulation and evaluation of the surface topography in five-axis ball-end milling. Int. J. Adv. Manuf. Technol. 2017, 93, 1651–1667. [Google Scholar] [CrossRef]
- Arizmendi, M.; Campa, F.J.; Fernández, J.; de Lacalle, L.L.; Gil, A.; Bilbao, E.; Veiga, F.; Lamikiz, A. Model for surface topography prediction in peripheral milling considering tool vibration. CIRP Ann. 2009, 58, 93–96. [Google Scholar] [CrossRef]
- Jiang, H.; Long, X.; Meng, G. Study of the correlation between surface generation and cutting vibrations in peripheral milling. J. Mater. Process. Technol. 2008, 208, 229–238. [Google Scholar] [CrossRef]
- Costes, J.P.; Moreau, V. Surface roughness prediction in milling based on tool displacements. J. Manuf. Process. 2011, 13, 133–140. [Google Scholar] [CrossRef]
- Peng, Z.; Jiao, L.; Yan, P.; Yuan, M.; Gao, S.; Yi, J.; Wang, X. Simulation and experimental study on 3D surface topography in micro-ball-end milling. Int. J. Adv. Manuf. Technol. 2018, 96, 1943–1958. [Google Scholar] [CrossRef]
- Chen, W.; Xie, W.; Huo, D.; Yang, K. A novel 3D surface generation model for micro milling based on homogeneous matrix transformation and dynamic regenerative effect. Int. J. Mech. Sci. 2018, 144, 146–157. [Google Scholar] [CrossRef]
- Lu, X.; Hu, X.; Jia, Z.; Liu, M.; Gao, S.; Qu, C.; Liang, S.Y. Model for the prediction of 3D surface topography and surface roughness in micro-milling Inconel 718. Int. J. Adv. Manuf. Technol. 2018, 94, 2043–2056. [Google Scholar] [CrossRef]
- Yang, L.; Wu, S.; Liu, X.; Liu, Z.; Zhu, M.; Li, Z. The effect of characteristics of free-form surface on the machined surface topography in milling of panel mold. Int. J. Adv. Manuf. Technol. 2018, 98, 151–163. [Google Scholar] [CrossRef]
- Zhang, C.; Guo, S.; Zhang, H.; Zhou, L. Modeling and predicting for surface topography considering tool wear in milling process. Int. J. Adv. Manuf. Technol. 2013, 68, 2849–2860. [Google Scholar] [CrossRef]
- Zhang, C.; Zhang, H.; Li, Y.; Zhou, L. Modeling and on-line simulation of surface topography considering tool wear in multi-axis milling process. Int. J. Adv. Manuf. Technol. 2015, 77, 735–749. [Google Scholar] [CrossRef]
- Omar, O.E.; El-Wardany, T.; Ng, E.; Elbestawi, M.A. An improved cutting force and surface topography prediction model in end milling. Int. J. Mach. Tool Manuf. 2007, 47, 1263–1275. [Google Scholar] [CrossRef]
- Liu, C.; Chen, B. A global review dynamic research of flexible multibody for the impact systems. Adv. Mech. 2000, 1, 7–14. [Google Scholar]
- Liu, X.; Gao, H.; Yue, C.; Jiang, N. Research on cutting force modeling and surface quality in the transition area of the mosaic. J. Vib. Meas. Diagn. 2018, 38, 429–437. [Google Scholar]


© 2019 by the authors. Licensee MDPI, Basel, Switzerland. This article is an open access article distributed under the terms and conditions of the Creative Commons Attribution (CC BY) license (http://creativecommons.org/licenses/by/4.0/).