Article

A Hybrid Nanoplatform of Graphene Oxide/Nanogold for Plasmonic Sensing and Cellular Applications at the Nanobiointerface

by
Lorena Maria Cucci
1,
Irina Naletova
2,
Giuseppe Consiglio
2 and
Cristina Satriano
1,*
1
Laboratory of Hybrid NanoBioInterfaces (NHIL), Department of Chemical Sciences, University of Catania, viale Andrea Doria 6, 95125 Catania, Italy
2
Department of Chemical Sciences, University of Catania, viale Andrea Doria 6, 95125 Catania, Italy
*
Author to whom correspondence should be addressed.
Appl. Sci. 2019, 9(4), 676; https://doi.org/10.3390/app9040676
Submission received: 31 December 2018 / Revised: 29 January 2019 / Accepted: 12 February 2019 / Published: 16 February 2019
(This article belongs to the Special Issue Nano-Biointerface for Biosensing)

Abstract

:

Featured Application

A GO/AuNP nanoassembly for theranostic applications at the biointerface.

Abstract

In this study, nanocomposites of spherical gold nanoparticles (AuNPs) and graphene oxide (GO) nanosheets were fabricated by a simple one-step reduction method. The characterisation by UV-visible spectroscopy of the plasmonic sensing properties pointed out to a strong interaction between graphene and metal nanoparticles in the hybrid GO-AuNP, as confirmed by nuclear magnetic resonance. Moreover, atomic force microscopy analyses demonstrated that the gold nanoparticles were mostly confined to the basal planes of the GO sheets. The response of the nanoassemblies at the biointerface with human neuroblastoma SH-SY5Y cell line was investigated in terms of nanotoxicity as well as of total and mitochondrial reactive oxygen species production. Confocal microscopy imaging of cellular internalization highlighted the promising potentialities of GO-AuNP nanoplatforms for theranostic (i.e., sensing/imaging + therapy) applications.

1. Introduction

Graphene, made up of sp2 carbon monoatomic layers hexagonally arranged into honeycomb lattice structure nanosheets [1], has emerged as an ideal material for use in multifunctional fast sensors, thanks to its electrical and thermal conductivity, the high tensile strength, the low charge transfer resistance, and the broad electrochemical window in 0.1 M phosphate saline buffer [2]. Recently, a great interest for biosensing applications has been focused onto its analogues, graphene oxide (GO), and reduced-graphene oxide (rGO), due to the presence of defective oxygen-bound sp3 carbon atoms, which lead to a strong hydrophilicity and contribute to the formation of highly stable colloidal dispersions in aqueous solvents [3]. Such hydrophilic groups on the GO surface include carboxylic (–COOH) and hydroxyl (C–OH) groups, typically located at the edges of the sheets, while carbonyl (C=O) and epoxide (C–O–C) groups evolve at the basal plane of the graphene sheets creating the in-plane defects and disorder [4].
Graphene oxide can be functionalized through the addition of functional groups which affect its reactivity and converts the nanosheets into versatile nanoplatforms both for sensing, e.g., GO probes for cell imaging [5], and for drug delivery [6], thus opening new horizons in the fields of nanomedicine [7].
The hydrophilic groups onto the GO offer high versatility for the nanosheets derivatisation [8,9], to immobilise enzymes for bioelectrodes and biofuel cells [10], drugs for anticancer therapies [6,11], but also polymers such as chitosan, polyethylene glycol, poly-l-lysine, polyacrylate, to enhance the biocompatibility, the biodegradability, the solubility in aqueous medium, the responsiveness to physical (temperature) and chemical (pH) stimuli, and the non-toxicity of the graphene [12,13,14,15].
Noteworthy, the chemical functionalization of GO can prevent concomitantly the uncontrolled aggregation of the nanosheets caused by Van der Waals and π-π stacking interactions [16].
Graphene can also be used in conjunction with metallic nanostructures to enhance biosensor performance with localised surface plasmon properties as well as with a larger sensitivity [17,18].
To this respect, a promising approach is integrating graphene layers with conventional plasmonic nanostructures, such as gold nanoparticles (AuNPs) [19,20], to obtain hybrid GO-AuNP composites exhibiting the dual advantage of increased interlayer distance between the single nanosheets (which minimizes the aggregation process) and additional intrinsic optical and biological properties of nanogold [21].
Indeed, AuNPs plasmonic properties allow for their extensive use in biomedical imaging and biodetection [22] in cytobiology and biochemistry [23], as well as photothermal and anti-angiogenic applications [24,25].
Along with the applications of hybrid GO-AuNP nanocomposites in theranostics (i.e., sensing/imaging + therapy), while AuNPs are considered to be relatively safe, and their cytotoxicity can be easily controlled by the dose, the capping and stabilizer agents used [24,26], contrasting results were obtained from different authors for GO cytotoxicity. For example, GO were found non-toxic in human breast adenocarcinoma cell line (MCF-7 line) and kidney epithelial (Vero line) cells [27] but in normal human lung (BEAS-2B line) and in human liver cancer (HepG2 line) cells, either GO or rGO reduced cell adhesion, induced cell apoptosis, and entered lysosomes, mitochondria, cell nuclei and endoplasm, thus inducing cell morphology modification, destruction of the membrane integrity and induction of DNA damage [28,29].
Mitochondria are organelles crucial to maintain cellular energy balance, indeed are responsible for ATP synthesis and are implicated into the calcium signaling modulation, being essential for the cell life [30]. Graphene oxide and graphene-related nanomaterials can interact with mitochondria, modifying their morphology and function [31], leading to cytotoxic effects by increasing intracellular ROS, through the depletion of the mitochondrial membrane potential [32]. In general, the cytotoxic effects of graphene oxide strongly depend on the physico-chemical characteristics of the dispersion, such as the concentration and lateral size of the nanosheets, the amount of oxygen-containing defective sp3 carbons, the ionic strength of the solvent, and the protein corona formed in biological environment [33,34].
In this work, we synthesised hybrid GO–AuNP nanocomposites by a one-step chemical reduction method with the use of the graphene aqueous dispersions as solvent. The plasmonic sensing capabilities of the hybrid nanostructures were scrutinised by UV-visible spectroscopy. Nuclear magnetic resonance (NMR) spectroscopy and atomic force microscopy (AFM) were performed to investigate the actual binding between the gold nanoparticles to the GO nanosheets and the topography of the hybrid nanoplatforms, respectively.
Finally, we performed in vitro cellular experiments on human neuroblastoma cells (SH-SY5Y line) to assess the nanotoxicity of the hybrids GO-AuNP in comparison with the bare AuNPs and GO sheets and their effect on mitochondrial dysfunctions, by measuring the mitochondrial O2•− production. Intracellular imaging by laser scanning confocal microscopy (LSM) was carried out to assess the potential application of these hybrid nanocomposites as theranostic platform.

2. Materials and Methods

2.1. Chemicals

Gold(III) chloride trihydrate and trisodium citrate dihydrate were purchased from Sigma-Aldrich. Ultrapure Milli-Q water was used (18.2 mΩ·cm at 25 °C, Millipore). Graphene oxide (chemically exfoliated) water dispersion (0.4 wt.% concentration) was purchased from Graphenea Inc., US. Glassware was firstly cleaned with aqua regia (HCl:HNO3, 1:3 volume ratio) and then rinsed with water before starting. Dulbecco’s modified eagle medium (DMEM)-F12, streptomycin, L-glutamine, fetal bovine serum (FBS), DMSO (dimethyl sulfoxide), BSA (bovine serum albumin), and 3-(4,5-dimethylthiazol-2-yl)-2,5-diphenyltetrazolium bromide, 2′,7′-Dichlorofluorescein were purchased from Sigma-Aldrich (St. Louis, MO, USA). MitoSOX™ Red Mitochondrial Superoxide Indicator was purchased from ThermoFisher Scientific.

2.2. Synthesis of Gold Nanoparticles

Gold nanoparticles were synthesized by a modified Turkevich chemical reduction method [35]. Briefly, 1 mM gold(III) chloride dihydrate was dissolved in ultrapure Millipore water and heated to boiling point on a hot plate while stirred. Therefore, 3.1 mM solution of trisodium citrate dihydrate was quickly added and, as soon as the solution turned from yellow to deep red, AuNPs were formed and the beaker was removed from the hot plate. The hydrodynamic size average value for these citrate-capped nanoparticles, was 30 ± 3 nm, as measured by dynamic light scattering. The actual concentration of synthesized AuNPs was typically of 1.6 × 10⁻⁸ M, as estimated by UV–visible spectra, according to the molar extinction coefficient, ε = 1.89 × 10⁸ M−1 cm−1, calculated by Equation (1):
ln ε = k ln D + a
where ε is the extinction coefficient, in M−1cm−1, D is the core diameter of the nanoparticles, and k = 3.32111, a = 10.80505 [36]. For monodisperse spherical AuNP with a diameter of 12 nm, the average number of gold atoms (N) for each nanoparticle was calculated according to Equation (2):
N = (πρD3)/(6M)
where ρ and M are the density (19.3 g/cm3) and the atomic weight (197 g/mol) of gold, respectively [36]. The gold dispersions prepared by the procedure described above typically resulted in a concentration of 1.6 × 10⁻⁸ M, corresponding to 1.8 × 10⁸ gold nanoparticles/mL.
The resultant nanosystems were washed with Millipore water through two centrifugation steps (15 min at 8000 r.p.m, RT), in order to remove the excess of sodium citrate reactant.

2.3. Synthesis of the Hybrid GO-AuNP Nanocomposites

The GO aqueous dispersion was diluted in ultrapure Millipore water to reach a final concentration of 0.4 mg/mL and ultra-sonicated with a titanium cup-horn sonicator (Hielscher UP200Ht) at 200 W and 24 kHz. GO nanosheets of 200-nm average lateral size were collected from the supernatants after a centrifugation step (20 min at 13,000 r.p.m, RT) (Eppendorf Centrifuge 5424) [37]. The concentration of these GO dispersions typically was around 0.3 mg/mL, as estimated by UV–visible spectroscopy [38]. For the synthesis of hybrid GO-AuNP nanosystems, 20 mL of gold(III) chloride di-hydrate solution (1 mM) in ultrapure Millipore water was brought to boiling point under vigorous stirring on a magnetic hot-plate. 2 mL of GO dispersion (0.3 mg/mL) in trisodium citrate dihydrate solution (1% w/v) was then quickly added to the auric solution until the wine-red colour was observed. To remove the excess of reactants, the synthetized hybrid systems were washed with ultrapure Millipore water twice by centrifugation (15 min at 8000 r.p.m at RT).

2.4. UV–Visible (UV-Vis) Spectroscopy

UV-vis spectra of the aqueous dispersions were recorded using JASCO spectrometer V-650 and quartz cuvettes with an optical path length of 1 cm.

2.5. Nuclear Magnetic Resonance (NMR) Spectroscopy

1H NMR experiments for citrate, GO-citrate, AuNPs and hybrid GO-AuNP systems were executed on a Varian Unity S 500 (499.88 MHz for 1H) spectrometer at 300 K. For all the NMR spectra PRESAT solvent suppression pulse sequence was performed. The experiments were carried out by using 3.5 × 10⁻⁸ M of gold nanoparticles, in both the bare and the hybrid GO-AuNP systems and 0.025 mg/mL of GO dispersion in a sodium citrate solution (3.09 × 10⁻³ M). The H2O/D2O ratio was of 1:1.

2.6. Atomic Force Microscopy (AFM)

To register AFM images a drop of the samples was put on freshly cleaved muscovite mica (Ted Pella, Inc.). After 5 min of incubation at room temperature, samples were washed with 1 mL of ultrapure water, dried under a gentle nitrogen stream and immediately imaged. A Cypher AFM instrument (Asylum Research, Oxford Instruments, Santa Barbara, CA, USA) operating in tapping AC-mode was used. Tetrahedral tips made of silicon and mounted on rectangular 30-μm long cantilevers were purchased from Olympus (AT240TS, Oxford Instruments). The probes had nominal spring constants of 2 N/m and driving frequencies of 70 kHz. Topographic scans from 1 to 10 μm2 of size, were recorded. Section analysis and particle size were measured using a free tool in the MFP-3DTM offline section analysis software.

2.7. Cell Cultures

SH-SY5Y neuroblastoma cells were cultured in DMEM-F12 supplemented with 10% FBS, 2 mM glutamine, 100 U penicillin/0.1 mg/mL streptomycin. Cell culture was grown in a humidified atmosphere of air/CO2 (95:5) at 37 °C in the incubator (Heraeus Hera Cell 150).

2.8. Cytotoxicity Assays

The cytotoxicity of GO, AuNPs and hybrid GO-AuNP systems was tested on neuroblastoma SH-SY5Y cell culture at 60–70% of confluence. Cells were treated with the compounds, prepared as stock solutions in ultrapure water Milli-Q, for 24 h in DMEM-F12 medium supplemented with 1% fetal bovine serum (FBS), 2 mM L-glutamine and 100 μg/mL streptomycin. Cell viability was determined at 37 °C, by the 3-(4,5-dimethylthiazol-2-yl)-2,5-diphenyltetrazolium bromide (MTT) method [39]. Reaction was stopped with DMSO and the absorbance was measured at 569 nm by using Varioscan spectrophotometer. Results are presented as the means ± SEM, the experiments were performed 3–4 times in triplicate.

2.9. Total and Mitochondrial ROS Production

Neuroblastoma cells were treated with GO, AuNPs and hybrid GO-AuNP systems for 24 h. Then, cells were stained with 2′,7′-dichlorofluorescein (DCF) (total ROS) or MitoSOX (mitochondrial O2•−) and analyzed by Varioscan spectrophotometer (ex = 493 nm, em = 523 nm or ex = 510, em = 580, respectively). Results are represented as the increase in DCF or MitoSOX signals with respect to controls. Hoechst 33342 solution (ex = 361 nm, em = 497 nm) was used for normalizing fluorescence intensities of DCF or MitoSOX to the actual cell number for each well. Data are presented as the means ± SEM of eight replicas.

2.10. Confocal Microscopy (LSM)

SH-SY5Y cells were seeded at a density of 50,000 cells per dish in glass bottom WillCo-dish (22 mm glass diameter, purchased from Willco Wells, B.V.), with complete medium added with 10% FBS until cellular adhesion was attained (typically 24–48 h). Before treatments, cells were rinsed and then incubated for 2 h with GO, AuNPs and hybrid GO-AuNP systems in DMEM complete medium added with 1% FBS. After the incubation, cells were washed with phosphate buffer saline solution (10 mM PBS, 37 °C, pH = 7.4), stained with nuclear dye Hoechst33342 and LysoTracker Deep Red, then fixed with high purity 2% paraformaldehyde in PBS (pH = 7.3).
Confocal microscopy imaging on SH-SY5Y cells were performed with Olympus FV1000 confocal laser scanning microscope (LSM), equipped with diode UV (405 nm, 50 mW), multiline Argon (457 nm, 488 nm, 515 nm, total 30 mW) and HeNe (green and red) (543 nm, 1 mW; 633 nm, 1 mW) lasers. An oil immersion objective (60xO PLAPO) and spectral filtering system were used. The image analysis was carried out using Huygens Essential software (by Scientific Volume Imaging B.V., The Netherlands). The statistical analysis was performed with a one-way ANOVA.

3. Results and Discussion

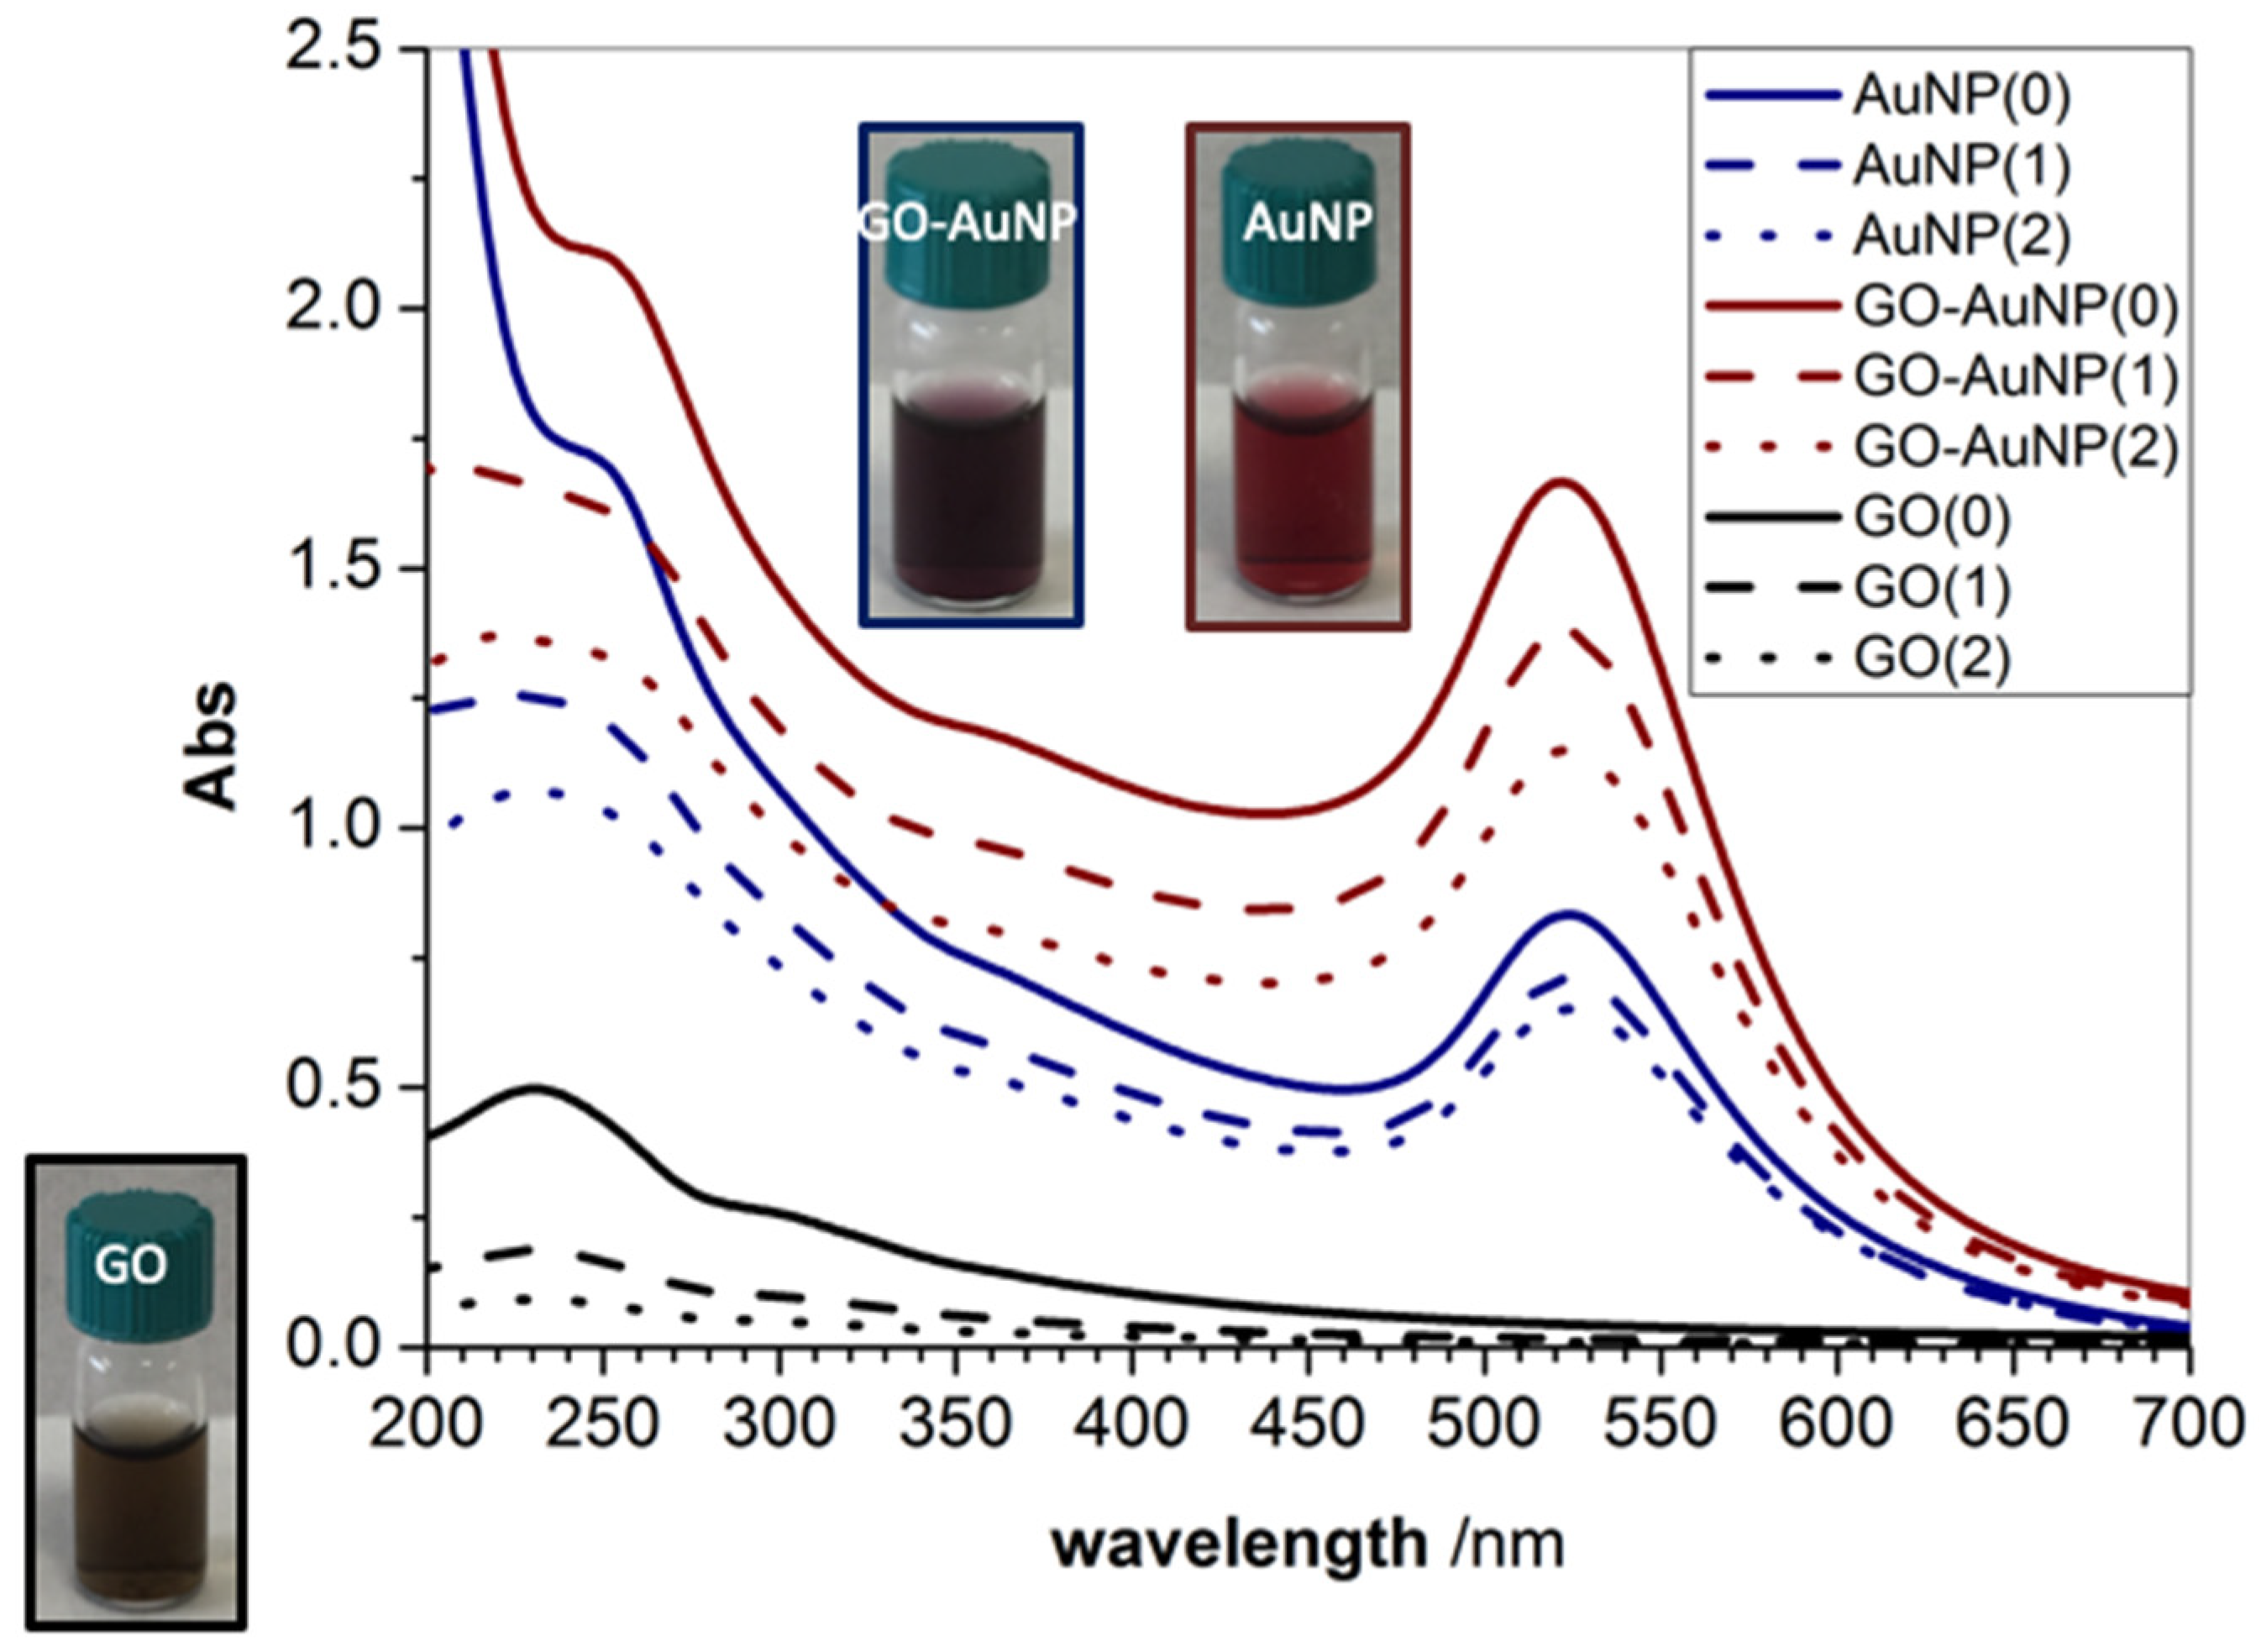
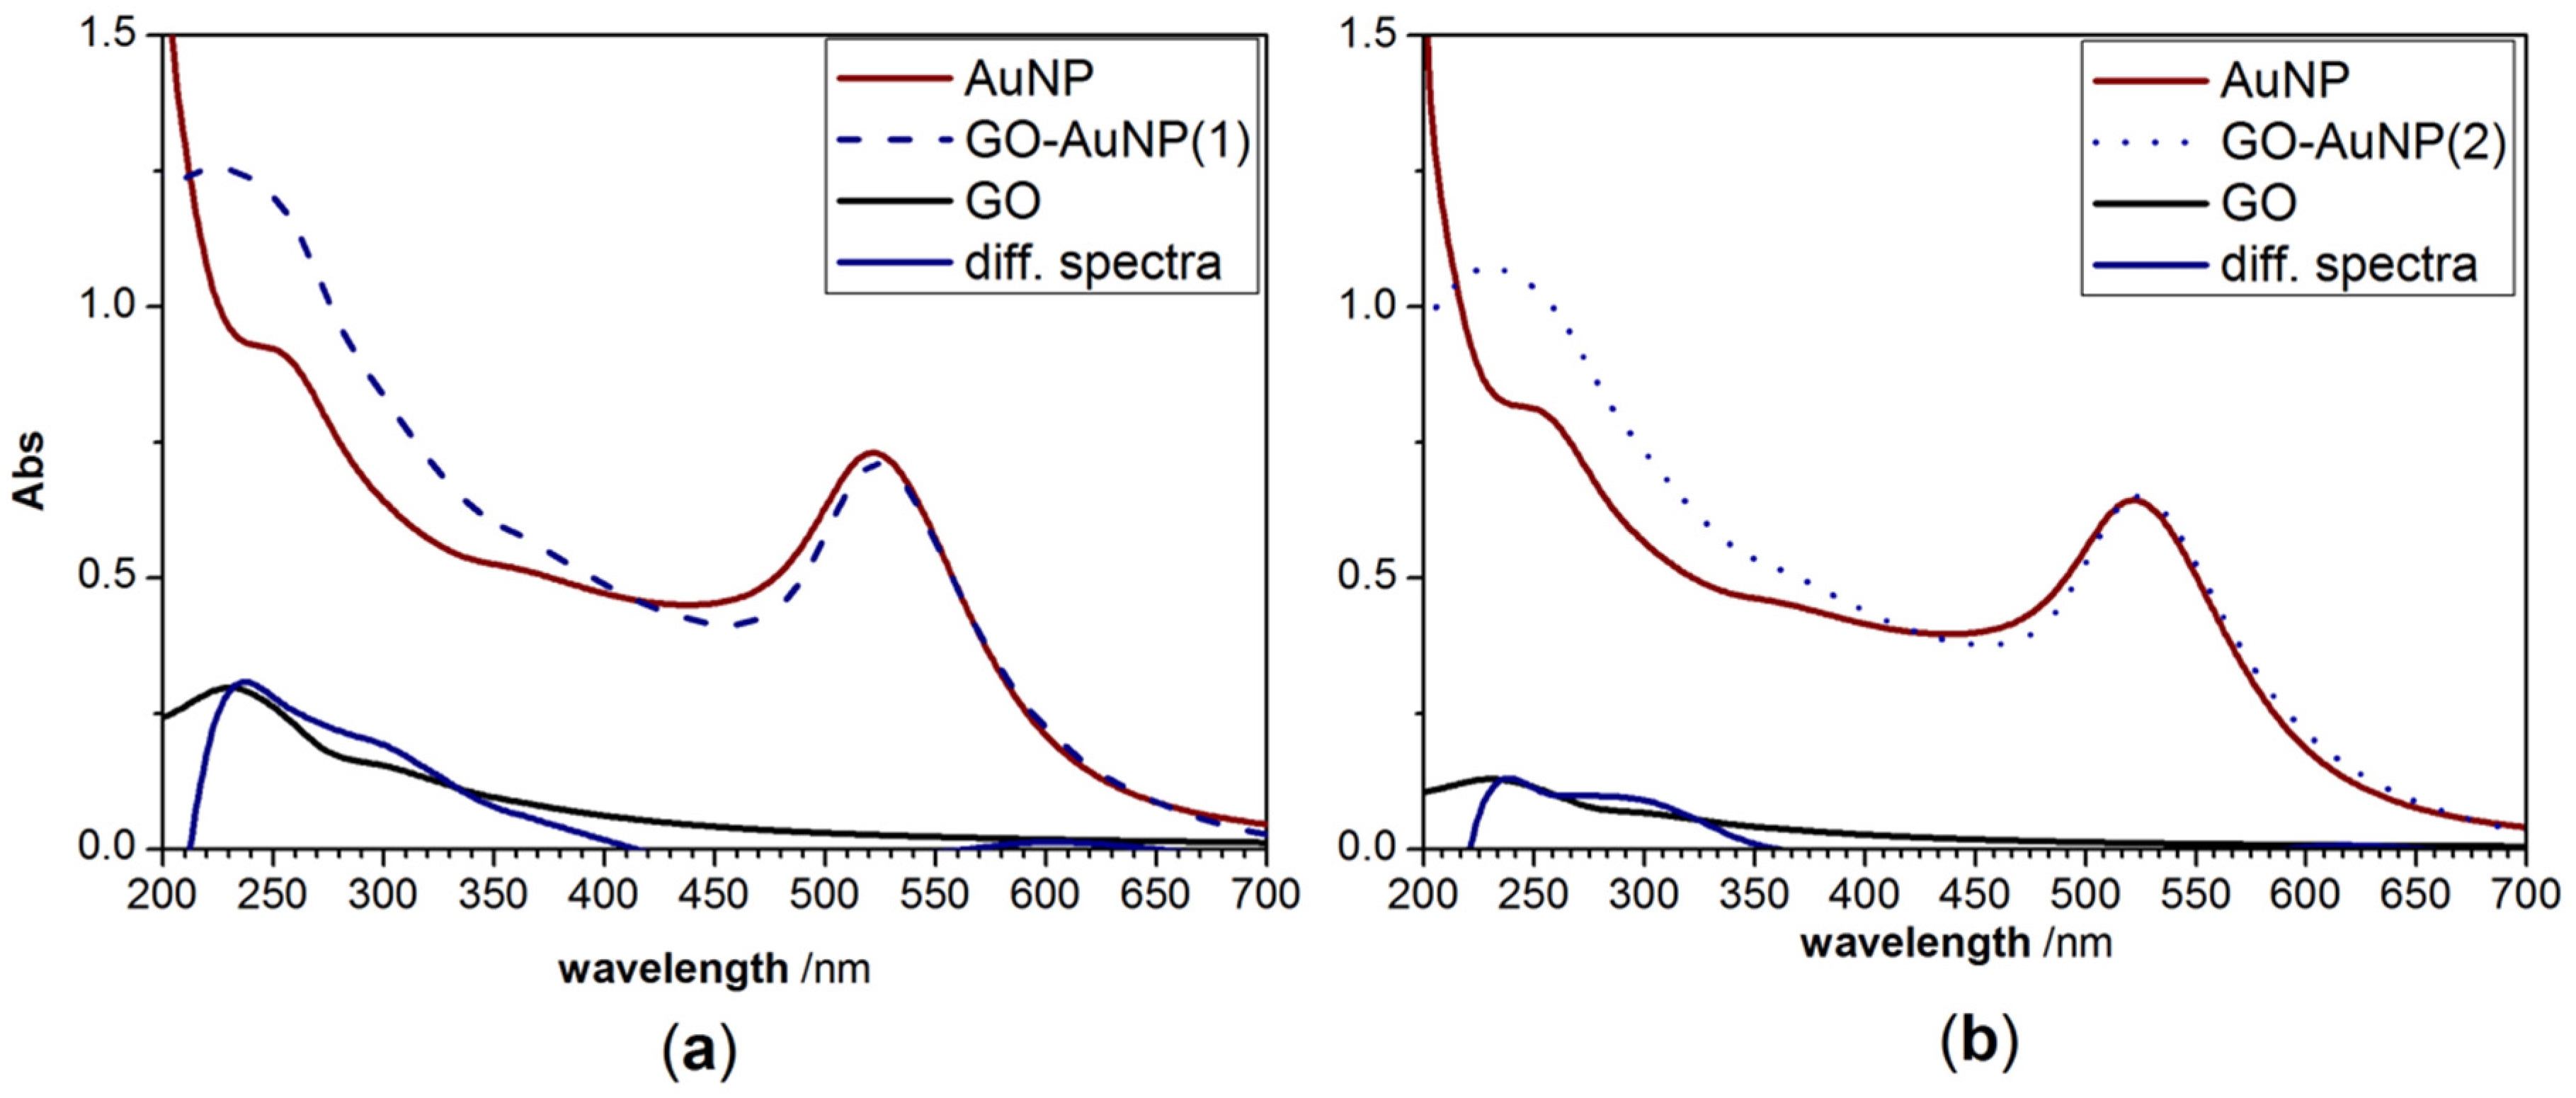
3.1. Plasmonic Sensing Capabilities and Physicochemical Characterisation of the Hybrid GO-AuNP Nanocomposites

The plasmon resonance properties of gold nanoparticles are very sensitive to the local environment of the nanostructure, owing to the role of the dielectric constant of the surrounding medium as well as to charge transfer effects in core-shell metal nanostructures, which results in a redistribution of electron populations in the gold nanoparticles [40]. For instance, an increase in the refractive index of the embedding medium or in the thickness of a shell leads to a red shift in the absorption band [41]. Such a shift, measured as the change in the peak wavelength at the maximum absorbance in the UV-visible spectrum, gives quantitative information on the molecular layer adsorbed on the nanoparticle surface [42]. In conjunction with the shape sensitivity, such features of the plasmonic nanoplatforms offer multiple modalities for surface-based applications such as sensing, spectroscopy and imaging [43].
The optical properties of GO and AuNPs result in characteristic absorbance features, as displayed by UV-vis spectra (Figure 1). GO exhibits a maximum absorption peak centred at 230 nm, attributed to π–π* transitions of aromatic C=C bonds, and a shoulder peak at about 300 nm, attributed to n–π* transitions of C=O bonds, respectively [44]. AuNPs present a plasmon peak centred at around 520 nm of wavelength, distinctive of spherical gold nanoparticles with a diameter of around 12 nm [24,45]. The spectra of the hybrid GO-AuNPs show evidence of hyperchromic effect as well as a red-shift in the plasmonic band of about 3 nm, which is indicative of spatial distribution changes for the electric near field of the gold nanoparticles [24,46]. Such a finding points to an effective interaction between the gold nanoparticles and the GO nanosheets. Accordingly, an increase of the absorption related to π–π* transitions is visible around 230 nm. Figure 1 displays three spectra for each sample, corresponding to the as prepared as well as to the re-suspended pellets after the two rinsing steps by centrifugation, in order to remove the excess of reactants as well as to concentrate the nanomaterials in the aqueous dispersion.
The characteristic values of wavelength at the absorbance maximum and of full width at half maximum (FWHM) in Table 1 show that the washing steps do not cause significant aggregation of the nanosystems, since minimal red shift (only 1 nm) and band broadening (2–3 nm) are found.
The analysis of the GO-AuNP spectra subtracted by those of AuNP (Figure 2) emphasizes the occurrence of charge transfer processes at the interface between the GO nanosheets and the metal. In fact, for both pellet 1 (Figure 2a) and pellet 2 (Figure 2b) samples, the difference spectra show an increase of the shoulder at 300 nm, which can be indicative of the near contact between Au and the GO, which in turn affect the electronic conjugation between the GO sheets [6].
This finding is advantageous for the use of these hybrid nanocomposites as selective energy transfer probes in sensing applications at the biointerface. Indeed, the preferential binding of biomolecules to the gold [24,47] or the GO is expected to induce different changes in the optical response.
The relative concentrations of GO and AuNPs in the hybrid nanocomposites, estimated by considering the molar extinction coefficients respectively of ε = 37.81 ± 0.06 mL⋅mg−1cm−1 for GO and ε = 1.89⋅108 M−1cm−1 for AuNP, are shown in Table 2.
NMR spectrometry is often used to study the structure of organic compounds, as well as ligand molecules on the nanoparticles surface. NMR shifts are affected by the perturbation of the magnetic field at the nuclei from the surrounding environment and NMR studies on nanoparticle systems are focalized on the effect of the particles size on the NMR signals [48,49]. In view of that, to characterize and confirm the interaction between gold nanoparticles and GO sheets into the hybrid systems, 1H-NMR measurements were performed.
Figure 3 shows the acquired NMR spectra for: (a) hybrid GO-AuNP, (b) citrate-stabilized AuNPs at the concentration of 3.5 × 10⁻⁸ M; (c) GO (0.025 mg/mL in a 3.09 × 10⁻³ M sodium citrate solution in D2O); (d) 3.09 × 10⁻³ M sodium citrate solution in D2O. According to literature data, the AB quartet (J = 15 Hz) peaks, centred at 2.52 ppm, correspond to the citrate–CH2 signal [50]. The intensity of the signal considerably decreases for the hybrid GO-AuNP and the peaks are also broadened and unresolved. The line broadening in the NMR spectra of metal nanoparticles can be related to several factors, including the change in the binding modes of small molecules, dipole-dipole coupling, the increasing size of the NP core, the heterogeneity of the dispersion [51]. In our case, since the stability and homogeneity of the dispersions were tested by UV-visible spectroscopic analyses during aging times up to two weeks, the most likely picture that can be figured out is that the line broadening is due to hindered mobility of the citrate molecules interacting simultaneously with both the AuNPs and the GO nanosheets.
Conversely, the intensity and the peak-shape of the citrate signal, in the NMR spectrum of the bare AuNPs, is comparable to the signal obtained for the controls (i.e., GO alone and sodium citrate solution).
Together, these experimental findings suggest that most of the citrate molecules on the gold surface are replaced by GO sheets, thus confirming the effective strong interaction in the assembling of GO and AuNPs.
The atomic force microscopy height images of AuNP, GO, and GO-AuNP samples irreversibly adsorbed on mica (see experimental) confirm the actual formation of the hybrid nanocomposites (Figure 4). In fact, similar spherical AuNPs, about 20 nm in size, are found strongly associated to the GO single layers, which have dimensions of about 1 nm of thickness and roughly 300–400 nm of lateral size. Noteworthy, the preferential reaction of AuNPs with the GO in-plane defects [4] can be deduced by the allocation of the AuNPs, which are mostly at the basal plane of the GO sheets.

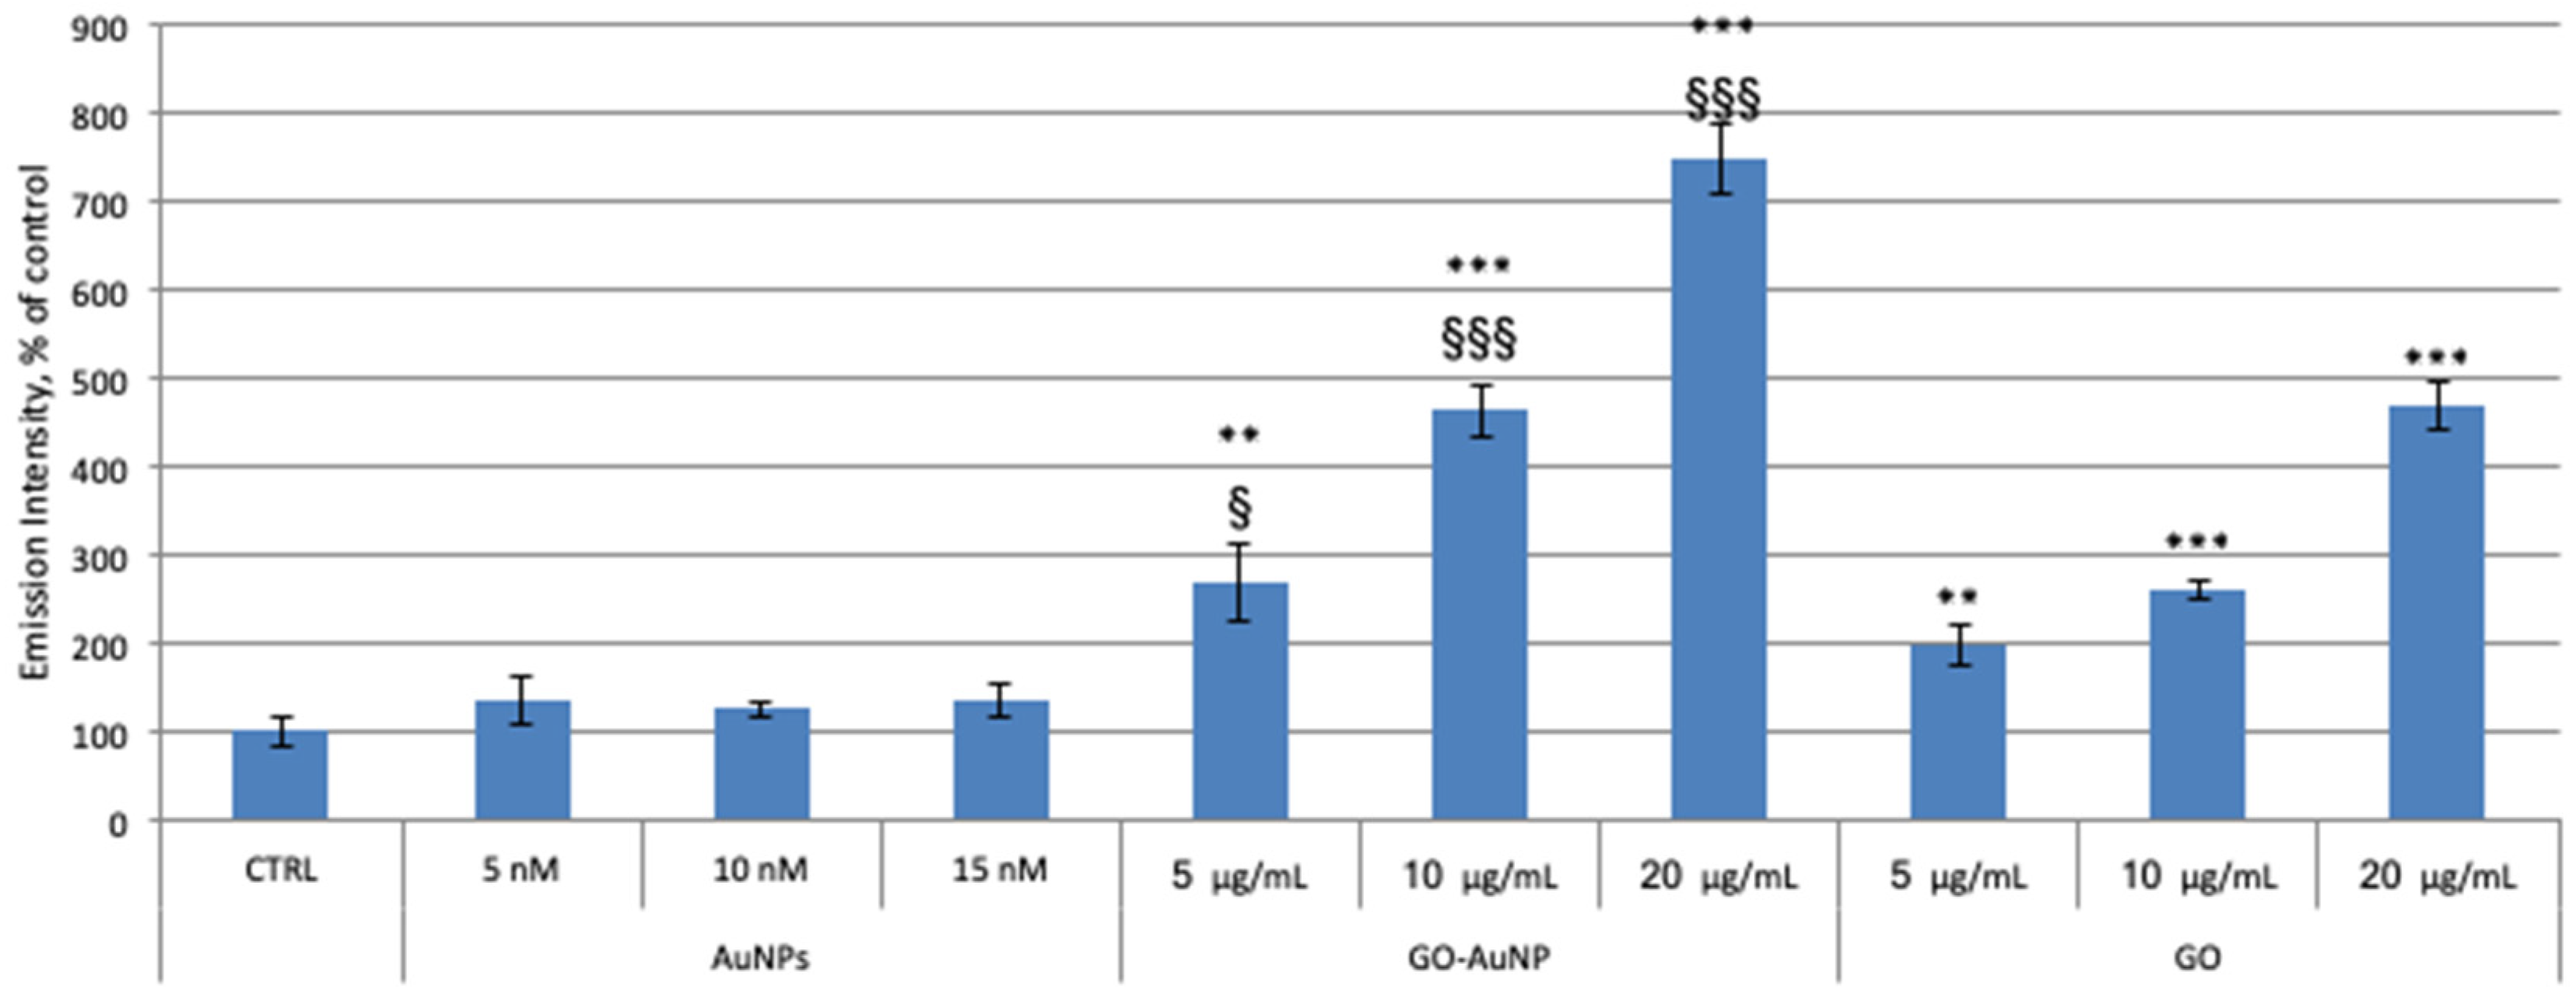
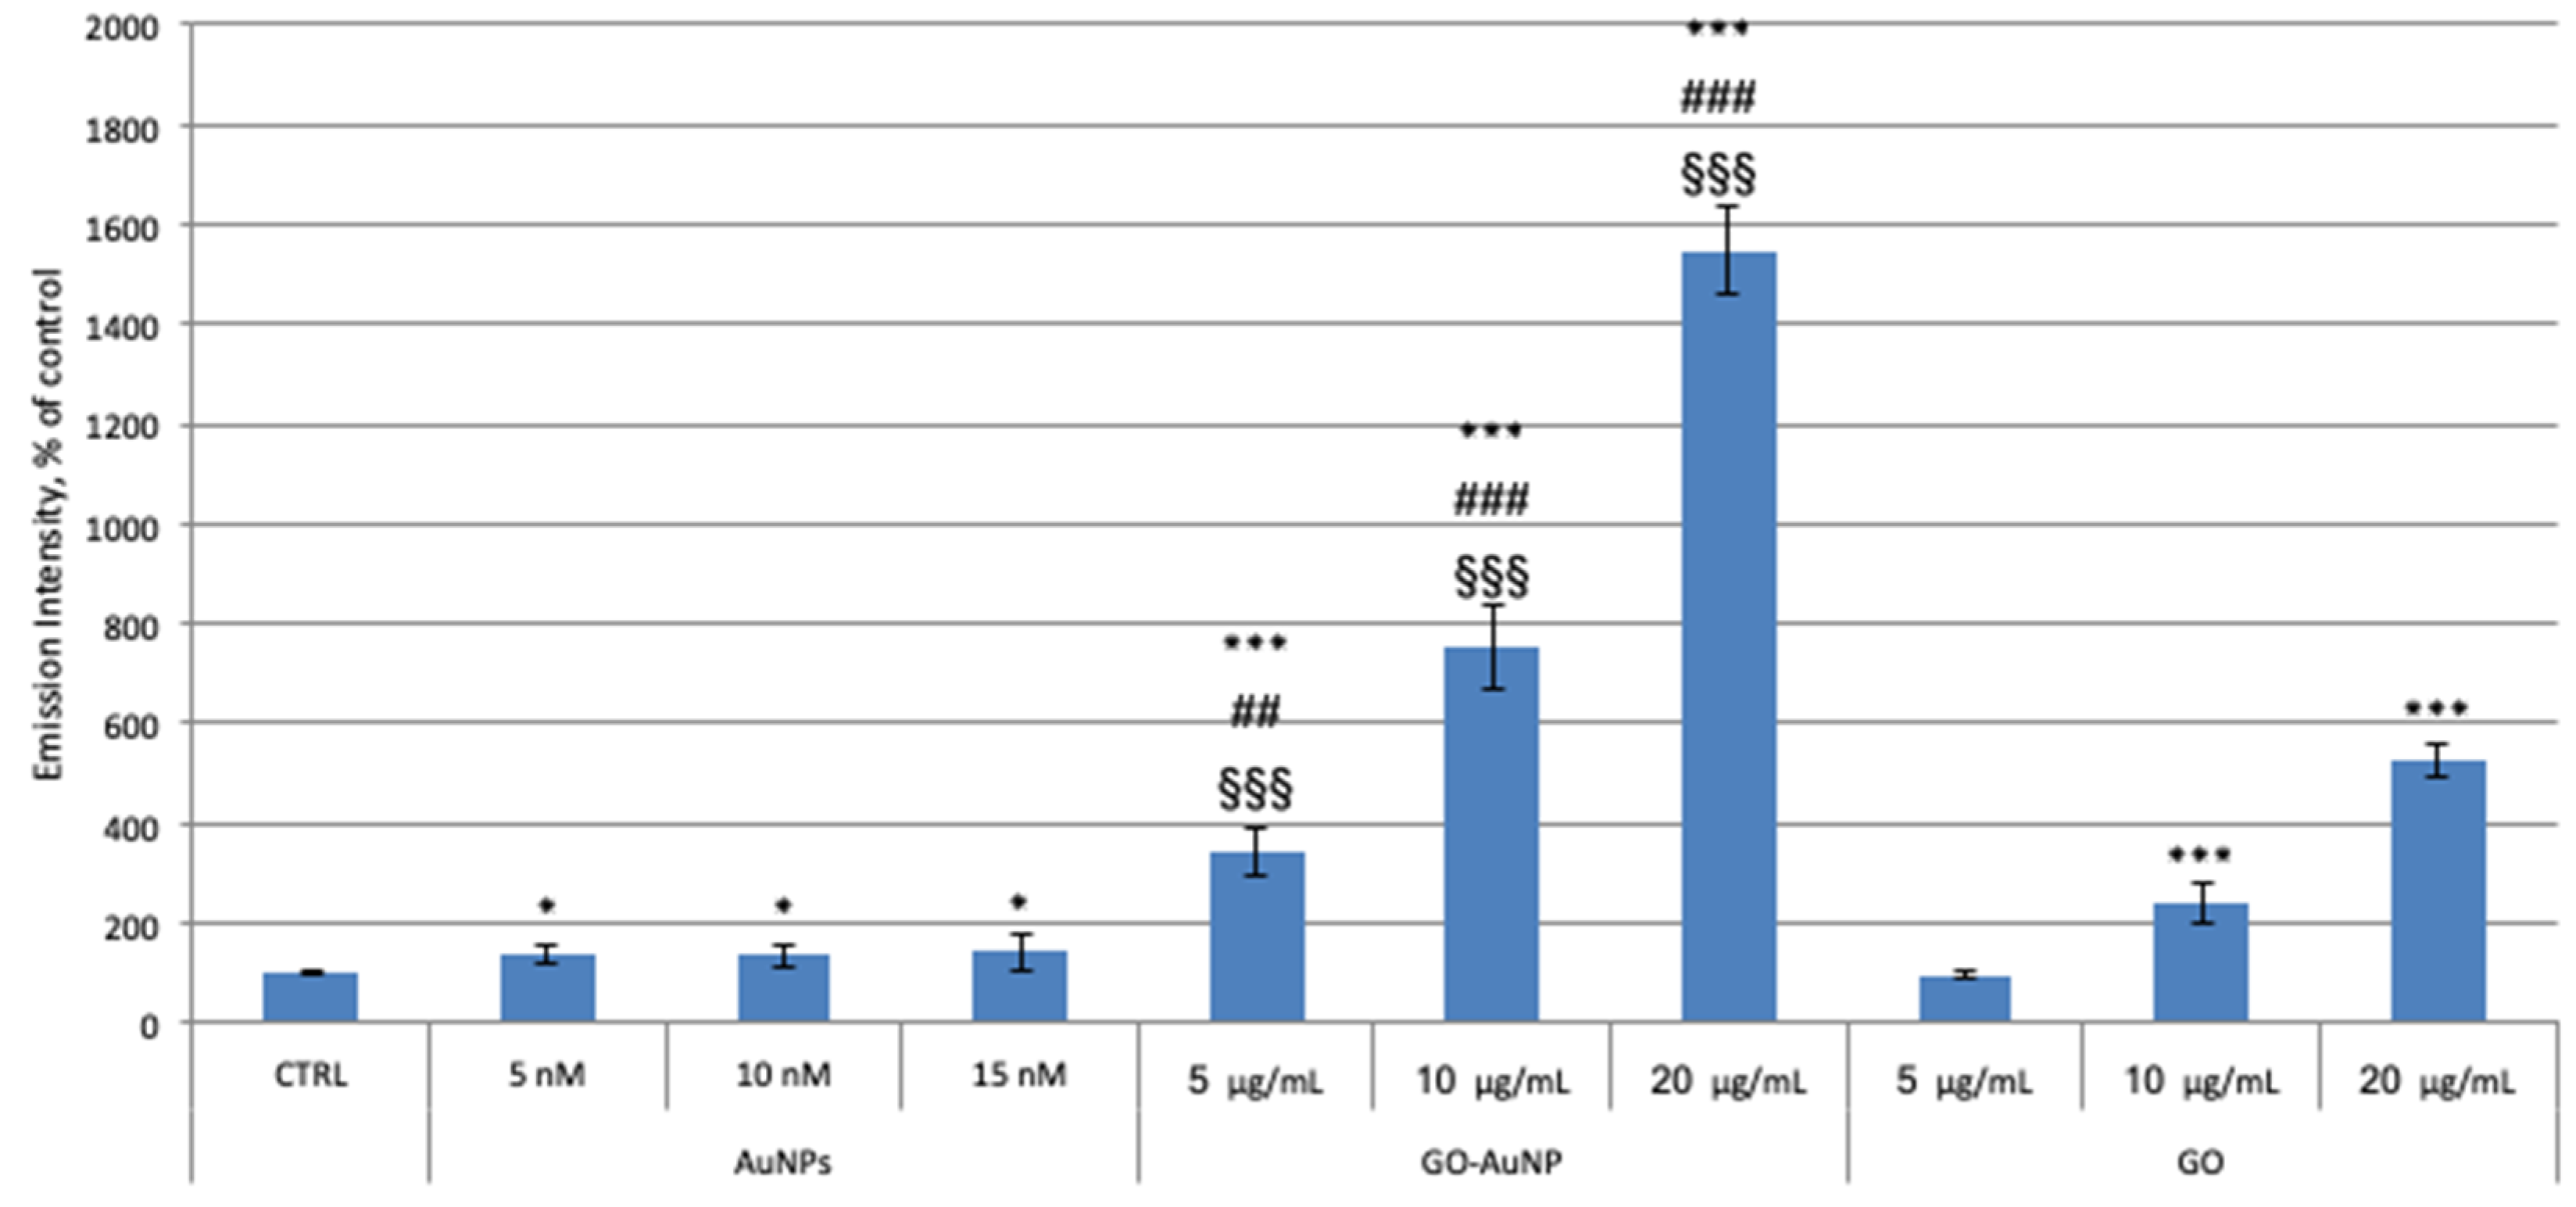
3.2. Interaction of GO-AuNP Hybrids with Neuroblastoma Cells: Cytotoxicity, Mitochondrial Dysfunction and ROS Generation

GO nanosheets at high concentrations (>80 μg/mL) have a cytotoxic effect in human cancer neuroblastoma cells (SH-SY5Y line) after long times of incubation (96 h) [6,52]. In the same cell line, we previously reported that 12 nm AuNPs at the concentrations of 5 and 10 nM did not show any cytotoxicity after 24 h of treatment [53]. In order to compare the cytotoxic effect of the hybrid GO-AuNP on undifferentiated neuroblastoma SH-SY5Y cell line with the bare AuNPs and GO sheets, cells were incubated for 24 h with the samples at different concentrations: 5, 10, 15 nM of AuNPs; 5, 10, 20 μg/mL of GO into the hybrids and 5, 10, 20 μg/mL of GO alone. Figure 5, in agreement with previously obtained data, shows that the synthetized gold nanosystems and GO alone, do not exhibit significant dose-dependent cytotoxicity at the tested condition. Differently, the hybrids GO-AuNP show a clearly dose-depended cytotoxicity on neuroblastoma cell line with a significant cell viability reduction after the treatment with 10 and 20 μg/mL of GO into the nanocomposites.
These results suggest that the cytotoxic effect in response to the treatment with GO-AuNP hybrids is due to a common action of both GO nanosheets and AuNPs in a single platform. Probably, the hybrids pass through the cell membrane more easily than GO alone or/and directly move into the cell organelles thus inducing cytotoxicity.
Physicochemical reactivity of nanomaterials leads to the formation of reactive oxygen species (ROS) and results in oxidative stress through the activation of oxidative enzymatic pathways [54]. Some studies demonstrate the cytotoxicity of graphene in neural pheochromocytoma-derived PC12, lung carcinoma A549 and breast cancer MCF-7 cells through the generation of ROS [55,56,57]. To analyse the molecular mechanisms involved in the toxicity of GO-AuNP we monitored oxidative stress by measuring the mitochondrial dysfunction and ROS levels through MitoSOX and DCF assays, respectively.
Neuroblastoma cells were treated for 24 h in dose-dependent manner with AuNPs, GO-AuNP and GO. The results in Figure 6 show an increase of the MitoSOX emission signal in a dose-dependent manner after the treatment both with GO and with GO-AuNP. On the other hand, the cells incubation with AuNPs does not show any significant difference between treated and control cells. Noteworthy, the exposition to the hybrids GO-AuNP more significantly increases ROS production respect to GO alone. These data confirm our theory that the presence of gold nanosystems supports the entrance of GO sheets into the cancer cells and strongly influence mitochondria.
The link between ROS overproduction and mitochondrial damage is well known [58]. Therefore, we analysed the levels of the overall ROS by DCF assay on neuroblastoma cells after the treatment with GO, GO-AuNP, and AuNPs for 24 h. As shown in Figure 7, the exposure to AuNPs slightly favours ROS generation (38–40 ± 16–18%). Total in cell ROS production after the incubation with GO shows a trend similar to that shown by the mitochondrial O2•− level.
These data are comparable with the results obtained with the MitoSOX assay, thus confirming that GO sheets cause mitochondrial dysfunctions, which lead to ROS species generation. The treatment with hybrids GO-AuNP increases significantly more the total ROS generation with respect to the AuNPs and GO alone.
Figure 8 shows the representative confocal microscopy images and optical imaging of the neuroblastoma cells after incubation for 2 h with the different samples. The staining of the nuclei (in blue) and lysosomes (in red) allows one to display the more effective cellular uptake of GO-AuNP nanocomposites in comparison with the bare GO nanosheets. In fact, in the bright field micrographs, are visible several dark features, corresponding to the aggregated nanomaterials, for the cells treated with AuNPs and GO-AuNP but not those incubated with GO. Moreover, an extra red fluorescence, due to the scattering by the AuNPs aggregates [59] is clearly visible intracellularly, even at the nuclear level, for the cells incubated with GO-AuNP. These findings are very promising for future research directions of these nanoplatforms in the theranostic field of nanomedicine.

4. Conclusions

In summary, hybrid GO–AuNP nanoassemblies were fabricated by a one-step chemical reduction of gold(III) chloride dihydrate with the use of a graphene aqueous dispersion as solvent. The optical properties characterisation of the hybrid nanostructures, scrutinised by UV-visible spectroscopy, highlighted not only the enhancement of the plasmonic sensing features of AuNPs in the GO-AuNP nanocomposite, but also the strong association of the nanogold to the graphene oxide sheets, which resulted in spatial distribution changes for the electric near field of the metal nanoparticles. NMR and AFM analyses confirmed such a strong interaction between the metal and GO, with the finding of most of the citrate molecules on the gold surface replaced by GO sheets and the preferential allocation of AuNP on the defective basal planes of the GO sheets, respectively. In vitro cellular experiments on human neuroblastoma SH-SY5Y cell line assessed a synergic effect of AuNP and GO in the hybrid assembly that increased the nanotoxicity of the GO-AuNP in comparison with the bare AuNPs and GO sheets and their effect on mitochondrial dysfunctions, as measured by the mitochondrial O2•− production. Such a detected selective ROS increase induced by GO-AuNP is very promising for the potential theranostic application of this system. Indeed, the nanosized character of the nanoplatform would allow the nanoparticles to accumulate in the tumor site, due to the altered structure of its vasculature. Hence, an effective and specific therapeutic action involving the ROS production can occur, followed by the biodegradation of the hybrid into the nontoxic byproducts (including GO and AuNPs) [60]. It is known that ROS concentration plays important role in cancer processes like in apoptosis, cancer survival, autophagy, angiogenesis, metastasis, and inflammation [61]. High levels of ROS in cancer cells compared with normal cells are due to elevated metabolic activity, activation of oncogene, cellular signaling, inherent mitochondrial dysfunction, and higher enzymatic activity of oxidases, cyclooxygenases, lipoxygenases, and thymidine phosphorylases [62]. Therefore, a further increase of ROS selectively in cancer cells may bring level of ROS to a lethal threshold, while resulting safer to normal cells [39]. Intracellular imaging by confocal microscopy highlighted the promising potentialities of these hybrid nanocomposites as a multifunctional platform for imaging/sensing and therapeutic purposes.

Author Contributions

Conceptualization and methodology, C.S.; investigation, L.M.C., I.N. and G.C.; writing—original draft preparation, L.M.C. and I.N.; writing—review and editing, C.S.

Funding

This research was partially supported by MIUR under Grant PRIN 2015 (20152EKS4Y project) and University of Catania (Piano della Ricerca di Ateneo 2016–2018).

Acknowledgments

The Consorzio Interuniversitario di Ricerca in Chimica dei Metalli nei Sistemi Biologici (CIRCMSB) is kindly acknowledged.

Conflicts of Interest

The authors declare no conflict of interest.

References

  1. Allen, M.J.; Tung, V.C.; Kaner, R.B. Honeycomb Carbon: A Review of Graphene. Chem. Rev. 2010, 110, 132–145. [Google Scholar] [CrossRef]
  2. Shao, Y.; Wang, J.; Wu, H.; Liu, J.; Aksay, I.A.; Lin, Y. Graphene Based Electrochemical Sensors and Biosensors: A Review. Electroanalysis 2010, 22, 1027–1036. [Google Scholar] [CrossRef] [Green Version]
  3. Geim, A.K. Graphene: Status and Prospects. Science 2009, 324, 1530–1534. [Google Scholar] [CrossRef] [PubMed] [Green Version]
  4. Dreyer, D.R.; Park, S.; Bielawski, C.W.; Ruoff, R.S. The chemistry of graphene oxide. Chem. Soc. Rev. 2010, 39, 228–240. [Google Scholar] [CrossRef] [PubMed]
  5. Liu, Z.; Liang, X.-J. Nano-Carbons as Theranostics. Theranostics 2012, 2, 235–237. [Google Scholar] [CrossRef] [PubMed] [Green Version]
  6. Patel, S.C.; Lee, S.; Lalwani, G.; Suhrland, C.; Chowdhury, S.M.; Sitharaman, B. Graphene-based platforms for cancer therapeutics. Ther. Deliv. 2016, 7, 101–116. [Google Scholar] [CrossRef] [PubMed]
  7. Xu, C.; Wang, X. Fabrication of Flexible Metal-Nanoparticle Films Using Graphene Oxide Sheets as Substrates. Small 2009, 5, 2212–2217. [Google Scholar] [CrossRef]
  8. Haubner, K.; Murawski, J.; Olk, P.; Eng, L.M.; Ziegler, C.; Adolphi, B.; Jaehne, E. The Route to Functional Graphene Oxide. ChemPhysChem 2010, 11, 2131–2139. [Google Scholar] [CrossRef]
  9. Pasricha, R.; Gupta, S.; Joshi, A.G.; Bahadur, N.; Haranath, D.; Sood, K.N.; Singh, S.; Singh, S. Directed nanoparticle reduction on graphene. Mater. Today 2012, 15, 118–125. [Google Scholar] [CrossRef]
  10. Karimi, A.; Othman, A.; Uzunoglu, A.; Stanciu, L.; Andreescu, S. Graphene based enzymatic bioelectrodes and biofuel cells. Nanoscale 2015, 7, 6909–6923. [Google Scholar] [CrossRef]
  11. Saifullah, B.; Buskaran, K.; Shaikh, R.B.; Barahuie, F.; Fakurazi, S.; Mohd Moklas, M.A.; Hussein, M.Z. Graphene Oxide(-)PEG(-)Protocatechuic Acid Nanocomposite Formulation with Improved Anticancer Properties. Nanomaterials (Basel) 2018, 8, 820. [Google Scholar] [CrossRef] [PubMed]
  12. Fan, H.; Wang, L.; Zhao, K.; Li, N.; Shi, Z.; Ge, Z.; Jin, Z. Fabrication, Mechanical Properties, and Biocompatibility of Graphene-Reinforced Chitosan Composites. Biomacromolecules 2010, 11, 2345–2351. [Google Scholar] [CrossRef] [PubMed]
  13. Bustos-Ramirez, K.; Martinez-Hernandez, A.L.; Martinez-Barrera, G.; Icaza, M.; Castano, V.M.; Velasco-Santos, C. Covalently Bonded Chitosan on Graphene Oxide via Redox Reaction. Materials (Basel) 2013, 6, 911–926. [Google Scholar] [CrossRef] [PubMed] [Green Version]
  14. Ma, J.; Liu, C.; Li, R.; Wang, J. Properties and structural characterization of oxide starch/chitosan/graphene oxide biodegradable nanocomposites. J. Appl. Polym. Sci. 2012, 123, 2933–2944. [Google Scholar] [CrossRef]
  15. Yang, K.; Wan, J.; Zhang, S.; Zhang, Y.; Lee, S.-T.; Liu, Z. In Vivo Pharmacokinetics, Long-Term Biodistribution, and Toxicology of PEGylated Graphene in Mice. ACS Nano 2010, 5, 516–522. [Google Scholar] [CrossRef]
  16. Xu, L.Q.; Wang, L.; Zhang, B.; Lim, C.H.; Chen, Y.; Neoh, K.-G.; Kang, E.-T.; Fu, G.D. Functionalization of reduced graphene oxide nanosheets via stacking interactions with the fluorescent and water-soluble perylene bisimide-containing polymers. Polymer 2011, 52, 2376–2383. [Google Scholar] [CrossRef]
  17. Alharbi, R.; Irannejad, M.; Yavuz, M. Au-Graphene Hybrid Plasmonic Nanostructure Sensor Based on Intensity Shift. Sensors 2017, 17, 191. [Google Scholar] [CrossRef]
  18. Chung, K.; Rani, A.; Lee, J.E.; Kim, J.E.; Kim, Y.; Yang, H.; Kim, S.O.; Kim, D.; Kim, D.H. Systematic study on the sensitivity enhancement in graphene plasmonic sensors based on layer-by-layer self-assembled graphene oxide multilayers and their reduced analogues. ACS Appl. Mater. Interfaces 2015, 7, 144–151. [Google Scholar] [CrossRef]
  19. Goncalves, G.; Marques, P.A.A.P.; Granadeiro, C.M.; Nogueira, H.I.S.; Singh, M.K.; Grácio, J. Surface Modification of Graphene Nanosheets with Gold Nanoparticles: The Role of Oxygen Moieties at Graphene Surface on Gold Nucleation and Growth. Chem. Mater. 2009, 21, 4796–4802. [Google Scholar] [CrossRef]
  20. Hernández-Sánchez, D.; Villabona-Leal, G.; Saucedo-Orozco, I.; Bracamonte, V.; Pérez, E.; Bittencourt, C.; Quintana, M. Stable graphene oxide–gold nanoparticle platforms for biosensing applications. Phys. Chem. Chem. Phys. 2018, 20, 1685–1692. [Google Scholar] [CrossRef]
  21. Xu, C.; Wang, X.; Zhu, J. Graphene−Metal Particle Nanocomposites. J. Phys. Chem. C 2008, 112, 19841–19845. [Google Scholar] [CrossRef]
  22. Qian, X.; Peng, X.-H.; Ansari, D.O.; Yin-Goen, Q.; Chen, G.Z.; Shin, D.M.; Yang, L.; Young, A.N.; Wang, M.D.; Nie, S. In vivo tumor targeting and spectroscopic detection with surface-enhanced Raman nanoparticle tags. Nat. Biotechnol. 2007, 26, 83–90. [Google Scholar] [CrossRef] [PubMed]
  23. Chen, J.; Saeki, F.; Wiley, B.J.; Cang, H.; Cobb, M.J.; Li, Z.-Y.; Au, L.; Zhang, H.; Kimmey, M.B.; Xia, Y. Gold Nanocages: Bioconjugation and Their Potential Use as Optical Imaging Contrast Agents. Nano Lett. 2005, 5, 473–477. [Google Scholar] [CrossRef] [PubMed]
  24. Di Pietro, P.; Strano, G.; Zuccarello, L.; Satriano, C. Gold and Silver Nanoparticles for Applications in Theranostics. Curr. Top. Med. Chem. 2016, 16, 3069–3102. [Google Scholar] [CrossRef]
  25. Hussein, E.; Zagho, M.; Nasrallah, G.; Elzatahry, A. Recent advances in functional nanostructures as cancer photothermal therapy. Int. J. Nanomed. 2018, 13, 2897–2906. [Google Scholar] [CrossRef] [PubMed] [Green Version]
  26. Goodman, C.M.; McCusker, C.D.; Yilmaz, T.; Rotello, V.M. Toxicity of Gold Nanoparticles Functionalized with Cationic and Anionic Side Chains. Bioconjugate Chem. 2004, 15, 897–900. [Google Scholar] [CrossRef] [PubMed]
  27. Maktedar, S.S.; Mehetre, S.S.; Avashthi, G.; Singh, M. In situ sonochemical reduction and direct functionalization of graphene oxide: A robust approach with thermal and biomedical applications. Ultrason. Sonochem. 2017, 34, 67–77. [Google Scholar] [CrossRef] [PubMed]
  28. Chatterjee, N.; Eom, H.J.; Choi, J. A systems toxicology approach to the surface functionality control of graphene-cell interactions. Biomaterials 2014, 35, 1109–1127. [Google Scholar] [CrossRef] [PubMed]
  29. Vallabani, N.V.; Mittal, S.; Shukla, R.K.; Pandey, A.K.; Dhakate, S.R.; Pasricha, R.; Dhawan, A. Toxicity of graphene in normal human lung cells (BEAS-2B). J. Biomed. Nanotechnol. 2011, 7, 106–107. [Google Scholar] [CrossRef]
  30. Zhang, X.F.; Liu, Z.G.; Shen, W.; Gurunathan, S. Silver Nanoparticles: Synthesis, Characterization, Properties, Applications, and Therapeutic Approaches. Int. J. Mol. Sci. 2016, 17, 1534. [Google Scholar] [CrossRef]
  31. Zhou, H.; Zhang, B.; Zheng, J.; Yu, M.; Zhou, T.; Zhao, K.; Jia, Y.; Gao, X.; Chen, C.; Wei, T. The inhibition of migration and invasion of cancer cells by graphene via the impairment of mitochondrial respiration. Biomaterials 2014, 35, 1597–1607. [Google Scholar] [CrossRef] [PubMed]
  32. Li, Y.; Liu, Y.; Fu, Y.; Wei, T.; Le Guyader, L.; Gao, G.; Liu, R.S.; Chang, Y.Z.; Chen, C. The triggering of apoptosis in macrophages by pristine graphene through the MAPK and TGF-beta signaling pathways. Biomaterials 2012, 33, 402–411. [Google Scholar] [CrossRef] [PubMed]
  33. Seabra, A.B.; Paula, A.J.; de Lima, R.; Alves, O.L.; Durán, N. Nanotoxicity of Graphene and Graphene Oxide. Chem. Res. Toxicol. 2014, 27, 159–168. [Google Scholar] [CrossRef] [PubMed]
  34. Wang, A.; Pu, K.; Dong, B.; Liu, Y.; Zhang, L.; Zhang, Z.; Duan, W.; Zhu, Y. Role of surface charge and oxidative stress in cytotoxicity and genotoxicity of graphene oxide towards human lung fibroblast cells. J. Appl. Toxicol. 2013, 33, 1156–1164. [Google Scholar] [CrossRef] [PubMed]
  35. Turkevich, J.; Stevenson, P.C.; Hillier, J. A study of the nucleation and growth processes in the synthesis of colloidal gold. Discuss. Faraday Soc. 1951, 11, 55. [Google Scholar] [CrossRef]
  36. Liu, X.; Atwater, M.; Wang, J.; Huo, Q. Extinction coefficient of gold nanoparticles with different sizes and different capping ligands. Coll. Surf. B Biointerfaces 2007, 58, 3–7. [Google Scholar] [CrossRef]
  37. Consiglio, G.; Di Pietro, P.; D’Urso, L.; Forte, G.; Grasso, G.; Sgarlata, C.; Cossement, D.; Snyders, R.; Satriano, C. Surface tailoring of polyacrylate-grafted graphene oxide for controlled interactions at the biointerface. J. Coll. Interface Sci. 2017, 506, 532–542. [Google Scholar] [CrossRef]
  38. Sun, X.; Liu, Z.; Welsher, K.; Robinson, J.T.; Goodwin, A.; Zaric, S.; Dai, H. Nano-graphene oxide for cellular imaging and drug delivery. Nano Res. 2008, 1, 203–212. [Google Scholar] [CrossRef] [Green Version]
  39. Naletova, I.; Satriano, C.; Curci, A.; Margiotta, N.; Natile, G.; Arena, G.; La Mendola, D.; Nicoletti, V.G.; Rizzarelli, E. Cytotoxic phenanthroline derivatives alter metallostasis and redox homeostasis in neuroblastoma cells. Oncotarget 2018, 9, 36289–36316. [Google Scholar] [CrossRef]
  40. Goldmann, C.; Lazzari, R.; Paquez, X.; Boissière, C.; Ribot, F.; Sanchez, C.; Chanéac, C.; Portehault, D. Charge Transfer at Hybrid Interfaces: Plasmonics of Aromatic Thiol-Capped Gold Nanoparticles. ACS Nano 2015, 9, 7572–7582. [Google Scholar] [CrossRef]
  41. Haes, A.J.; Van Duyne, R.P. A unified view of propagating and localized surface plasmon resonance biosensors. Anal. Bioanal. Chem. 2004, 379, 920–930. [Google Scholar] [CrossRef] [PubMed]
  42. Homola, J. Present and future of surface plasmon resonance biosensors. Anal. Bioanal. Chem. 2003, 377, 528–539. [Google Scholar] [CrossRef] [PubMed]
  43. Stockman, M.I. Nanoplasmonic sensing and detection. Science 2015, 348, 287–288. [Google Scholar] [CrossRef] [PubMed]
  44. Shao, W.; Liu, X.; Min, H.; Dong, G.; Feng, Q.; Zuo, S. Preparation, characterization, and antibacterial activity of silver nanoparticle-decorated graphene oxide nanocomposite. ACS Appl. Mater. Interfaces 2015, 7, 6966–6973. [Google Scholar] [CrossRef] [PubMed]
  45. He, Y.Q.; Liu, S.P.; Kong, L.; Liu, Z.F. A study on the sizes and concentrations of gold nanoparticles by spectra of absorption, resonance Rayleigh scattering and resonance non-linear scattering. Spectrochim. Acta A Mol. Biomol. Spectrosc. 2005, 61, 2861–2866. [Google Scholar] [CrossRef] [PubMed]
  46. Li, M.; Cushing, S.K.; Zhang, J.; Lankford, J.; Aguilar, Z.P.; Ma, D.; Wu, N. Shape-dependent surface-enhanced Raman scattering in gold-Raman probe-silica sandwiched nanoparticles for biocompatible applications. Nanotechnology 2012, 23, 115501. [Google Scholar] [CrossRef] [PubMed]
  47. Forte, G.; Travaglia, A.; Magri, A.; Satriano, C.; La Mendola, D. Adsorption of NGF and BDNF derived peptides on gold surfaces. Phys. Chem. Chem. Phys. 2014, 16, 1536–1544. [Google Scholar] [CrossRef] [PubMed]
  48. Hostetler, M.J.; Wingate, J.E.; Zhong, C.-J.; Harris, J.E.; Vachet, R.W.; Clark, M.R.; Londono, J.D.; Green, S.J.; Stokes, J.J.; Wignall, G.D.; et al. Alkanethiolate Gold Cluster Molecules with Core Diameters from 1.5 to 5.2 nm: Core and Monolayer Properties as a Function of Core Size. Langmuir 1998, 14, 17–30. [Google Scholar] [CrossRef]
  49. Kohlmann, O.; Steinmetz, W.E.; Mao, X.-A.; Wuelfing, W.P.; Templeton, A.C.; Murray, R.W.; Johnson, C.S. NMR Diffusion, Relaxation, and Spectroscopic Studies of Water Soluble, Monolayer-Protected Gold Nanoclusters†. J. Phys. Chem. B 2001, 105, 8801–8809. [Google Scholar] [CrossRef]
  50. Anet, F.A.L.; Park, J. Proton chemical shift assignments in citrate and trimethyl citrate in chiral media. J. Am. Chem. Soc. 1992, 114, 411–416. [Google Scholar] [CrossRef]
  51. Marbella, L.E.; Millstone, J.E. NMR Techniques for Noble Metal Nanoparticles. Chem. Mater. 2015, 27, 2721–2739. [Google Scholar] [CrossRef]
  52. Lv, M.; Zhang, Y.; Liang, L.; Wei, M.; Hu, W.; Li, X.; Huang, Q. Effect of graphene oxide on undifferentiated and retinoic acid-differentiated SH-SY5Y cells line. Nanoscale 2012, 4, 3861–3866. [Google Scholar] [CrossRef] [PubMed]
  53. Cucci, L.M.; Munzone, A.; Naletova, I.; Magri, A.; La Mendola, D.; Satriano, C. Gold nanoparticles functionalized with angiogenin-mimicking peptides modulate cell membrane interactions. Biointerphases 2018, 13, 03C401. [Google Scholar] [CrossRef] [PubMed]
  54. Khalili Fard, J.; Jafari, S.; Eghbal, M.A. A Review of Molecular Mechanisms Involved in Toxicity of Nanoparticles. Adv. Pharm. Bull. 2015, 5, 447–454. [Google Scholar] [CrossRef] [PubMed] [Green Version]
  55. Zhang, Y.; Ali, S.F.; Dervishi, E.; Xu, Y.; Li, Z.; Casciano, D.; Biris, A.S. Cytotoxicity effects of graphene and single-wall carbon nanotubes in neural phaeochromocytoma-derived PC12 cells. ACS Nano 2010, 4, 3181–3186. [Google Scholar] [CrossRef]
  56. Chang, Y.; Yang, S.T.; Liu, J.H.; Dong, E.; Wang, Y.; Cao, A.; Liu, Y.; Wang, H. In vitro toxicity evaluation of graphene oxide on A549 cells. Toxicol. Lett. 2011, 200, 201–210. [Google Scholar] [CrossRef] [PubMed]
  57. Gurunathan, S.; Han, J.W.; Eppakayala, V.; Kim, J.H. Green synthesis of graphene and its cytotoxic effects in human breast cancer cells. Int. J. Nanomed. 2013, 8, 1015–1027. [Google Scholar] [CrossRef] [PubMed]
  58. Ott, M.; Gogvadze, V.; Orrenius, S.; Zhivotovsky, B. Mitochondria, oxidative stress and cell death. Apoptosis 2007, 12, 913–922. [Google Scholar] [CrossRef] [PubMed] [Green Version]
  59. Zuber, A.; Purdey, M.; Schartner, E.; Forbes, C.; van der Hoek, B.; Giles, D.; Abell, A.; Monro, T.; Ebendorff-Heidepriem, H. Detection of gold nanoparticles with different sizes using absorption and fluorescence based method. Sens. Actuators B Chem. 2016, 227, 117–127. [Google Scholar] [CrossRef] [Green Version]
  60. Fan, Z.; Fu, P.P.; Yu, H.; Ray, P.C. Theranostic nanomedicine for cancer detection and treatment. J. Food Drug Anal. 2014, 22, 3–17. [Google Scholar] [CrossRef] [PubMed] [Green Version]
  61. Poillet-Perez, L.; Despouy, G.; Delage-Mourroux, R.; Boyer-Guittaut, M. Interplay between ROS and autophagy in cancer cells, from tumor initiation to cancer therapy. Redox Biol. 2015, 4, 184–192. [Google Scholar] [CrossRef] [PubMed] [Green Version]
  62. Kumari, S.; Badana, A.K.; Gavara, M.M.; Gugalavath, S.; Malla, R. Reactive Oxygen Species: A Key Constituent in Cancer Survival. Biomark Insights 2018, 13. [Google Scholar] [CrossRef] [PubMed]
Figure 1. UV-visible spectra of graphene oxide gold nanoparticles (GO-AuNP) (blue) and AuNP (wine) samples before (‘0’) and after the two rinsing steps in Milli-Q water (centrifugation at 8000 r.p.m, 15 min, RT) for the re-suspended pellets 1 (‘1’) and 2 (‘2’), respectively. Spectra of GO (black) before (‘0’) and after two rinsing steps in Milli-Q water (centrifugation at 13,000 r.p.m, 20 min, RT) for the re-suspended pellets 1 (‘1’) and 2 (‘2’) are shown for reference.
Applsci 09 00676 g001
Figure 2. UV-visible experimental spectra of AuNP, GO, GO-AuNP (a: pellet 1; b: pellet 2) and GO calculated spectrum by the difference (GO-AuNP)-(AuNP).
Applsci 09 00676 g002
Figure 3. NMR spectra of (a) hybrid nano-systems GO-AuNP pellet 2, 3.5 × 10⁻⁸ M; (b) AuNPs pellet 2, 3.5 × 10⁻⁸ M; (c) GO 0.025 mg/mL in 3.09 × 10⁻³ M sodium citrate solution (d) 3.09 × 10⁻³ M sodium citrate solution.
Applsci 09 00676 g003
Figure 4. AC-mode atomic force microscopy (AFM) height images in air for (pellet 2) samples of: (a) AuNPs, (b) GO, (c) GO-Au-NP; z scale = 10 nm. The panels below each micrograph show the section analysis plots corresponding to the drawn line.
Applsci 09 00676 g004
Figure 5. The 3-(4,5-dimethylthiazol-2-yl)-2,5-diphenyltetrazolium bromide (MTT) results of dose-response experiment on neuroblastoma SH-SY5Y cell line. Cells were incubated for 24 h with AuNPs, GO-AuNP, and free GO nanosheets, at different concentrations: 5, 10, 15 nM of AuNPs; 5, 10, 20 μg/mL of GO into the hybrids; 5, 10, 20 μg/mL of GO alone. Results are presented as mean ± SEM from experiments in triplicate and normalized with respect to the control untreated cells. Asterisk (*) represents the correlation significant at the p ≤ 0.05 level with respect to the control.
Applsci 09 00676 g005
Figure 6. MitoSOX experiment on neuroblastoma SH-SY5Y cell line. Cells were incubated for 24 h with AuNPs, GO-AuNP, and free GO nanosheets, at different concentrations: 5, 10, 15 nM of AuNPs; 5, 10, 20 μg/mL of GO into the hybrids; 5, 10, 20 μg/mL of GO alone. Results are presented as mean ± SEM from experiments in triplicate and normalized with respect to the control untreated cells. Asterisk (**) represents the correlation significant at the p ≤ 0.01 and (***) at the p ≤ 0.001 level with respect to the control; (§) represents the correlation significant at the p ≤ 0.05 and (§§§) at the p ≤ 0.001 level with respect to the GO.
Applsci 09 00676 g006
Figure 7. The 2′,7′-dichlorofluorescein (DCF) experiment on neuroblastoma SH-SY5Y cell line. Cells were incubated for 24 with AuNPs, GO-AuNP, and free GO nanosheets, at different concentrations: 5, 10, 15 nM of AuNPs; 5, 10, 20 μg/mL of GO into the hybrids; 5, 10, 20 μg/mL of GO alone. Results are presented as mean ± SEM from experiments in triplicate and normalized with respect to the control untreated cells. Asterisk (*) represents the correlation significant at the p ≤ 0.05 and (***) at the p ≤ 0.001 level with respect to the control; (##) represents the correlation significant at the p ≤ 0.01 and (###) at the p ≤ 0.001 level with respect to the AuNPs; (§§§) represents the correlation significant at the p ≤ 0.001 level with respect to the GO.
Applsci 09 00676 g007
Figure 8. Laser scanning confocal microscopy (LSM) micrographs of SH-SY5Y neuroblastoma cells after 2 h treatment with the various samples: (a) untreated, (b) 5 nM AuNP, (c) 20 μg/mL GO, (d) 20 μg/mL GO-AuNP. Left: merged channels of blue (nuclear staining with Hoechst, λex/em = 405/425–475) and red (LysoTracker Deep Red, λex/em = 633/650–700); right: merged channels of blue and grey (bright field images). Scale bar = 20 μm.
Applsci 09 00676 g008
Table 1. Optical parameters from UV-vis spectra of hybrid GO-AuNP composites and AuNPs before (‘0’) and after the centrifugation for pellet 1 (‘1’) and pellet 2 (‘2’).
Sample λ (nm)FWHM (nm)
GO-AuNP(0)52550
GO-AuNP(1)52553
GO-AuNP(2)52553
AuNP(0)52254
AuNP(1)52356
AuNP(2)52356
Table 2. Concentration of GO and AuNP in the hybrid GO-AuNP nanocomposites for pellet 1 and pellet 2 samples.
SampleGO (10−3 mg/mL)AuNP (nM)
GO-AuNP(1)79.338.6
GO-AuNP(2)34.333.9

