Article

A 3D Object Detection Based on Multi-Modality Sensors of USV

1
College of Information Science and Engineering, Ocean University of China, Qingdao 266100, China
2
National Laboratory for Marine Science and Technology, Qingdao 266000, China
*
Authors to whom correspondence should be addressed.
These authors contributed equally to this work.
Appl. Sci. 2019, 9(3), 535; https://doi.org/10.3390/app9030535
Submission received: 30 December 2018 / Revised: 22 January 2019 / Accepted: 1 February 2019 / Published: 5 February 2019
(This article belongs to the Special Issue Advanced Intelligent Imaging Technology)

Abstract

:
Unmanned Surface Vehicles (USVs) are commonly equipped with multi-modality sensors. Fully utilized sensors could improve object detection of USVs. This could further contribute to better autonomous navigation. The purpose of this paper is to solve the problems of 3D object detection of USVs in complicated marine environment. We propose a 3D object detection Depth Neural Network based on multi-modality data of USVs. This model includes a modified Proposal Generation Network and Deep Fusion Detection Network. The Proposal Generation Network improves feature extraction. Meanwhile, the Deep Fusion Detection Network enhances the fusion performance and can achieve more accurate results of object detection. The model was tested on both the KITTI 3D object detection dataset (A project of Karlsruhe Institute of Technology and Toyota Technological Institute at Chicago) and a self-collected offshore dataset. The model shows excellent performance in a small memory condition. The results further prove that the method based on deep learning can give good accuracy in conditions of complicated surface in marine environment.

1. Introduction

In the new era of ocean observations, Unmanned Surface Vehicles (USVs) are of vital significance in scientific investigation, ocean monitoring and disaster relief [1]. Currently, most applications of USVs, such as collision avoidance and navigation, heavily rely on manual operation. Achievement of reliable, autonomous, all-weather marine object detection and characterization can be highly beneficial if the capability for autonomous collision avoidance of USVs could be realized. Meanwhile, other advanced tasks such as port surveillance require semantic reconstruction of the environment. Accurate object detection could significantly improve the performance of autonomous navigation and related advanced tasks. However, existing methods of object detection face some challenges in USVs’ operating environment.
Previous methods cannot achieve satisfied results on detection and characterization of the sea surface objects of USVs, such as single visual-based object detection and multi-model based object detection methods. Single visual-based object detection has poor performance in identifying objects on sea surface. It often fails to achieve good results [2,3,4]. In ground environment, several cases using multi-model based object detection methods on UGVs have proven their effectiveness [5,6], but these methods cannot be applied in marine environment bcause the operating environment of USVs lacks abundant signs. Moreover, modern USVs are usually equipped with a variety of sensors, such as camera and lidar, which produce additional information, such as depth and density. In this condition, 3D object detection based on point cloud generated by lidar is time-consuming. It cannot meet the real-time requirement of USVs.
This paper proposes a 3D object detection Depth Neural Network (DNN) based on multi-modality data of USVs. This new model containstwo significant features. Firstly, this model converts the raw point cloud to Bird’s Eye View (BEV). This reduces the computation requirements of the algorithm and csn work smoothly in lower memory spaces of computer. This model contains a deep network that can generate area proposals to overcome the problems of low-resolution object in images and BEV. In this deep network, a modified Resnet [7] is utilized to extract the feature map of images and BEV. Secondly, this model includes a deep fusion detection network. This fusion detection network improves the accuracy of object detection on the sea surface.
We tested our model on the KITTI dataset and a self-built datasets. Experimental results show that our model can achieve better results than other methods did in the USV’s operating environment. The final performance of object detection on the sea surface has been greatly improved. The new model has apparent advantages in performance and accuracy, even in small memory conditions.
The rest of the paper is organized as follows: after reviewing the related work in Section 2, we introduce the proposed object detection architecture in Section 3. Then, we provide a thorough experimental result in Section 4. Finally, the paper is concluded in Section 5.

2. Related Work

The proposed model uses the BEV and the image as input. A two-stage detection network is constructed to detect objects on the sea surface. This network consists of proposal generation network and deep fusion network.

2.1. Point-Cloud-Based Method vs. View-Based Method

In network input, the Point-cloud-based method and the View-based method are two generally used 3D object detection methods. The Point-cloud-based method could be further divided into two types. The first type takes raw 3D point cloud or its varieties as input. It directly takes original 3D point cloud as input [8,9]. For example, PointNet [9] takes an unordered set of points directly into a network. This network uses a symmetric function to select the points of interest. Then, it predicts the label of each point. These methods are time-consuming. The second type encodes the point cloud to some varieties, typically voxel grid [10,11]. For example, voxelnet [11] divides the point cloud into isometric 3D voxels, which are input into the network for learning. These methods involve 3D convolution operation, which is inefficient for the network operation speed in applications of USVs.
The view-based method converts the 3D point cloud into a view, such as Bird’s Eye View (BEV). By transforming 3D point cloud into BEV [6,12,13,14,15,16], these methods extract effective features from depth information. It significantly improves the computing speed by using the fusion learning of different views of image and point cloud. In this paper, the 3D point cloud is encoded as multi-channel BEV to extracting features together with images for object detection.

2.2. Two-Stage Detection Network vs. Single-Stage Detection Network

In network structures, there are two methods for object detection network. One is the single-stage detection method, such as SSD [17] and YOLO [18]. For the single-stage method, the location detection and object classificationare fully integrated into a single network. The border position is designed as a regression parameter, which is directly obtained by network regression. As there is no specific region proposal, they are not as accurate as the two stages in detecting small objects.
Two-stage detection implements detection through two procedures, such as Fast R-CNN [19], faster RCNN [20]and mask RCNN [21]. This method adopts Region Proposal Network (RPN). The RPN shares global convolution features with detection network and generates region. The separated proposal generation and classification improve accuracy in small object detection. We adopted the two-stage detection network scheme to generate proposals by using RPN and made accurate classification in the deep fusion network.

2.3. Deep Fusion Network

The deep fusion network achieves better results than the shallow network in multi-model tasks. The fusion of multi-source data has practical significance in many fields. Giuseppe et al. [22,23] proposed and compared the fusion methods of multiple classifiers. In the application of USVs object detection, we need to fuse the multi-mode features. In [24], information combination in detection is only a simple fusion in the early stage. Such simple fusion sets a latitude. Deeply-Fused Nets [25] pioneered the concept of deep fusion to learn about multi-scale representation. Deep and shallow basic networks learn together and can benefit from each other. Drop-path proposed by Fractalnet [26] refers to randomly dropping subpaths. It can prevent overfitting and improve the performance of the model. We integrated these ideas and chose a deep fusion network with drop-path. In our network, we designed a Resnet-like module to integrate BEV feature graph and image feature. As each module iterates, we selectively drop paths. Using the deep fusion network, the depth expanding of the new network in this paper introduces more parameters that increase expression ability.

3. Method

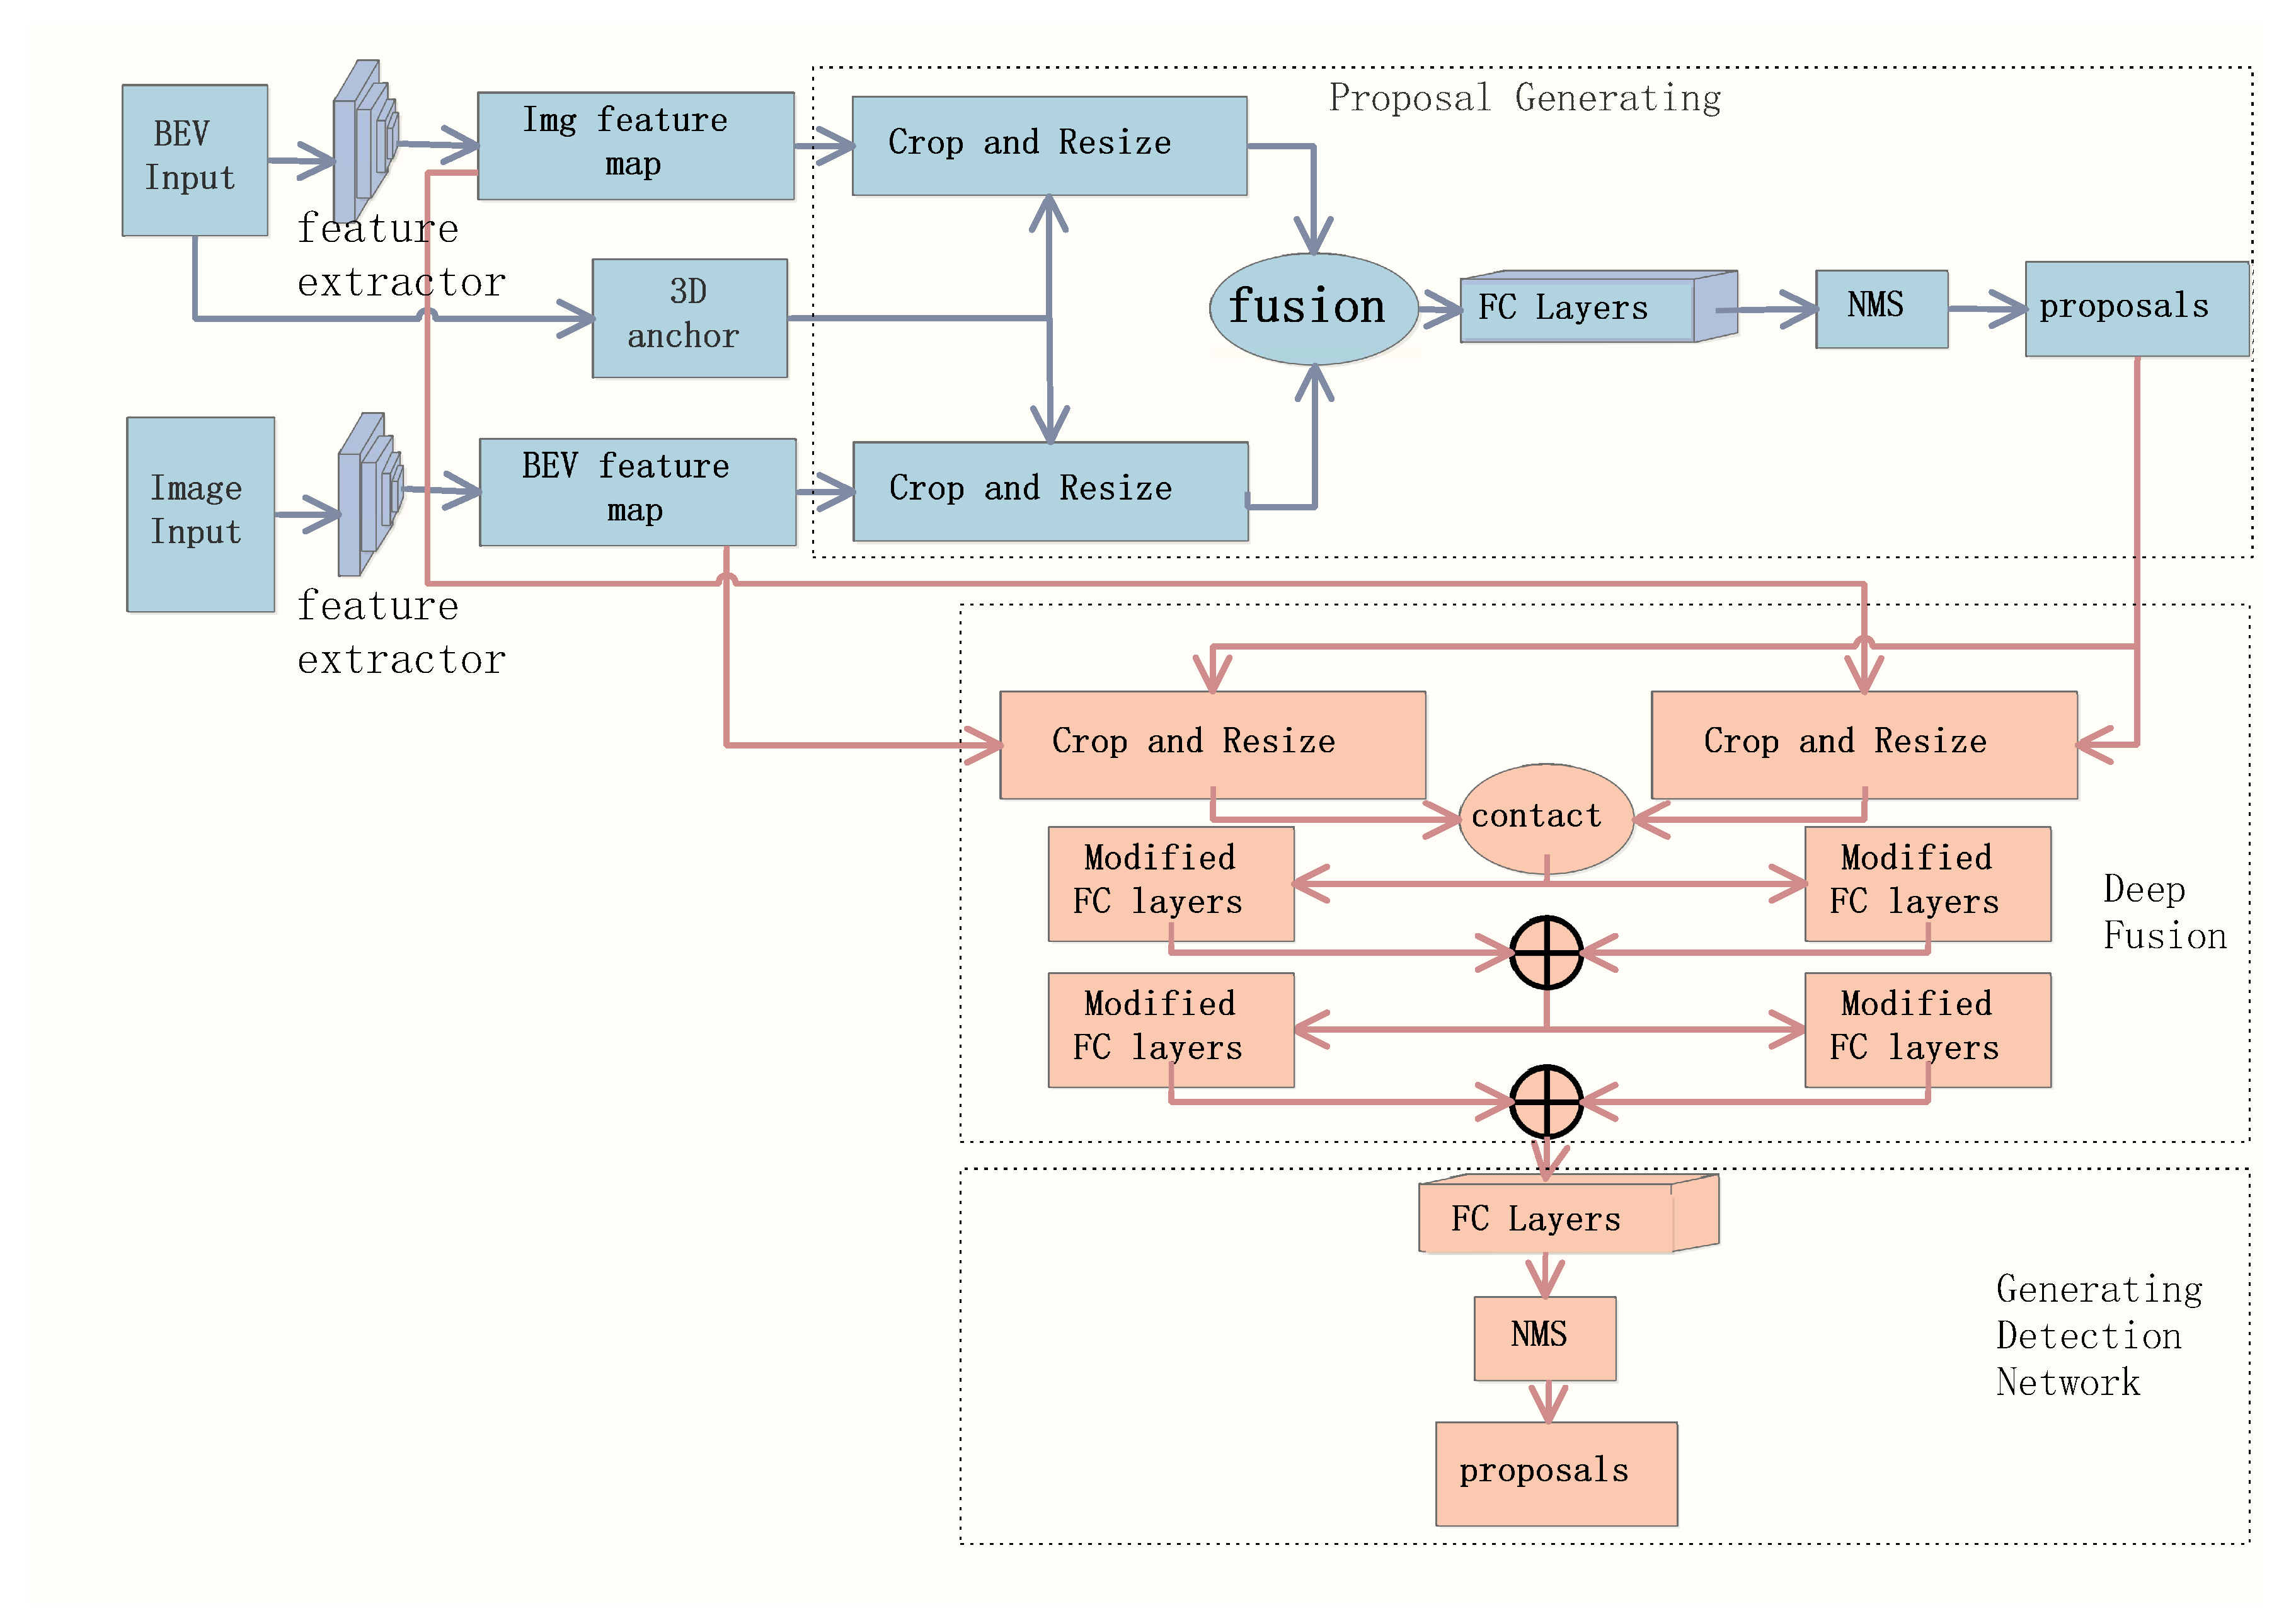
3.1. The Object Detection Architecture

As shown in Figure 1, our two-stage detection network consists of two parts, namely, the proposal generation network and the deep fusion detection network. The proposal generation network takes BEV and image as input. The feature map is extracted from the inputs to generate 3D proposals. In the Deep Fusion Detection Network, feature maps are deeply fused. It uses proposals to regress the 3D bounding box to predict the bounding box and the direction of the 3D object.

3.2. Proposal Generation Network

3.2.1. Bird’s Eye View Generating

A BEV encodes 3D point cloud in terms of height, intensity, and density. Mv3D [6] transforms the point cloud data into slices to obtain the height map and then connects the height map with the intensity map and density map to obtain the multi-channel feature map. The height map calculates the maximum altitude of points in each grid. The intensity and density are the reflectivity of the highest point in each cloud and the number of points in each grid, respectively. Instead of massive slices, we encoded the point cloud into a six-channel BEV map based on [12]. The resolution of each two-dimensional grid is 0.1 m. The first five channels of BEV are height maps calculated based on the average slices cut along the z-axis. The z-axis threshold is between 0 and 2.5 m. The final sixth channel is the density map. We normalized the density information as min(1.0, l o g ( N + 1 ) l o g 16 ), where N is the number of midpoints in the grid. As shown in Figure 2, we visualized the six channels of BEV.

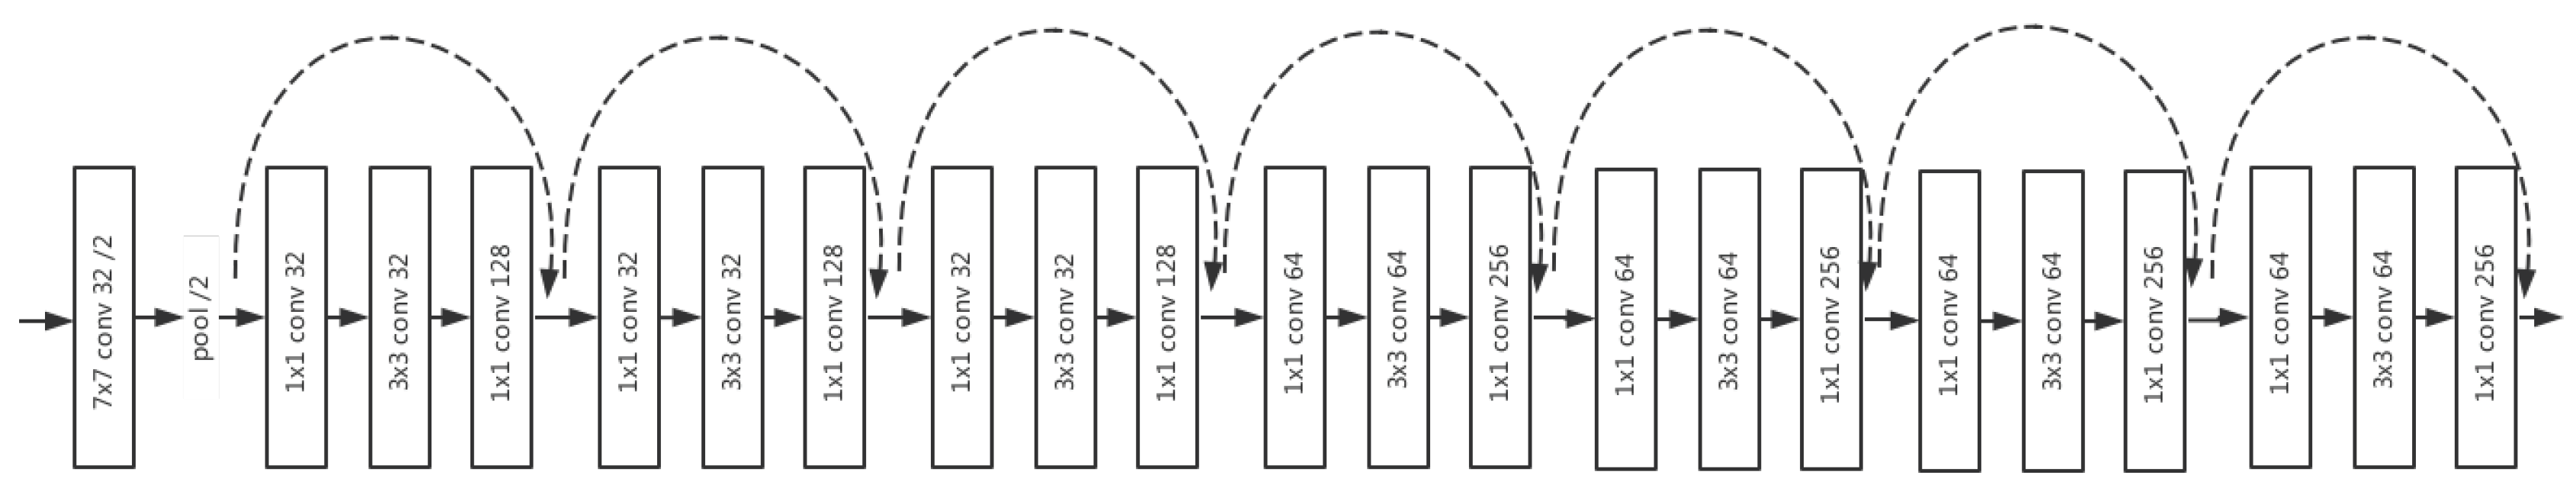
3.2.2. Feature Map Extraction

Most target objects in the marine scenario are far away from the USVs. It is difficult to extract rich features from results in a small object on the image and BEV. Therefore, we modified the Resnet-50 model for feature extraction, as shown in Figure 3. The network was cut off at conv3, and the number of channels was halved. Thus, the input size is M × N × D, and the output of the feature map is M 8 × N 8 × D. Since the resolution is 0.1 m, small objects may occupy tiny pixels in the feature map. There may be some difficulties for object proposal procedure. We introduced deconvolution [27,28] as an up-sampling method to restore small image data to the original size. After a deep neural network of feature extraction, we used transpose convolution for sampling. At the outset, the network contained a series of convolution operations of Resnet-50, the input is down-sampled at 8×. After the deconvolution layers, the input goes back to half the size of the original image. It provides a high representational ability.

3.2.3. Proposal Generating

  • 3D Box Description: In two-stage 2D object detection, the proposal is generated from a series of prior boxes. In [6,12], an encoding method of 3D prior boxes is proposed. Each 3D prior box is parameterized to (x,y,z,l,w,h,r), where (x,y,z) is the center of the mass coordinate of box, (l,w,h) is the size of box, and (r) is the direction of the box. The prior box is generated from BEV. The sampling interval (x, y) is 0.5 m, while the ground height of the sensor determines parameter z.
  • Crop and Resize Instead of Roi Pooling: We chose to use crop and resize [12,29] to extract the box’s corresponding feature map from a particular view instead of the ROI-pooling. Because ROI-pooling uses nearest neighbor interpolation, it may lose spatial symmetry. nearest neighbor interpolation means that ROI-pooling adopts rounding, which is equivalent to selecting the Nearest point to the target point when the scaled coordinate cannot be an exact integer. To keep the symmetry of the space, crop and resize uses bilinear interpolation to resample an image to a fixed size.
  • Drop Path: In the fusion of RPN stage, we added the drop path method. The extracted feature channel is randomly discarded. Then, the elements were evenly fused. fractalnet used drop path method to normalize collaborative adaptiveneutron paths in fractal structures Larsson et al. [26]. Through this normalization, it is able to prove that the answer given by the shallow subnetwork is faster, while the answer given by the deep subnetwork is more accurate.
  • 3D Proposal Generating: We used 1 × 1 convolution instead of the full connection layer and then used a multi-task loss to classify the object/background and computed the regression of proposal boxes. To sort out the background/object, we used cross-entropy loss, while, for the regression loss of the proposal boxes, we selected smooth L1 loss. When computing boxes regression, we ignored the background anchor point. The background anchor point is determined by the IoU overlap between ground truth and the anchor point in BEV. Overlap above 0.7 is considered as the background. If the overlap is less than 0.5, it is considered as the target. To to redundancy, Non-Maximum Suppression (NMS) is applied in BEV with a threshold of 0.8.

3.3. Deep Fusion Detection Network

3.3.1. Deep Fusion

By projecting the 3D proposal box onto the BEV and previously extracted image feature map, we can get two response regions. To conduct in-depth fusion afterwards, the regions are computed by crop and resize. We obtained an equidistant vector.
To fuse different information, we propose an improved deep fusion method. It is based on the method by [6]. chen et al compared the differences between early fusion and late fusion [6]. That method increases the interaction between the middle layer features of different views. The original fusion process is as follows:
f 0 = f B V f F V f R G B f l = H l B V ( f l 1 ) H l F V ( f l 1 ) H l R G B ( f l 1 ) l = 1 , , L
where H l , l = 1 , , L is a feature transformation function and ⨁ is the join operation (for example, concatenation or sum). We improved the process by eliminating the front view. Since only the BEV and image were available, we removed the fusion of the front views to accommodate our network structure. We also used the element-wise mean join operation for fusion. Our design is as follows:
f 0 = f B V f R G B f l = H l B V ( f l 1 ) H l R G B ( f l 1 ) l = 1 , , L
In the implementation process, we used a design that is similar to the block in Resnet to make the fusion effect better.

3.3.2. Generating Detection Network

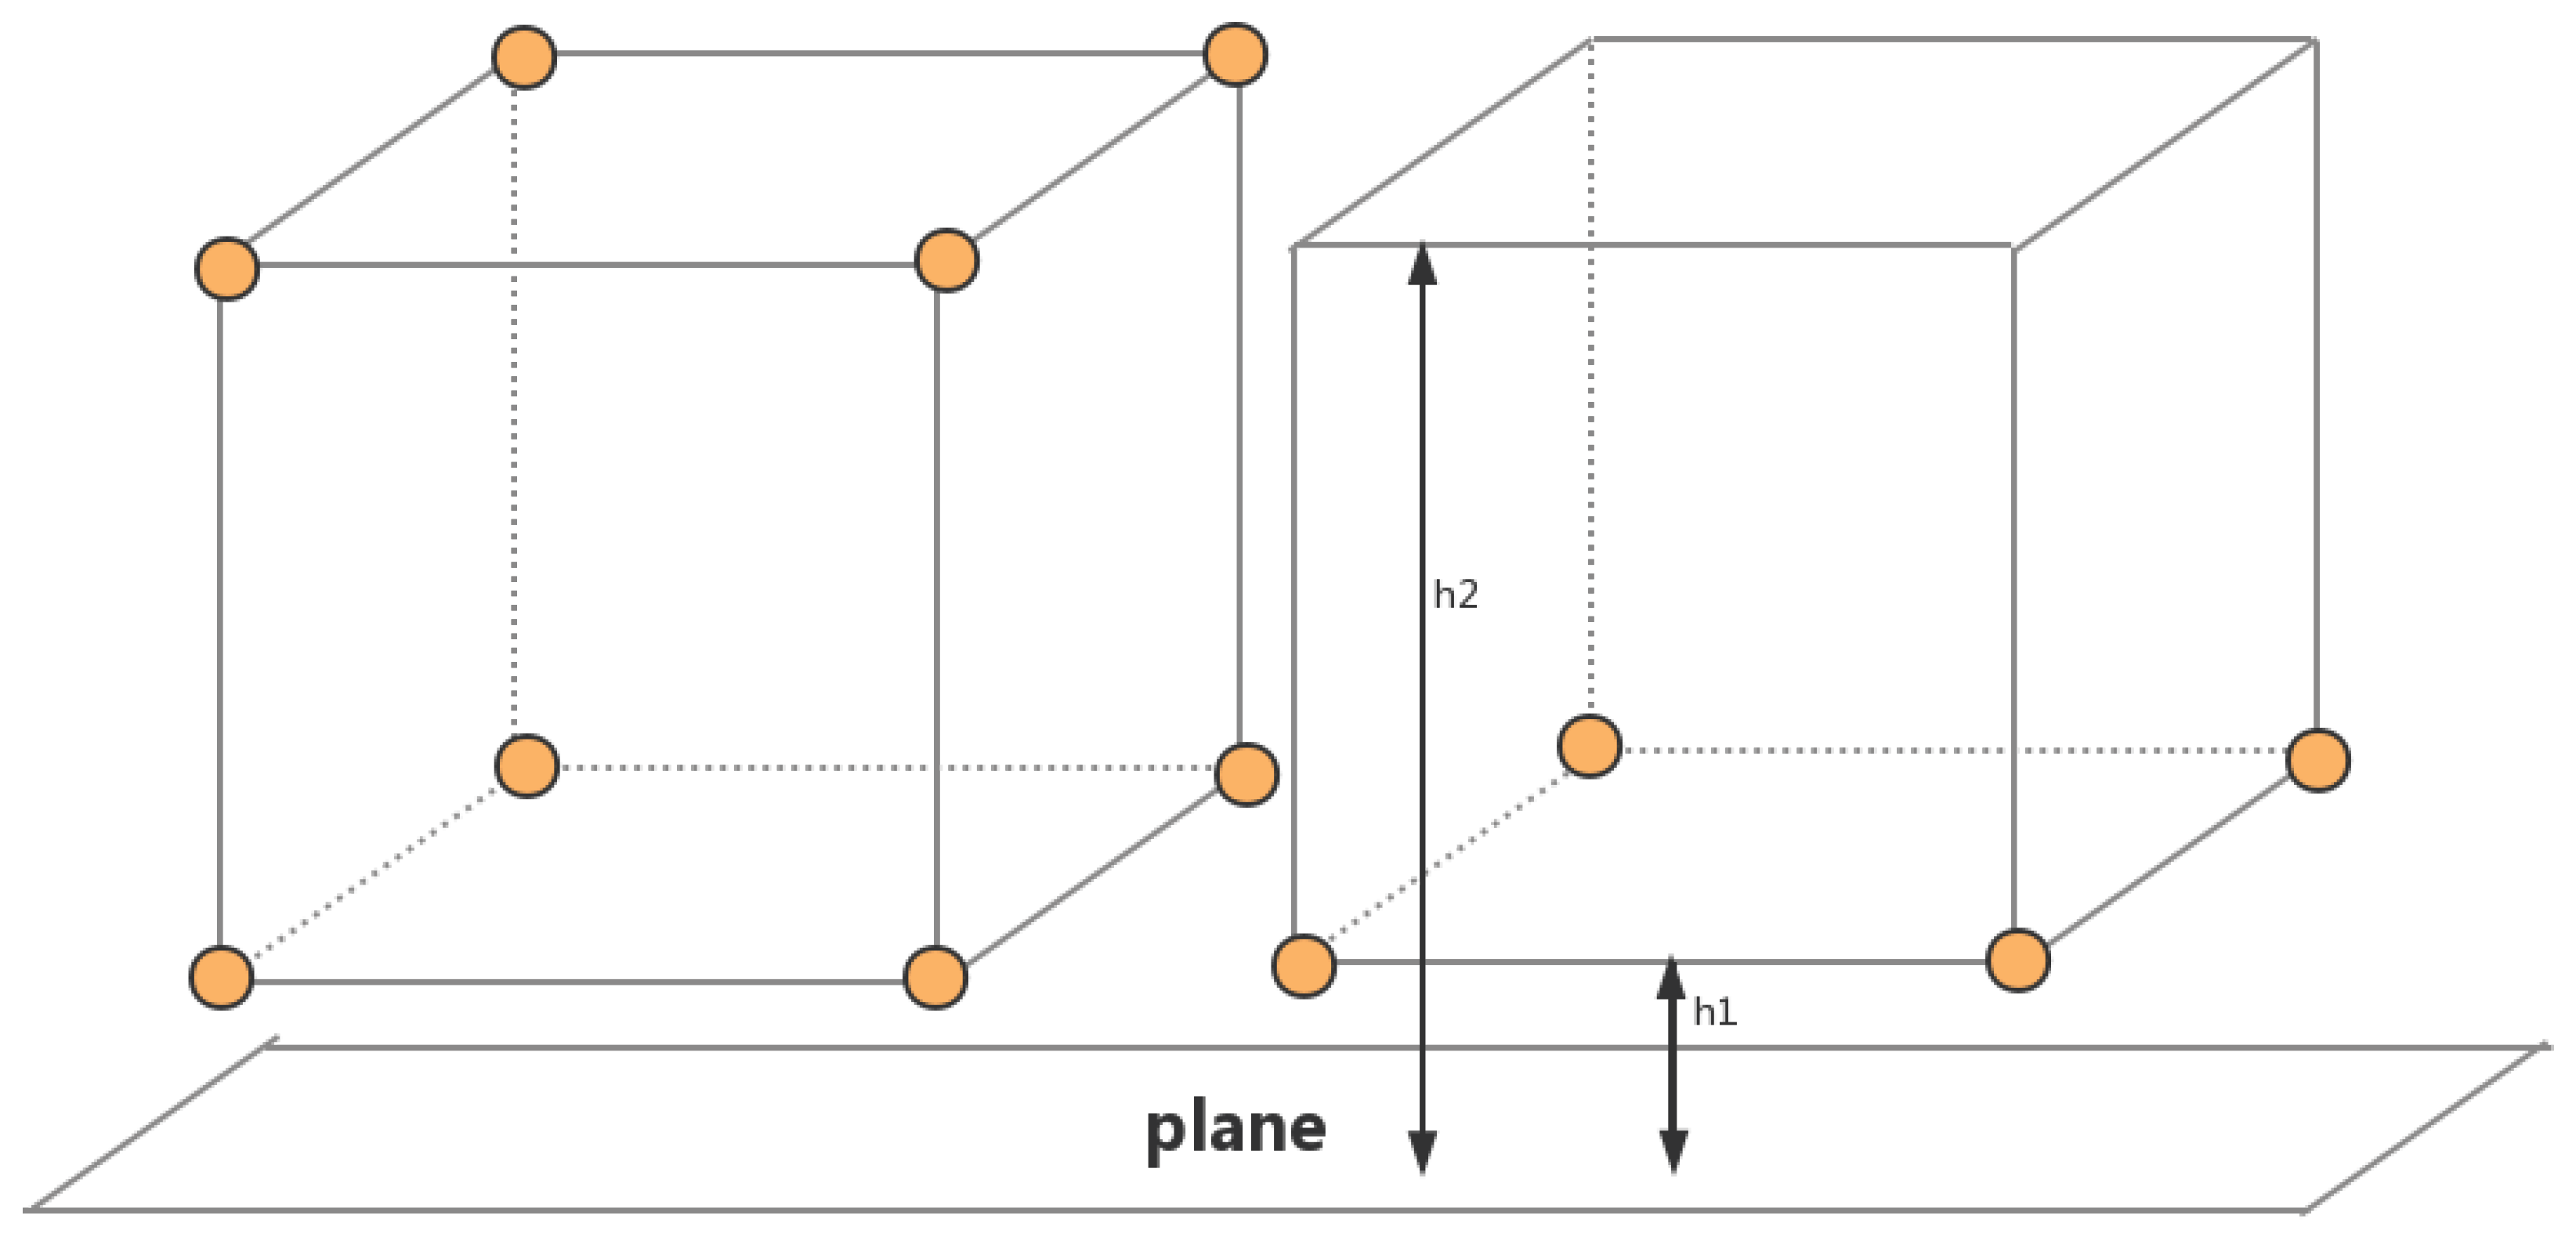
  • 3D Bounding Box Regression: As shown in Figure 4, traditional axis aligned coding uses centers of mass and axes. Chen et al. [6] used eight-corner box coding. We used a more simplified four-corner coding. Considering that the bottom four corners must be aligned with the top, the physical constraint of the 3D bounding box is added. We encoded the border as four corners and two heights. Thus, the original regression target of the 24-dimensional vector of the eight-corner box is changed to (x1… x2. y1… y2. h1, h2). To reduce the amount of calculation and to improve the speed of calculation, we selected the four-corner encoding and introduced orientation estimation. From the orientation estimation, we extracted four possible directions of the border box and explicitly computed the box regression loss.
  • Generating Detection: The fused features are input to the full connection layer. Box regression and classification operation are carried out after the three fully-connected layers of size 2048. Similarly, Smooth L1 loss is still used for box regression, and cross-entropy loss is used for classification. To eliminate overlap, we used IoU threshold of 0.01 for NMS.

3.4. Training

RPN and detection network are jointly trained in an end-to-end method. For each batch, an image of 512 or 1024 ROIs is used. We used ADAM optimizer to perform 120,000 iterative training with a learning rate of 0.001.

4. Experiments and Results

We evaluated our methods on the KITTI [30] validation set and an offshore marine environments dataset. The experiments were executed on different workstations. The graphics card was one TITAN X or two 1080TI.

4.1. Evaluation on the KITTI Validation Set

We evaluated our network against the KITTI 3D object detection benchmarks. The training set provided 7481 images, and the test set provided 7518 images. We followed Chen et al. [31] to divide the training set into a training set and validation set in a 1:1 ratio. We concentrated our experiments on the category of cars. To facilitate the evaluation, we followed KITTI’s simple, moderate, and difficult classification methods to evaluate and compare our network.
  • Evaluation of Object Detection
    For 3D overlap standard, in the radar-based method, we used the IoU threshold of 0.7 to conduct the 3D object detection. Because our model focuses on BEV and images, we also compared it with f-point net, while comparing MV3D and AVOD. The results are shown in Table 1. The results are significantly more than 10% higher than MV3D in terms of average precision. The results are also superior to AVOD in the easy and moderate mode. On the hard mode, however, the results are weaker. However, it can be tolerated in practice.
    We also carried out 3D detection in the BEV, and the results are shown in Table 2. AVOD did not release its results, thus we could not compare our results with AVOD’s results. Our model was superior to MV3D in all aspects. Our model also performed better than f-point net in easy and hard mode.
    Inspired by AVOD, we also included orientation estimation in the network. We compared the Average Orientation Similarity (AOS). In AVOD, they are called Average Heading Similarity (AHS). As shown in Table 3, our model had better results than AVOD.
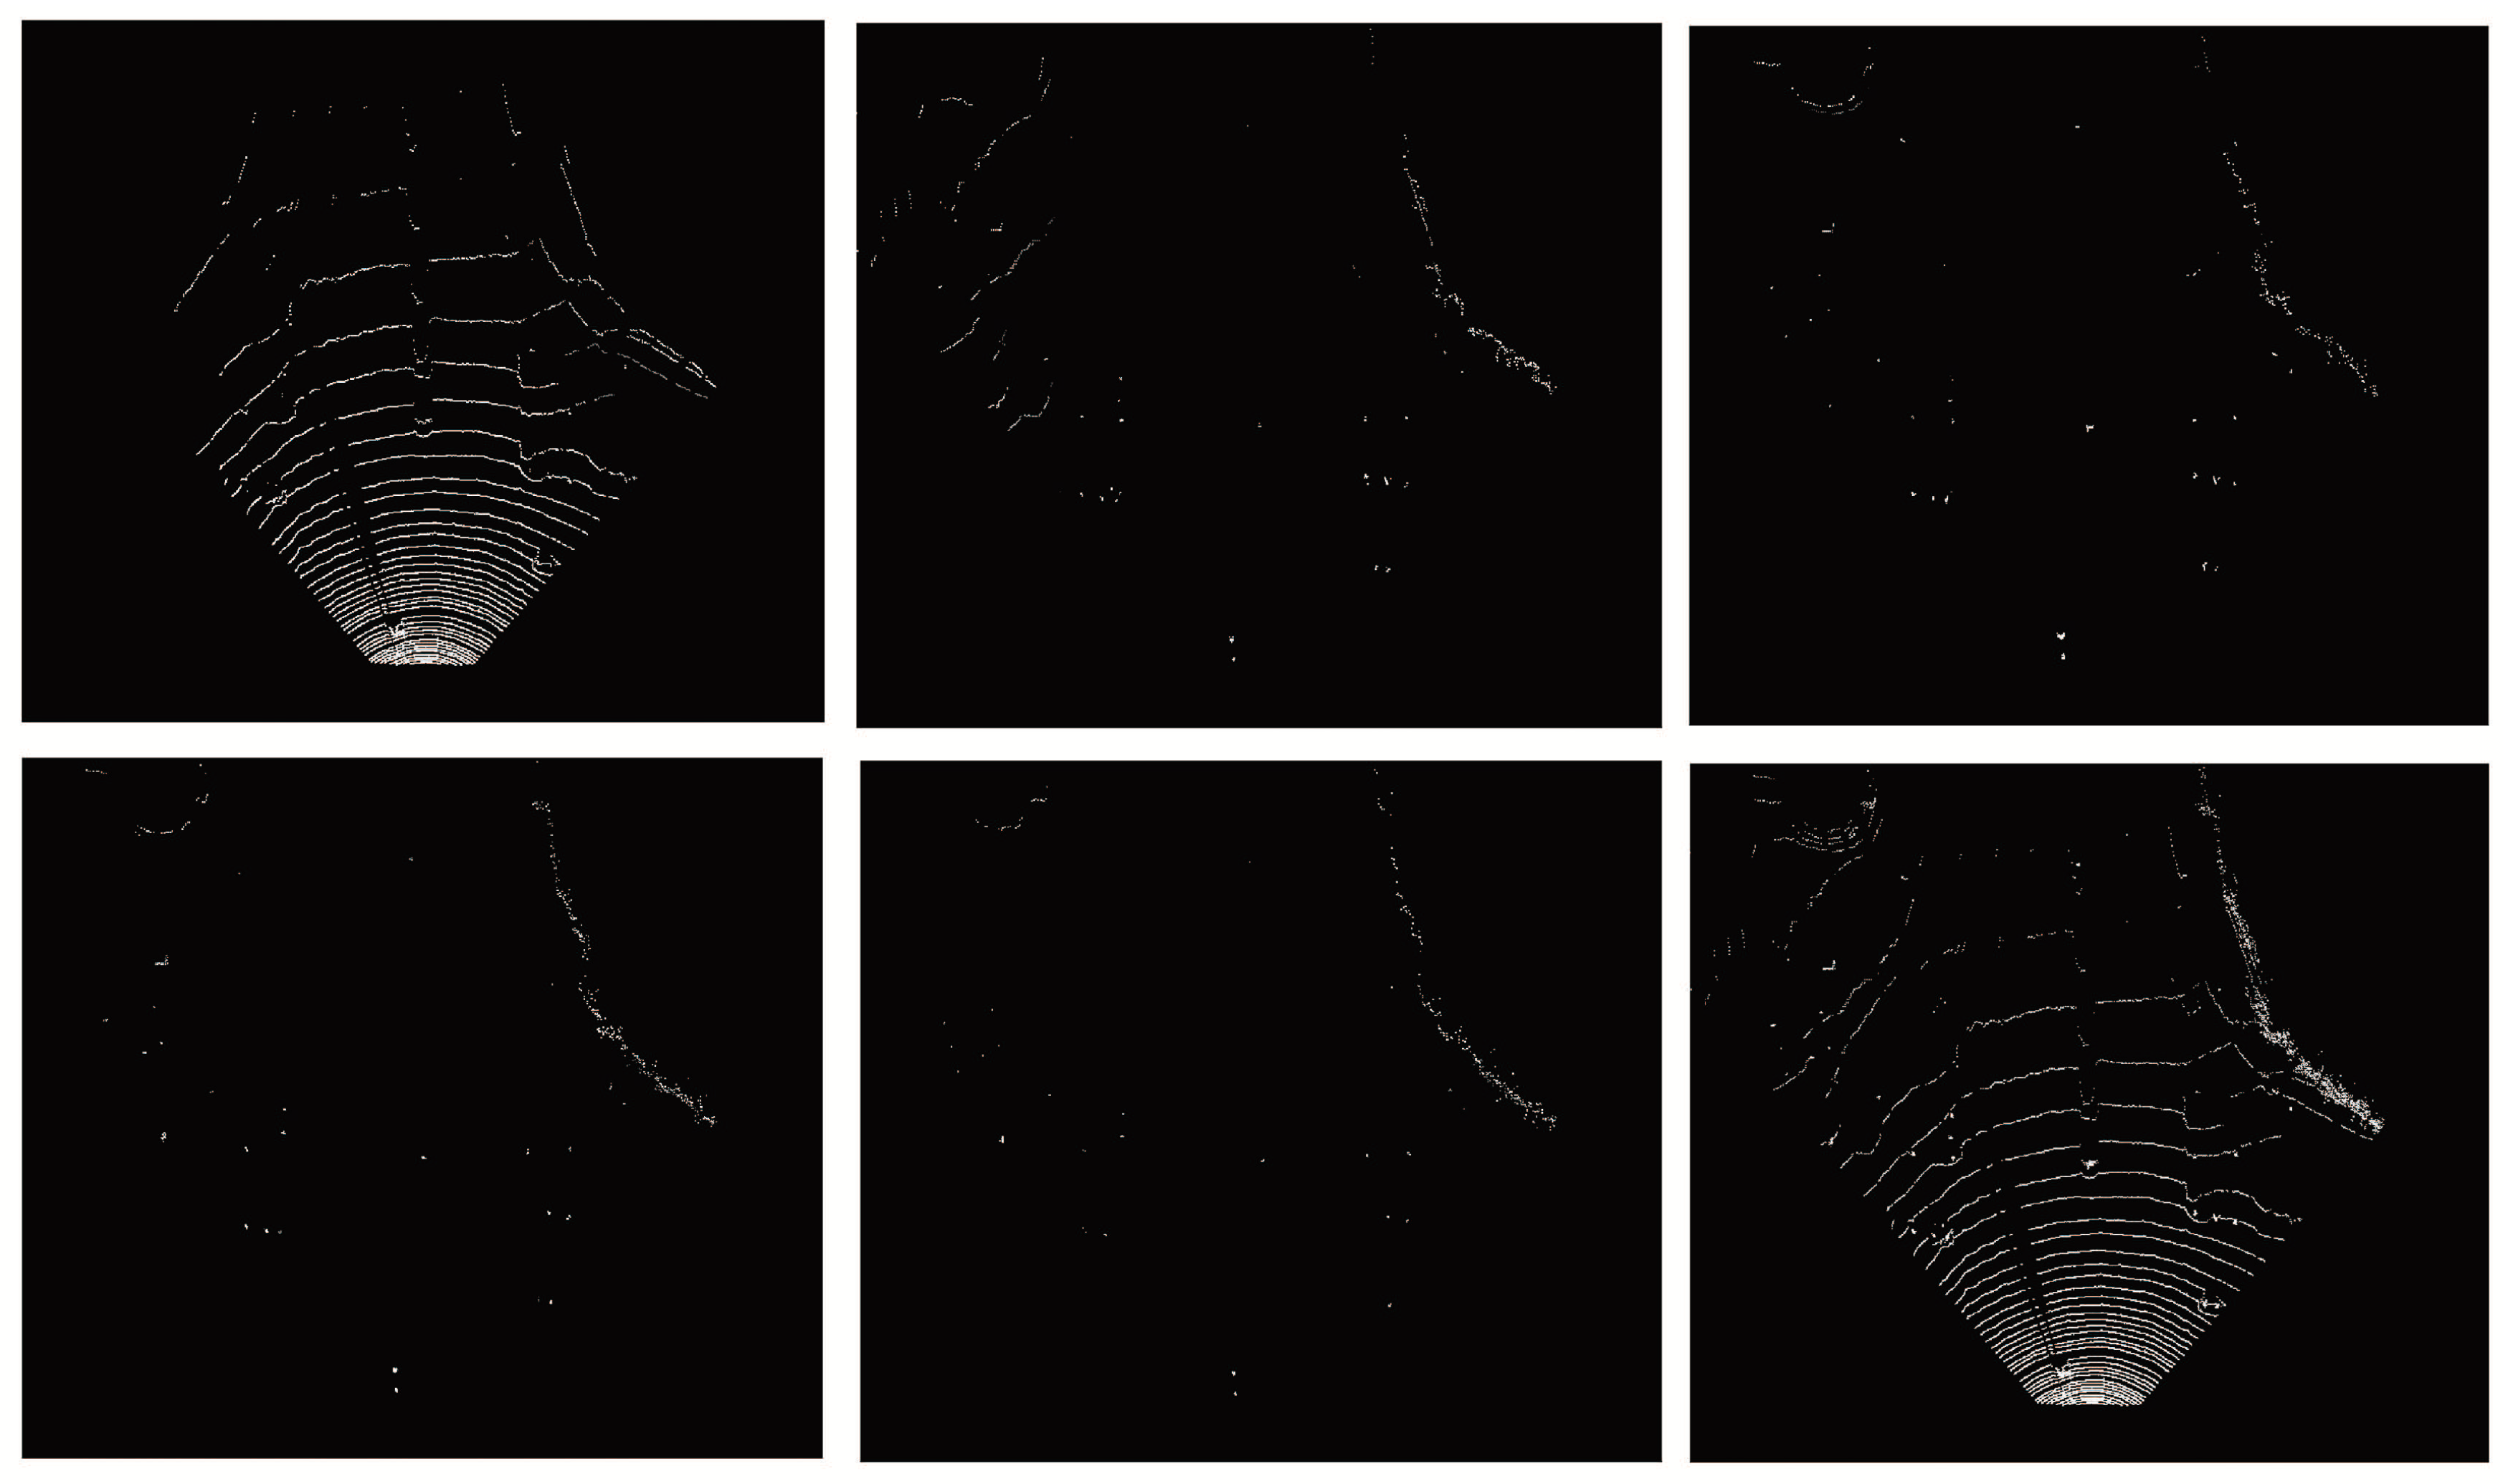
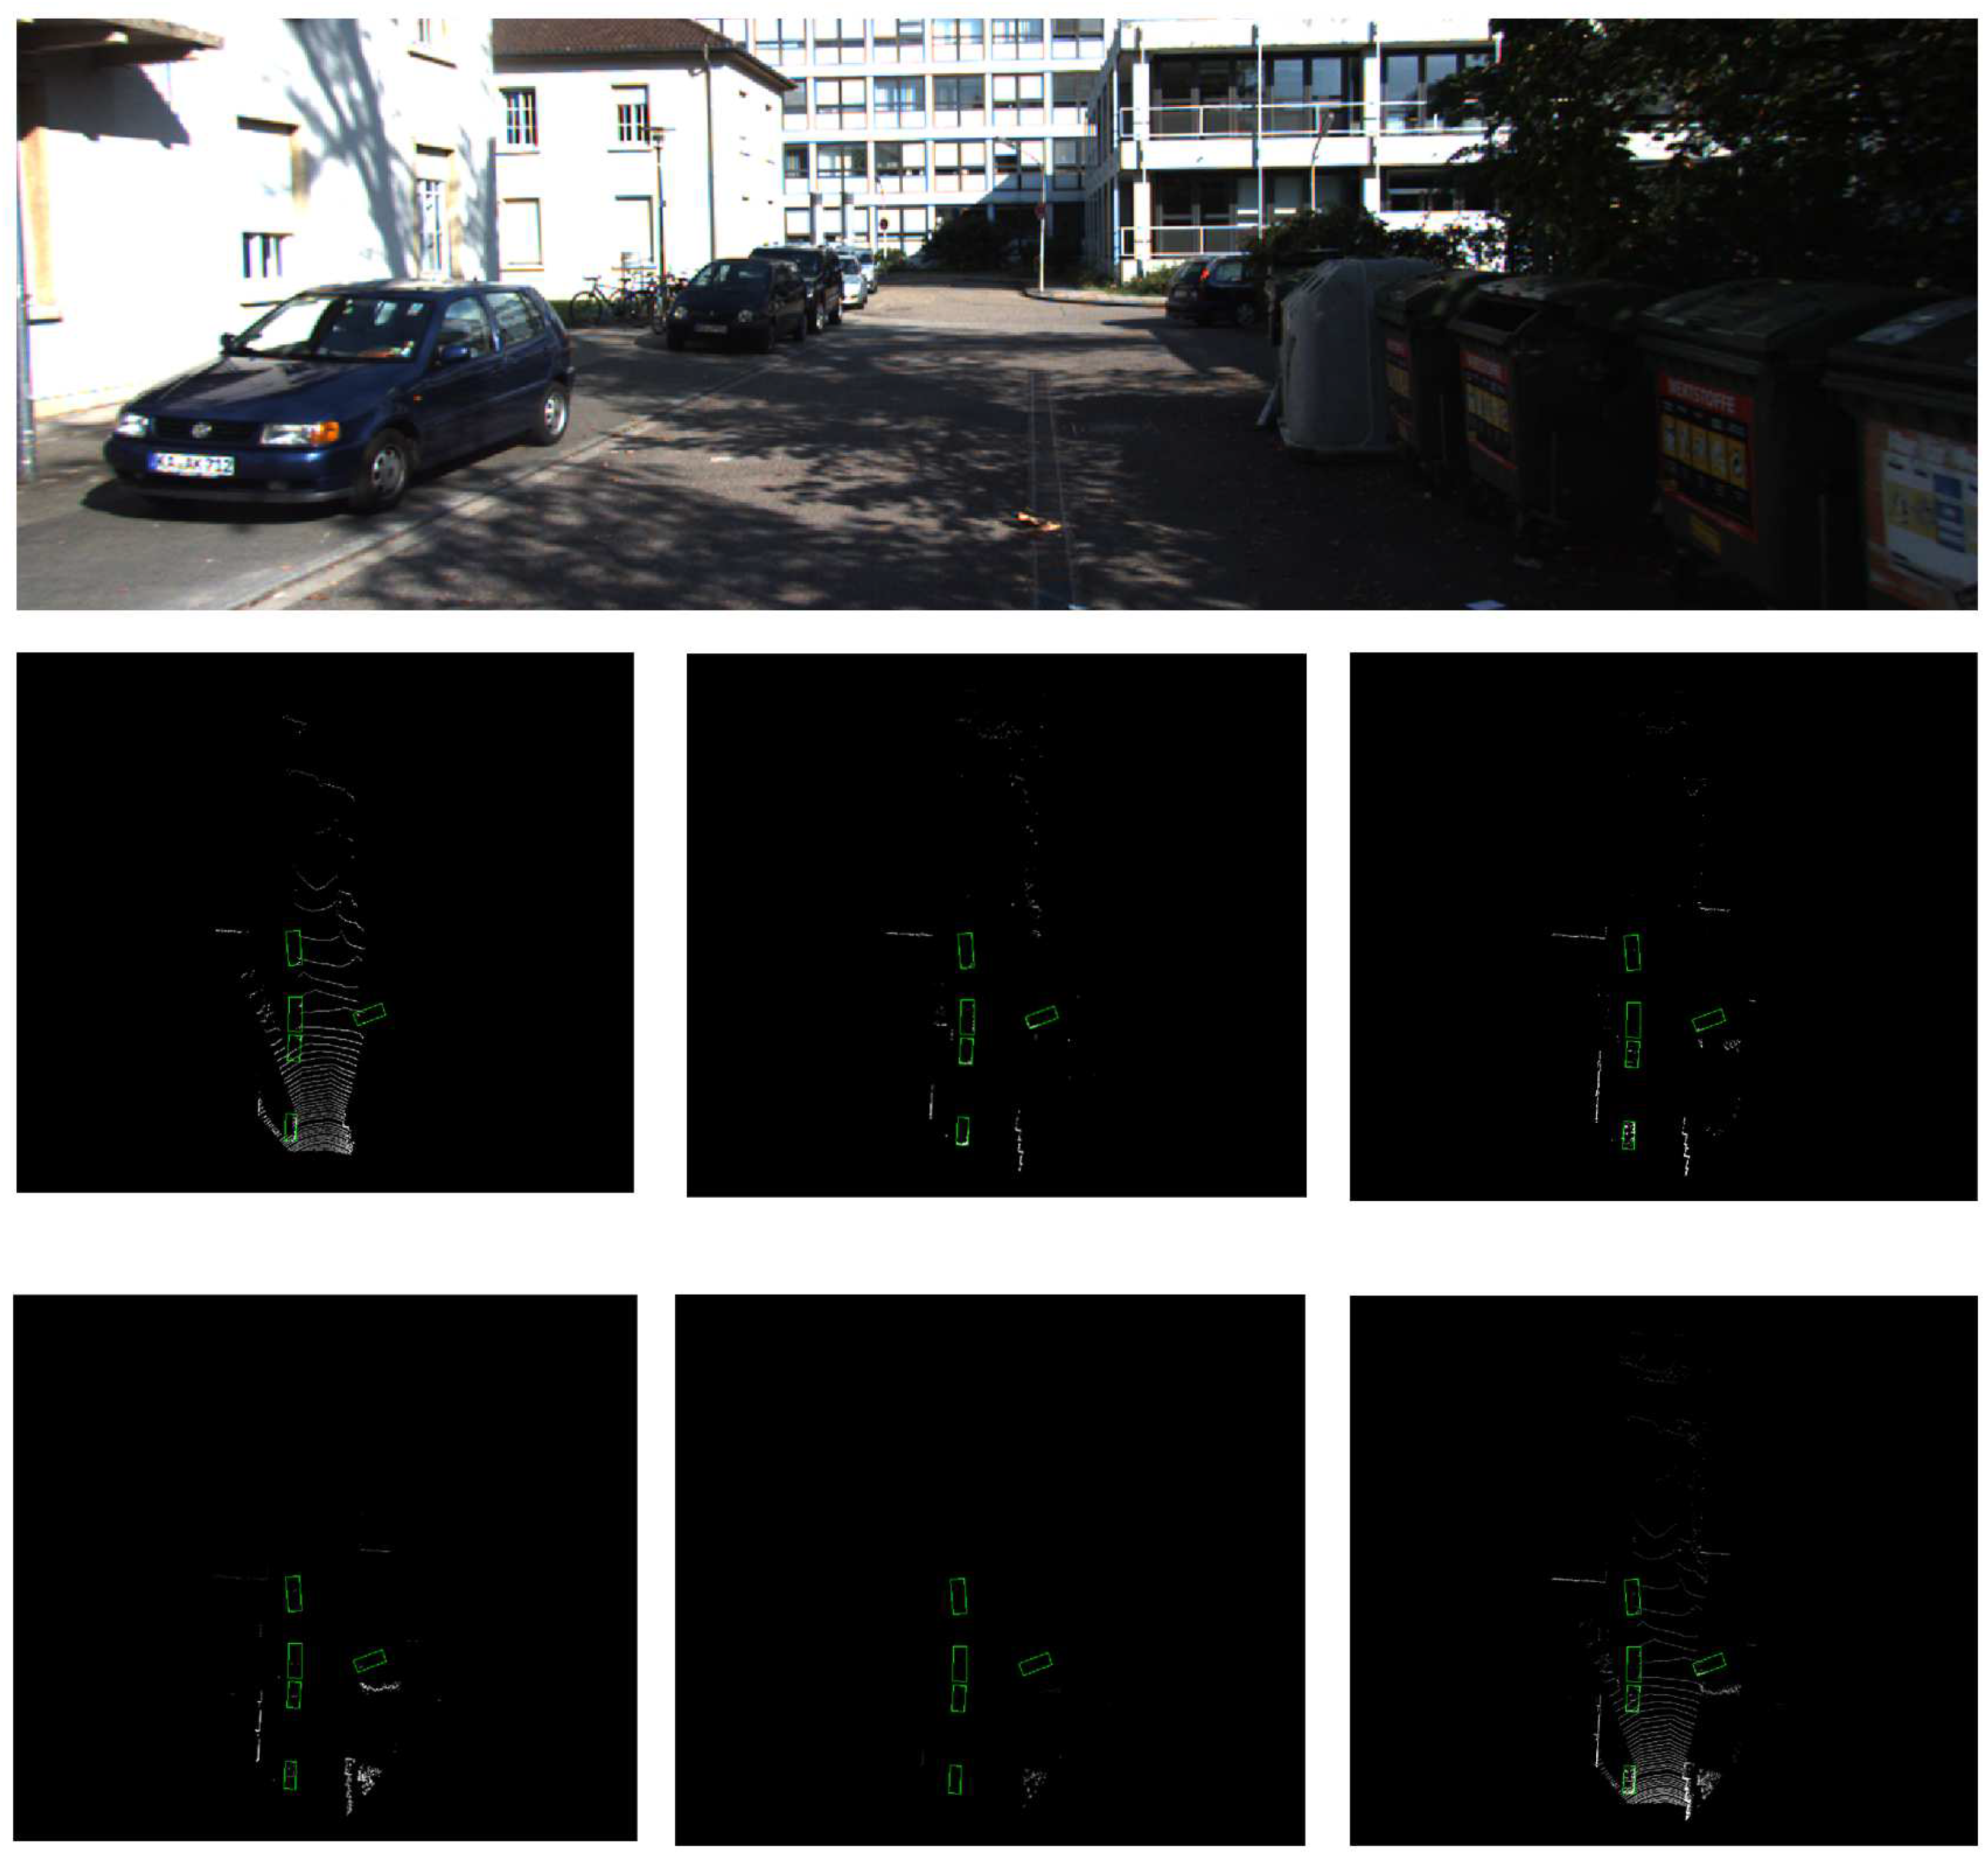
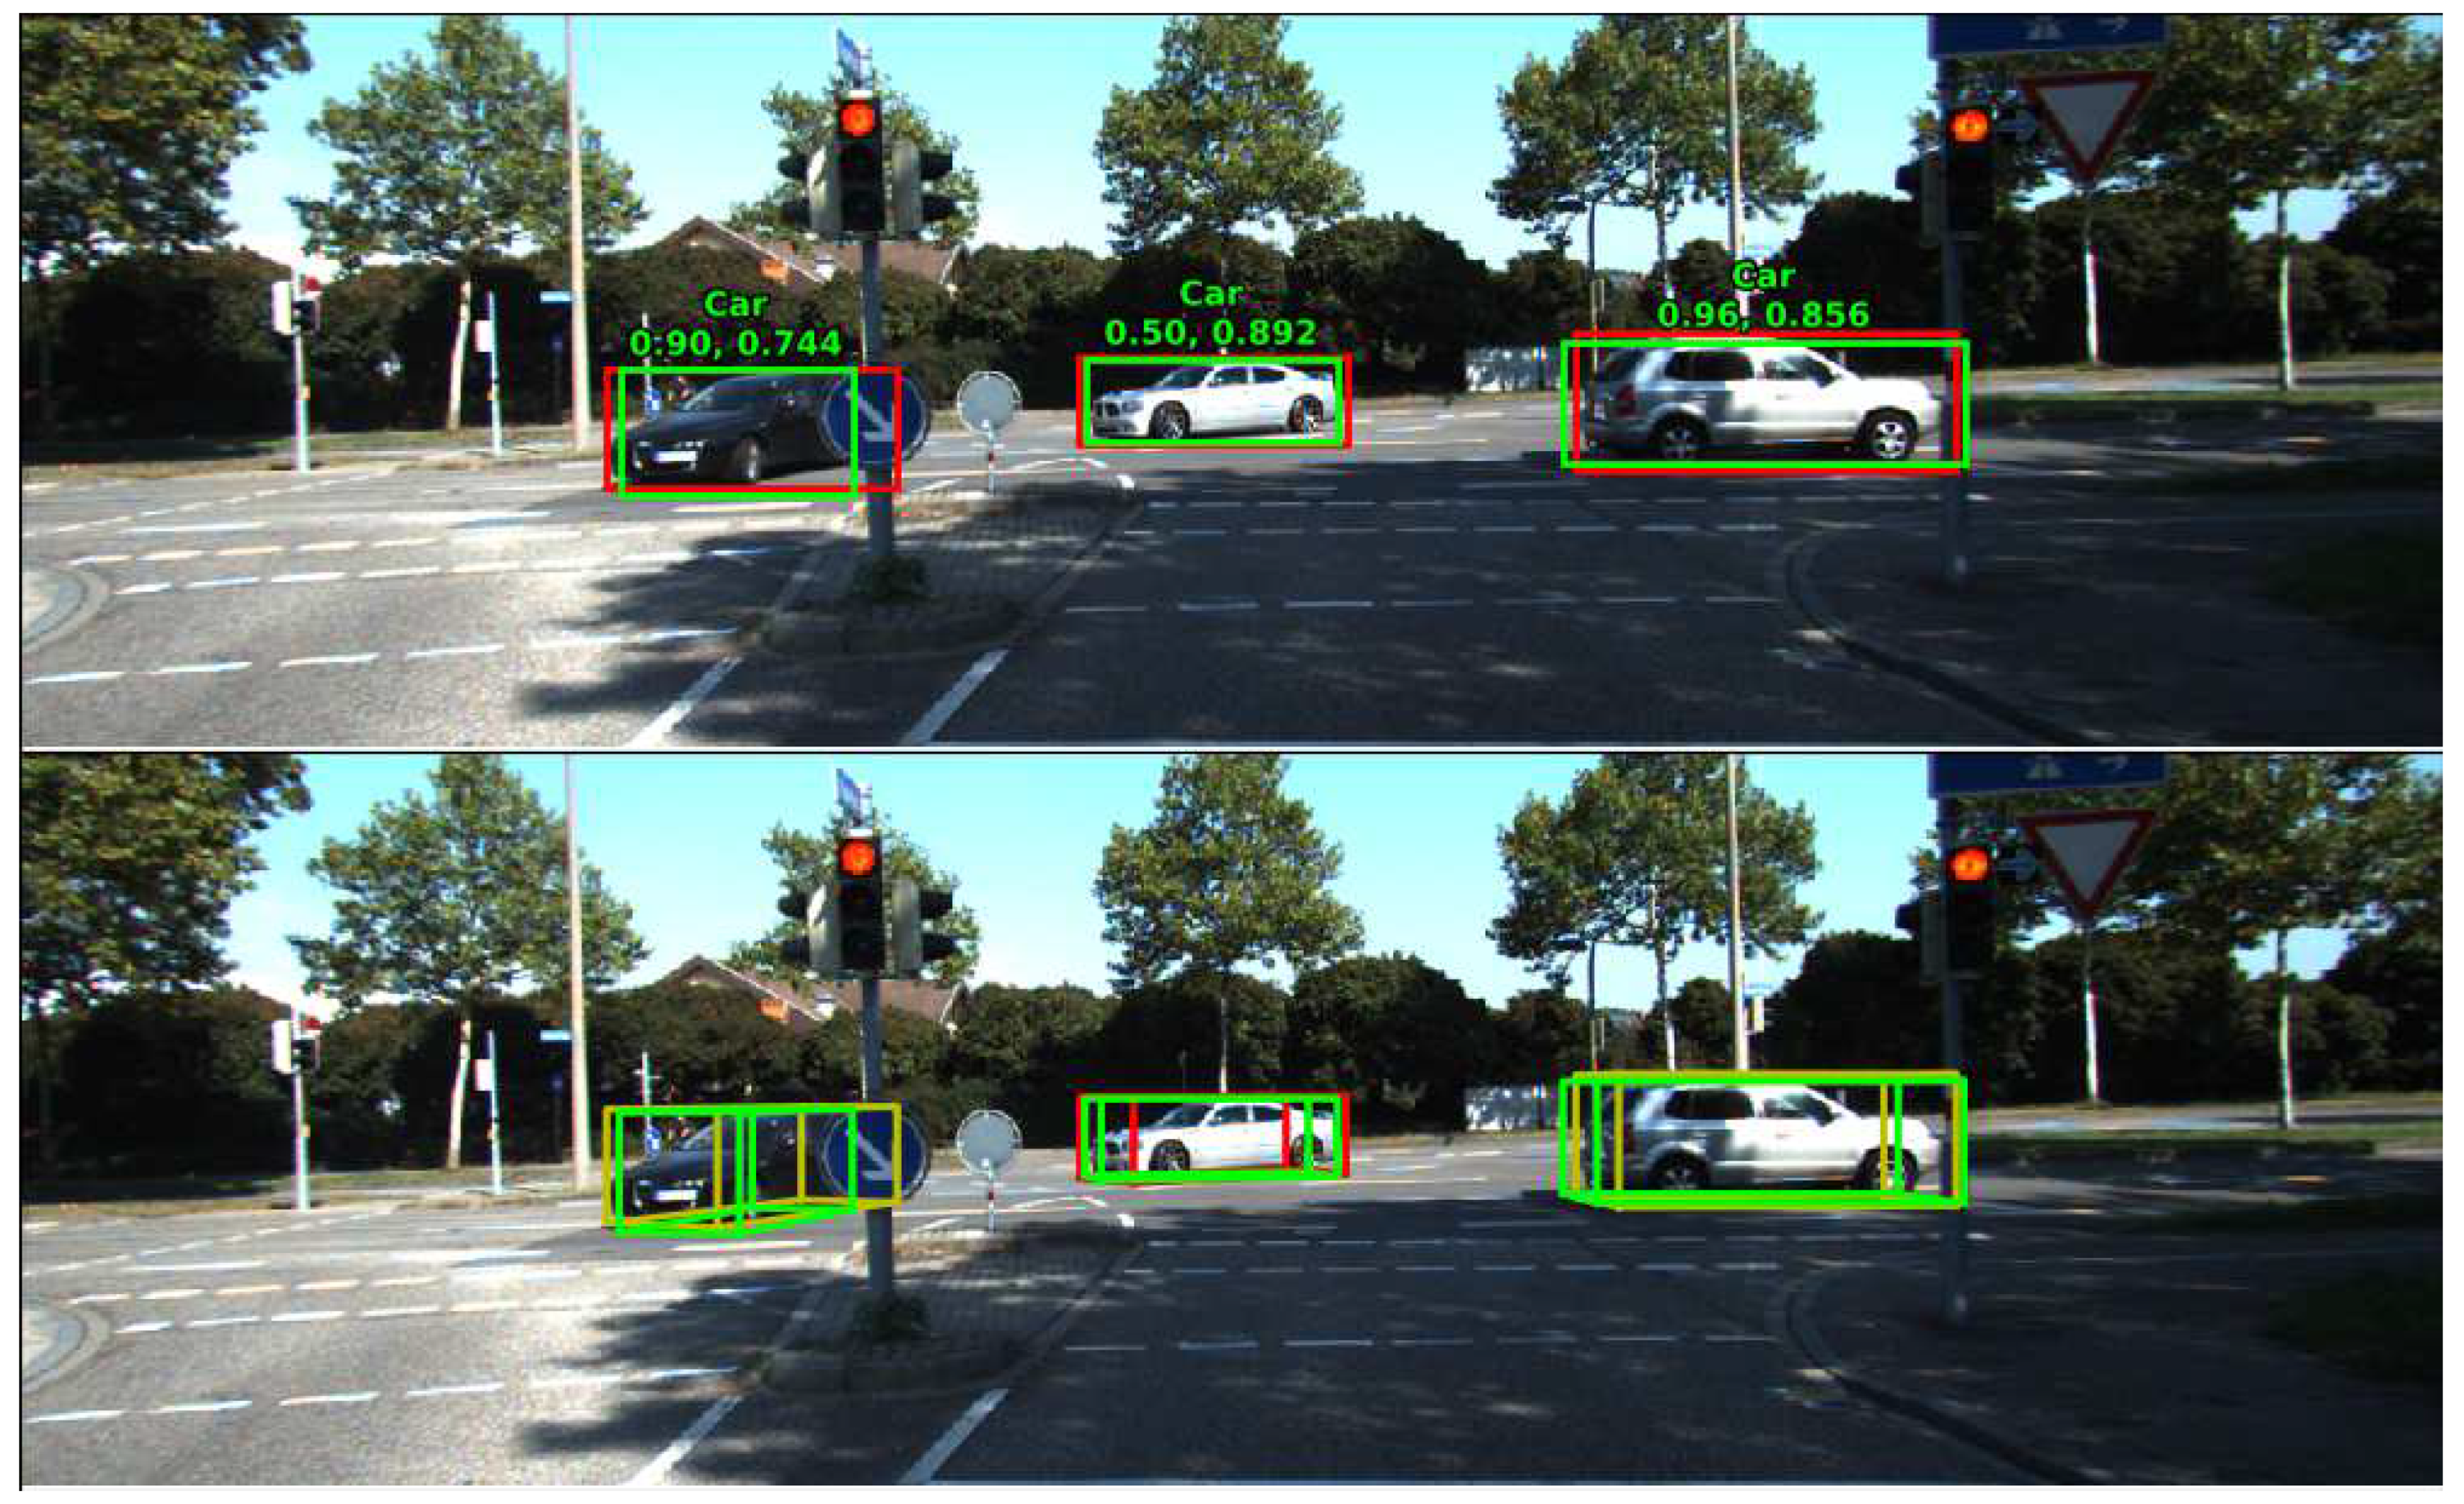
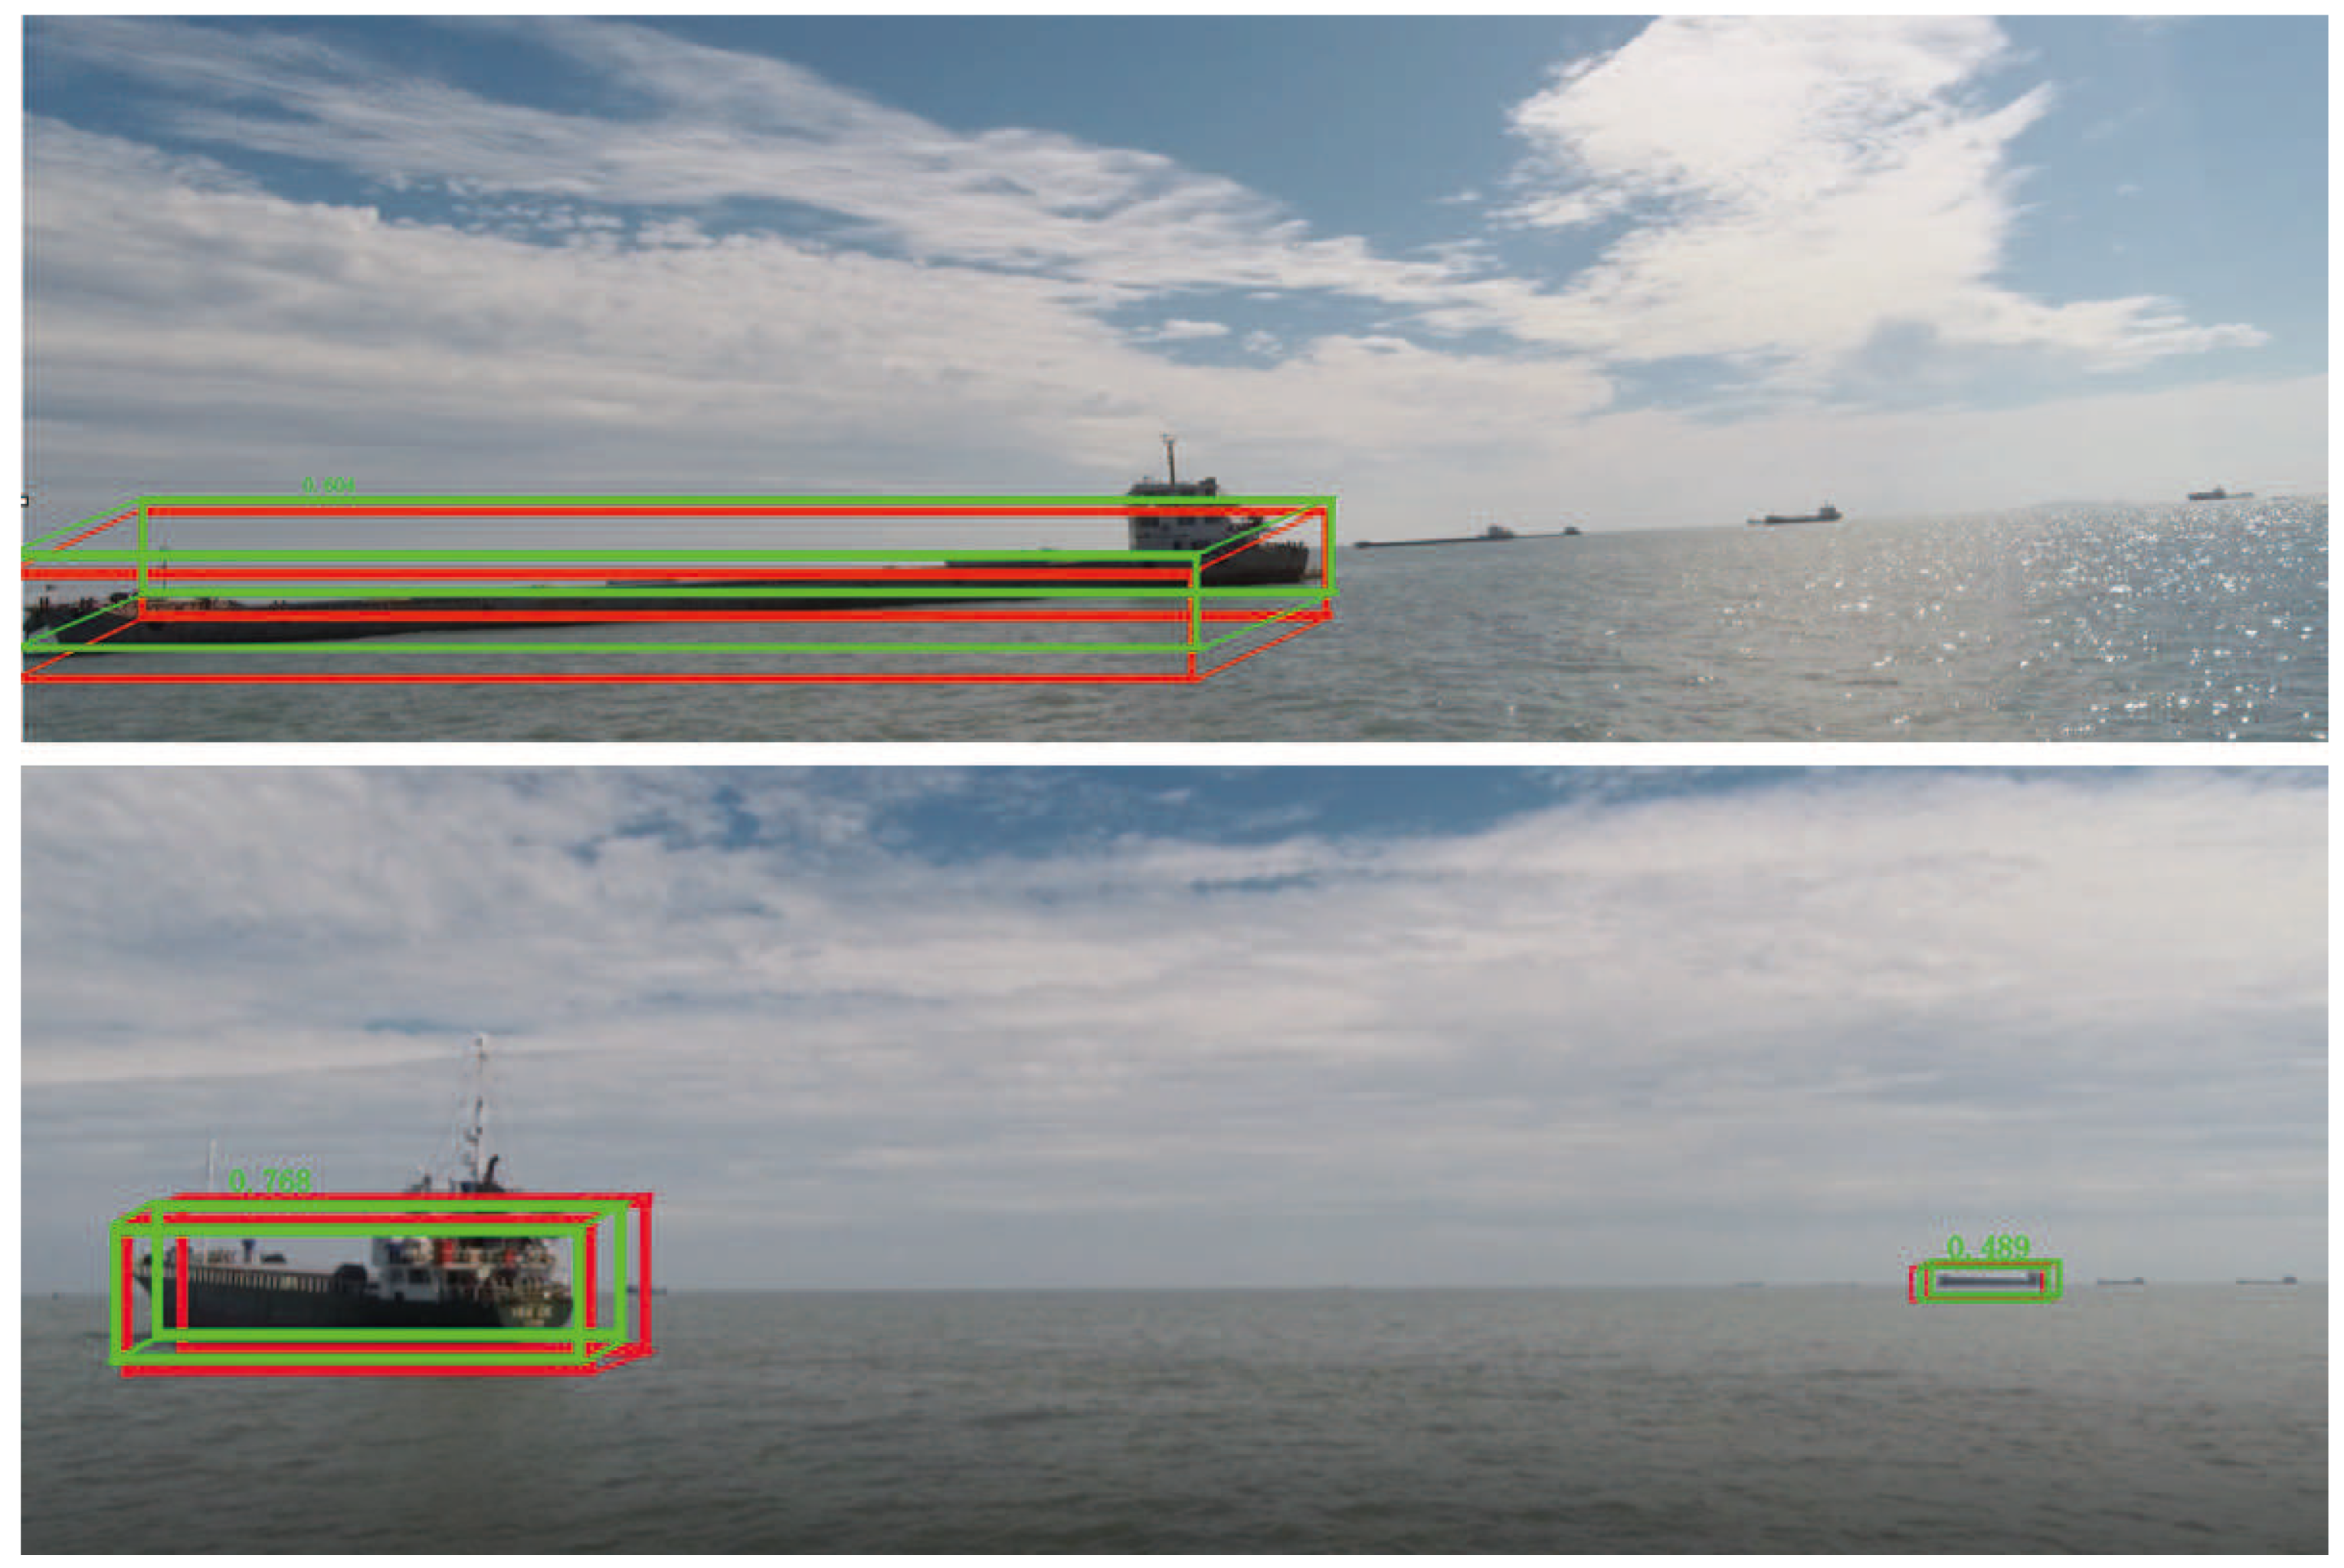
  • Analysis of Detection Results
    Figure 5 shows the detection results in the six channels of BEV. Our model worked well in medium- and short-range cars. Although the longer distance cars have fewer points, our model still performed well. We were surprised to find that the car’s directional regression was also excellent. These results prove the effectiveness of our model. Figure 6 demonstrates the detection results projected onto the 2D images.
  • Runtime and Memory Requirements
    We used several parameters to assess the computational efficiency and the memory requirements of the proposed network. Our object detection architecture employed roughly 52.04 million parameters. We significantly reduced the number of parameters compared with the method in [6], the second stage detection network of which has three fully connected layers. Because we chose the Resnet-50 with more layers, our parameter number was higher than the method in [12]. Each frame was processed in 0.14 s on Titan X and 0.12 s in 2080TI. The inference time of the network for each picture was 90 ms at 2080TI.
  • Ablation Studies
    As shown in Table 4 and Table 5, we first compared our proposed Deep Fusion Detection Network with early fusion method. In the same case that our modified Resnet-50 feature extractor was used, the average precision of our Deep Fusion Detection Network in 3D boxes and BEV boxes was higher than that of the earlier fusion method. Especially in BEV boxes, our networks performed best, about 10% better. To study the contribution of our proposed feature extractor, we replaced the Resnet-50 with the VGG16 used in [6,12] for comparison. Our test results were also slightly higher than VGG16.

4.2. Evaluation on the Offshore Marine Environments Dataset

We captured many images and point cloud data from a USV in a real offshore marine environment. We divided the sample data into training set and verification set in a 1:1 ratio. Training set data included cruise ships, sailboats and fishing boats. After marking the ground truth of each image, random sampling was applied to generate positive samples and negative samples. When the IoU of random sampling was greater than 0.5, a positive sample was generated. Similarly, negative samples were generated in the same way, while IoU was less than 0.3 and had basic facts. Considering the symmetry of the object, mirror samples were generated for each positive sample and negative sample. For validation set data, the scenarios that USV faces in a real-world natural environment were included. Finally, we tested our algorithms on these challenging datasets to demonstrate the efficiency and accuracy of our network.
We applied the network to our own dataset of maritime ships, as shown in Figure 7. In the case of 300 proposals in one figure, we drew recall under different IoU thresholds. In particular, when the IoU was 0.25, recall reached 84%. When the IoU was 0.5, ourrecall reached 67%, which indicates that the image and radar fusion learning network had a huge advantage in the case of large numbers of invalid marine image information.
It can be concluded from the BEV picture (Figure 8) and 3D detection picture (Figure 9) that our method could obtain accurate three-dimensional position, size and direction. Finally, we compared our network with DPM algorithm with regard to accuracy and time, as shown in Table 6. The statistical results show that our network haD higher accuracy rate and lower false alarm rate, while maintaining higher efficiency.

5. Conclusions

We propose a 3D object detection Deep Neural Network for USVs based on multi-modality sensor fusion. Our network utilizes lidar point cloud and image data to generate 3D proposals. The Deep Neural Network is used for feature extraction. Then, deep fusion and object detection are carried out. Our network is significantly superior to the traditional approaches in the dataset that are collected in offshore waters. The evaluation on the challenging KITTI benchmark demonstrated improvement as well. In the future, we will use more datasets to improve and test the performance of the algorithm. Furthermore, we will improve our network to carry out distributed work to adapt to the working environment of USVs.

Author Contributions

Data curation, T.L.; Project administration, H.L.; Resources, H.Q.; Software, H.Q.; Supervision, Z.W.; Writing—original draft, Y.W.

Funding

This research was funded by Department of Science and Technology of Shandong Province grant number 2016ZDJS09A01, Qingdao Municipal Science and Technology Bureau grant number 17-1-1-3-jch.

Acknowledgments

We sincerely thank Qingdao Beihai Shipbuilding Heavy Industry Co. for assisting in the construction of USV. We gratefully acknowledge the support of NVIDIA Corporation with the donation of the Titan X Pascal GPU used for this research.

Conflicts of Interest

The authors declare no conflict of interest.

References

  1. Manley, J.E. Unmanned surface vehicles, 15 years of development. In Proceedings of the OCEANS 2008, Quebec City, QC, Canada, 15–18 September 2008; pp. 1–4. [Google Scholar]
  2. Sinisterra, A.J.; Dhanak, M.R.; Von Ellenrieder, K. Stereovision-based target tracking system for USV operations. Ocean Eng. 2017, 133, 197–214. [Google Scholar] [CrossRef]
  3. Liu, Z.; Zhang, Y.; Yu, X.; Yuan, C. Unmanned surface vehicles: An overview of developments and challenges. Annu. Rev. Control 2016, 41, 71–93. [Google Scholar] [CrossRef]
  4. Wolf, M.T.; Assad, C.; Kuwata, Y.; Howard, A.; Aghazarian, H.; Zhu, D.; Lu, T.; Trebi-Ollennu, A.; Huntsberger, T. 360-degree visual detection and target tracking on an autonomous surface vehicle. J. Field Robot. 2010, 27, 819–833. [Google Scholar] [CrossRef]
  5. Cai, Z.; Fan, Q.; Feris, R.S.; Vasconcelos, N. A unified multi-scale deep convolutional neural network for fast object detection. In Proceedings of the European Conference on Computer Vision, Amsterdam, The Netherlands, 11–14 October 2016; pp. 354–370. [Google Scholar]
  6. Chen, X.; Ma, H.; Wan, J.; Li, B.; Xia, T. Multi-view 3d object detection network for autonomous driving. IEEE CVPR 2017, 1, 3. [Google Scholar]
  7. He, K.; Zhang, X.; Ren, S.; Sun, J. Deep residual learning for image recognition. In Proceedings of the IEEE Conference on Computer Vision and Pattern Recognition, Las Vegas, NV, USA, 27–30 June 2016; pp. 770–778. [Google Scholar]
  8. Li, Y.; Pirk, S.; Su, H.; Qi, C.R.; Guibas, L.J. Fpnn: Field probing neural networks for 3d data. In Proceedings of the Advances in Neural Information Processing Systems, Barcelona, Spain, 5–10 December 2016; pp. 307–315. [Google Scholar]
  9. Qi, C.R.; Su, H.; Mo, K.; Guibas, L.J. Pointnet: Deep learning on point sets for 3D classification and segmentation. In Proceedings of the 2017 IEEE Conference on Computer Vision and Pattern Recognition (CVPR), Honolulu, HI, USA, 21–26 July 2017; Volume 1, pp. 652–660. [Google Scholar]
  10. Engelcke, M.; Rao, D.; Wang, D.Z.; Tong, C.H.; Posner, I. Vote3deep: Fast object detection in 3d point clouds using efficient convolutional neural networks. In Proceedings of the 2017 IEEE International Conference on Robotics and Automation (ICRA), Singapore, 29 May–3 June 2017; pp. 1355–1361. [Google Scholar]
  11. Zhou, Y.; Tuzel, O. Voxelnet: End-to-end learning for point cloud based 3d object detection. arXiv, 2017; arXiv:1711.06396. [Google Scholar]
  12. Ku, J.; Mozifian, M.; Lee, J.; Harakeh, A.; Waslander, S. Joint 3d proposal generation and object detection from view aggregation. arXiv, 2017; arXiv:1712.02294. [Google Scholar]
  13. Qi, C.R.; Su, H.; Nießner, M.; Dai, A.; Yan, M.; Guibas, L.J. Volumetric and multi-view cnns for object classification on 3d data. In Proceedings of the IEEE Conference on Computer Vision and Pattern Recognition, Las Vegas, NV, USA, 27–30 June 2016; pp. 5648–5656. [Google Scholar]
  14. Hegde, V.; Zadeh, R. Fusionnet: 3d object classification using multiple data representations. arXiv, 2016; arXiv:1607.05695. [Google Scholar]
  15. Su, H.; Maji, S.; Kalogerakis, E.; Learned-Miller, E. Multi-view convolutional neural networks for 3d shape recognition. In Proceedings of the IEEE International Conference on Computer Vision, Santiago, Chile, 13–16 December 2015; pp. 945–953. [Google Scholar]
  16. Li, B.; Zhang, T.; Xia, T. Vehicle detection from 3d lidar using fully convolutional network. arXiv, 2016; arXiv:1608.07916. [Google Scholar]
  17. Liu, W.; Anguelov, D.; Erhan, D.; Szegedy, C.; Reed, S.; Fu, C.Y.; Berg, A.C. Ssd: Single shot multibox detector. In Proceedings of the European Conference on Computer Vision, Amsterdam, The Netherlands, 11–14 October 2016; pp. 21–37. [Google Scholar]
  18. Redmon, J.; Divvala, S.; Girshick, R.; Farhadi, A. You only look once: Unified, real-time object detection. In Proceedings of the IEEE Conference on Computer Vision and Pattern Recognition, Las Vegas, NV, USA, 27–30 June 2016; pp. 779–788. [Google Scholar]
  19. Girshick, R. Fast r-cnn. In Proceedings of the IEEE International Conference on Computer Vision, Santiago, Chile, 13–16 December 2015; pp. 1440–1448. [Google Scholar]
  20. Ren, S.; He, K.; Girshick, R.; Sun, J. Faster r-cnn: Towards real-time object detection with region proposal networks. IEEE Trans. Pattern Anal. Mach. Intell. 2017, 39, 1137–1149. [Google Scholar] [CrossRef] [PubMed]
  21. He, K.; Gkioxari, G.; Dollár, P.; Girshick, R. Mask r-cnn. In Proceedings of the 2017 IEEE International Conference on Computer Vision (ICCV), Venice, Italy, 22–29 October 2017; pp. 2980–2988. [Google Scholar]
  22. Aceto, G.; Ciuonzo, D.; Montieri, A.; Pescapé, A. Multi-classification approaches for classifying mobile app traffic. J. Netw. Comput. Appl. 2018, 103, 131–145. [Google Scholar] [CrossRef]
  23. Aceto, G.; Ciuonzo, D.; Montieri, A.; Pescapé, A. Traffic Classification of Mobile Apps through Multi-classification. In Proceedings of the GLOBECOM 2017-2017 IEEE Global Communications Conference, Singapore, 4–8 December 2017; pp. 1–6. [Google Scholar]
  24. González, A.; Vázquez, D.; López, A.M.; Amores, J. On-board object detection: Multicue, multimodal, and multiview random forest of local experts. IEEE Trans. Cybern. 2017, 47, 3980–3990. [Google Scholar] [CrossRef] [PubMed]
  25. Wang, J.; Wei, Z.; Zhang, T.; Zeng, W. Deeply-fused nets. arXiv, 2016; arXiv:1605.07716. [Google Scholar]
  26. Larsson, G.; Maire, M.; Shakhnarovich, G. Fractalnet: Ultra-deep neural networks without residuals. arXiv, 2016; arXiv:1605.07648. [Google Scholar]
  27. Long, J.; Shelhamer, E.; Darrell, T. Fully convolutional networks for semantic segmentation. In Proceedings of the IEEE Conference on Computer Vision and Pattern Recognition, Boston, MA, USA, 7–12 June 2015; pp. 3431–3440. [Google Scholar]
  28. Zeiler, M.D.; Krishnan, D.; Taylor, G.W.; Fergus, R. Deconvolutional networks. In Proceedings of the 2010 IEEE Computer Society Conference on Computer Vision and Pattern Recognition, San Francisco, CA, USA, 13–18 June 2010; pp. 2528–2535. [Google Scholar]
  29. Huang, J.; Rathod, V.; Sun, C.; Zhu, M.; Korattikara, A.; Fathi, A.; Fischer, I.; Wojna, Z.; Song, Y.; Guadarrama, S.; et al. Speed/accuracy trade-offs for modern convolutional object detectors. IEEE CVPR 2017, 4, 3296–3297. [Google Scholar]
  30. Geiger, A.; Lenz, P.; Urtasun, R. Are we ready for autonomous driving? the kitti vision benchmark suite. In Proceedings of the 2012 IEEE Conference on Computer Vision and Pattern Recognition (CVPR), Providence, RI, USA, 16–21 June 2012; pp. 3354–3361. [Google Scholar]
  31. Chen, X.; Kundu, K.; Zhu, Y.; Berneshawi, A.G.; Ma, H.; Fidler, S.; Urtasun, R. 3d object proposals for accurate object class detection. In Proceedings of the Advances in Neural Information Processing Systems, Montreal, QC, Canada, 7–12 December 2015; pp. 424–432. [Google Scholar]
Figure 1. The object detection architecture, where the blue part is proposal generation network and the red part is the deep fusion detection network.
Applsci 09 00535 g001
Figure 2. From top to bottom and left to right are the six channels of BEV.
Applsci 09 00535 g002
Figure 3. Modified Resnet-50 feature extractor.
Applsci 09 00535 g003
Figure 4. Modified Resnet-50 feature extractor.
Applsci 09 00535 g004
Figure 5. (Top) Image to be tested; (Middle) from left to right are the first three heigh feature maps; and (Bottom) the first two are height feature maps, and the last one is density feature map.
Applsci 09 00535 g005
Figure 6. (Top) The detection results are projected onto 2D images (the values are detection accuracy and IoU); and(Bottom) the 3D box is projected onto the image.
Applsci 09 00535 g006
Figure 7. From left to right: recall vs. IoU; and recall vs. proposals at IoU threshold of 0.25 and 0.5.
Applsci 09 00535 g007
Figure 8. Object detection result: 3D boxes are projected to the BEV.
Applsci 09 00535 g008
Figure 9. Quality of 3D detection result.
Applsci 09 00535 g009
Table 1. 3D detection performance: Average precision (AP) (in %) for 3D boxes.
MethodEasyModerateHard
MV3D71.2962.6856.56
F-Point83.7670.9263.65
AVOD84.4174.4468.65
Ours88.1974.5465.86
Table 2. Bird’s eye view detection performance: Average precision (AP) (in %) for BEV boxes.
MethodEasyModerateHard
MV3D86.5578.1076.67
F-Point88.1684.0276.44
Ours88.7379.0777.89
Table 3. Average Orientation Similarity (AOS) (in %) at 0.7 3D IoU.
MethodEasyModerateHard
Deep3DBox5.844.093.83
MV3D52.7443.7539.86
AVOD84.1974.1168.28
Ours84.6274.6672.69
Table 4. Average precision (AP) (in %) for 3D boxes for ablation studies.
MethodEasyModerateHard
Modified Resnet-50 +early85.4372.2257.79
VGG16+ Deep Fusion84.3773.0957.78
Modified Resnet-50+Deep Fusion88.1974.5465.86
Table 5. Average precision (AP) (in %) for BEV boxes for ablation studies.
MethodEasyModerateHard
Modified Resnet-50 +early75.5566.4158.77
VGG16+ Deep Fusion88.2977.4976.41
Modified Resnet-50+Deep Fusion88.7379.0777.89
Table 6. Comparison of accuracy and time.
MethodAccuracyTime
DPM54%16 s
Ours78%120 ms

