Article

Effect of Scanning Strategy During Selective Laser Melting on Surface Topography, Porosity, and Microstructure of Additively Manufactured Ti-6Al-4V

by
Emilie Hørdum Valente
1,*,
Carsten Gundlach
2,
Thomas L. Christiansen
1 and
Marcel A. J. Somers
1
1
Department of Mechanical Engineering, Technical University of Denmark, Produktionstorvet b.425, 2800 Kgs. Lyngby, Denmark
2
Department of Physics, Technical University of Denmark, Fysikvej b.310, 2800 Kgs. Lyngby, Denmark
*
Author to whom correspondence should be addressed.
Appl. Sci. 2019, 9(24), 5554; https://doi.org/10.3390/app9245554
Submission received: 8 November 2019 / Revised: 4 December 2019 / Accepted: 6 December 2019 / Published: 17 December 2019
(This article belongs to the Section Mechanical Engineering)

Abstract

:
The effect of the scanning strategy during selective laser melting (SLM) of Ti-6Al-4V was investigated. An optimized cellular scan strategy (island scan modeled) was compared to a simple cellular scan strategy (island scan stripes) and a simple antiparallel line scanning strategy (line scan). Surface texture was investigated by optical three-dimensional (3D) surface measurements, which when combined with light optical microscopy (LOM), revealed deflections caused by the thermal stresses during the build process. Elevated edges caused by the edge-effect dominate the surface texture of all investigated specimens. The scanning strategy determines the surface texture, and the lowest surface roughness was obtained by the line scan strategy. Porosity was investigated with X-ray computed tomography-imaging. Mainly spherical porosity was observed for the line scan and island scan modeled specimens, while the island scan stripes strategy showed more lack-of-fusion defects and a higher total porosity amount. Microstructure was investigated with LOM and scanning electron microscopy (SEM). The microstructure in Ti-6Al-4V was largely martensitic α’ and prior β grains. The morphology is different for the various scan strategies, and decomposition of α’ into lamellar α/β was observed in the bottom part of the island scan specimen. Accordingly, the hardness decreased in the decomposed part of the specimen.

Graphical Abstract

1. Introduction

Even though additive manufacturing (AM) has been investigated for over 50 years, AM of metals is still a fairly recent and fast developing field. AM has major advantages over subtractive manufacturing, most notably the design freedom and important reductions of material waste (like chips). In particular, titanium components will benefit significantly from AM, because not only can the materials’ costs be reduced importantly by saving material, but also expensive (subtractive) manufacturing methods for titanium can be optimized. These drivers, together with the good welding properties of Ti-6Al-4V, explain why Ti-6Al-4V is among the most investigated alloys in metals AM [1,2,3]. One of the popular AM methods for metals is selective laser melting (SLM), which is a powder bed method using a laser to selectively melt the powder in a protective atmosphere. The component is built layer-by-layer on top of a build plate [4,5].
The microstructure of SLM manufactured Ti-6Al-4V is mainly α’ martensite that has formed within elongated (prior) β grains, which extend over several consecutively deposited layers, as opposed to the different α-β microstructures found in electron beam melted or wrought Ti-6Al-4V [6,7]. The martensitic transformation indicates fast cooling conditions, while the elongation of the β grains in the direction of the heat flux (the temperature gradient) develops by repeated epitaxial growth on previously deposited titanium [8,9,10]. Thijs et al. described that the grain growth direction is perpendicular to the local conductive heat transfer [11]. On a micro-scale, the maximum thermal gradient normal to the melt pool rather than the macro-scale heat flow is expected to determine the direction of the advancing solid/liquid interface [8]. In addition to the maximum thermal gradient, Simonelli et al. found an influence of the scanning strategy on the texture developing upon solidification, such that the β phase has a strong {100} texture along the main growth direction [12].
The morphology of martensite has been shown to depend on both the processing parameters and the specimen geometry [9,10,11]. Yang et al. described the microstructure as hierarchical, consisting of primary, secondary, tertiary, and quaternary α’ martensites [13]. Xu et al. observed a dependence of the microstructure on the distance to the heat sink. In a specimen built under conditions that were optimized for decomposition, the microstructure changed from martensitic in the last few deposited layers, to ultrafine lamellar α/β with changing morphology for the investigated 10 mm specimen height [14]. The in-situ decomposition of α’ martensite into ultrafine lamellar α/β during SLM is desired for increased strength and ductility. Later, Xu et al. [15] reported processing conditions resulting in a reduced thermal gradient, leading to a fully lamellar microstructure in equiaxed prior β grains. Accordingly, improved ductility was achieved, while the coarser lamellae lead to a decrease in tensile strength, as compared to the ultrafine lamellar microstructure presented in their earlier work presented in [14].
Yang et al. [9] showed how the molten pool mode influences the microstructure. Conductive mode, which is characterized by a U-shaped (rounded) melt-pool, leads to a mainly martensitic microstructure, while keyhole mode, characterized by a V-shaped melt-pool (vertically elongated, cone like), leads to a microstructure consisting of both martensitic α’ and α/β lamellae. Keyhole-mode manufactured specimens have superior ductility, while conductive mode specimens have superior formability. Unfortunately, keyhole mode entails vaporization of material, which potentially can lead to entrapped gas and porosity during solidification, particularly when the evaporation rate is high and the melt pool is deep [9].
On the basis of comparable pore size distributions in powder and laser powder-bed parts, Cunningham et al. [16] suggested that most of the small (<15 µm) spherical pores originate from the powder, except for parts produced in keyhole mode. The fraction of small spherical pores was lower in the SLM parts than in the powder and was further reduced by remelting, as it provides the possibility for entrapped gas to escape. The so-called trapped gas pores were also suggested to have their origin in the gaseous atmosphere in laser powder-bed AM.
Another challenging feature of SLM is the occurrence of thermal stresses during the part building. Thermal stresses are a result of thermal gradients in the built stage and are therefore strongly related to the processing conditions. Depending on the geometry, such stresses can cause shape changes during the SLM process and residual stresses in the as-built component. The latter can lead to deformation upon removing the component from its constraining support or the base plate [17]. Kruth et al. [5] investigated the curvature of rectangular specimens after different island based scan strategies and found more deformation after a least heat influence (LHI) scan order. They proposed that the observed effects are caused by steeper thermal stress gradients as a consequence of less preheating for the LHI scan strategy. Cheng et al. [18] modeled the influence of different scan strategies on specimen deformation and residual stress, and found that the in-out and out-in spiral strategies result in a positive and negative deformation, respectively. Ma and Bin [19] proposed a model for a single layer plate, showing how the distortion occurring during laser scanning is more significant than those caused by (the release of) residual stresses.
Recently, Mohanty and Hattel [20] utilized a low-fidelity modeling technique for optimization of SLM scanning strategies. They presented a method for generating optimized cellular scanning strategies. The scanning strategies were optimized with regard to introducing least residual stress in the as-built component. In the present work we investigate the influence of their cellular scan strategy in SLM parts on surface topography, porosity, and microstructure.

2. Materials and Methods

Three rectangular cuboids with dimensions of 10 × 10 × 1.25 mm3 were manufactured by SLM using a MCP Realizer SLM 250 from Grade 5 titanium powder provided by SLM Solutions. According to the certificate from the provider the powder has the following composition: 6.34 wt.% Al, 4.1 wt.% v, 0.183 wt.% Fe, 0.140 wt.% O, 0.005 wt.% C, 0.007 wt.% N, 0.0020 wt.% H, and the powder size ranges from 20 to 63 µm. The specimens were built on support structures using three different scan strategies (Figure 1):
  • Line scanning using antiparallel stripes,
  • Island scanning using parallel-interlaced-reversed stripes and
  • Island scanning using a modeled pattern of six scan types:
    • out-in spiral
    • in-out spiral
    • antiparallel stripes
    • parallel stripes
    • parallel-interlaced stripes
    • parallel-interlaced-reversed stripes.
The scan pattern in Figure 1c was simulated by Mohanty and Hattel [21] for a 10 × 10 mm2 square using a 20 × 20 grid (i.e., an island size of 0.5 × 0.5 mm2). The full pattern is shown in Figure S1. The island scanning sequence for both island scanning stripes and island scanning modeled was the same and kept constant through the build. A randomized processing sequence was applied, as generated by Mohanty and Hattel [21], as shown in Figure S2. The processing parameters were kept constant, using a laser power of 119 W, scan speed of 800 mm s−1, energy density of 37 J mm−3, hatch distance of 80 µm, and layer thickness of 50 µm.
X-ray tomography of the as-built specimens was performed in a ZEISS Xradia 410 Versa, using a voltage of 100 kV, a power of 10 W, and a HE1 filter. For each specimen, two computed tomography (CT) scans were performed: one full specimen using the large field of view (LFOV) objective, taking 1601 projections with an 8 s exposure time, and one with 4× zoom objective, taking 3201 projections with a 15 s exposure time. The projection images were reconstructed using the inbuilt software which is based on an implementation of the Feldkamp-Davis-Kress (FDK) algorithm [22]. The resulting reconstructed volumes had a voxel size of 13.5 µm and 3.4 µm, respectively, giving detection limits of around 25 µm and 7 µm. Matlab and Avizo 9 were used for porosity analysis. For pore statistics, pores with volumes below four times the voxel volume were removed from the data. The pores were divided into spherical and irregular pores, using the sphericity shape factor:
Ψ = π 1 3 ( 6 V p ) 2 3 A p ,
where Vp and Ap are the volume and surface area of the pore, respectively. A cut-off value of 0.7 was used, where pores with Ψ > 0.7 were treated as spherical, while pores with Ψ < 0.7 were treated as irregular.
The roughness of the top surfaces of the specimens was measured using an Alicona Infinite Focus microscope (IFM) with G4 5× objective and evaluated using SPIP software. No form removal was employed in the calculations of three-dimensional (3D) surface roughness, S. Three different areal amplitude parameters were calculated: arithmetic mean height, Sa; root mean square height, Sq; and maximum height, Sz.
The SLM specimens were cut along the x–z and y–z directions, 2 mm away from the edges, and subsequently embedded for microstructural investigation and hardness testing on the cross sections. The specimens were prepared with conventional mechanical grinding (#500-#1000-#4000) and polishing (3 µm and 1 µm diamond polishing followed by 0.04 µm oxide polishing, both OP-U and OP-S from Struers A/S). An OLYMPUS GX41 Light Optical Microscope was used to obtain all macro- and micrographs. The specimens were etched with oxalic tinting reagent (20 g oxalic acid in 18 mL distilled water and 80 mL 10% hydrofluoric acid). A FEI Quanta 200 ESEM FEG scanning electron microscope was used for microstructural investigations on polished cross sections (OP-S).
Hardness profiles were obtained on polished cross sections using a FM-700 micro-Vickers hardness tester, using a 10 s dwell time and 10 g load. The presented values are the averages of five measurements; a representative error bar was added, with a width of twice the average standard deviation for each point.

3. Results

3.1. Macroscopical Features of the Line Scan Specimen

A collage of the macroscopic features of the line scan specimen, including surface topography, porosity analysis, and macrographs of x–z and y–z cross sections, is given in Figure 2. Generally, the specimen is higher along the edges, apart from the last scanned side at the top (Figure 2a). The macrographs in Figure 2d–f show that the higher edge along the scan direction is related to distortion of the first scanned corner (to the left). The increased height along the edges in the print direction (y-axis) is not due to deformation, but caused by material build-up (i.e., an edge-effect) as identified in the macrograph in Figure 2e. The build-up happens when a scan line is adjacent to the specimen’s border, where the melt pool is surrounded by powder on 3–4 sides as compared to 2 sides for scan lines inside the specimen. The lower thermal conductivity and lower density of the powder relative to solidified material lead to a shape change of the melt pool, which leads to incorporation of more of the residing powder, hereby increasing the melt pool size [23]. In addition, the first melt in the powder sinks down into the powder, leading to an inclined solidified deposit [24], similar to that observed to the left in Figure 2f.
The height increase at the edges decreases slightly along the print direction (y-axis). Similarly, the height increase along the scan direction (x-axis) is most pronounced in the corners. Contour scans during fabrication of the specimens can decrease the deformation, but were not applied, because they can lead to even higher edges [23]. Focusing on the specimen surface away from the edges, a green-colored valley is observed over about the first fifth in the print direction, while the remaining surface is uniform in height. The (antiparallel) stripes can be recognized parallel to the x-direction in the surface topography.
Computed tomography (CT) results are shown in Figure 2b,c. In order to exclude the surface defects and focus on internal pores, data treatment was performed on a cropped area; see measures in Figure 2b,c. The identified porosities are visualized by 3D renderings in Figure 2b (LFOV) and 2c (4× zoom). It is noted that 3D projections of pores give an exaggerated impression of the degree of porosity. The pores are mainly spherical and vary in size. Some pores are aligned along the x-direction, positioning them along the scan lines during the SLM process (Figure 2c, top surface view). The pores are unevenly distributed over the specimen: enhanced pore densities are observed along the edges in the y-direction and in the “green valley” observed in Figure 2a. The trend is quantified in Figure 2g, showing the pore distribution as a function of x- and y-directions in the cropped area of the line scan specimen. In the x-direction (i.e., integrated over the y- and z-direction of the specimen), in addition to the obvious high pore density near the edges, the inserted graph shows an increased number of pores over a distance of 3 mm in the center of the specimen (from 3 to 6 mm). In the y-direction (i.e., integrated over the x- and z-direction of the specimen) the higher density of pores in the “green valley” is very distinct. In general, no trend in porosity along the build direction (z-direction) is observed.
The macrographs of the line scan specimen in Figure 2e,f show darker etchings near the bottom of the cross sections and the directions of the elongated prior β grains become apparent, both of which will be discussed later. Additionally, a ragged morphology in the bottom of the cross sections is present. This is due to building on a support structure and will not be discussed further.

3.2. Macroscopical Features of the Island Scan Stripes Specimen

The surface topography of the island scan stripes specimen clearly shows a pattern of height differences reflecting the 20 × 20 island pattern (Figure 3a). All islands are higher in the first scanned corner, consistent with the same scan strategy for all islands (parallel-interlaced-reversed (PIR)). In general, the “green valleys” in Figure 3a were scanned later than the “red ridges”. The degree and shape of the increase vary, which relates to the order in which the islands were scanned. This order was unchanged during building in the z-direction.
The macrographs of the cross sections in Figure 3e,f show that most of the islands have a surface inclination towards the left-hand side (e.g., −x and −y), which is preserved in the build direction. This indicates that the height differences are introduced in an early stage of the build and are retained (and possibly aggravated) on continued building. This phenomenon is directly related to the scanning of individual islands, while they are completely surrounded by powder and have no immediate neighboring island that was scanned earlier. As convincingly demonstrated by Leung et al. [24], the first melt track that is formed in a deep powder bed (first layer) sinks towards the bottom of the powder bed as the track proceeds, and undergoes bending during cooling, leaving the first scanned corner at a higher level than the part that is later melted and the solidified part. This is hereafter termed “bending deflection”. In this respect, the first line of each island behaves similar to the line scan specimen in Figure 2, albeit on a smaller scale. It is noted that parallel line scanning applies for the islands in Figure 3, while antiparallel scanning applies for the lines in Figure 2. As a consequence, bending deflections in both x- and y-directions occur for the islands (the specimen bottoms in Figure 2f and Figure 3e). In addition, the surface topography depends on the presence of completed neighboring islands in the same layer. If an island is scanned after an island to its right (+x) was completed earlier and, consequently, has already deflected slightly upwards on the left-hand side (−x), the island being scanned will be fused to the island on its right (+x) at a slightly lower position. If, on the other hand, an island is already present to the left (−x), the difference in surface height at fusion is not as prominent, because deflection is most prominent at the left-hand side (−x, first scanned). According to the same reasoning, the number of neighboring islands (up to 4) affects the surface topography. The same phenomenon means that scanning above (i.e., in the y-direction) an already scanned island leads to a smaller height difference than scanning below an already solidified island (−y), leading to the direction pattern of the deflections seen in the island scan stripes specimen (Figure 3a).
Some islands have more material near the edges of the islands, showing that the edge effect is significant for this method. The first scanned island includes powder from the adjacent (non-scanned) islands, implying that the first scanned island has higher edges, and leaves less powder for melting at the borders for later scanned adjacent islands. As a consequence, pronounced fusion defects arise in-between the islands. This is clearly reflected in the porosity distributions shown in Figure 3b,c and the macrographs in Figure 3e,f, showing lack-of-fusion defects, identified by their irregular shapes, in-between many of the columns. These lack-of-fusion defects are located along rows parallel to the y-direction. The severity of the lack-of-fusion defects is not the same everywhere (Figure 3b,c), which is most certainly related to the order in which the islands were scanned, just as the surface topography. In addition, spherical porosity is also observed. The spherical pores are concentrated to the right (i.e., in the x-direction) of the lack-of-fusion defects (Figure 3c,e). Spherical porosities appear more evenly distributed along the y-direction, although high concentrations occur close to some lack of fusion defects. Figure 3g illustrates how the porosity is distributed along the x- and y-directions of the island scan stripes specimen. From this it is clear how the lack-of-fusion defects account for the periodic peaks in the x-direction (integrated over the y- and z-direction of the specimen) at 0.5 mm intervals (i.e., the island width). The right-hand shoulders to these peaks are caused by the spherical porosities concentrated to the right of the lack-of-fusion defects. In the y-direction (integrated over the x- and z-direction of the specimen), the porosity appears again periodically distributed, with a periodicity reflecting island width, albeit not as clear as for the x-direction. This is because the porosity is mainly concentrated along the island boundaries parallel to the x-direction, and the porosity distribution in the y-direction is therefore mainly dependent on the number of lack-of-fusion defects between islands in the x-direction. Secondly, the lack-of-fusion boundaries appear to be concentrated between the boundaries parallel to the y-direction, while the periodic valleys correlate with the island boundaries in the y-direction.

3.3. Macroscopical Features of the Island Scan Modeled Specimen

As a consequence of applying six different scan strategies, the surface topography of the Island scan modeled specimen (Figure 4a) shows no clear direction of deformation patterns, as in previous cases. Nevertheless, similar to the island scan stripes specimen in Figure 3a, a pattern of peaks and valleys reflecting the periodicity of the islands is observed. As compared to Figure 3a, an irregular shape of the island topographies is observed, which is caused by combining the different scan strategies in the islands with the order of scanning of the islands, leading to different deformations and edge-effects in the individual islands as well as different locations and extents of the melt-pool digging [24]. Islands with near-circular topographical shapes can be recognized in Figure 4a. They are clearest for the highest and lowest islands as reflected by the circular white rings and the blue circles, and developed because scanning followed either an (1) out–in spiral or (2) in–out spiral scan type, as described by Cheng et al. [18].
Porosity for the island scan modeled specimen is shown in Figure 4b,c. In general, a high content of spherical porosities is observed. Lack-of-fusion defects appear less pronounced than for the island scan stripes in Figure 3, implying that the islands are fused better together. This is confirmed by Figure 4e–g. Most islands are completely fused, while some have a relatively high degree of spherical porosities or lack-of-fusion defects (Figure 4b,c). Again, lines of spherical porosities distributed along the y-direction are present, located at or close to the island borders along the x-direction (Figure 4g). However, this time they do not extend through the full length of the specimen, due to the use of the variation in scan strategy. Instead, high concentrations of spherical porosities are observed inside many islands; several islands show depressions (appearing blue in Figure 4a), combined with few spherical porosities. Some of these have developed into funnel-like defects, for example the large yellow pore in Figure 4c. These deep defects are observed in islands that were filled in after their surrounding islands were completed (see Figure S1, where island 354 is where the yellow pore in Figure 4c was created).
The pore distributions in Figure 4g show that periodic behavior with a periodicity reflecting the island width occurs in the x-direction, albeit less pronounced as in Figure 3g, because of the use of different scan strategies within the islands. Consistently, the heights of the peaks are significantly lower than in Figure 3g, due to fewer lack-of-fusion defects. The periodic behavior in the y-direction (Figure 4g) is also less pronounced than in Figure 3g. An explanation for the occurrence of a pattern in the porosity distribution in both the x- and y-direction, despite the use of different scan strategies, is that the direction of scan types 3–6 are still parallel to the x-direction, implying that lack-of-fusion defects could still occur, albeit less pronounced than in the island scanning stripes specimen. Secondly, it appears that the use of different scan strategies is not sufficient to avoid overlap between islands; even though the frequency of lack-of-fusion defects is reduced, more trapped-gas porosities appear at the borders.

3.4. Microstructure

Selective laser melting exposes the metal to complex thermal cycles and associated temperature gradients, resulting in complex microstructures [9,10]. The following features can be distinguished: pores, phase distribution (α’ to α/β transformation), solidification structure (prior β grains), melt pool shapes (fusion-boundaries), and banding. For the line scan specimen, micrographs in the x–z and y–z cross sections show a heterogeneous microstructure (Figure 5).
Elongated prior β grains are visible in both cross sections. The β phase forming during solidification of the melt grows homo-epitaxially on the β phase in the previously deposited layer, which is partly remelted. This is a consequence of a steep thermal gradient during SLM, which, despite a large partitioning coefficient of Ti-6Al-4V, leads to a planar solidification front and inhibits nucleation in the melt [8].
The elongated prior β grains are oriented perpendicular to the surface in the scan direction (Figure 2e and Figure 5a). In the print direction (Figure 2f and Figure 5b), the prior β grains are still elongated perpendicular to the surface but tilt towards the print direction (y-axis) in the last scanned half. The inclination indicates higher thermal gradients in the melt pool towards the y-direction, which are the same for every consecutive layer because the scan direction is the same for every new layer. Kim et al. showed that the temperature at the side of the melt pool where it bounded by unmelted powder is significantly higher than on the side where it bounds to the solidified material, due to the higher conductivity of dense material as compared to powder [25].
Etching resulted in darker areas near the bottom of the specimen, indicating a different microstructure with more compositional inhomogeneity. It is suggested that this is a result of different cooling conditions with shallower temperature gradients, because this part is closer to the open structure of the support. Also, dark banded lines parallel to the surface are visible due to preferential etching.
Apart from the dark bands, elongated reflections are visible in the micrograph of the x–z cross section (white arrows in Figure 5a), roughly following the banded structure and consisting of several elongated and overlapping lines. Most likely, these features originate from selective polishing and etching of the fusion-boundaries developing when the laser moves roughly along the x-direction in the x–z plane. This could be caused by the dissolution of oxygen in the melt. Alternatively, it could mark the difference between remelted and non-remelted areas of the coherent elongated β grains. The bowl-shaped reflections in the y–z cross section of the line scan specimen (Figure 5b) correspond to the fusion boundaries for each scan line (corresponding to the laser moving in and out of the y–z plane). A few dark bands are visible in the bottom of the y–z cross section. Along with the variation in thickness through the specimen, this indicates that the dark bands depend on the thermal history.
Banding is also observed in the island scan stripes specimen in Figure 6. In contrast to the observations for in the line scan specimen, the preferential etching appears to be present to an equal extent throughout the build direction (see macrographs in Figure 3b,c). This means that the cooling conditions were similar throughout the build, which could be a consequence of the high degree of porosity along the island boundaries (see below).
In the micrograph of the island scan stripes specimen, the elongated former β grains are visible in the x–z cross section (Figure 4e,f) and have the same width in the line scan specimen. The lengths of these grains sometimes reach the full height of the specimen. As opposed to the line scan specimen, where β grains are inclined in the y-direction (i.e., the y–z cross section), the elongated prior β grains are oriented vertically and do not continue in the neighboring island (Figure 6b). This is a result of the high degree of porosity in-between the islands, causing the steepest thermal gradient to be along the thickness direction of the island. In the scan direction (Figure 6a) the prior β grains are slightly tilted inward to the center of the islands, indicating a small contribution of the thermal gradient along the x-axis, associated with the order of the parallel stripes scanning of the islands (Figure 1b). The bowl shaped fusion boundaries are visible, elongated along the scan direction, and rounded off in the print direction (y-axis).
In the micrographs of the island scan modeled specimen (Figure 7), the microstructure at the connections between islands is observed to consist of prior β grain interfaces. Some are wavy, looking like intertwined 50–100 µm waves, while others are less distinguishable. The macrostructure is very chaotic, due to the different scan strategies, resulting in more erratic prior β grains. The prior β grains are elongated, roughly along the build direction, but differ significantly in width, both within the islands and among islands with different scan strategies. An example is the spiral scans, creating prior β grains tilted either to the center of the island (out-in) or from the center and to the edges of the island (in-out). The contrast resulting from fusion boundaries is less pronounced than for the island scan modeled specimen, while banding structures from selective etching are abundantly present. Some islands show clear layering, while others have none.
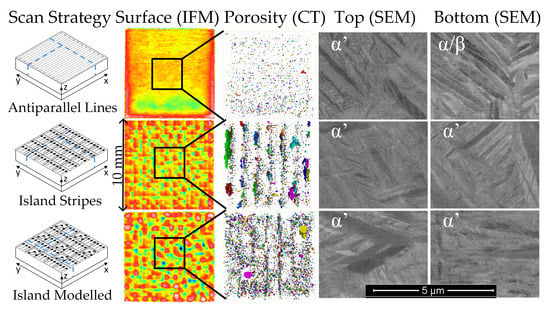
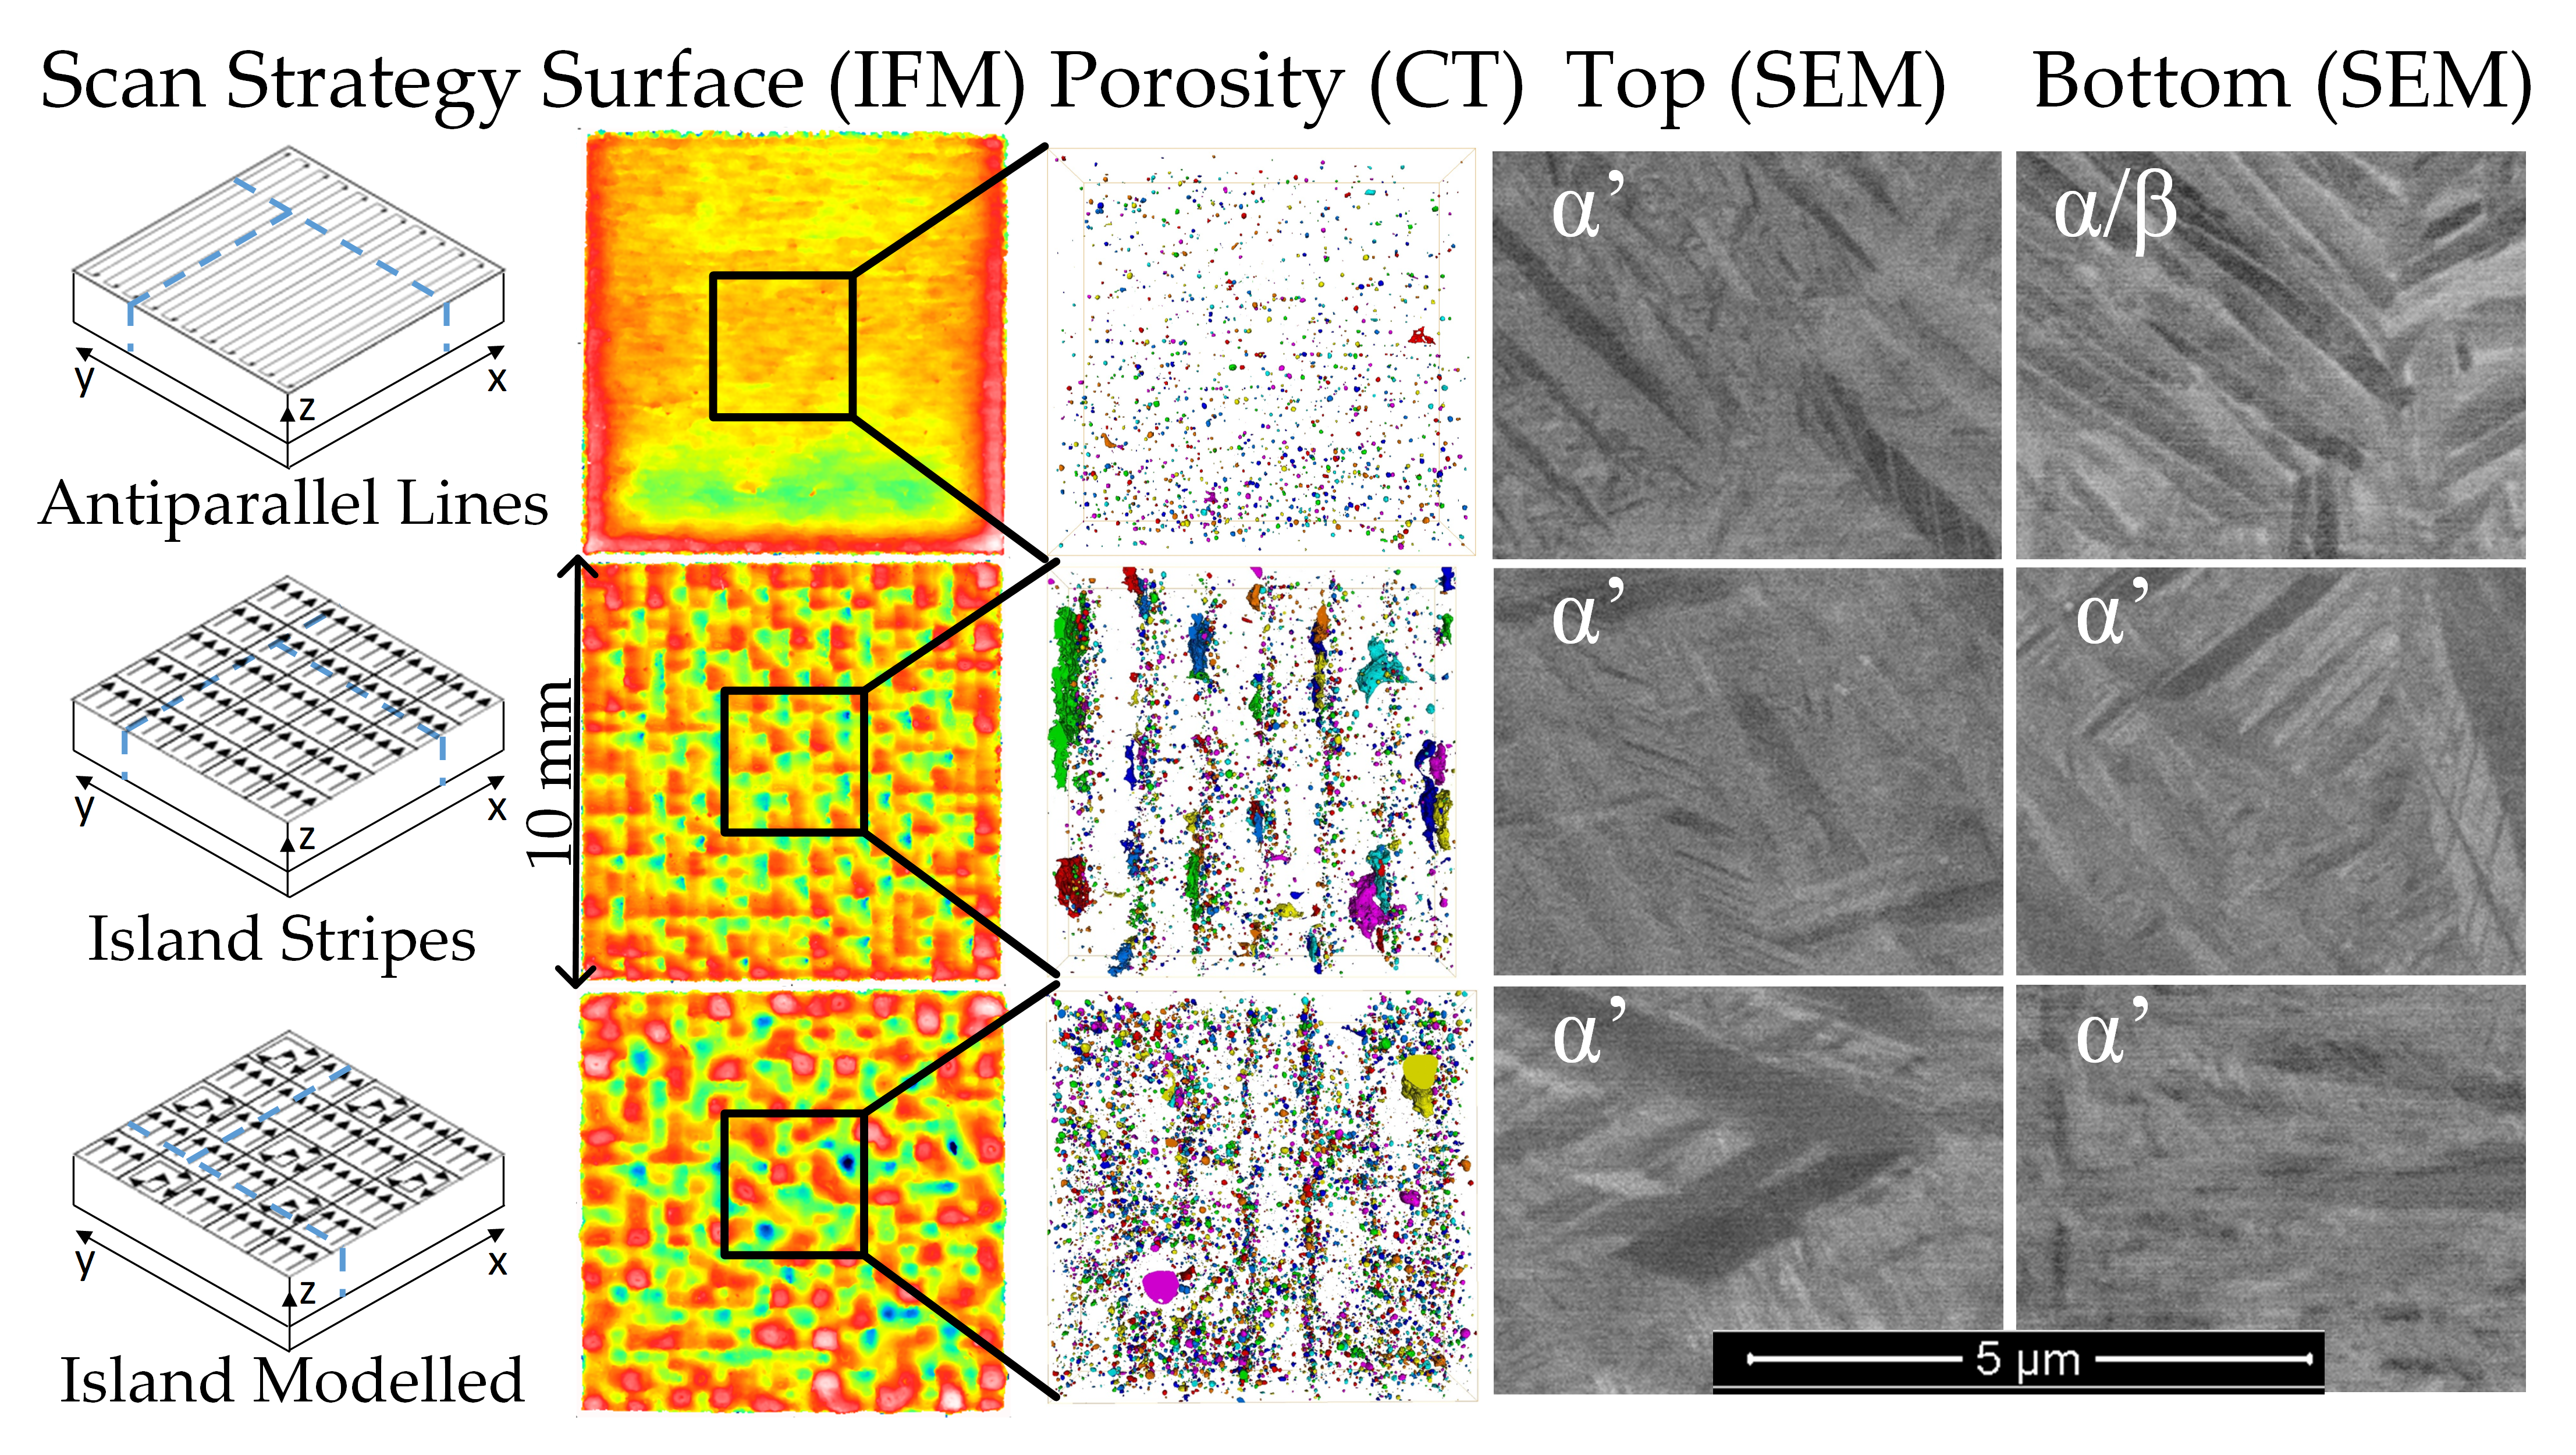
The microstructures as revealed by SEM are presented in Figure 8 for the three specimens at three different locations (bottom, middle, and top). The microstructure in the top and middle of the SLM specimens is acicular α’ martensite, with twinned primary and secondary α’ plates.
Mostly the martensite in the SLM specimens shows acicular α’ structure with primary, secondary, tertiary, and quartic α’ martensite, as described by Yang et al. [13]. This is clearly observed for the line scan specimen at the top and in the middle (Figure 8a). In the bottom of the line scan specimen, the microstructure is mainly ultrafine lamellar as revealed by partitioning observed in backscatter imaging, indicating that decomposition of α’ into α + β had occurred [14]. The lamellar α and β forms from the α’ martensite by partitioning of Al and V [26]. The lamellar α + β may also have formed indirectly from α’; where α’ martensite is transformed into β during reheating, from which α and β lamellar form during cooling, if the cooling after reheating is sufficiently slow.
No such α’ to α + β transformation was observed in the island scan specimens, where hierarchical α’ martensite was the only microstructure constituent observed, as no partitioning was visible (Figure 8b). The different microstructures in the bottom parts of the specimens confirm that the etching response in the top and bottom, as observed in Figure 2 and Figure 5 for the line scan strategy, are a consequence of different microstructures and local composition variations (see above).
The inhomogeneous structure of the island scan modeled specimen is also visible in the martensitic microstructure, showing different lath morphologies in the lateral and vertical location. The microstructure in the top, middle, and bottom images of Figure 8c is therefore not covering the full morphology of the specimen at the ascribed height, but merely examples. At the top, a morphology of zig-zag α’ plates with thinner acicular α’ in-between the zig-zag plates was observed. In the bottom ultra-fine martensite is observed, around primary α’ plates starting at the prior β grain boundary (Figure 8c, bottom).

3.5. Microhardness

Hardness profiles from the top surface into the material along the build direction are given in Figure 9 for the investigated specimens; a typical error bar is given. The profiles are shown for the first 1 mm only, because the bottom part is very rough and porous (Figure 2, Figure 3 and Figure 4).
The hardness increases slightly with increasing depth for all three specimens, which may be due to the refinement of the martensite morphology with the increasing number of heating cycles, as described earlier by Yang et al. [13]. The repeated heating cycles could also cause increased hardness by precipitation of Ti3Al at the right temperatures (approx. below 600 °C [27]), so called self-tempering. For the line scan specimen, the hardness decreased again from about a depth of 0.6 mm, indicating that a coarsening of the microstructure or a phase change occurred. This depth is consistent with the observation of the decomposition martensite into lamellar α/β in the bottom part of the line scan specimen. Decomposition of martensite is normally associated with a hardening increase for the Ti-6Al-4V alloys, and this observation will be discussed later.

4. Discussion

4.1. Influence of Scanning Strategy on Surface Topography and Roughness

The surface topography is the combined result of the roughness caused by selective melting and the specimen deformation in the build direction that accumulates during the SLM build. The deformations depend strongly on the scan strategy, wherefore they were not corrected in calculating the surface roughness. A criterion for evaluation of the scan strategies is obtained by including the deformations. It follows from Table 1 that the surface roughness of the three specimens is high.
The island scan stripes strategy distributed the deformations more uniformly across the surface, compared to the line scan method, but the arithmetic mean roughness, Sa, increased from 48.4 µm in the line scan specimen to 66.4 µm and 82.8 µm in the island scan stripes and island scan modeled specimens, respectively. For the island scan specimens, the use of six different scan strategies in the island method instead of only PIR removed the direction pattern seen in the deformations, but increased the mean roughness, Sa, further to 82.8 µm. The more even distribution of deformations was also accompanied with an increase in maximum height, as Sz increased 6% and 9% by the use of the island scan stripes and island scan modeled strategies, respectively, compared to the line scan strategy. The difference is also clear from the deep (blue) valleys and high (white) peaks in the surface topography displayed in Figure 4a and Figure 3a, compared to Figure 2a.

4.2. Influence of Scanning Strategy on Porosity

The degree of porosity in the three specimens was calculated from the total volume of pores relative to the investigated volume (Table 2). This was done for both the full specimen CT scan and the 4× zoomed CT scan on the cropped regions (note the different cropped regions for the different specimens in Figure 2, Figure 3 and Figure 4). The highest apparent density was achieved in the line scan specimen (~99.6%), while the island scan stripes specimen was the most porous of the three (~98.6%). The island scan modeled specimen exhibits an apparent density in-between the island scan stripes and the line scan specimen (~99.2%). The relatively large difference between the porosity percentages determined with the LFOV and 4× zoom for the line stripes specimen is ascribed to the inhomogeneous distribution of porosities (Figure 2g); the cropped volume investigated with the 4× zoom objective contains a relatively small fraction of the part of the specimen that contains the most porosity (Figure 2a).
The enhanced fraction of spherical porosities in the beginning of the line scan specimen (in the green valley in Figure 2a) is explained as follows. On depositing a layer of new powder, the solidified part will be cooled before scanning of the next layer begins. On scanning the next layer, reheating occurs. The longer the heat input continues, the higher the average temperature in the sample will be and the smaller the local temperature gradients. Accordingly, the temperature gradient during deposition decreases with increasing y. Consequently, faster cooling occurs in the first scanned lines than in the last scanned lines. Faster solidification implies a greater risk for pore development associated with gas precipitation. It is suggested that changing the print direction between successive layers could mitigate the accumulation of porosity on one side of the specimen. A gentle thermal gradient also leads to lower thermal stresses and hence reduces the risk for deformation proceeding in the y-direction. Accordingly, the largest deflections are expected at the beginning of the build (Figure 2f). The “deflection” at the edge is limited to the first 1 mm and is thought to be caused by melt digging into the powder bed [24], possibly assisted by deflection as a result of thermal stresses.
The pores were divided into spherical and irregular pores, using a sphericity value of 0.7 as the cut-off. The irregular pores can be assumed to be mainly lack-of-fusion pores. The percentages of spherical and irregular pores, shown in Table 2, shows that for the island scan stripes specimen, irregular pores take up a higher volume than the spherical pores, while the opposite was the case for the line scan and island scan modeled specimens. Even though the irregular pores represent a large fraction of the total amount of pores in the islands scan stripes specimen, the equation diameter is very close to the equation diameter for the spherical pores. This is simply due to the high number of spherical pores as opposed to the irregular pores, which is high in volume (and equation diameter), while low in numbers, as seen in Figure 10.
Cunningham et al. [16] investigated the porosities of laser powder-bed specimens using synchrotron based micro-tomography (µSXCT), resulting in scans with a spatial resolution of 1.5 µm. They found that for laser powder-bed AM the larger porosities caused by lack-of-fusion defects and key-holing dominated the total volume of defects, making the gas porosities less significant, depending on the processing parameters (powder, velocity, and hatch spacing). The presence of irregular and spherical porosities depended strongly on the processing parameters, and for some specimens, the amount of spherical porosities was close to that of the irregular porosities, making them equally significant [16]. Similarly, the pore statistics of the line scan, island scan stripes, and modeled specimens clearly show that both the amount and type of pores can be highly dependent on scanning strategy.
Smaller average equivalent pore diameters can be observed for all three specimens (Table 2) when investigated with 4× objective compared to LFOV objective, which can be ascribed to the smaller voxel size, allowing for the detection of smaller pores, which is evident in Figure 10. Figure 10 also shows how both a smaller and a higher amount of especially spherical pores was detected with the 4× objective in all samples. Although it does little to the total pore volume, due to the low influence of the small pores, is seems to affect the evaluation of spherical vs. irregular pores. For the island scan specimens, the irregular pores account for a higher percent of the total pore volume in the 4× analysis than the LFOV analysis. For all three specimens, the average equation diameter of the irregular pores decreased, which is also reflected in Figure 10, where the irregular pores have higher frequencies at lower equation diameters for all three specimens. This can be explained by the smaller voxel size equaling higher surface resolution, allowing for a more correct description of both volume and area of the pores.

4.3. Influence of Scanning Strategy on Hardness and Microstructure

The average hardness values for each of the three specimens are given in Table 3 and are higher than the values found in the literature [11,28]; around 440 HV was stated for similar energy densities [28]. It is noted that in the present work a low load was used, which can explain part of the discrepancy. The relatively large spread in hardness values as reflected by the error bar and the hardness ranges in Figure 9 is common for AM parts and was observed earlier for SLM parts [11]. In general, the large variation is related to variations in microstructure, most notably the banding, the lath size, and the decomposition of α’.
The average hardness values for the island scan specimens (i.e., 492 and 496 HV0.01 for stripes and modeled, respectively) are slightly, but not significantly, higher than 474 HV0.01 for the line scan specimen. This is largely determined by the hardness decline in the bottom part of the line scan specimen. All three specimens show a slight increase in hardness in the top 0.5 mm, showing that something is changing; most likely caused by the reheating of underlying metal upon scanning of the next layers.
It has been reported that the growth conditions for SLM stabilize after a build height of 10–15 mm is reached [8]. This means that for the present specimens no stable growth conditions were reached yet. Nevertheless, investigation of the unstable region is very relevant, as many SLM parts are thin walled.
Decomposition of martensite into lamellar α/β in forged Ti-6Al-4V is normally found to enhance hardness [26], rather than reduce the hardness as observed in the present work. It is noted that such a hardness increase is observed for a martensitic structure with a hardness of about 330 HV0.01. Clearly, regularly quenched martensite in bulk samples as achieved by heat treatment is different from the martensite formed in the present SLM specimens. Generally, SLM leads to microstructure with a hardness above that normally achieved by quenching and tempering, attributed to the development of fine multiply-twinned martensite. Upon tempering SLM Ti-6Al-4V a hardness reduction can result by the formation of the coarser dual phase α/β microstructure.
Another effect that could contribute to a relatively high hardness of the SLM specimens as compared to conventional TiAl6V4 is the uptake of oxygen during the build process. Titanium has a strong affinity for oxygen and even a very low partial pressure of oxygen in the protective atmosphere will react with the alloy at high temperatures. The α-Ti phase has a high solubility for oxygen and is stabilized to higher temperatures by the dissolution of oxygen. A solid solution of oxygen in the α-Ti phase is associated with effective solid solution strengthening [29]. Moreover, surface oxidation of the melt can occur, forming Ti- and Al-based oxides, which could lead to dispersion hardening. In addition, an augmented oxygen content (as compared to the nominal powder composition) will enhance the propensity for Ti3Al formation in the low temperature regime, as oxygen is dissolved in the precipitate phase [30]. The promoted formation of Ti3Al by increased oxygen content leads to significant precipitation hardening, accompanied by increased brittleness. Promoted Ti3Al formation could mean that the material is more sensitive to thermal inputs, possibly adding increased oxygen levels as a reason for the high hardness variations.
The decomposition of martensite was only observed in the line scan specimen, while the martensite appeared unchanged in the island scan specimens. Clearly, the island scan strategy results in another thermal history, but whether this is a result of another thermal exposure or due to the effect of porosity in-between islands, resulting in different cooling conditions, is not clear from the present observations. Moreover, the martensite morphology was very heterogeneous in the island scan modeled specimen, indicating that the heat input during scanning has an important influence on the resulting microstructure.

5. Conclusions

Three SLM specimens fabricated with different scanning strategies were investigated and compared with regards to surface texture, porosity, and microstructure. An optimized cellular scanning strategy (island scan modeled) was compared to a simple cellular scanning strategy (island scan stripes) and the basic antiparallel line scanning strategy (line scan).
The surface roughness was lowest for the line scan specimen, but unevenly distributed, and while it increased with the use of island scanning, the texture was more even. However, due to the consistent scan strategy for the island scan stripes, the surface texture had a directional pattern, which was less pronounced in the island scan modeled specimen.
Similarly, a low amount of porosity was found in the line scan specimen (0.4%), mainly consisting of spherical pores, while 1.4% and 0.8% was found in the island scan stripes and modeled specimens, respectively. For the island scan stripes, specimen porosity was mainly caused by lack of fusion. The modeled strategy reduced porosity as compared to the stripes strategy and resulted in a significant reduction in lack of fusion porosity, leaving spherical pores as the main porosity type.
The work showed how scan strategy affects the microstructure, with regards to the direction of the elongated prior β grains, the martensite morphology, and decomposition into lamellar α/β. In the island scan specimen, the elongated prior β grains were tilted towards the print direction (y-axis), due to the lack of rotation between the layers. Decomposition of the α’ martensite into lamellar α/β was observed in the bottom of the line scan specimen, but not in the island scan specimens. This led to a lower average hardness in the line scan specimen as compared to the island scan specimen (474 HV0.01 vs. ~494 HV0.01). In the island scan modeled specimen, the prior β grains were irregular and the martensite morphology was inhomogeneous, clearly indicating different local thermal histories within the specimen, due to combining different local scan strategies.
All observations indicate that the thermal histories in the three specimens are affected by the scan strategy and determine the microstructure. However, due to the large amount of porosities in the island scan specimens, it is unclear whether the difference in the thermal history is entirely caused by a difference in scan strategy or also from the geometry change, caused by the large porosities.

Supplementary Materials

The following are available online at https://www.mdpi.com/2076-3417/9/24/5554/s1, Figure S1: Scanning strategy for the island scan modeled specimen, Figure S2: Scanning sequence for the island scan specimens, Figure S3: Macrographs of line scan specimen: (a) sketch of specimen with placement of cuts for the (b,c) optical macrographs, Figure S4: Macrographs of island scan stripes specimen: (a) sketch of specimen with placement of cuts for the (b,c) optical macrographs, Figure S5: Macrographs of island scan modeled specimen: (a) sketch of specimen with placement of cuts for the (b,c) optical macrographs.

Author Contributions

E.H.V., C.G., T.L.C., and M.A.J.S. (all authors) conceived/designed the experiments and analyzed the data; E.H.V. and C.G. performed the experiments; E.H.V. prepared the original draft. All authors thoroughly reviewed and edited the manuscript.

Funding

This research received no external funding.

Acknowledgments

The authors would like to acknowledge the 3D Imaging Centre at DTU for performing the CT scans. Sankhya Mohanty and the Danish Technological Institute are thanked for providing the SLM specimens. The authors gratefully acknowledge Ömer Can Kücükyildiz for providing the 3D surface profiles and for extensive discussion.

Conflicts of Interest

The authors declare no conflicts of interest.

References

  1. Dutta, B.; Froes, F.H. The Additive Manufacturing of Titanium Alloys. In Additive Manufacturing of Titanium Alloys; Butterworth-Heinemann: Oxford, UK, 2016; pp. 1–10. [Google Scholar]
  2. Frazier, W.E. Metal additive manufacturing: A review. J. Mater. Eng. Perform. 2014, 23, 1917–1928. [Google Scholar] [CrossRef]
  3. Liu, S.; Shin, Y.C. Additive manufacturing of Ti6Al4V alloy: A review. Mater. Des. 2019, 164, 107552. [Google Scholar] [CrossRef]
  4. Over, C.; Meiners, W.; Wissenbach, K.; Lindemann, M.; Hutfless, J. Selective laser melting: A new approach for the direct manufacturing of metal parts and tools. In Proceedings of the Laser Assisted Net Shape Engineering (LANE) Conference, Erlangen, Germany, 28–31 August 2002. [Google Scholar]
  5. Kruth, J.P.; Froyen, L.; Van Vaerenbergh, J.; Mercelis, P.; Rombouts, M.; Lauwers, B. Selective laser melting of iron-based powder. J. Mater. Process. Technol. 2004, 149, 616–622. [Google Scholar] [CrossRef]
  6. Wysocki, B.; Maj, P.; Sitek, R.; Buhagiar, J.; Kurzydłowski, K.J.; Świeszkowski, W. Laser and electron beam additive manufacturing methods of fabricating titanium bone implants. Appl. Sci. 2017, 7, 657. [Google Scholar] [CrossRef]
  7. Rafi, H.K.; Karthik, N.V.; Gong, H.; Starr, T.L.; Stucker, B.E. Microstructures and mechanical properties of Ti6Al4V parts fabricated by selective laser melting and electron beam melting. J. Mater. Eng. Perform. 2013, 22, 3872–3883. [Google Scholar] [CrossRef]
  8. Antonysamy, A.A. Microstructure, Texture and Mechanical Property Evolution during Additive Manufacture of Ti6Al4V alloy for Aerospace Applications. PH.D. Thesis, University of Manchester, Manchester, UK, 2012. [Google Scholar]
  9. Yang, J.; Han, J.; Yu, H.; Yin, J.; Gao, M.; Wang, Z.; Zeng, X. Role of molten pool mode on formability, microstructure and mechanical properties of selective laser melted Ti-6Al-4V alloy. Mater. Des. 2016, 110, 558–570. [Google Scholar] [CrossRef]
  10. Simonelli, M.; Tse, Y.; Tuck, C. Further Understanding of Ti6Al4V Selective Laser Melting Using Texture Analysis. Solid Free. Fabr. Proc. 2012, 23, 480–491. [Google Scholar]
  11. Thijs, L.; Verhaeghe, F.; Craeghs, T.; Van Humbeeck, J.; Kruth, J.-P. A Study of the Microstructural Evolution During Selective Laser Melting of Ti-6Al-4V. Acta Mater. 2010, 58, 3303–3312. [Google Scholar] [CrossRef]
  12. Simonelli, M.; Tse, Y.Y.; Tuck, C. On the texture formation of selective laser melted Ti-6Al-4V. Metall. Mater. Trans. A 2014, 45A, 2863–2872. [Google Scholar] [CrossRef]
  13. Yang, J.; Yu, H.; Yin, J.; Gao, M.; Wang, Z.; Zeng, X. Formation and control of martensite in Ti-6Al-4V alloy produced by selective laser melting. Mater. Des. 2016, 108, 308–318. [Google Scholar] [CrossRef]
  14. Xu, W.; Brandt, M.; Sun, S.; Elambasseril, J.; Liu, Q.; Latham, K.; Xia, K.; Qian, M. Additive manufacturing of strong and ductile Ti-6Al-4V by selective laser melting via in situ martensite decomposition. Acta Mater. 2015, 85, 74–84. [Google Scholar] [CrossRef]
  15. Xu, W.; Lui, E.W.; Pateras, A.; Qian, M.; Brandt, M. In situ tailoring microstructure in additively manufactured Ti-6Al-4V for superior mechanical performance. Acta Mater. 2017, 125, 390–400. [Google Scholar] [CrossRef]
  16. Cunningham, R.; Narra, S.P.; Montgomery, C.; Beuth, J.; Rollett, A.D. Synchrotron-Based X-ray Microtomography Characterization of the Effect of Processing Variables on Porosity Formation in Laser Power-Bed Additive Manufacturing of Ti-6Al-4V. JOM 2017, 69, 479–484. [Google Scholar] [CrossRef]
  17. Mishurova, T.; Cabeza, S.; Artzt, K.; Haubrich, J.; Klaus, M.; Genzel, C.; Requena, G.; Bruno, G. An assessment of subsurface residual stress analysis in SLM Ti-6Al-4V. Materials 2017, 10, 348. [Google Scholar] [CrossRef] [Green Version]
  18. Cheng, B.; Shrestha, S.; Chou, K. Stress and deformation evaluations of scanning strategy effect in selective laser melting. Addit. Manuf. 2016, 12, 240–251. [Google Scholar] [CrossRef]
  19. Ma, L.; Bin, H. Temperature and stress analysis and simulation in fractal scanning-based laser sintering. Int. J. Adv. Manuf. Technol. 2007, 34, 898–903. [Google Scholar] [CrossRef]
  20. Mohanty, S.; Hattel, J. Cellular scanning strategy for selective laser melting: Capturing thermal trends with a low-fidelity, pseudo-analytical model. Math. Probl. Eng. 2014. [Google Scholar] [CrossRef]
  21. Mohanty, S.; Hattel, J.H. Cellular scanning strategy for selective laser melting: Generating reliable, optimized scanning paths and processing parameters. In Laser 3D Manufacturing II; SPIE: San Francisco, CA, USA, 2015; Volume 9353, p. 93530U. [Google Scholar]
  22. Feldkamp, L.A.; Davis, L.C.; Kress, J.W. Practical cone-beam algorithm. J. Opt. Soc. Am. A 1984, 1, 612–619. [Google Scholar] [CrossRef] [Green Version]
  23. Yasa, E.; Deckers, J.; Craeghs, T.; Badrossamay, M.; Kruth, J.-P. Investigation on Occurrence of Elevated Edges in Selective Laser Melting. Int. Solid Free. Fabr. Symp. 2009, 20, 673–685. [Google Scholar]
  24. Leung, C.L.A.; Marussi, S.; Atwood, R.C.; Towrie, M.; Withers, P.J.; Lee, P.D. In situ X-ray imaging of defect and molten pool dynamics in laser additive manufacturing. Nat. Commun. 2018, 9, 1355. [Google Scholar] [CrossRef] [Green Version]
  25. Hooper, P.A. Melt pool temperature and cooling rates in laser powder bed fusion. Addit. Manuf. 2018, 22, 548–559. [Google Scholar] [CrossRef]
  26. Gil Mur, F.X.; Rodríguez, D.; Planell, J.A. Influence of tempering temperature and time on the α′-Ti-6Al-4V martensite. J. Alloy. Compd. 1996, 234, 287–289. [Google Scholar] [CrossRef]
  27. Boyer, R.; Collings, E.W.; Welsch, G.; Collings, E.W. Materials Properties Handbook: Titanium Alloys; ASM International: Cleveland, OH, USA, 1994. [Google Scholar]
  28. Xu, Y.; Lu, Y.; Sundberg, K.L.; Liang, J.; Sisson, R.D. Effect of Annealing Treatments on the Microstructure, Mechanical Properties and Corrosion Behavior of Direct Metal Laser Sintered Ti-6Al-4V. J. Mater. Eng. Perform. 2017, 26, 2572–2582. [Google Scholar] [CrossRef]
  29. Dong, H.; Bell, T. Enhanced wear resistance of titanium surfaces by a new thermal oxidation treatment. Wear 2000, 238, 131–137. [Google Scholar] [CrossRef]
  30. Chen, C.C. Phase Equilibria at Ti–Al Interface Under Low Oxygen Pressure. Atlas J. Mater. Sci. 2014, 1, 1–11. [Google Scholar] [CrossRef]
Figure 1. Investigated scan strategies: (a) line scanning using antiparallel stripes; (b) island scanning using parallel-interlaced-reversed (PIR) stripes; (c) island scanning using a specific random pattern of the six scan types: (1) out-in spiral, (2) in-out spiral, (3) antiparallel stripes, (4) parallel stripes, (5) parallel-interlaced stripes, and (6) parallel-interlaced-reversed stripes. The scan order and type was kept consistent in every layer of a specimen, and there was no rotation between layers.
Applsci 09 05554 g001
Figure 2. Line scan specimen: (a) Infinite Focus Microscope (IFM) image showing the surface topography; three-dimensional (3D) rendering of the porosities identified in Avizo from computed tomography (CT) scans of (b) full specimen and (c) reduced area using 4× objective; (d) sketch of specimen with placement of cuts for the (e,f) optical macrographs and (g) amount of porosity as function of x- and y-layer, as calculated in Matlab from CT scan data. High resolution image of (e,f) is provided in Figure S3.
Applsci 09 05554 g002
Figure 3. Island scan stripes specimen: (a) IFM image showing the surface texture; 3D rendering of the internal porosities identified in Avizo from CT scans of (b) full specimen and (c) reduced area using 4× objective; (d) sketch of specimen with placement of cuts for the (e,f) optical macrographs and (g) degree of porosity as function of x- and y-layer as calculated in Matlab from CT scan data. High resolution image of (e,f) is provided in Figure S4.
Applsci 09 05554 g003
Figure 4. Island scan modeled specimen: (a) IFM image showing the surface texture; 3D rendering of the internal porosities identified in Avizo from CT-scans of (b) full specimen and (c) reduced area using 4× objective; (d) sketch of specimen with placement of cuts for the (e,f) optical macrographs and (g) degree of porosity as function of x- and y-layer, as calculated in Matlab from CT scan data. High resolution image of (e,f) are provided in Figure S5.
Applsci 09 05554 g004
Figure 5. Optical micrograph of the line scan specimen showing the microstructural features in the (a) x–z cross section and (b) y–z cross section. White arrows mark the locations of the island boundaries. The micrographs show almost the entire thickness of the sample. White arrows mark the reflections supposedly caused by the fusion boundaries, while black arrows mark the dark bands.
Applsci 09 05554 g005
Figure 6. Optical micrograph of island scan stripes specimen showing the microstructural features in the (a) x–z cross section and (b) y–z cross section. White arrows mark the locations of the island boundaries.
Applsci 09 05554 g006
Figure 7. Optical micrograph of island scan modeled specimen showing the microstructural features in the (a) x–z cross section and (b) y–z cross section. White arrows mark the locations of the island boundaries.
Applsci 09 05554 g007
Figure 8. Backscatter electron micrographs of polished cross sections of selective laser melting (SLM) specimens fabricated with (a) line scan, (b) island scan stripes, and (c) island scan random strategies, showing the martensitic microstructures and decomposition of α’ to α/β in the bottom of (a). Top, middle, and bottom refers to the distance from the top surface in the cross sections (last melted layer).
Applsci 09 05554 g008
Figure 9. Micro hardness profiles of the three different SLM specimens. Average of five profiles shown with trendlines constructed by Gaussian fitting. A representative error bar is added, calculated as 2σ of all measurements for each sample, averaged.
Applsci 09 05554 g009
Figure 10. Volume averaged size distribution of pores detected in Avizo on reconstructed CT using LFOV and 4× objectives in three different Ti-6Al-4V SLM specimens.
Applsci 09 05554 g010
Table 1. Surface roughness parameters (arithmetic mean height, Sa; root mean square height, Sq; and maximum height, Sz) calculated in SPIP using IFM data for specimens fabricated by three different scan strategies.
Specimen DesignationSa (µm)Sq (µm)Sz (µm)
Line Scan48.466.9678.0
Island Scan Stripes66.482.4722.0
Island Scan Modeled82.8101.6743.5
Table 2. Calculated volume percentage and average spherical equivalent diameter of pores detected in Avizo on reconstructed CT using LFOV and 4× objectives, respectively, on SLM specimens scanned with different strategies.
Specimen DesignationVol.% of Pores (% of Total) (%)Avg. Spherical Equation Diameter (µm)
TotalSphericalIrregularTotalSphericalIrregular
Line Scan—LFOV0.370.35 (95)0.018 (5)212147
Line Scan—4×0.100.094 (94)0.0037 (4)101019
Island Scan Stripes—LFOV1.40.41 (29)0.96 (69)222078
Island Scan Stripes—4×1.20.29 (24)0.94 (78)111030
Island Scan Modeled—LFOV0.770.69 (90)0.062 (8)212164
Island Scan Modeled—4×0.800.58 (73)0.23 (29)101019
Table 3. Average micro hardness (±σ) of SLM specimens according to scan strategy.
Specimen DesignationAvg. Hardness (HV0.01)
Line Scan474 ± 41
Island Scan Stripes492 ± 33
Island Scan Random496 ± 29

