1. Introduction
Recent developments in data mining have led to renewed interest in educational data mining (EDM). Studies on massive open online courses (MOOCs) are an important part [
1,
2,
3,
4] of EDM. Compared to traditional classes, students can obtain optimal learning resources in MOOCs using the internet, without considering the location and cost of obtainment. Researchers are committed to improving the effectiveness of learning in many ways. Previous work has tried to predict and improve student achievement in MOOCs by considering courses [
5,
6], forums [
7], watching behaviors on video [
8,
9], quizzes [
10], plagiarism [
11,
12], and so on.
Researchers have found that students’ behaviors [
13] can reflect their learning situation and achievement, and the overall behaviors (such as the number of assignments done, the number of quizzes passed, and total amount of time spent completing assignments [
10]) can be used to predict student achievement. Since students’ same overall behaviors may have different meanings with different learning process, the use of overall behaviors, which cannot fully reflect students’ learning processes, affects the accuracy of predictions.
Table 1 shows four students with similar overall behaviors that have different achievements, and the data used in
Table 1 are from the data set mentioned in
Section 5.1. All students have completed 69 assignments, and their average submission times of all assignments is 2.42, and their average submission order of all assignments is about 770. However, everyone’s score varies greatly from 21 to 80, and this means that the overall behaviors cannot fully reflect students’ learning processes.
The students’ learning processes reveal their temporal learning behaviors. Current temporal algorithms that can analyze students’ temporal learning behaviors mainly include traditional algorithms [
14,
15,
16,
17] and deep learning-based algorithms [
18,
19,
20]. Deep learning-based methods such as long short-term memory (LSTM) have achieved outstanding performance in processing temporal issues. However, as the length of a time-series neural network increases, some critical information will be lost and affect the accuracy of the prediction.
In addition, behavior patterns contain critical behavior information shared by students, and they are also helpful in revealing students’ learning processes. Researchers have mined students’ behavior patterns [
21,
22]. Cerezo [
21] analyzed log data and revealed four patterns (non-procrastinators, socially focused, individually focused, procrastinators) of online behaviors that predict student achievement. They found that students with procrastination patterns gain low final marks. Kahan [
22] identified seven types of participant behaviors. In these behavior patterns, the same behavior pattern may exist in different student groups. For example, the behavior pattern of completing assignments with fewer attempts several times may exist in both the student group with excellent achievements and that with continuous plagiarism. This pattern is not useful for us to predict students’ achievements. We need to find discriminative behavior patterns, and these patterns help effectively to predict student achievement.
In order to solve the problems above, in the present paper, we extract temporal assignment-related behaviors (e.g., submission order sequence, completion time sequence) from logs in a course on MOOCs, describe students’ learning processes, and predict students’ achievement by considering students’ learning processes and discriminative behavior patterns.
Our contributions include the following:
- 1
We construct an achievement prediction framework with an attention mechanism that fully leverages student temporal behaviors and behavior patterns.
- 2
We propose a discriminative sequential pattern (DSP) mining algorithm to mine student behavior patterns (such as those defined by Quitter, Faineant, and Cheater), which enhances the importance of critical information and improves the performance of student achievement prediction.
- 3
The experiments show that the accuracy of predicting student achievement using our approach produces a better outcome than some other methods. Our approach obtains an accuracy rate of 91% and a recall of 94%.
The rest of the paper is organized as follows:
Section 2 presents analyses of the related work in the field. We present an end-to-end achievement prediction framework in
Section 3, and then describe the methods used in
Section 4. The experiments and the analyses of the results are shown in
Section 5.
Section 6 summarizes our work and suggests possibilities for future research.
3. Framework and Data Pre-Processing
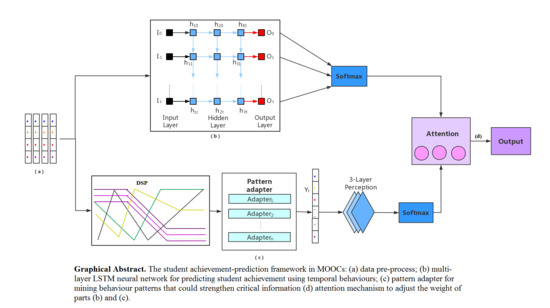
In this section, we propose an end-to-end achievement-prediction framework that extracts features from interaction logs in MOOCs and predicts students failing to pass the final exam. As shown in
Figure 1, the framework is illustrated in four parts. Part (a) is the data pre-processing, part (b) is a multi-layer LSTM neural network, part (c) is a pattern adapter and part (d) is the attention mechanism.
We carry out the data pre-processing in part (a) and extract temporal features that reflect the students’ learning process. Part (b) uses a multi-layer LSTM neural network to predict student achievement, considering students’ temporal features. The temporal algorithm-based LSTM neural network, using temporal features, can reflect the learning processes of students well. Part (c) finds the discriminative sequential patterns and constructs pattern adapters according to the sequential patterns. Sequence patterns can emphasize the critical information that may be forgotten by the LSTM neural network in part (c). Part (d) adjusts the weights of parts (b) and (c) by using the attention mechanism, obtaining the final prediction result.
Before extracting temporal features, the data need to be pre-processed. Missing logs or absences of students’ assignments will affect the effectiveness of features. Each assignment of each student should have relevant logs, and the logs of each assignment will form a time status with temporal features. Where we found that there were missing logs, these missing logs were replaced with simulated logs. We can do this because all the extracted features are numeric, and thus we can replace the missing data with an adjacent or global value.
There were three approaches used to fill the missing logs: The first approach used was adjacent replenishment, which means to fill the logs by using the average value of adjacent logs. The usage of adjacent replenishment indicates that the learning behavior of a student is similar to that of an upcoming assignment in the process of learning, and the missing behavior data can be filled by the adjacent learning behavior data. The second technique is global replenishment, which involves filling the logs by the average value of all logs of the given student. Global replenishment means that behaviors in the learning processes are similar for the same student, and thus the actual behavior data can be replaced by the average behavior of all assignments. The third method is 0 replenishment, which implies the status value is replaced with 0. This means that the value of all the features reflecting the students’ completion of the assignment are set to 0, regardless of whether the students failed to submit their assignment, or if the assignment they submitted was lost because of unexpected circumstances. We provide the experimental outcomes in
Section 5.
4. Prediction Method
In this section, we propose an algorithm to predict student achievement, along with the attention mechanism, using the temporal feature sequences. The algorithm can well reflect students’ learning processes and can enhance critical information with a DSP-based pattern adapter. By adjusting the weights of the LSTM neural network and DSP-based pattern adapter, better prediction can be obtained.
4.1. Multi-Layer LSTM Neural Networks
We used a multi-layer LSTM neural network to predict students’ achievement and reflect students’ learning process. The LSTM neural network can remember important information and forget invalid information. This solves the problem of gradient disappearance and gradient explosion in long sequences in RNNs. A LSTM unit consists of an input gate, an output gate, and a forget gate. The input gate inserts the sequential data, and the forget gate selectively forgets the information transmitted by the previous node. The output gate determines the information that can be passed to the next node. The structure of the LSTM cell used is shown in
Figure 2.
The calculation process of the output results is shown in Equations (1)–(7). The new memory,
Ct, is generated from the output,
ht−1 and
xt, of the previous unit. Input gate
it controls the retention of new memory, forgetting gate
ft controls the retention of C
t−1 before forgetting gate
ft, and the output of final memory is controlled by output gate
ot.
A multi-layer LSTM network generally consists of three layers: (1) An input layer, (2) a hidden layer, and (3) an output layer. Our LSTM adopts a five-layer architecture, including three-layer hidden layers. Part (b) of
Figure 1 displays the network.
4.2. DSP-Based Pattern Adapter
In this part, we use a DSP to mine sequential patterns and construct pattern adapters in order to highlight the importance of critical behavior data. Since LSTM units use the forget gate to forget invalid behavior information, some critical behavior information may also be forgotten. However, sequential patterns contain critical behavior information shared by most sequences and could enhance the importance of information.
Students who pass the exam and the students who fail the exam have different behavior patterns. Taking the students who failed the final exam as an example, we should ensure that the sequential patterns that appear from the students who fail the exam are rarely found in students who pass the exam. Otherwise, the prediction accuracy of sequential pattern prediction will be greatly reduced. The traditional GSP algorithm has shortcomings in dealing with multi-classification sequential pattern prediction. Thus, we propose an improved GSP algorithm, called DSP, to identify students’ behavior patterns regarding interval temporal features and construct pattern adapters.
We divided 69 assignments into 14 groups, according to the open time of the assignments. For each student’s behavior, we construct a sequence of 14 lengths. The average students’ assignment-related behavior in each group was taken as a value of the sequence. We discerned the sequential patterns of the students who pass the final exam (labelled as Classification 0) and those who fail it (labelled as Classification 1).
The DSP algorithm is shown in Algorithm 1. We set two thresholds to control the accuracy and recall of sequential patterns.
| Algorithm 1. Discriminative sequential pattern (DSP). |
Input:
Tik: The set of candidate sequential patterns in the kth iteration of classification i
Pik: The set of frequent sequential patterns of classification i
V: The range of values for the feature sequences
rr and ar: Adjustable parameters to control for the accuracy and recall of obtaining sequential patterns
Output:
CPi: The classification sequential patterns of classification i
// Generating candidate sequential patterns with a length of 1 according to the range of values in the sequences
Ti1 ← Initialize ()
//If the recall (RCCi) of candidate sequential pattern f in Ti1 is greater than rr, then f is added to Pi1.
for (f ∈ Ti1)
if (RCCi (f) >= rr)
Pi1 ← Pi1 ∪ f
for (k = 2; Pi,k−1 ≠ ∅; k++) do
// For sequential patterns of length k−1 satisfying rr, candidate sequential patterns of length k are generated.
for (f ∈ Pi,k−1)
for (v ∈ V)
Tik = Tik ∪ Con (f, v) //The function Con connects the sequence f and value v
endfor
endfor
//If the RCCiof candidate sequential pattern f in Tik is greater than rr, then f is added to Pik.
for (f ∈ Tik)
if (RCCi (f) >= rr)
Pik ← Pik ∪ f
//In the sequence satisfying the recall requirement of classification i, if the accuracy of
//prediction (ACCi) in all classifications is greater than that of ar, it is added to the final result CPi.
CPi = CPi ∪ {<{ f }>| f ∈ Pik, ACCi (f) >= ar}
endfor
return CPi |
We can use the DSP algorithm to obtain many behavior patterns, which constitute the corresponding pattern adapters. For sequential patterns, we can construct a n-dimensional vector, where there are n patterns. A feature sequence will match these sequential patterns separately. If the matching is successful, the corresponding position of the vector is 1. If the matching fails, the corresponding position of the vector is 0. A student’s behaviors can be transformed into the n-dimensional vector through the pattern adapters, which can be trained by a simple neural network to predict student achievement.
4.3. Attention Mechanism
We used the attention-based student achievement prediction model to evaluate the importance of the LSTM neural network and sequence patterns adapter. The attention mechanism originates from the way of thinking of the human brain [
36], which automatically pays more attention to vital details and ignores less important information.
Note that each output of the multi-layer LSTM neural network, such as that from
O1 to
Ot in part
b, is not normalized, so we need to score each output, as shown in the following equation:
Similarly, we normalize output
Oc of part
c. The formula is displayed in Equation (11).
The final score in the prediction process is composed of parts
b and
c. We use the attention mechanism to adjust the weights of parts
b and
c. The weight of part
b for output
Oi is
Wi, and that of part
c is
Wc. We used the feed forward neural network to train the model. The network was trained jointly with the multi-layer LSTM neural network in part
b and the multi-layer perceptron in part
c, shown in
Figure 1. The final loss function (LOSS) is composed of the loss of parts
b and
c, where L is the softmax loss function. The LOSS function is presented as follows.
We performed back propagation to train the parameters via a gradient descent algorithm.
5. Experiments
5.1. Data and Distribution
In this section, we introduce the data set and describe the features extracted from the logs. Finally, the data distribution is presented.
The data are from a course called ‘C Programming’, from 2012. In total, 1528 students took part in this course. The course includes 69 programming assignments. Students are supposed to complete these assignments, and thirty-four features can be extracted from the logs as shown in
Table A1. We have extracted the features of the assignment behaviors and some compiled error information. These features (including assignment submission order, quick submission times, runtime error (RE) times, completion time, and compile information, etc.) denote the students’ completion of assignments from multiple angles, and thus reflect the students’ learning status.
Figure 3 is a programming assignment to be completed by students. As there are many difficult hidden test cases, it is difficult for students to pass all the test cases at once.
The assignment contains five test cases. The first three are public, and the last two are hidden test cases that students cannot see. After the student submits the program, the platform compiles the student’s program, enters the test case, judges whether the output is consistent with the expected output, and if it is consistent, judges that the student has passed the test case.
A submission order refers to the order of submitting an assignment to the website. For a student, if he/she is the first to submit the assignment, the submission order for the assignment is 1. If he/she is the second student, the submission order for the assignment is 2. Among these programming assignments, students will submit the assignment many times to pass all test cases in order to obtain a high score.
A quick submission is determined to occur when the submission time minus the browsing time is less than 300 s. The browsing time begins measurement when a student first reads the assignment, while the submitting time is measured when the student submits it. Since students need to view the test cases online for specific output formats and adjust the output format of the program by referring to the test cases, students are less likely to view the assignment elsewhere and remember the output format to complete the assignment. There is a large probability that a quick submission means the student copied the assignment from someone else. The following figures demonstrate the correlation between average quick submission times and academic performance.
Figure 4 reveals the relationship between the score in the final exam and the average quick submission times in different scores. It shows that the better the score, the lower the average quick submission times. Although we cannot say that quick submission must indicate plagiarism, there is a large probability that quick submission has something to do with plagiarism. Students with scores below 10 have fewer quick submission times, as they do not complete enough assignments.
Table 2 reveals the relationship between submission orders and exam scores. For students with scores under 10, their average submission order of all assignments is 1061, while for students with scores above 90, their average submission order of all assignments is 393. This finding indicates that students who submit their assignments early have higher learning enthusiasm and students with higher learning enthusiasm are likely to receive higher scores.
Figure 5 reveals the relationship between the scores of students and their submissions times during the learning process. Students with a score between 50 and 60 try to submit their assignments more times in the early 10 assignments, and, in the later phases, students with a score between 90 and 100 try to submit their assignments more times. This indicates that some students with a poor score try to complete their assignments with more attempts in the early part, showing evidence of their poor learning ability. However, in the later part, they often submit assignments once and pass all test cases, as they copy the assignments from other students and have fewer submission times. Students with a score between 90 and 100 can complete easy assignments with fewer attempts in the early stage. After the assignments become more complex, they are willing to try more to complete the assignments independently.
5.2. Baselines
In the experiment, we test the standard multi-layer perceptron (MLP), standard LSTM, M-F-LSTM [
37], NOSEP [
38], and our method.
A LSTM-based neural network is appropriate for sequence data. We used LSTM to make two experiments according to different assignment groups. This course lasts for 14 weeks and has 69 assignments. In the first experiment, we extracted the corresponding features from each assignment in the unit of assignment and set the unit number of LSTM to 69. In the second experiment, we extracted the corresponding features from all the assignments in each week and set the unit number of LSTM to 14.
M-F-LSTM is a multi-layer LSTM that it is fully connected among layers.
NOSEP is a sequence pattern mining method that can be used to find the students’ behavior patterns. We can use the behavior patterns to predict student performance.
Our method fully considers the learning process of students and pays attention to critical information.
5.3. Evaluation Metrics
In this paper, we evaluate the performance of the data pre-processing method, the sequential pattern mining method, and the students’ overall performance prediction method, respectively.
We use the accuracy and recall rates to compare the performance differences of each algorithm in the data pre-processing method.
Here, we define two evaluation metrics to evaluate the DSP algorithm: If each value of sequence pattern f appears in sequence s in turn, we define that sequence s is in accordance with sequence pattern f. For example, s1 = (a, d, c, c, b, b, e, e, e, e, e, e, e, e) and s2 = (a, b, c, d, b, d, e, e, e, e, e, e, e, e) are two students’ behavior sequences. For sequential patterns f1 = (a, c, d) and f2 = (a, c, b), a, c, and d in f1 appear in sequence s2, so s2 is in accordance with f1. Similarly, s1 and s2 are in accordance with f2.
Definition 1. The recall of sequential pattern f in classification i (RCCi) equals Mci divided by Ni, where Mci is the number of students whose behavior sequences are in accordance with pattern f in classification i. Ni is the overall number of students of classification i. RCCi refers to the probability that the student behaviors sequences could in accordance with sequential pattern f in classification i. The formula for this is as follows: Definition 2. The accuracy of sequential pattern f (ACCi) in classification i equals Mc divided by N, where Mc is the number of students whose behavior sequences are in accordance with pattern f in all classifications. N is the number of students in all classifications. ACCi refers to the proportion of the true result when predicting with sequential pattern f. The formula for this is as follows: We used accuracy and recall to compare the performance differences of each algorithm and used 5-fold cross validation to verify the stability of the algorithms in the students overall performance prediction.
5.4. Training Details
We predicted whether the students’ performance in the final exam is greater than 70 points by examining the students’ behavior. We think that students with more than 70 points have better performance, and students with less than 70 points have difficulties in learning. We trained neural networks with 80% of the data and validated with the remaining 20% of data.
We use the Tensor Flow framework to train the data using the GPU. For the LSTM neural network in our method, we used three hidden layers, each with 69 units. We set ‘learning_rate’ to 0.0001, ‘batch_size’ to 64, ‘n_hidden’ to 64, and conducted 500,000 iterations of training. In the DSP algorithm for finding students’ behavior patterns, we set ACC to 0.7 and RCC to 0.7, in order to take into account both the accuracy and recall of the model.
5.5. Results
5.5.1. Data Pre-Processing
For existing assignment-related behaviors in MOOC logs, we can quickly extract relevant features and construct behavior sequences. However, for uncommitted or unexpectedly missing assignments, we need to use algorithms to repair these behaviors and build behavior sequences.
Each of the 1528 students needed to complete 69 assignments. When we use the LSTM network for prediction, the number of assignments in the logs should be 105,432 (1528 × 69), however, the actual number of assignments was only 104,194, which equates to a missing feature rate of 1.2%. We tested three methods to simulate the missing logs, as described earlier.
The outcome in
Table 3 reveals that the 0-replenished method leads to the best performance. In other words, missing features (substituting 0) better reflect the learning state of students who fail to submit assignments, while global or adjacent feature substitution will make the predicted results less accurate. The performance of the 0-replenished method shows that a value of zero can better reflect the learning state of students and implicitly shows that a student has not submitted their assignment.
5.5.2. DSP-Based Pattern Adapter
We constructed feature sequences of 14 lengths per week for multiple features. In order to find behavioral patterns, we need to discretize the values of features. Take the submission order as an example: Since there are 1528 students, the order of submitting an assignment is 1–1528. The first submission is 1, and the last submission is 1528. We discretized the value of the submission order, and the eigenvalue of the first 500 submitting students was set to be value ‘1’. The eigenvalues of the 501–1000th students who submitted assignments were discretized to value ‘2’. The eigenvalues of the 1001–1528th students who submitted assignments were discretized to value ‘3’. Similarly, we discretized other features. Then, we used the DSP algorithm to find behavior patterns. The experimental results are as follows.
The sequential patterns selected in the experiment are all behavioral patterns where students fail the final exam. For students who pass the exam, it is difficult to find sequential patterns, as losers have the same reasons, while winners have their own strategies for success. Several sequential patterns are selected in
Table 4. In
Table 4, (.*) means any number of values, ranging from 0 to infinity.
The first two sequential patterns, called Quitter 1 and Quitter 2, respectively, reflect the learning behavior of students with learning difficulties. In these two patterns, a value of ‘2’ means that the number of submissions is much larger than the average number of submissions of all people in the group, and a value of ‘−2’ denotes that the number of submissions is much smaller than the average number of submissions. These students have trouble learning in the early stages and need to spend more time completing their assignments. However, in the late phases of learning, they give up doing assignments independently and complete them through plagiarism, so their submission times are far less than the average submission times.
The third sequential pattern, called Faineant, means that students do not study actively and always submit their assignments at the end. In the submission order, value ‘3’ means that the student submitted his assignment after 1000 students. The experimental outcomes demonstrate that if three groups of assignments submission order are after 1000, the probability of failure of these students is 73.8%. This indicates that the order of submission can reflect students’ learning initiative and has an important impact on the final exam.
The fourth sequential pattern, called Cheater, means that students have serious cheating in their assignments. This means the student has committed serious fraud for a group of assignments. The experimental findings show that 73.49% of the students who cheat seriously for a group of assignments fail the final exam.
5.5.3. Prediction Results
The simulated result of our method is shown in
Figure 6. After 500,000 iterations, the loss gradually converges, and the accuracy approaches 100% in the training data set due to possible overfitting. The final outcome achieved is an accuracy rate of 91% in the testing data set.
As shown in
Table 5, the MLP method with global features achieves an accuracy of 75%. In contrast, the LSTM (
l = 14) method achieves an accuracy of 80%, while the other LSTM (
l = 69) method achieves an accuracy of 88%, and the M-F-LSTM method achieves an accuracy of 91%. The results reveal that temporal algorithms (such as LSTM and M-F-LSTM) can better reflect the learning processes of students and achieve better prediction result. The variable value of the global feature in MLP method may be the same for different behaviors. For example, two students completed the first 30 assignments and the last 30 assignments in 69 assignments, respectively, and the values of the assignment completion number in overall features were both 30 for both students. However, the same values reflect different behaviors. A student who has completed the first 30 questions gave up learning later, while a student who has completed the last 30 questions began to work hard later. As there is a deadline for an assignment, the student who has completed the last 30 assignments cannot make up for the previous assignments. The results indicate that the MLP method with global features cannot distinguish the learning state of these two students, while temporal methods can well reflect the learning process of these two students and distinguish the learning state of these two students. The LSTM (
l = 69) performance was better than the other LSTM (
l = 14) method, as more units can better reflect students’ learning processes.
NOSEP, a sequence pattern algorithm, can find student behavior patterns and predict students’ performance. This method pays more attention to students’ critical information. The NOSEP method achieved the accuracy of 86% and a recall of 85%.
Although temporal algorithms can better reflect the learning process of students, some information may be forgotten with the LSTM method. We synthesized the LSTM method and behavior pattern method to reflect the learning process and enhance the importance of critical information. Our method achieves an accuracy of 91% and a recall of 94%, which performs better than the other methods.
6. Conclusions
Previous studies have found that assignment-related behavior in MOOCS can influence student achievement. However, previous studies have not fully considered the pertinent learning process. In this paper, we aim to explore the influence of the learning process on student achievement. A framework was constructed with an attention mechanism that includes data pre-processing, a DSP-based adapter, and a LSTM-based neural network to predict student achievement. We used the LSTM neural network to reflect the students’ learning processes and the DSP-based adapter to enhance the significance of critical information. Some sequence patterns were mined such as the Quitter, Faineant and Cheater patterns. The experimental results also show that students who failed in the exam had common sequence patterns, while those who passed the exam did not have common sequence patterns. This means that all roads lead to Rome, but failures are always the same. Our method achieves an accuracy rate of 91% and a recall rate of 94% when predicting student achievement. Thus, our study makes an important contribution to the literature on finding the relationship between the learning process and student achievement.
In future work, we will examine the coding content of programming assignments for higher student performance and will consider the universality of the research on MOOC courses.


