Article

Retrofit Existing Frame Structures to Increase Their Economy and Sustainability in High Seismic Hazard Regions

1
Key Lab of Structures Dynamic Behavior and Control of the Ministry of Education, Harbin Institute of Technology, Harbin 150090, China
2
Key Lab of Smart Prevention and Mitigation of Civil Engineering Disasters of the Ministry of Industry and Information Technology, Harbin Institute of Technology, Harbin 150090, China
*
Author to whom correspondence should be addressed.
Appl. Sci. 2019, 9(24), 5486; https://doi.org/10.3390/app9245486
Submission received: 29 October 2019 / Revised: 8 December 2019 / Accepted: 10 December 2019 / Published: 13 December 2019

Abstract

:

Featured Application

The study can be used for retrofitting frame structures to satisfy a revised seismic design code, where a building site had a low seismic hazard but now has a high seismic hazard.

Abstract

The study proposes a retrofitting method with an optimum design of viscous dampers in order to improve the structural resistant capacity to earthquakes. The retrofitting method firstly uses a 2D frame model and places the viscous dampers in the structure to satisfy the performance requirements under code-specific design earthquake intensities and then performs an optimum design to increase the structural collapse-resistant capacity. The failure pattern analysis and fragility analysis show that the optimum design leads to better performance than the original frame structure. For regular structures, it is demonstrated that the optimum pattern of viscous damper placement obtained from a 2D frame model can be directly used in the retrofitting of the 3D frame model. The economic loss and repair time analyses are conducted for the retrofitted frame structure under different earthquake intensities, including the frequent earthquake, the occasional earthquake, and the rare earthquake. Although the proposed method is based on time-history analyses, it seems that the computational cost is acceptable because the 2D frame model is adopted to determine the optimum pattern of viscous damper placement; meanwhile, the owner can clearly know the economic benefits of the retrofitting under different earthquake intensities. The retrofitting also causes the frame to have reduced environmental problems (such as carbon emission) compared to the original frame in the repair process after a rare earthquake happens.

1. Introduction

The devastating Mw7.9-magnitude earthquake in Wenchuan county, Sichuan Province in China on 12 May 2008 [1,2], which killed more than 87,000 people, was one of the most loss-making earthquakes in the 21st century. This event led to modifications of the design earthquake intensities in about 60 regions in the Sichuan Province in the Chinese seismic design code. Such revisions of seismic design codes often change the design earthquake intensity in a region from low to high seismic hazards. On the other hand, some types of public buildings (e.g., hospitals, schools) are required to use a higher design earthquake intensity than the code-specific intensity [3]. The reason for such changes may be due to several aspects; e.g., the new observations from recent earthquakes, technical improvements of hazard analysis, data accumulation, and societal and economic increases.
One of the issues is that a large number of existing buildings have insufficient resistant capacities to satisfy the increased design earthquake intensity. In terms of economic benefit and environmental sustainability, the best choice is to retrofit existing structures rather than demolish them and rebuild new ones. Among many retrofitting methods [4,5,6,7,8,9,10,11], the placement of viscous dampers may be one of the easy ways to improve the seismic performance of structures, because it only induces limited downtime. To date, many studies have focused on the retrofitting of structures with viscous dampers. Pekcan et al. [12] showed that the setting of the viscous damper coefficient of the story should be according to the story shear, and placements of dampers at upper stories may be not effective. Uriz and Whittaker [13] studied the effectiveness of using viscous dampers for the retrofit of a frame building before the Northridge earthquake. Silvestri and Trombetti [14] presented a parametric analysis to compare the performances offered by various systems of added viscous dampers in shear-type structures. Impollonia and Palmeri [15] studied the seismic performance of buildings retrofitted with adjacent reaction towers and viscous dampers. Karavasilis [16] studied frame structures with viscous dampers and highlighted that plastic hinges may occur in columns under earthquakes. Some studies focused on the design methods of retrofitting. Kim et al. [17] proposed a design procedure for viscous dampers based on the capacity spectrum method and verified by a 10-story and a 20-story frame structure. Lin et al. [18] presented a displacement-based seismic design method for regular buildings with viscous dampers. Habibi [19] proposed a multi-mode design method based on energy for the seismic retrofitting of structures with passive energy dissipation systems. Palermo et al. [20] proposed a “direct five-step procedure” for the seismic design of structures with viscous dampers. Zhou et al. [21] proposed a retrofitting method for frame structures with viscous dampers in order to make the structure appropriate for high-intensity earthquake environments. Although the addition of viscous dampers may induce larger residual displacements compared to other retrofitting methods (e.g., isolation, brace, etc.) in a few cases [22], the above studies demonstrate the effectiveness of structural retrofitting using dampers.
The optimum design of viscous dampers is a key issue in the retrofitting procedure based on viscous dampers. Zhang and Soong [23] presented a sequential searching procedure for the optimal placement of viscous dampers in structures. Singh and Moreschi [24] used a gradient-based method to optimally place viscous dampers in structures. In the study of Cimellaro [25], the optimal damping placement utilizing a generalized objective function is presented by accounting for displacements, absolute accelerations and base shear. Apostolakis and Dargush [26] presented a computational framework for the optimal placement of dampers in frame structures. Aydin [27] developed an optimization method to search for the optimal placement of viscous dampers based on the base moment of frame structures. Martinez et al. [28] proposed a procedure to optimally determine the damping coefficients of viscous dampers to satisfy the requirement of the maximum inter-story drift of structures. Shin and Singh [29] focused on the minimum-cost design of viscous dampers and the genetic algorithm, which was used to obtain the optimal number and placement of dampers in structures. Pollini et al. [30] also presented an effective method for seismic retrofitting using viscous dampers to achieve minimum-cost design. Parcianello et al. [31] studied a method for the optimal design of viscous dampers in order to improve the seismic behavior of structures. Lavan and Amir [32], Wang and Mahin [33] studied optimization design methods that follow the framework of performance-based earthquake engineering. Domenico and Ricciardi [34] performed an optimal design for structures with viscous dampers by a stochastic method based on the energy concept.
Viscous dampers can be employed to decrease displacements in a frame structure due to earthquakes, which allows the dissipation of seismic input energy. The design of these devices, however, is still an ongoing research topic, since it is often performed with time-history based trial-and-error methods or simplified analytical methods, which do not guarantee the optimal placements of the dampers. In addition, the existing methods have the following limitations: (1) in seismic design, it is not rational to adopt the optimum results using the minimum damping coefficient to meet the code-specific requirements under the design earthquake intensities (e.g., a frequent earthquake corresponds to an exceedance probability of 63% in 50 years, an occasional earthquake corresponds to an exceedance probability of 10% in 50 years, and a rare earthquake corresponds to an exceedance probability of 2% in 50 years), because no margin resistance is present when the structures are subjected to larger earthquake loads; (2) collapse prevention is a primary performance target for structural design [35,36]. Although the above studies may possibly provide ways to reduce the risk of structural collapse, they do not provide methods to effectively improve the collapse-resistant capacity (ground motion intensity at the structural collapse state), and thus uncertain damage may happen when the structure is under larger earthquakes; and (3) some methods derived from 2D structural models may be difficult to extend to 3D cases. Considering the above limitations, in this study, we proposed a retrofitting method with an optimum design of viscous dampers to improve the structural collapse-resistant capacity to earthquakes under the same retrofitting cost compared with ordinary retrofitting methods. The aim is to increase the structural sustainability, in an earthquake environment with a higher seismic hazard than in the initial structural design.

2. Retrofitting Method Using Viscous Dampers

2.1. Structural Model Used for Verification

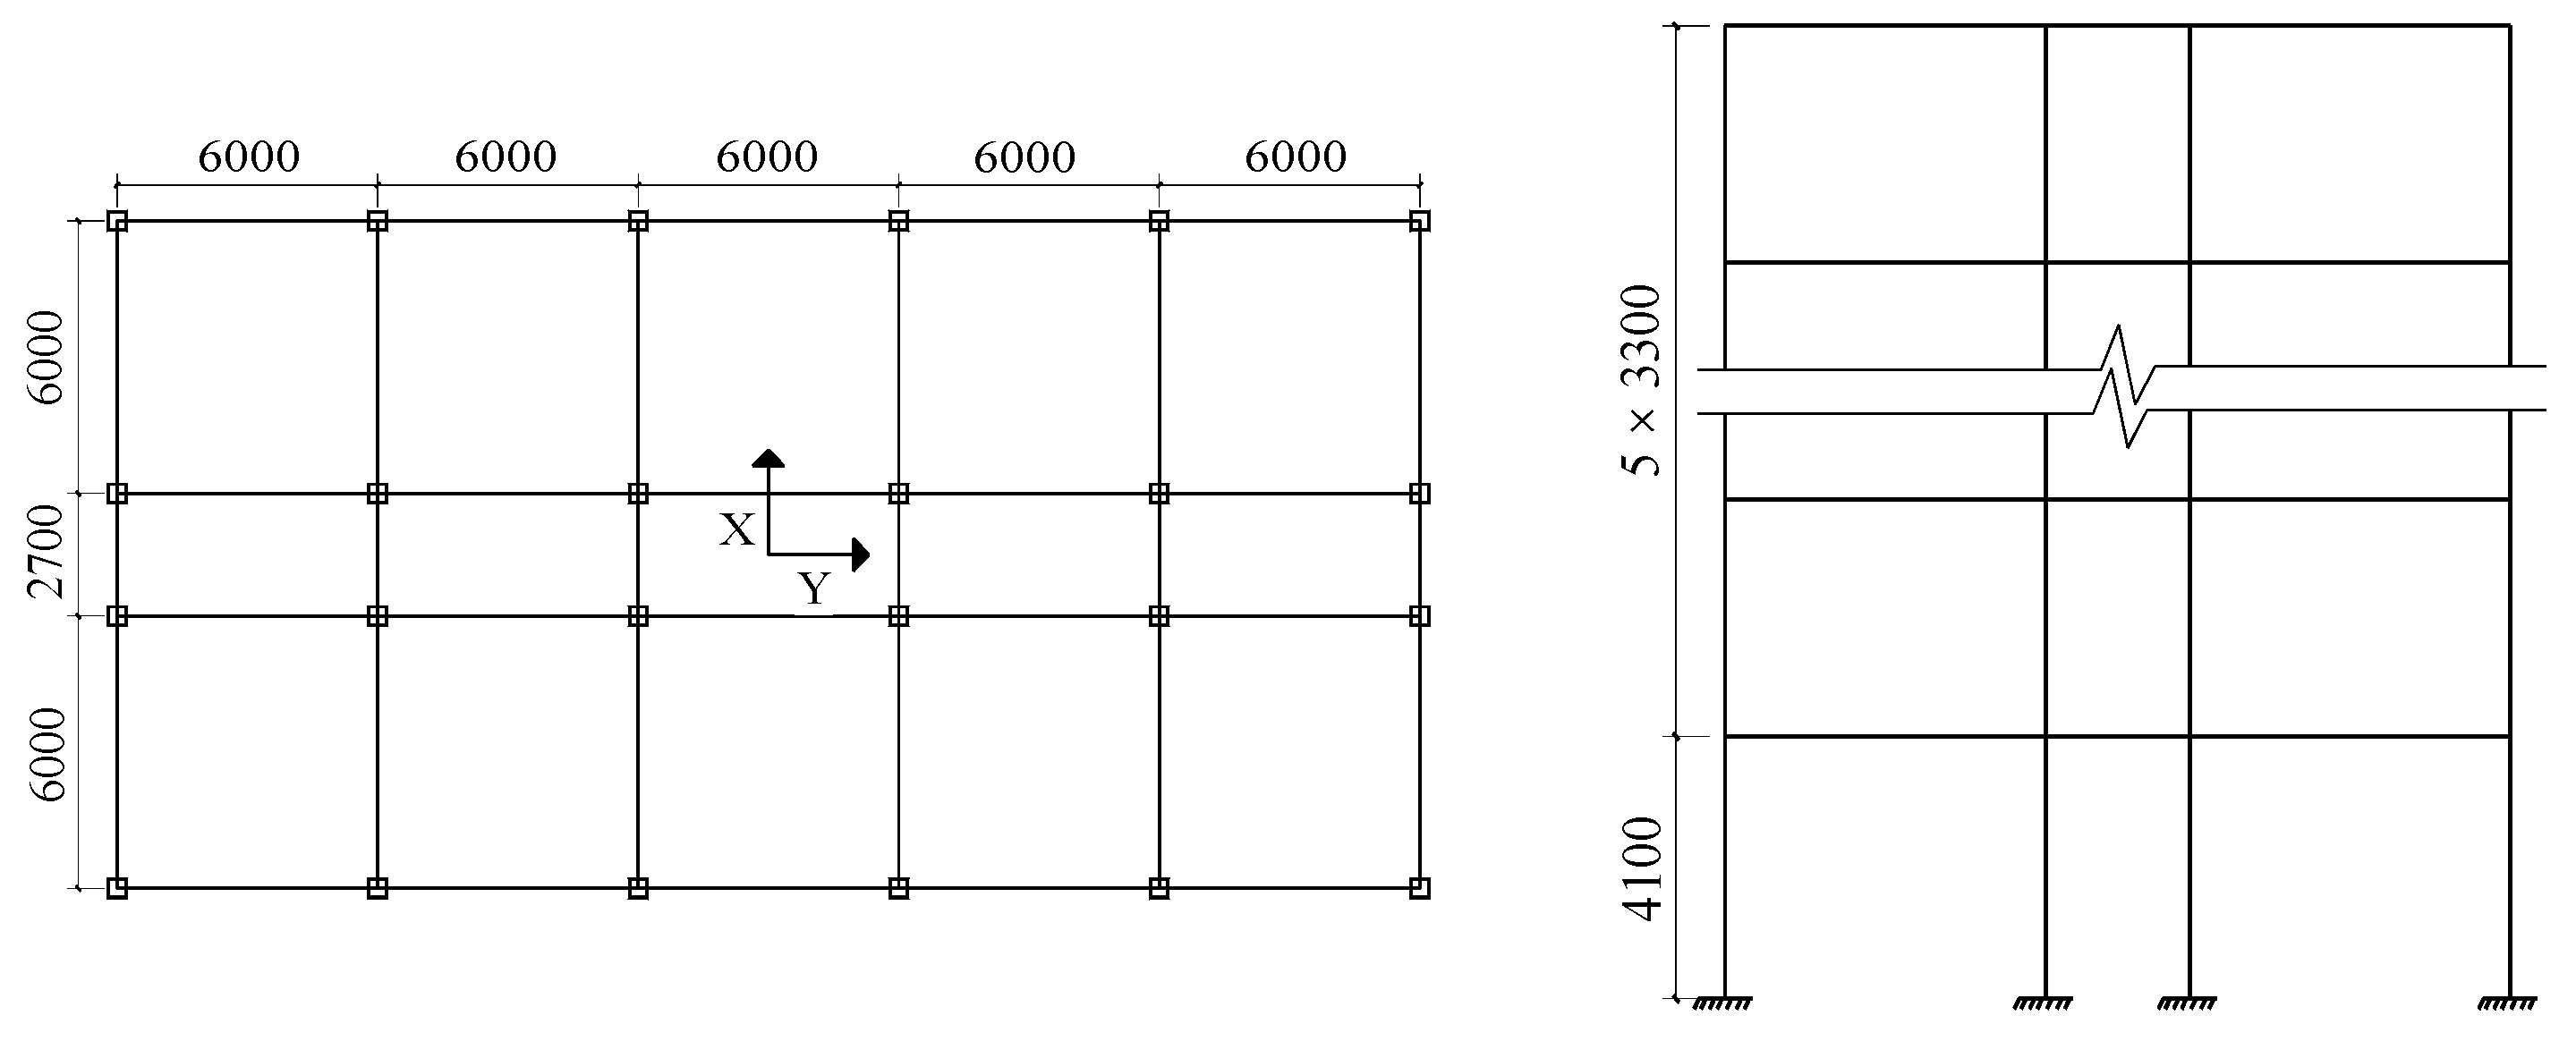
In order to verify the retrofitting method, a 6-story building is used with regular configurations in plan and elevation. This frame structure was designed according to the CSDB code [3] with the design earthquake environment of Region 6 (Peak Ground Acceleration, i.e., PGA (Peak Ground Acceleration) = 0.05 g, corresponding to a 10% exceedance probability in 50 years, with a type II site condition), and now it should meet the requirements of the design earthquake environment of Region 8 (PGA = 0.2 g corresponding to a 10% exceedance probability in 50 years, with a type II site condition) due to design code revision. The geometry layout of the frame structure is shown in Figure 1. More information on the reinforced concrete (RC) frame, such as cross-section dimensions of columns and beams and usage of steel rebars, is provided in Table 1 and Table 2. The frame is a flexible structure with fundamental and second periods T1 = 1.88 s and T2 = 0.62 s, respectively.
The seismic response analysis is conducted using the OpenSees program [37]. The nonlinearBeamColumn elements with fiber section division are used to model beams and columns, while Concrete02 (Kent-Scott-Park) and Steel02 (Menegotto and Pinto) material models are used for the concrete and rebars [38]. The compression and tension strengths and strain at the peak stress of concrete are 20.1 Mpa, 2.01 Mpa and 0.002, respectively. The yielding strengths and elastic modulus of the longitudinal rebars are 335 Mpa and 2.0 × 10⁵ Mpa. P-∆ coordinate transformation is used to consider the geometric nonlinearity. The shear failure is not considered in the element model. This assumption will not introduce large errors, because the columns and beams are required to be designed such that flexure damage occurs before shear damage. The damping ratio is set as 0.05 in the analyses.
The force provided by a viscous damper is calculated, in general, as
F = C v α
where C is the damping coefficient, α is the velocity index, and v is the relative velocity. In the following numerical example, α is set as 1.0 corresponding to a linear viscous damper. The TwoNodeLink element with Maxwell material in OpenSees is used to model the viscous dampers [37]. The Maxwell material model comprises a series-wound stiffness spring and damping pot. The force from the damping pot is calculated by using Equation (1), and the stiffness is commonly selected within 2~3 times the value of coefficient (2.5 times is used in this study). Based on the survey of some companies’ products, the commonly used damping coefficients of viscous dampers are 20, 50, 100, 150, 200, 250, 300, 350, 400, 500, 600, 750, 800, 1000, 1200, 1300, 1500, 1600, 1800, 2000, 2500, 2600, 2800, 3000, 3300, 3500, 3600, 3800, 4000, 4800, 5000, 5200, 5600, 6000, 6700, 8000, 8700, 9300, 10,000, 12,000, 15,000, 18,000, 20,000, 24,000, 26,000, 28,000, and 30,000 kN·(s/m). These parameters can be referred in the retrofitting procedure.
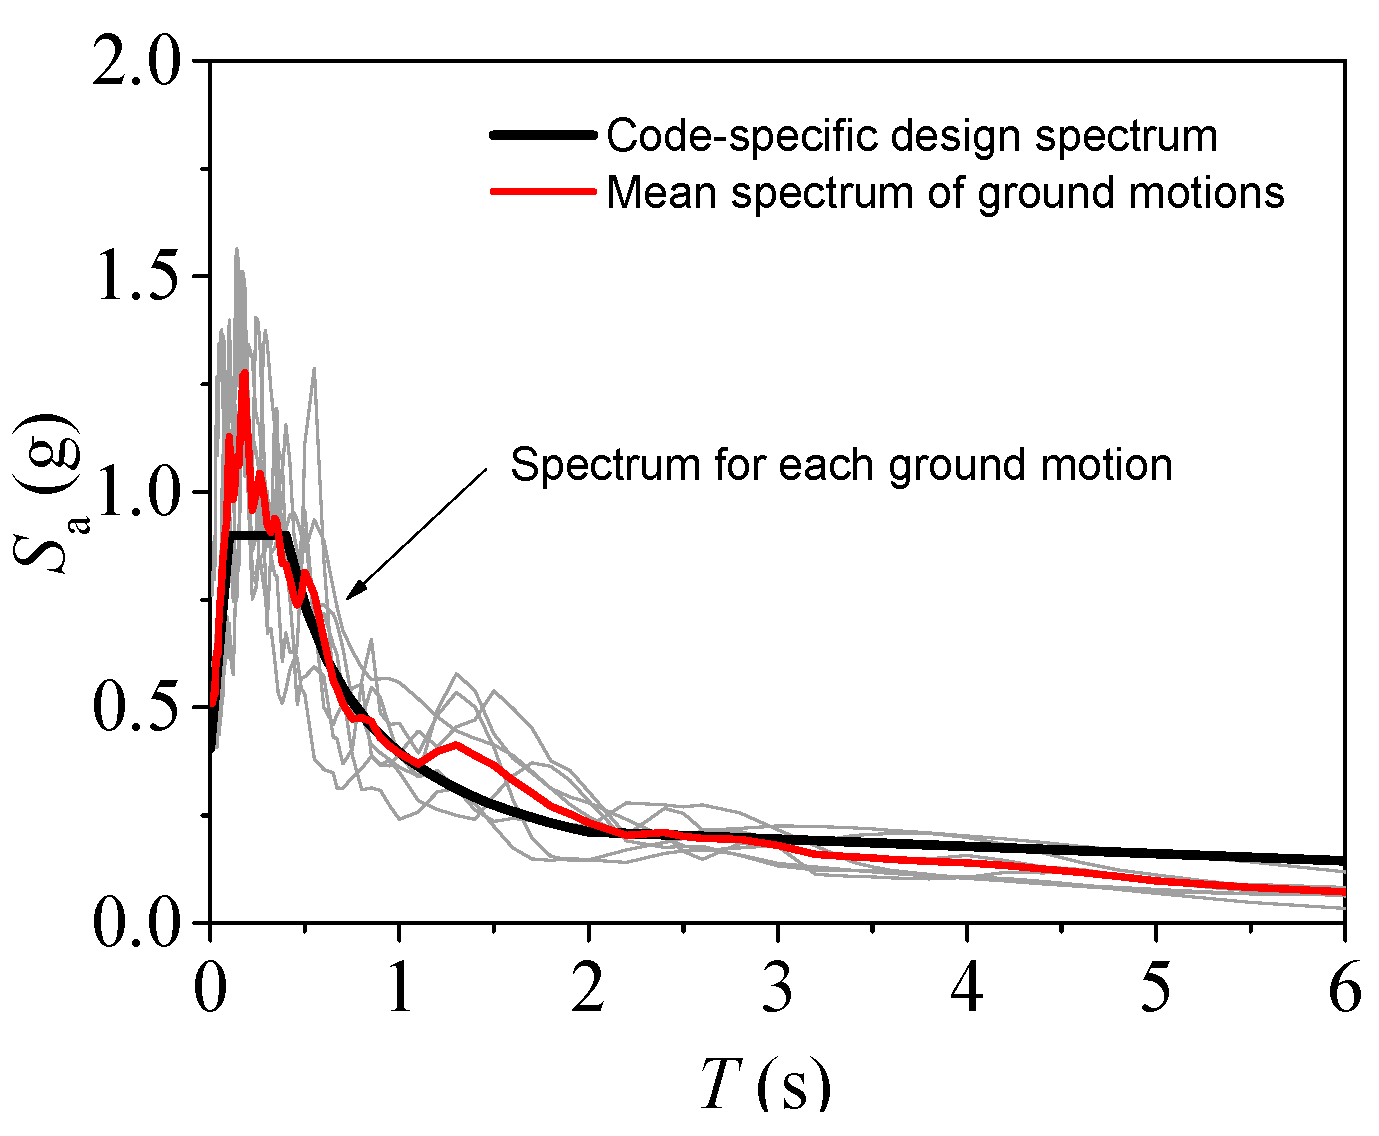
Ground motions (GMs) are selected from the PEER (Pacific Earthquake Engineering Research Center) NGA (Next Generation Attenuation) strong motion database (http://ngawest2.berkeley.edu) to be compatible with the design spectrum in the CSDB code [39] at the main period points. Since a suite of 3 to 11 GMs is usually recommended in codes [39,40,41] to get an accurate assessment of structural response in seismic design procedures, a total of 7 GMs (see Table 3) are used in this study. The matching to the design spectrum of the building site is shown in Figure 2.

2.2. Design Method

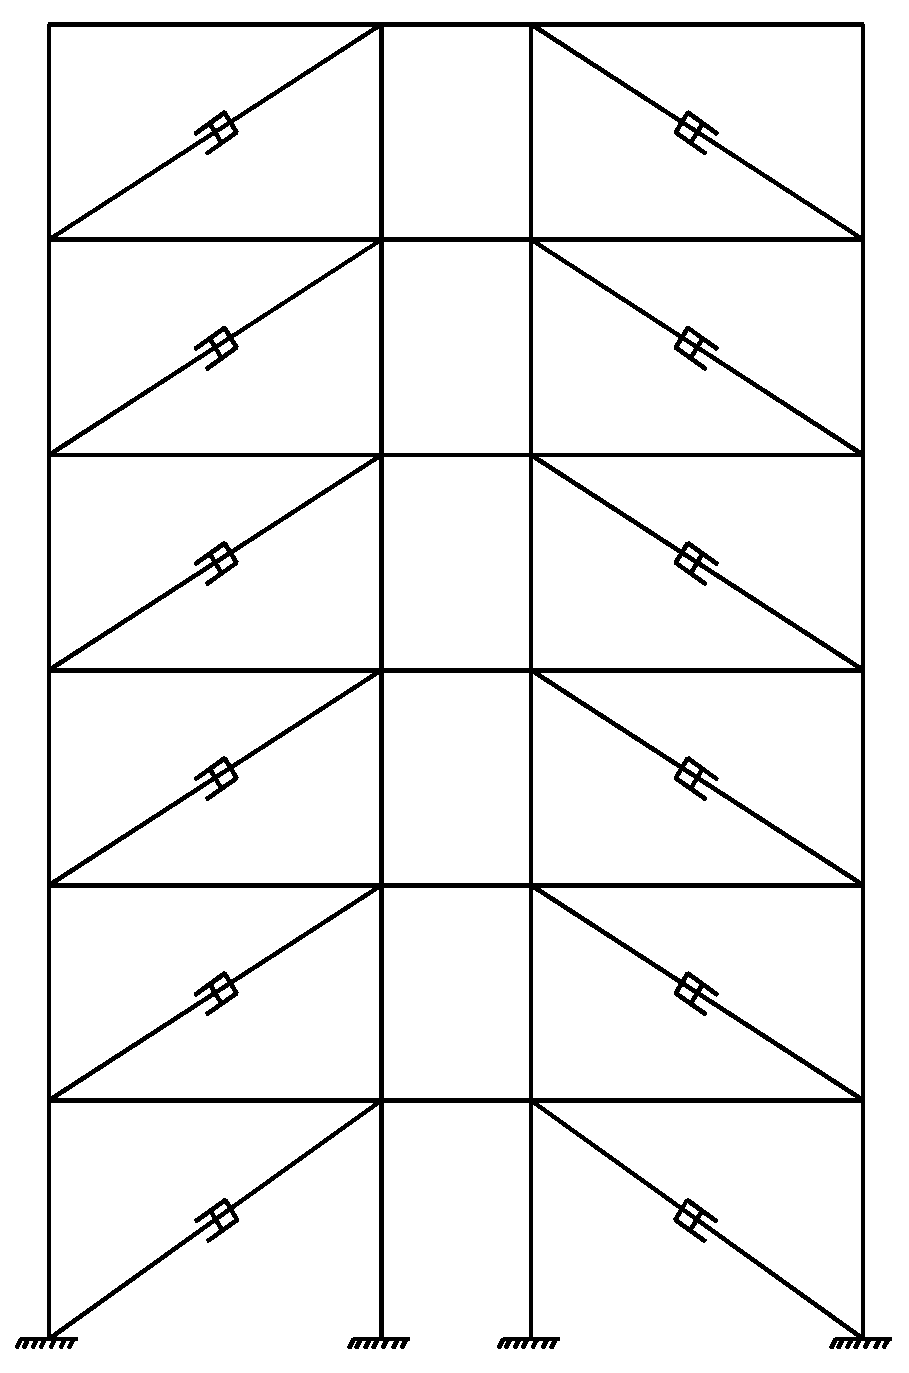
A 2D model (a planar frame in the X direction) is firstly used in this section to illustrate the retrofitting method and while a 3D model will be adopted in Section 3. Figure 3 shows a typical placement layout of viscous dampers in the structure. The retrofitting method can be conducted through three steps (Step 1: Initial placements of dampers to satisfy code-specific requirements; Step 2: Optimum placements of the dampers under same retrofitting cost; and Step 3: Final check based on code-specific requirements). These steps will be discussed in detail in the following.

2.2.1. Step1: Initial Placements of Dampers to Satisfy Code-Specific Requirements

Code-specific requirements under rare earthquakes are used in the initial design of dampers. The inter-story drift ratio of story Ii) is used as the requirement, by considering that δi should be less than 1/50 for RC frame under rare earthquakes [3]. In Region 8, design intensities are PGA = 0.07 g, 0.2 g, and 0.4 g for frequent, occasional and rare earthquakes, respectively. Note that Step 1 can be implemented with any procedure provided that the design requirements are met. The following procedure is suggested:
(1)
For each GM, scale PGA to 0.4 g. Select a layout pattern of the damper placement; e.g., the pattern shown in Figure 3.
(2)
Use a uniform placement from a small damping coefficient, e.g., Ci = 20 kN·(s/m), as shown in Section 2.1 or from any other value based on the designer’s experience.
(3)
Calculate δi for each story. If δi ≤ 1/50 for any story, the initial placement of dampers satisfies code-specific requirements; stop the procedure, otherwise, increase the damping coefficients Ci until the requirement δi ≤ 1/50 is met for story i. This procedure is performed until δi ≤ 1/50 for any story. In such a way, Ci of each story is determined.
The use of the above procedure results in 7 schemes for initial placement patterns of dampers corresponding to the 7 GMs listed in Table 3. Table 4 provides the initial placements of dampers to satisfy code-specific requirements. Large discrepancies are observed in both the distribution pattern of damping coefficients among stories and the total damping coefficient (sum of damping coefficients of all stories). This observation reveals that although the GMs are compatible with the design spectrum, different demands may arise from the uncertainties of GMs. For example, to satisfy code-specific requirements, a total damping coefficient of 4,170,000 N·(s/m) is needed for GM 3 while only 440,000 N·(s/m) is needed for GM 2.
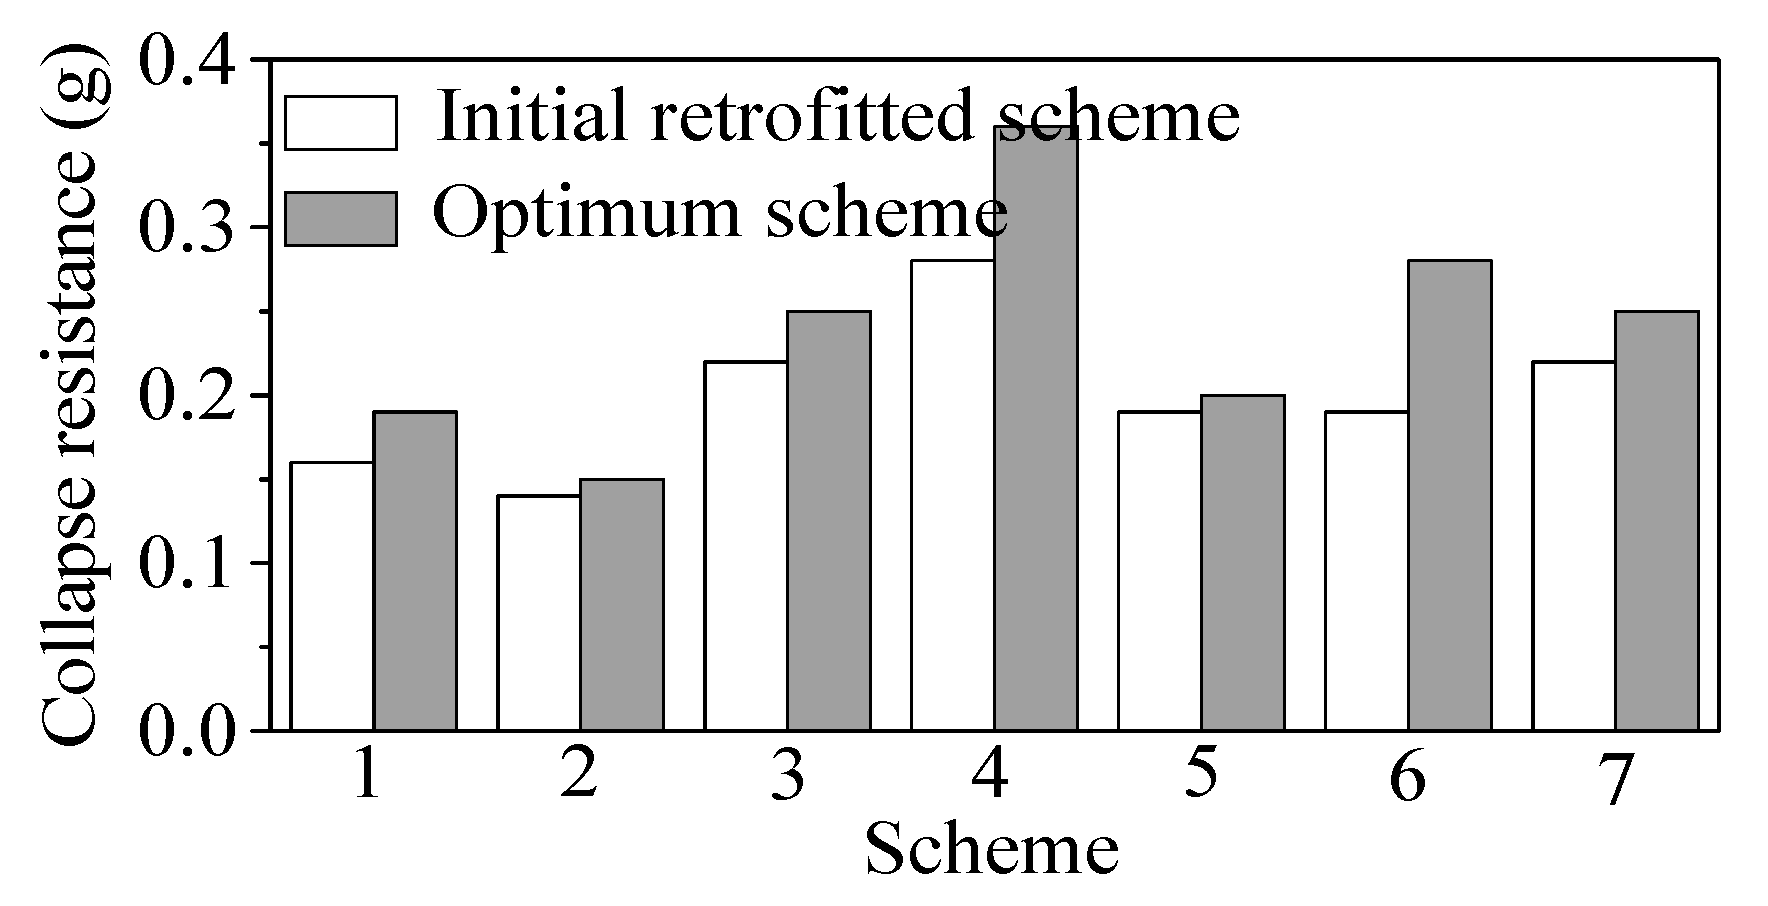
The incremental dynamic analysis (IDA) [42] is performed to check the collapse-resistant capacity of the frame after the initial placements of dampers. The structural collapse state is determined according to FEMA (Federal Emergency Management Agency) 350 [43], i.e., the 20% tangent slope method, which defines the point on the IDA curve with a tangent slope that reduces to 20% of the initial elastic slope as the collapse capacity point, or according to the inter-story drift ratio (IDR) is larger than 10%. The collapse-resistant capacities are Sa(T1) = 0.16 g, 0.14 g, 0.22 g, 0.28 g, 0.19 g, 0.19 g, and 0.22 g after retrofitting by the 7 schemes, with increases of only 0.01 g, 0.0 g, 0.08 g, 0.03 g, 0.07 g, 0.05 g, and 0.0 g with respect to the original frame.

2.2.2. Step 2: Optimum Placements of the Dampers at the Same Retrofitting Cost

The initial design of dampers will be further optimized in this section to increase the structural collapse-resistant capacity at the same retrofitting cost. It is assumed that the cost of retrofit is proportional to the total damping coefficient [14,34]. Therefore, in the optimization, the total damping coefficient obtained in Step 1 is kept unchanged. The following procedure can be followed:
(1)
By referring to initial scheme 1, perform IDA analysis on the structure to obtain its collapse-resistant capacity CC. Note that the selected GM for initial scheme 1 corresponds to GM 1.
(2)
Scale GM to CC and perform a further dynamic analysis on the initial retrofitted structure. Obtain the inter-story drift ratio (δi) of each story.
(3)
If δi, max is close enough to the pre-defined collapse inter-story drift ratio δcollapse, no iteration is necessary; otherwise, modify the distribution of the story damping coefficient Ci. The story damping coefficient Ci is reduced in stories with δi lower than δcollapse and increased in stories with δi higher than δcollapse (using Equation (2) for the adjustment and Equation (3) to keep the total damping coefficient unchanged). The adjustment is repeated until all the inter-story drift ratios satisfy Equation (4).
C i j + 1 = ( δ i j δ a v e r a g e ) α C i j
i = 1 6 C i = C t o t a l
δ i j + 1 < δ c o l l a p s e
In the above equations, C i j + 1 and C i j are the damping coefficients of dampers placed at story I after j+1th and jth adjustments; δ i j + 1 and δ i j are the inter-story drift ratios at story I after j+1th and jth adjustments under the scaled GM; δ a v e r a g e is the average value of inter-story drift ratios of all stories; and α is a coefficient between 0 and 1 that controls the convergence gradient. In the study, α is set to 0.3; and C t o t a l is the total damping coefficient of the initial retrofitted structure. Please note that 6, appearing in Equation (3), denotes the number of stories of the example frame. δ c o l l a p s e is the inter-story drift ratio to determine the collapse state of the optimum structure. According to FEMA 356 [44] and to experimental studies [45,46,47], stating that the inter-story drift ratio corresponding to “Collapse Prevention” state is in the range 2–4%, δ c o l l a p s e is set to 4% in this study. Note that 10% is used previously in the IDA analyses to check a real collapse state, whereas 4% is used here to assess a “Collapse Prevention” state which is actually a nominal collapse suitable to practical design.
(4)
Perform IDA analysis on the structure to obtain its new collapse-resistant capacity CC’. Scale the PGA of GM to CC’ and perform (3) again. Carry out this procedure until any further iteration is unable to increase the CC’. The value of CC’ so obtained is recognized as the optimum result for the selected GM.
(5)
Using the above procedure, 7 new schemes of placements of dampers for the frame can be obtained; these new schemes have the same retrofitting cost as the initial retrofitting schemes obtained in Step 1, but with higher collapse-resistant capacities.
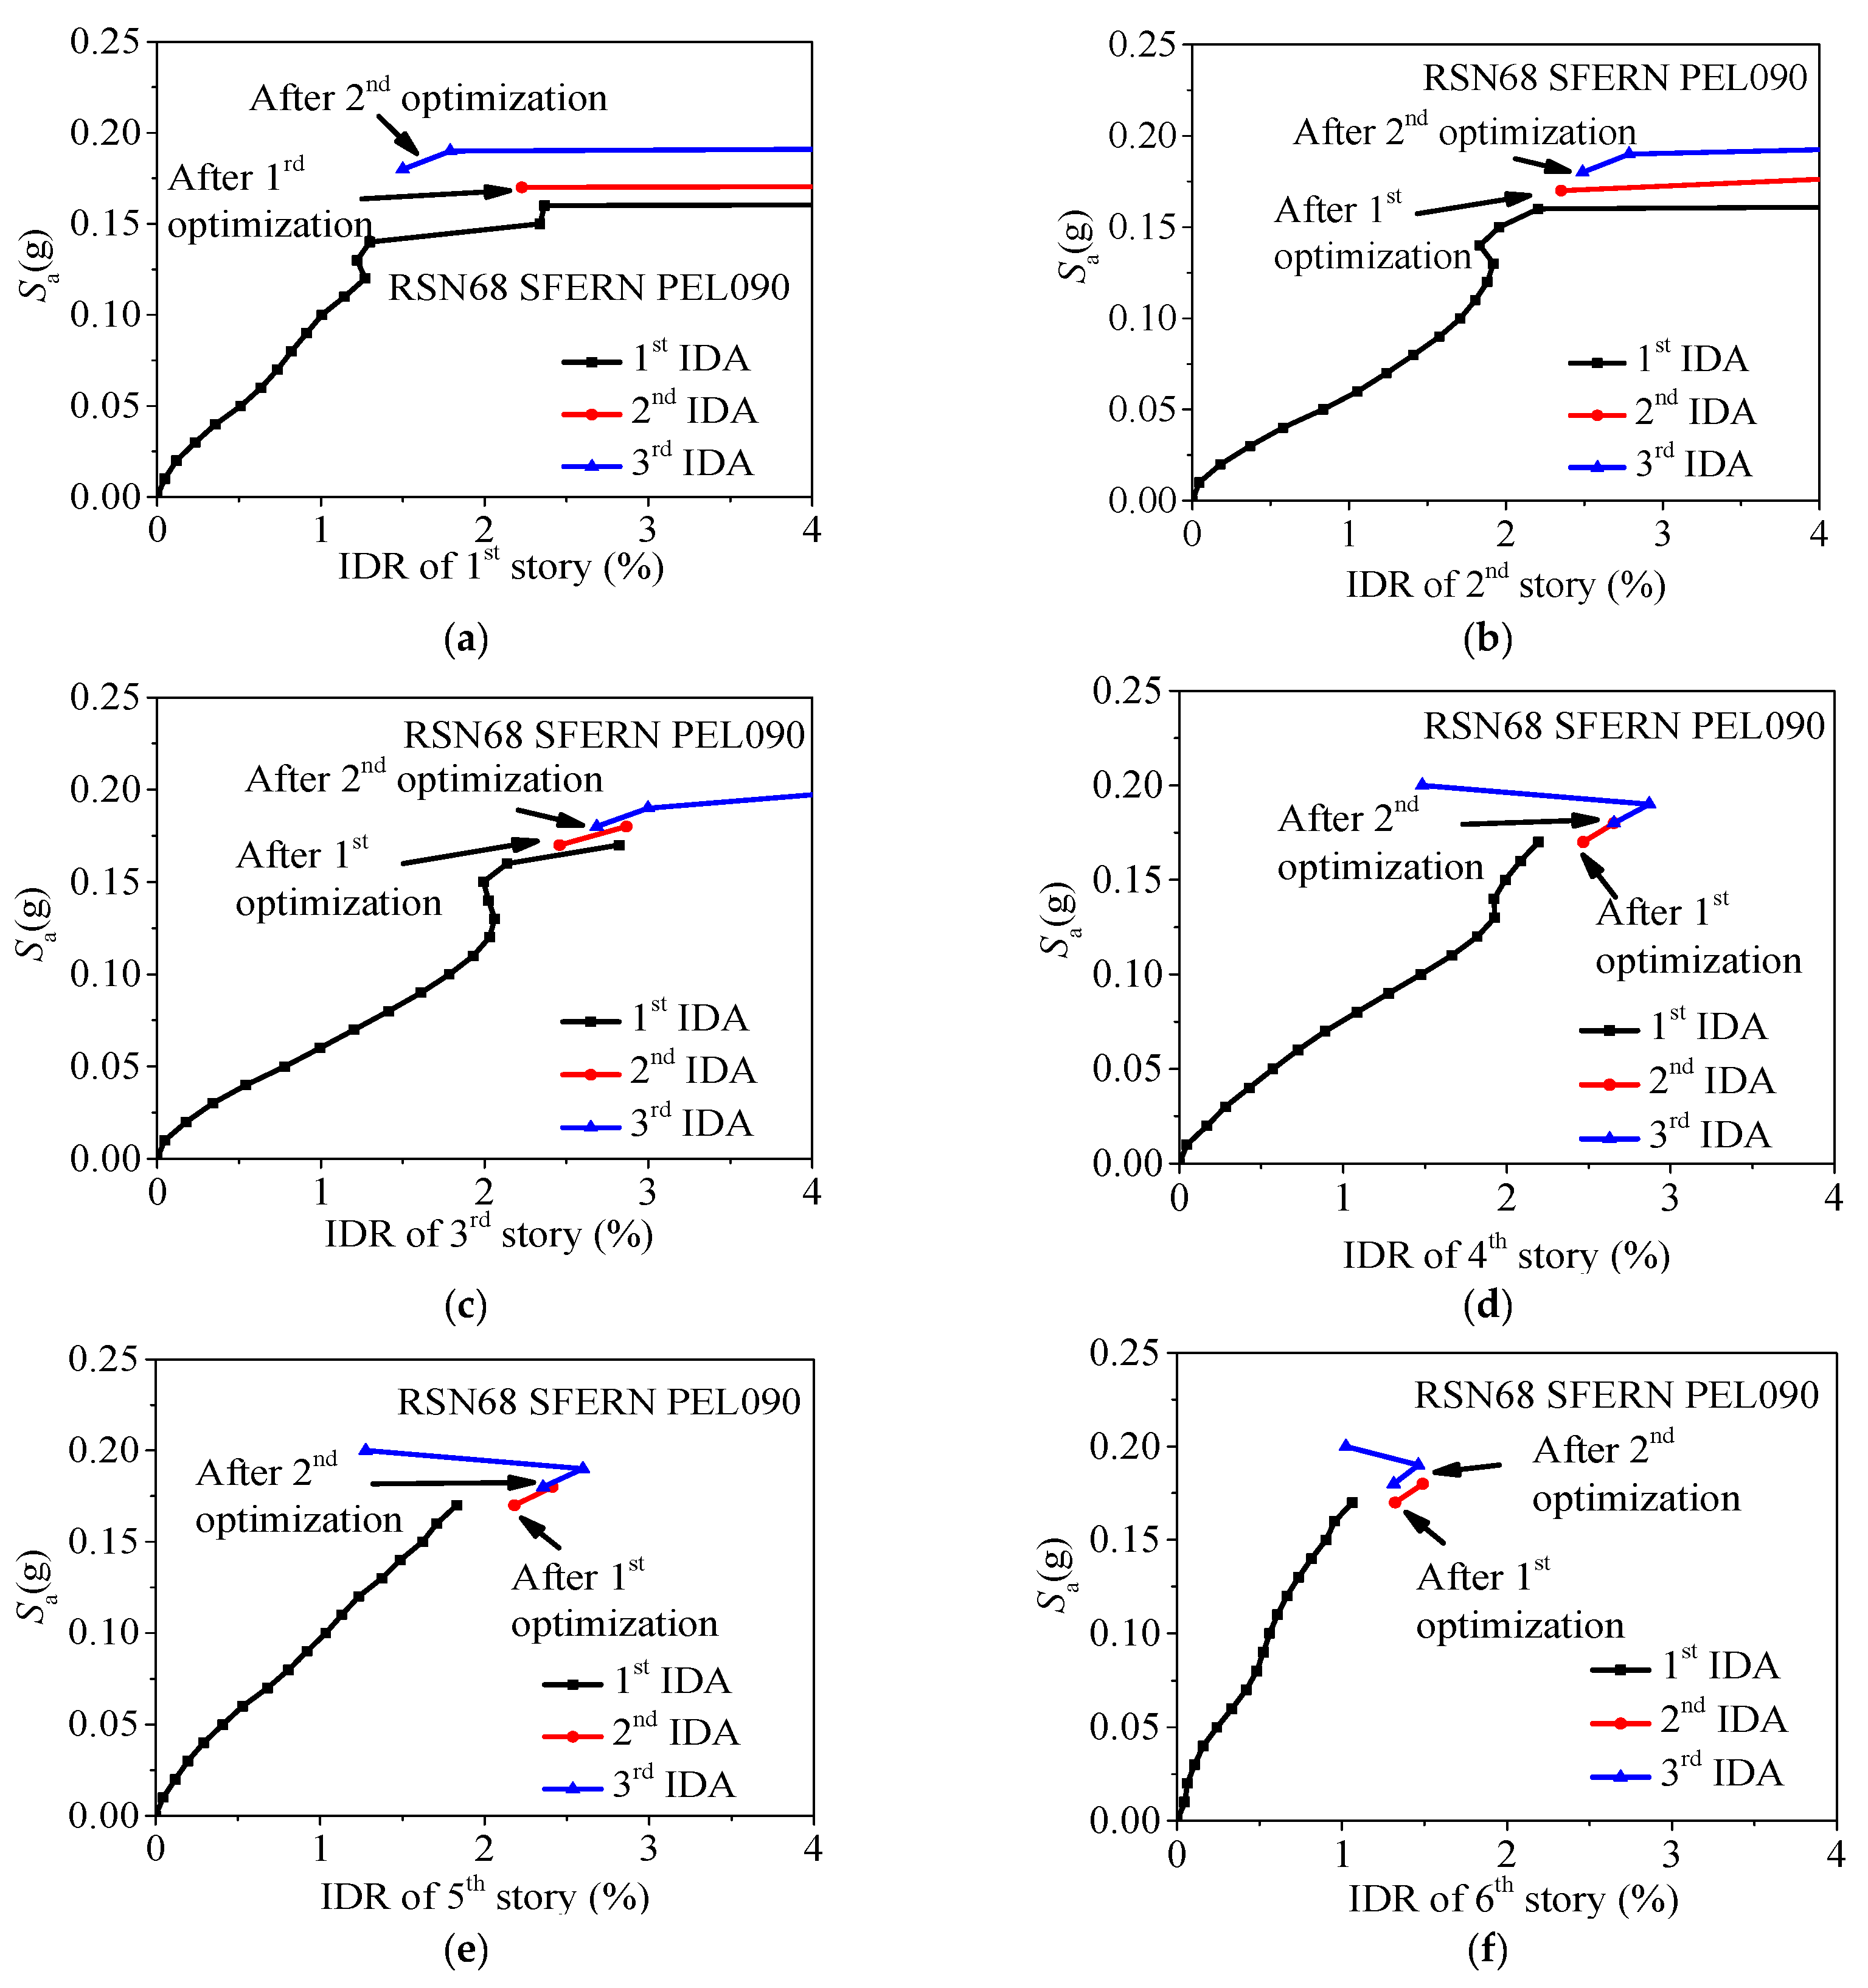
For brevity, only the new scheme 1 is provided here for illustration. Table 5 shows the changes in the damping coefficients of each story in Step 2. It is observed that the damping coefficients of lower stories become larger while those of upper stories become smaller, and that there are no requirements for placements of dampers at the top two stories. This finding is consistent with the study of Pekcan et al. [12]. The collapse-resistant capacity increases to 0.03 g compared to the initial retrofitted frame. Figure 4 shows the change of the inter-story drift ratio of each story, evidencing how the collapse-resistant capacity increases in the procedure. It is shown that for the initial retrofitted schemes, one or two stories of the structure collapse under the GMs. With the optimum design, more than one story collapses nearly at the same ground motion intensity in contrast with what occurred for the initial retrofitted frame, in which a story collapses while other stories still remain in the elastic range. Figure 5 shows that, compared with the initial retrofitted schemes obtained in Step 1, the procedure carried out in Step 2 leads to an increase of the collapse-resistant capacities of the 7 schemes of 18.75, 7.14, 13.64, 28.57, 5.26, 47.4, and 13.64%, respectively. Note that the IDA curves shown in Figure 4 are presented only to illustrate the procedure proposed in the study. In the practical design, for saving the computational cost, the IDA analyses can start from a spectral value Sa corresponding to PGA = 0.4 g because the structural collapse-resistant capacity is surely larger than that intensity.

2.2.3. Step 3: Final Check Based on Code-Specific Requirements

In the above two steps, the results of a retrofitted scheme under a given GM have been provided. In this section, a total of 7 GMs will be used together to get the final optimum retrofitted scheme. At first, the minimum total damping coefficient is obtained; then, the optimum distribution of this total damping coefficient along the height of the frame is determined. The following procedure is performed:
(1)
Determine the required minimum total damping coefficient. Note that the schemes obtained in Step 2, which satisfy the code-specific requirements about inter-story drift ratio under the rare earthquake intensity, are taken as schemes to be considered for each GM. In this step, each scheme obtained in Step 2 is analyzed under 7 GMs scaled to PGA = 0.07 g for frequent earthquake and PGA = 0.4 g for rare earthquake, respectively. Then, the average inter-story drift ratio of each scheme is obtained by averaging 7 results. The required minimum total damping coefficient is determined from the scheme average inter-story drift ratios, which satisfies the code requirements under frequent and rare earthquakes (1/550 and 1/50, respectively [3]).
(2)
Determine an optimum distribution pattern from schemes obtained in Step 2 with total damping coefficient scaled to the required minimum total damping coefficient. This procedure checks which distribution pattern is better under a given minimum total damping coefficient. The verification criteria are the same used in (1).
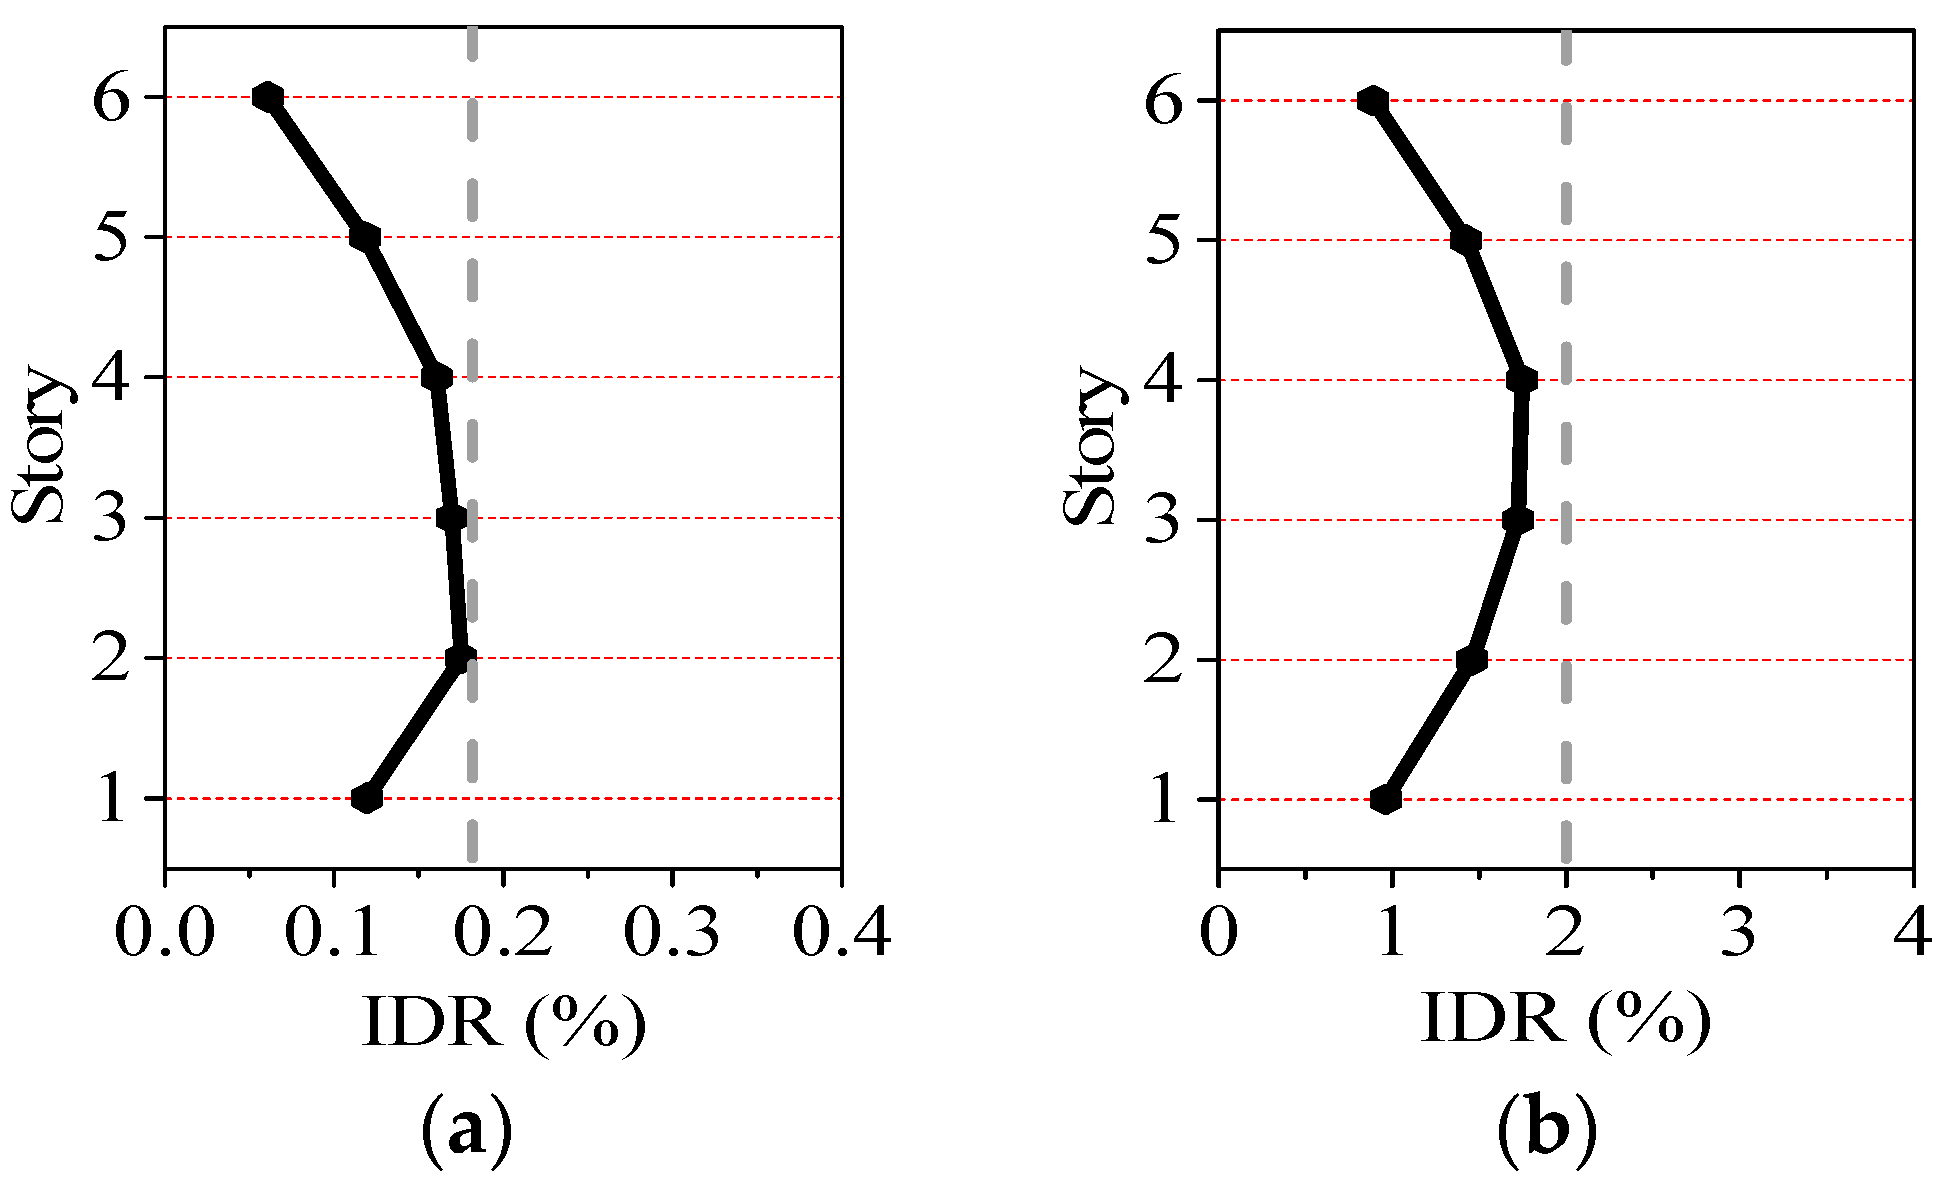
Using the above procedure, the final optimum scheme will be obtained. For the example frame, the required minimum total damping coefficient is 3,550,000 N·(s/m). Scaling all the other schemes’ total damping coefficients to this value, and checking the average inter-story drift ratios again, the final optimum retrofitted scheme is obtained and referred to as scheme 5, as shown in Table 6. Figure 6 shows that the optimum retrofitted scheme satisfies the code-specific requirements for the average inter-story drift ratio under frequent and rare earthquake intensities (1/550 and 1/50, respectively [3]).

2.3. Comparison of Failure Pattern and Collapse Fragility

This section verifies the seismic performance of the frame after retrofitting with the optimum scheme. The yielding occurs if the cross-section curvature response is larger than the yielding curvature value. Note that the concrete and rebar in a cross-section may be the same, but different axial compression ratios in columns among different stories lead to the cross-section curvatures not being the same in different stories. The calculated yielding curvatures for the side columns from the 1st to 6th story are 0.0111, 0.0099, 0.0090, 0.0092, 0.0078, and 0.0067 m−1, and those for the center columns are 0.0107, 0.0113, 0.0102, 0.0102, 0.0085, and 0.0069 m−1.
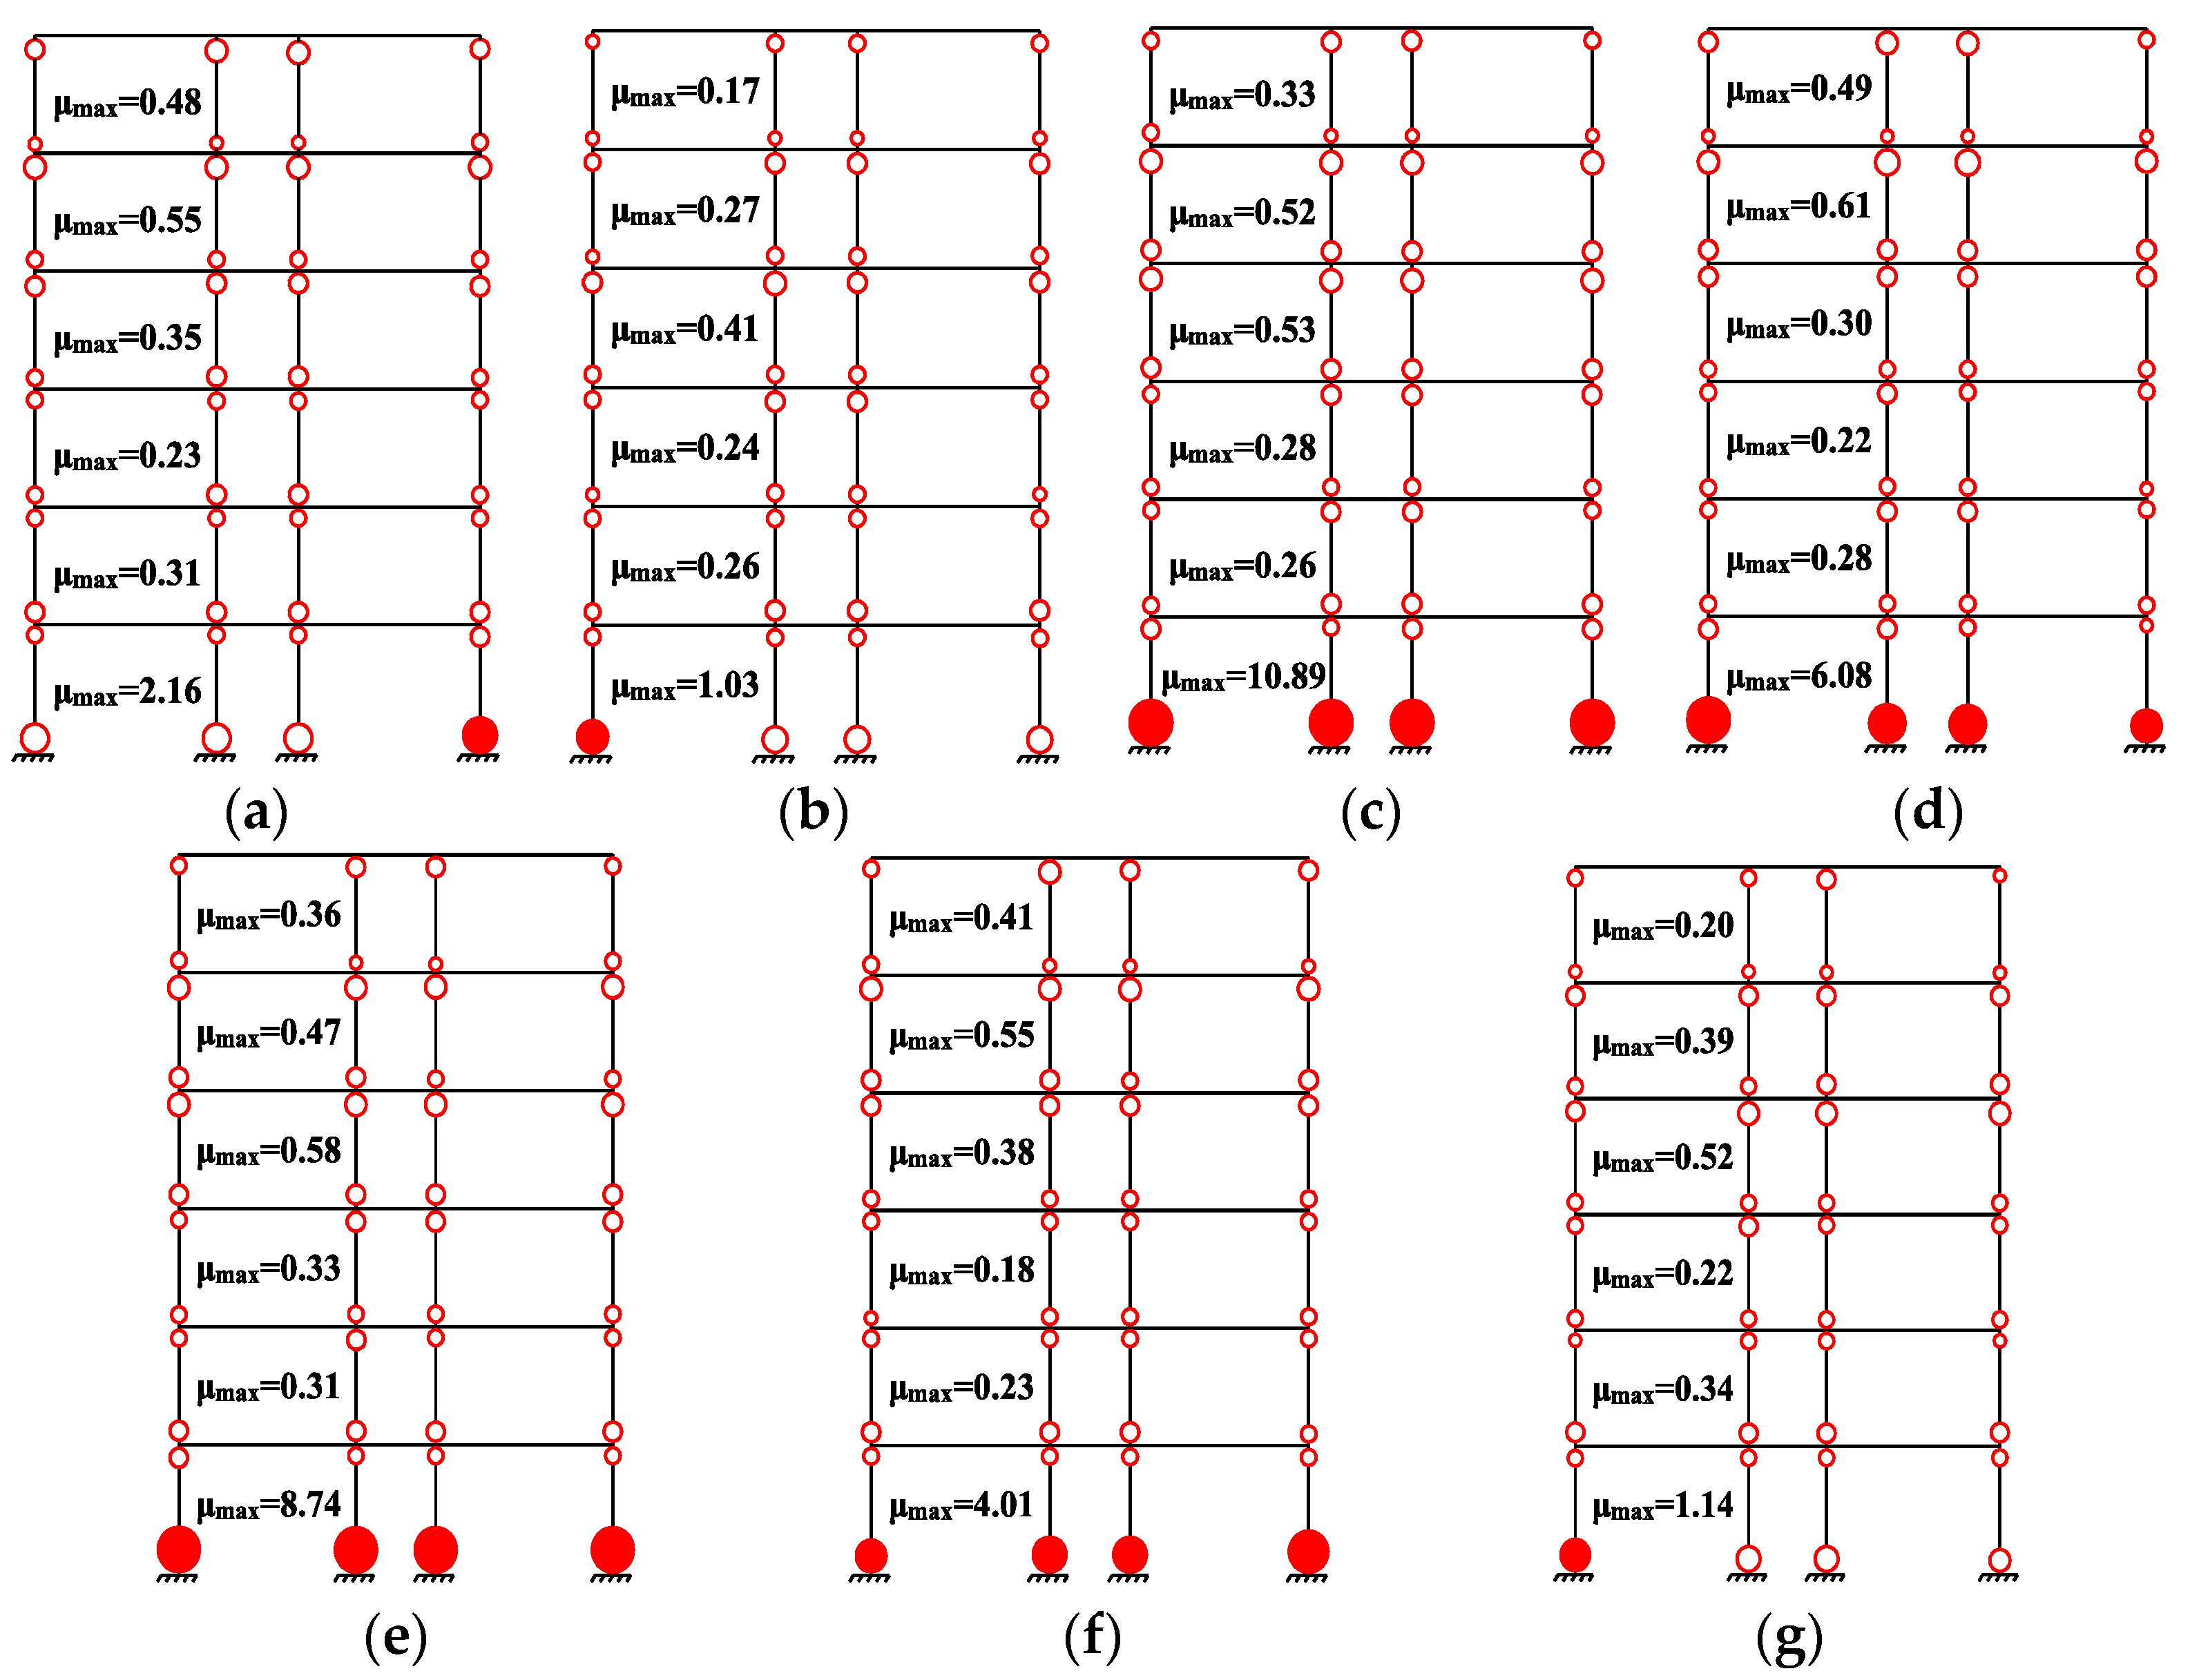
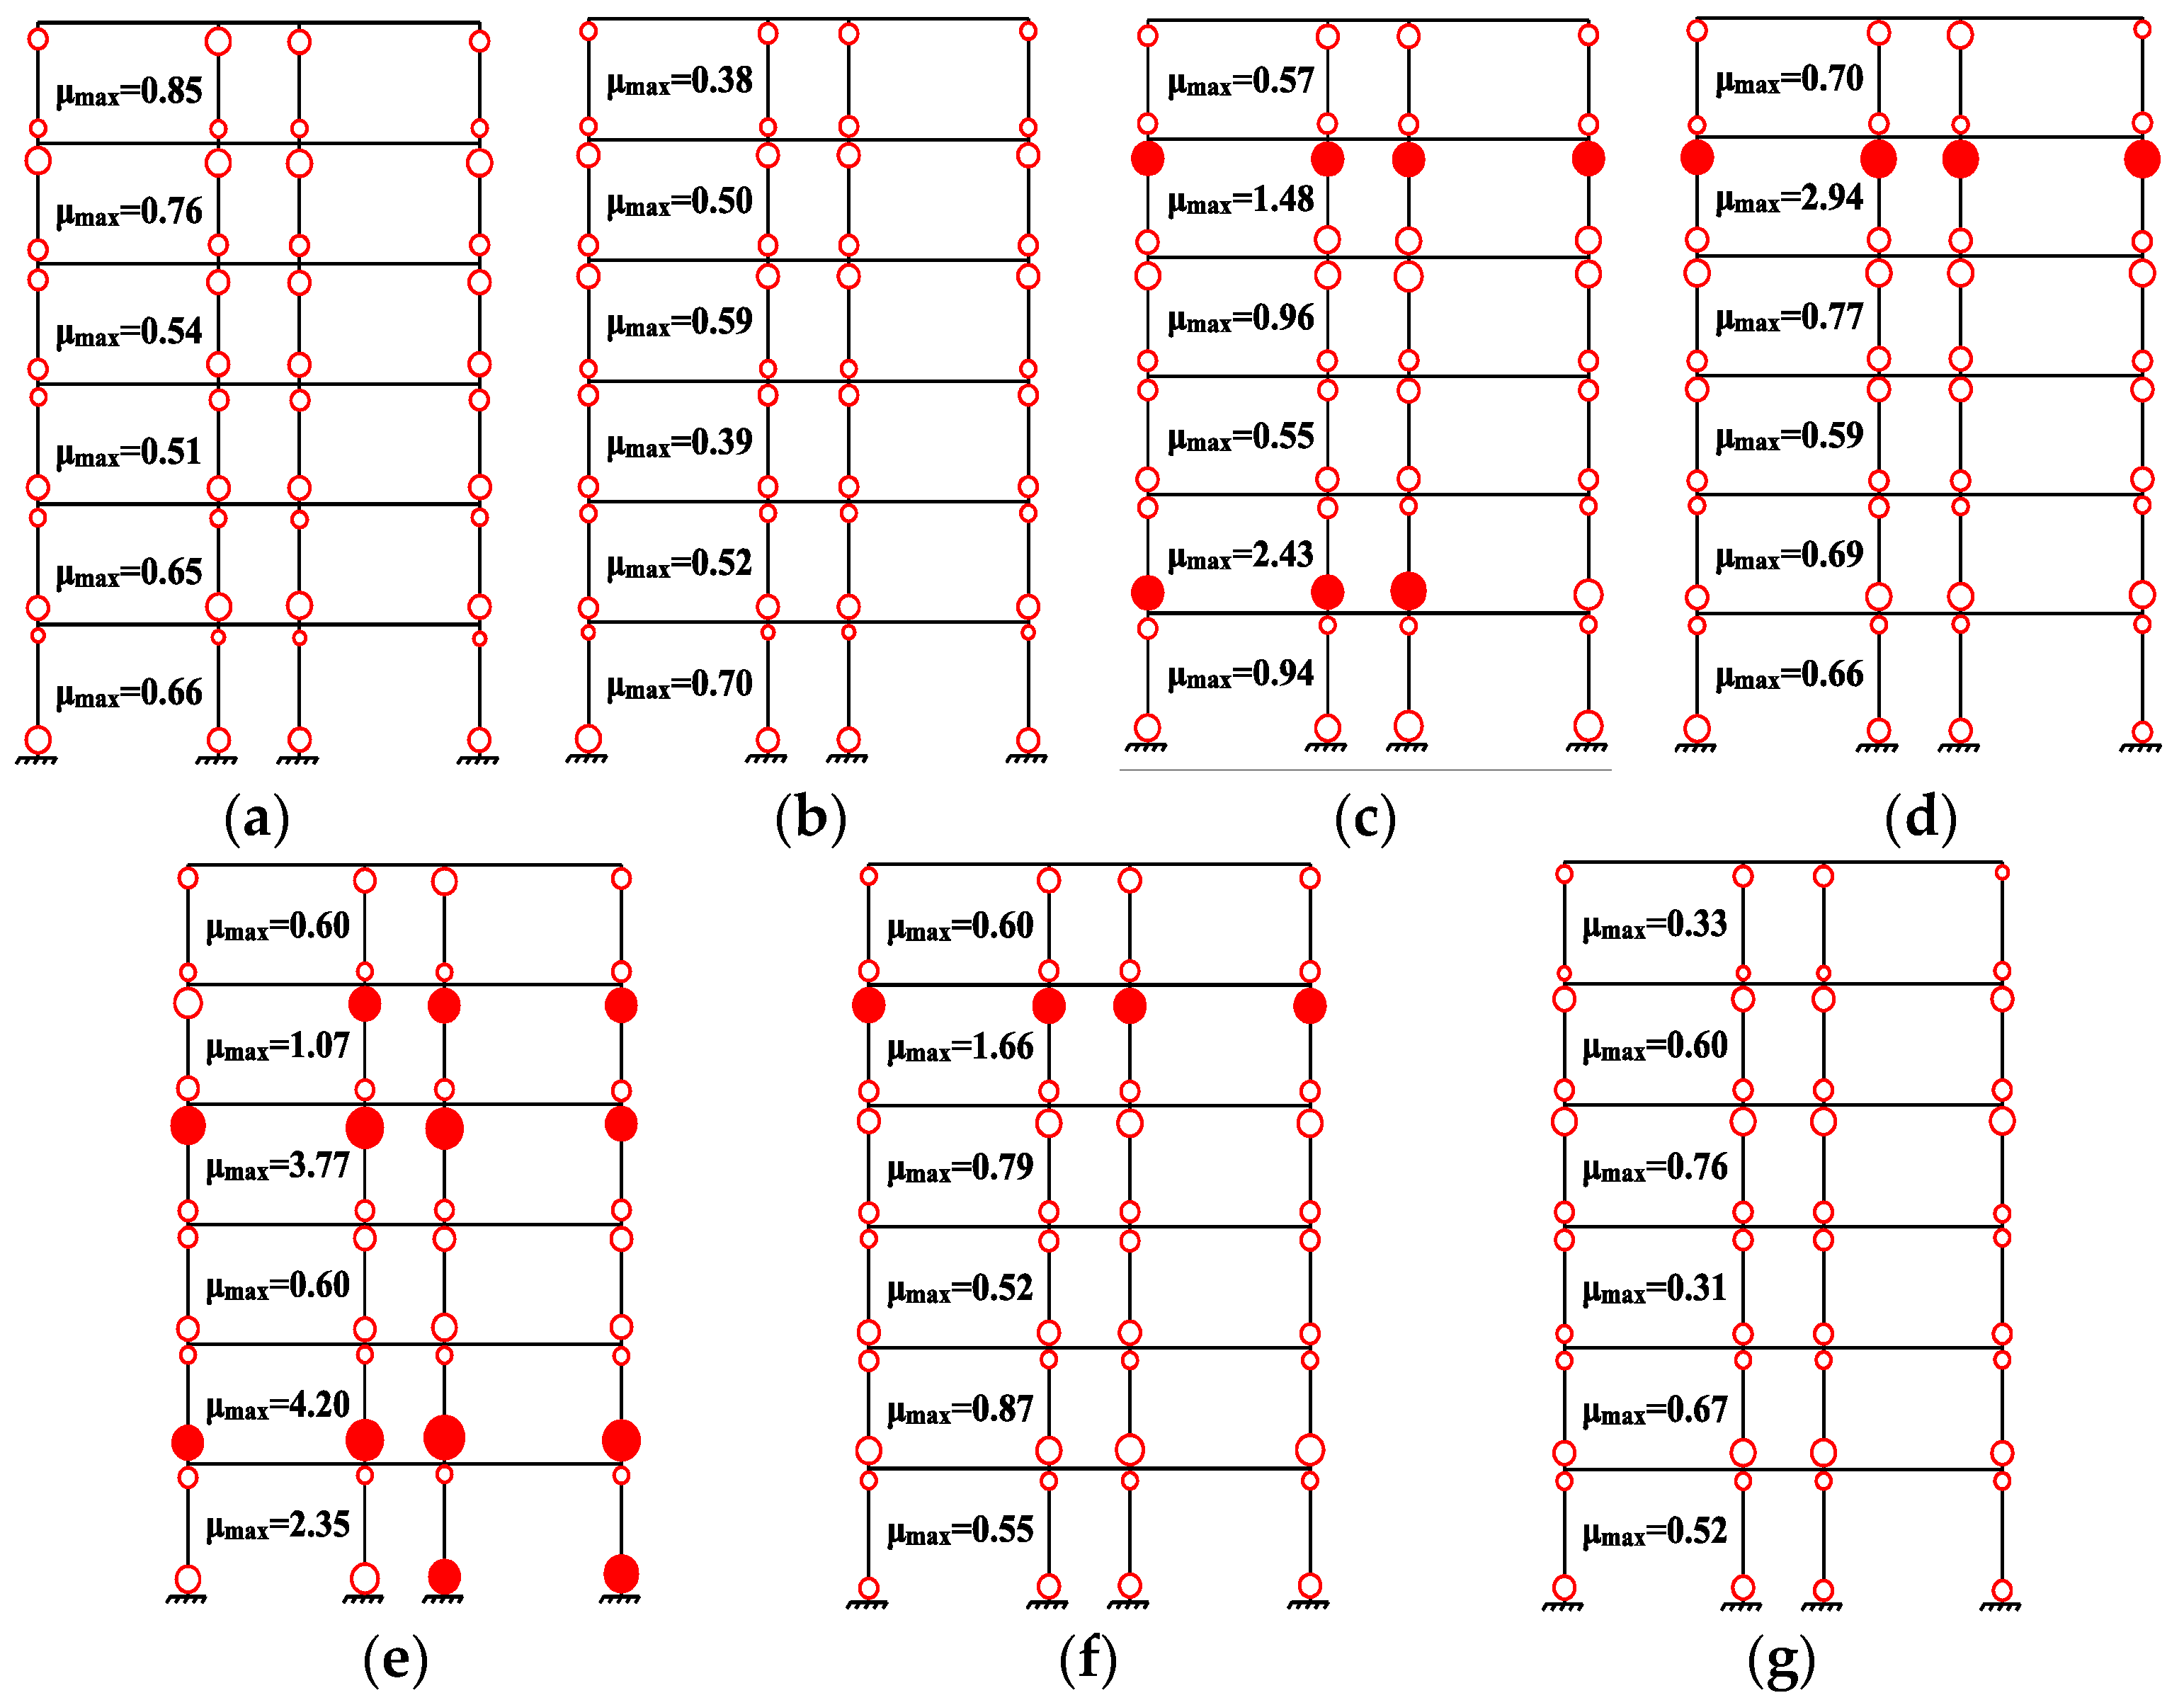
Figure 7 and Figure 8 show the maximum curvature ductility μmax (maximum value/yielding value) of columns in each story. The hollow red circle shows that the yielding is not achieved where μmax < 1. The solid red circle shows that the yielding is achieved where μmax ≥1. In order to provide a clear demonstration, the viscous dampers placed on the structure are not displayed in the figures. The figures show that, for the initial retrofitted structure, the yielding occurs and the collapse occurs at the bottom section of the firs story columns under anyone of the 7 GMs, while the upper stories remain elastic. As a contrast, for the optimum retrofitted structure, yielding does not occur under GM 1, GM 2, and GM 7. Meanwhile, it seems that the yielding moves from the bottom story to upper stories. Compared to the initial retrofitted structure, the yielding occurs more uniformly, and the maximum curvature ductility μmax decreases by 51.6%~77.7% at the same locations. Therefore, the optimum retrofitted structure has a smaller probability of collapse. This figure clearly illustrates the effectiveness of the optimum retrofitted procedure.
The collapse fragility, which is calculated using Equation (5) [48], is adopted to compare the change of the collapse-resistant capacity of the frame.
P ( Collapse | IM = i m ) = Φ ( ln ( x / m R ) β R )
Here is the standard normal distribution function; P ( Collapse | IM = i m ) is the probability of collapse under GM with intensity im; and m R and β R are the median value and logarithmic standard deviation of the fragility. The collapse frequency shown by Equation (6) can be also used to calculate the fragility; then, n c and N t o t a l are calculated by statistical data, and finally fitted by Equation (5) to obtain a smooth fragility curve.
P ( Collapse | IM = i m ) = n c N t o t a l
In Equation (6), nc is the number of collapse cases under GM with im (intensity measure); Ntotal is the number of total dynamic analyses under GM with im. The acceleration spectral intensity S a ( T 1 , ξ = 5 % ) is used as im in the analyses.
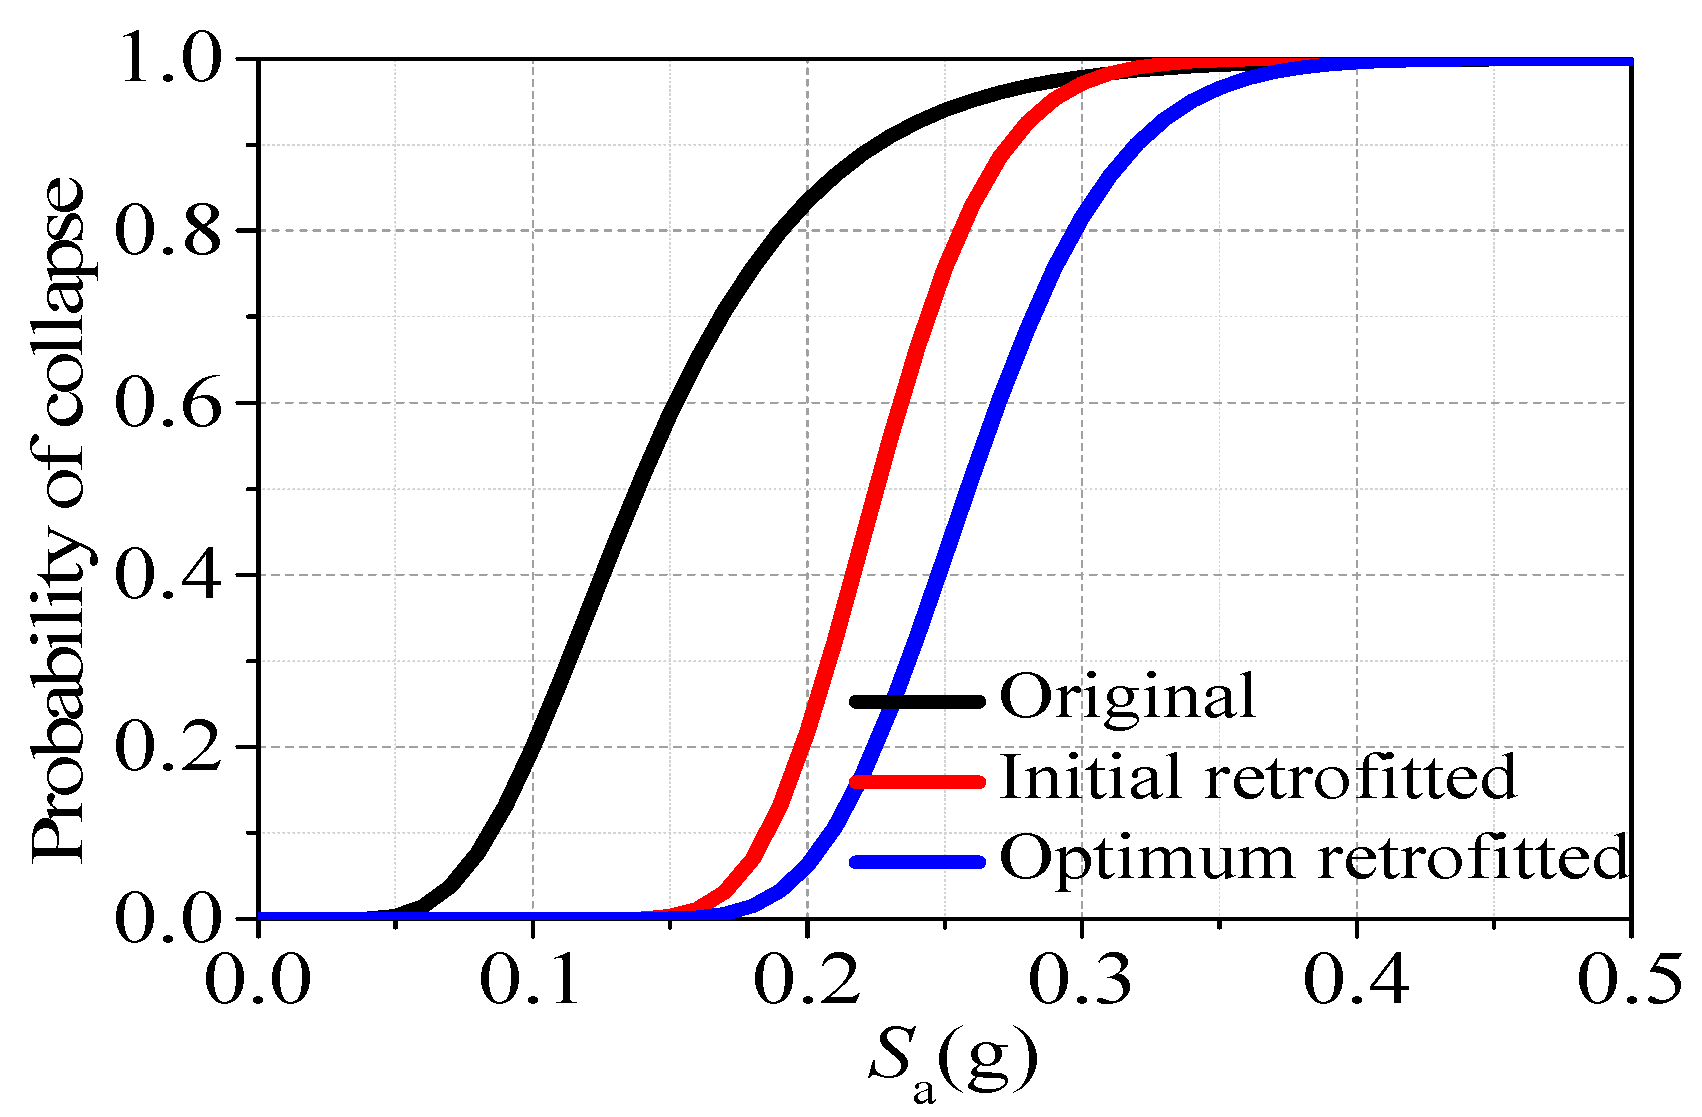
Figure 9 shows the fragility curves of the original frame, initial retrofitted frame, and the optimum retrofitted frame. In this figure, the result of the original frame was also provided because we want to illustrate both the retrofitting effect on the original structure and the optimum effect on the initial retrofitted frame. The figure shows that the collapse probability of the optimum retrofitted frame is the smallest, which demonstrates that the placements of viscous dampers can increase the structural collapse-resistant capacity. The maximum decline of collapse probability between the original and optimum retrofitted frames is 77.26%, and that between the initial retrofitted and optimum retrofitted frames is 33.53%. Note that the retrofitting costs of the initial retrofitting and optimum retrofitting are the same.

3. Extension to 3D Structures

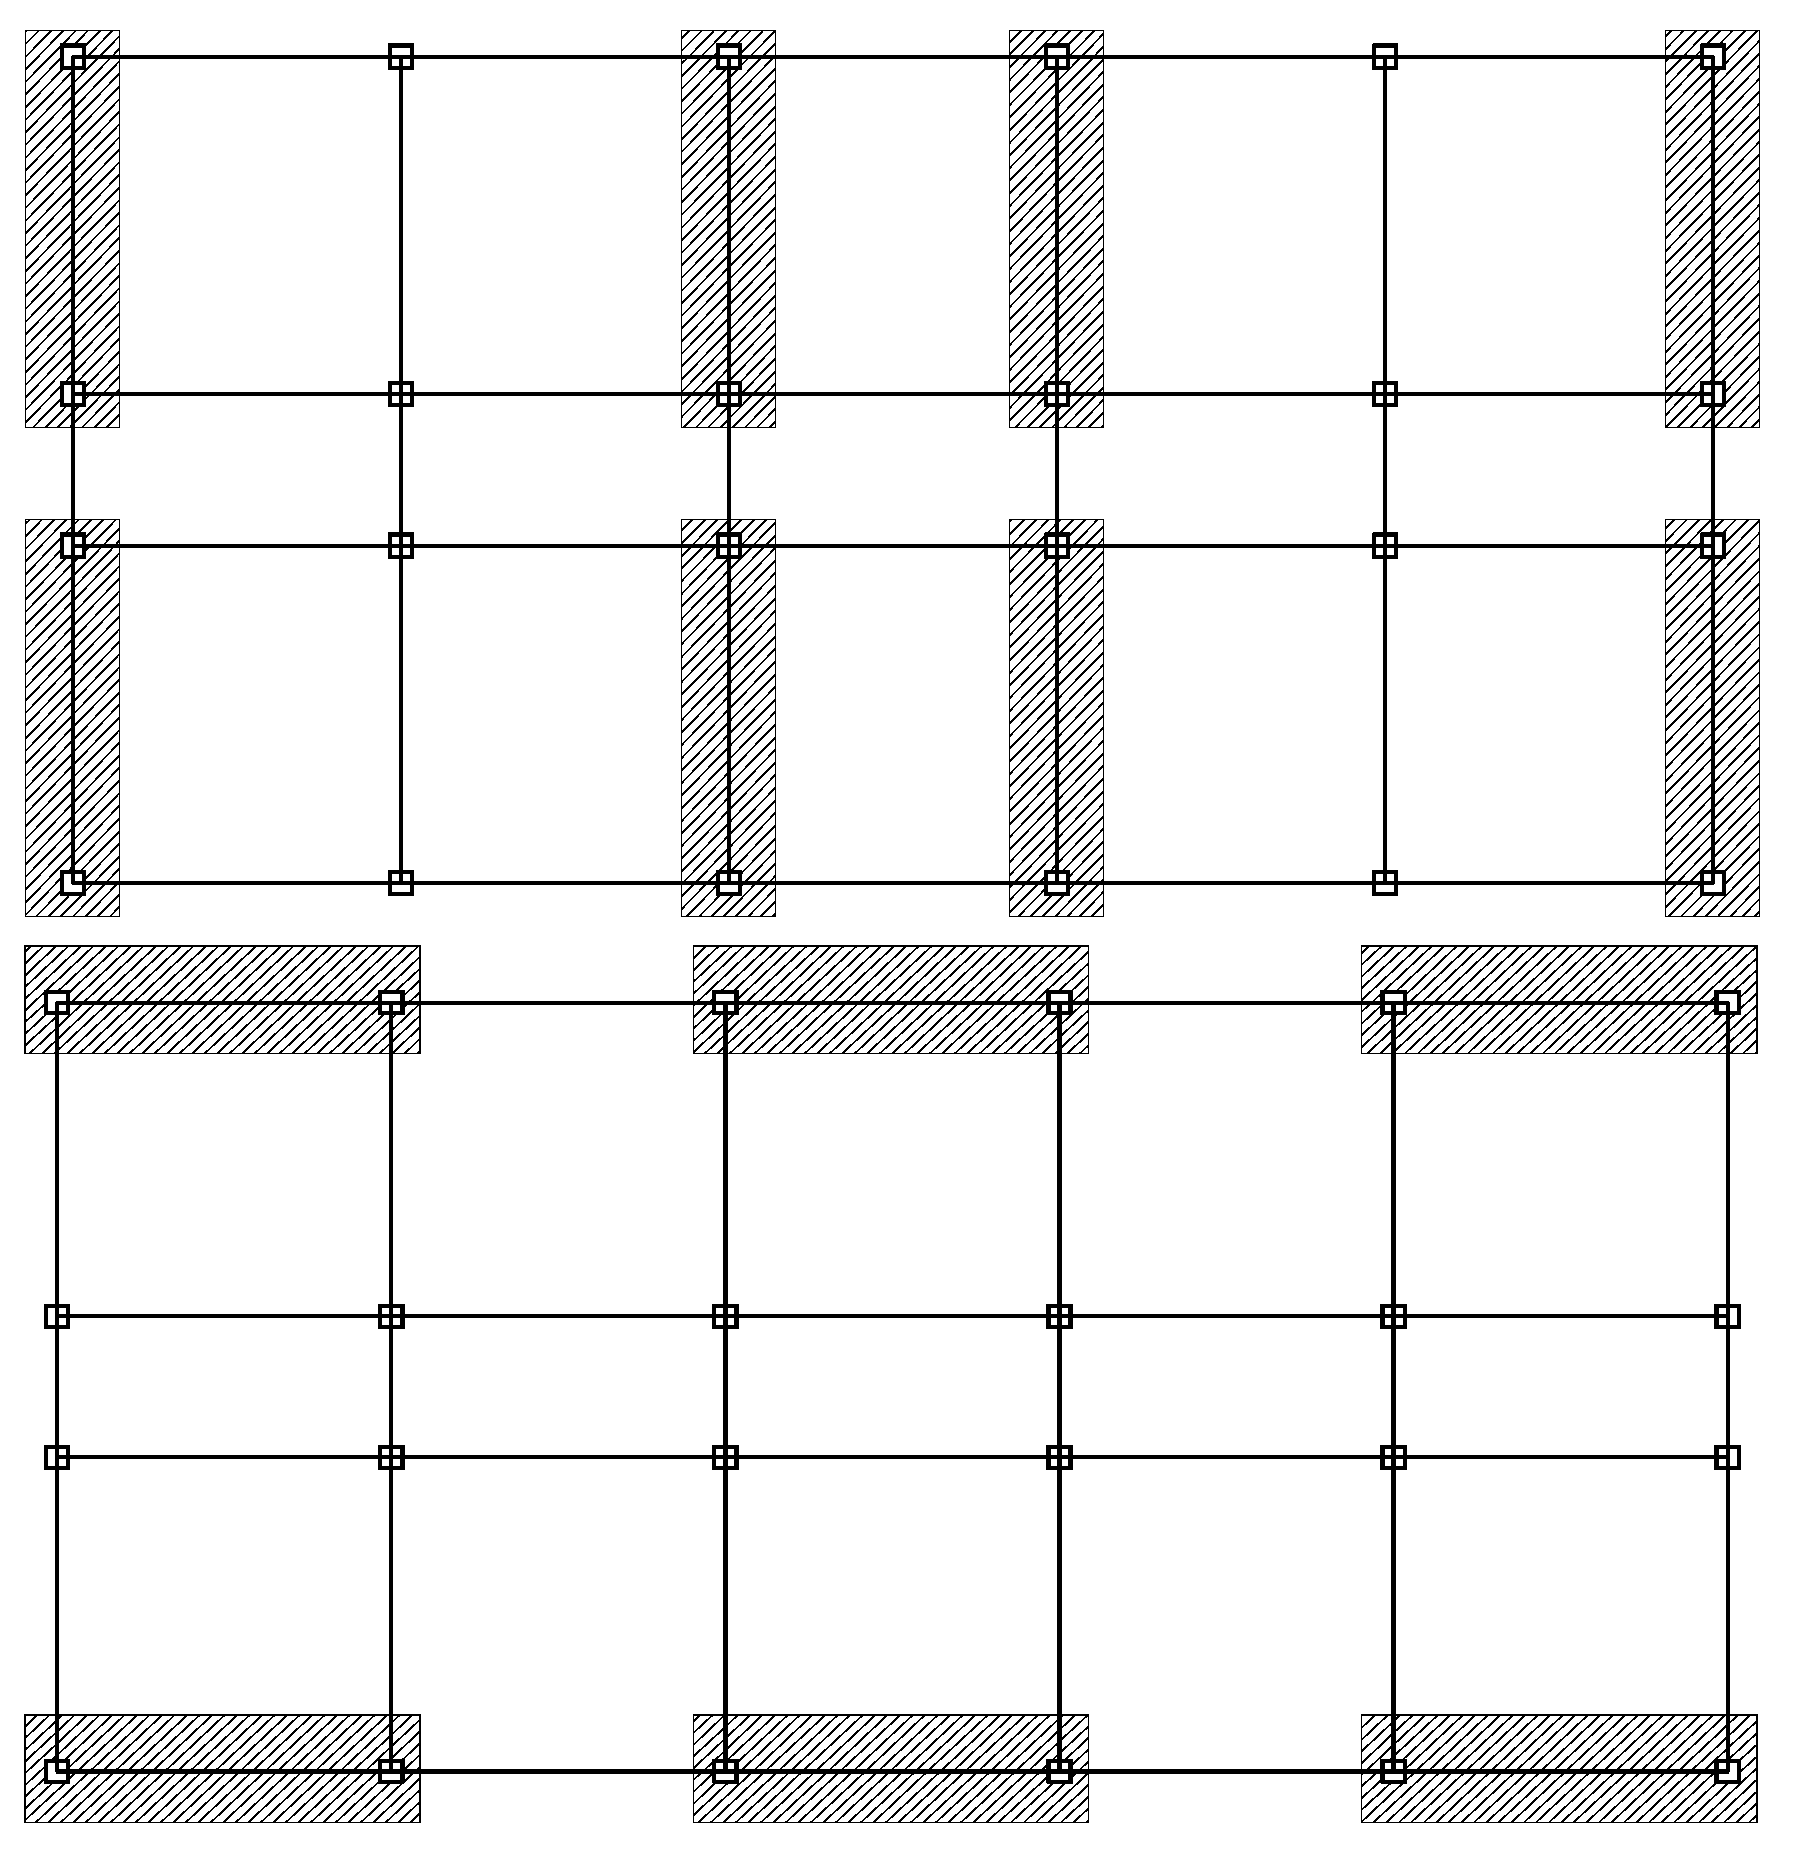
The practical application of retrofitting is always on an actual 3D structure. This section will provide a way to extend the 2D results to 3D structures, which will significantly reduce the computational cost in the optimum retrofitting procedure. The 3D frame shown in Figure 1 is with 3-bay in X direction and 5-bay in Y direction. The dampers will only be installed at a few places in a 3D structure in order to minimally disturb the structural functions. Figure 10 shows the bays at which viscous dampers are placed in X direction and Y direction.
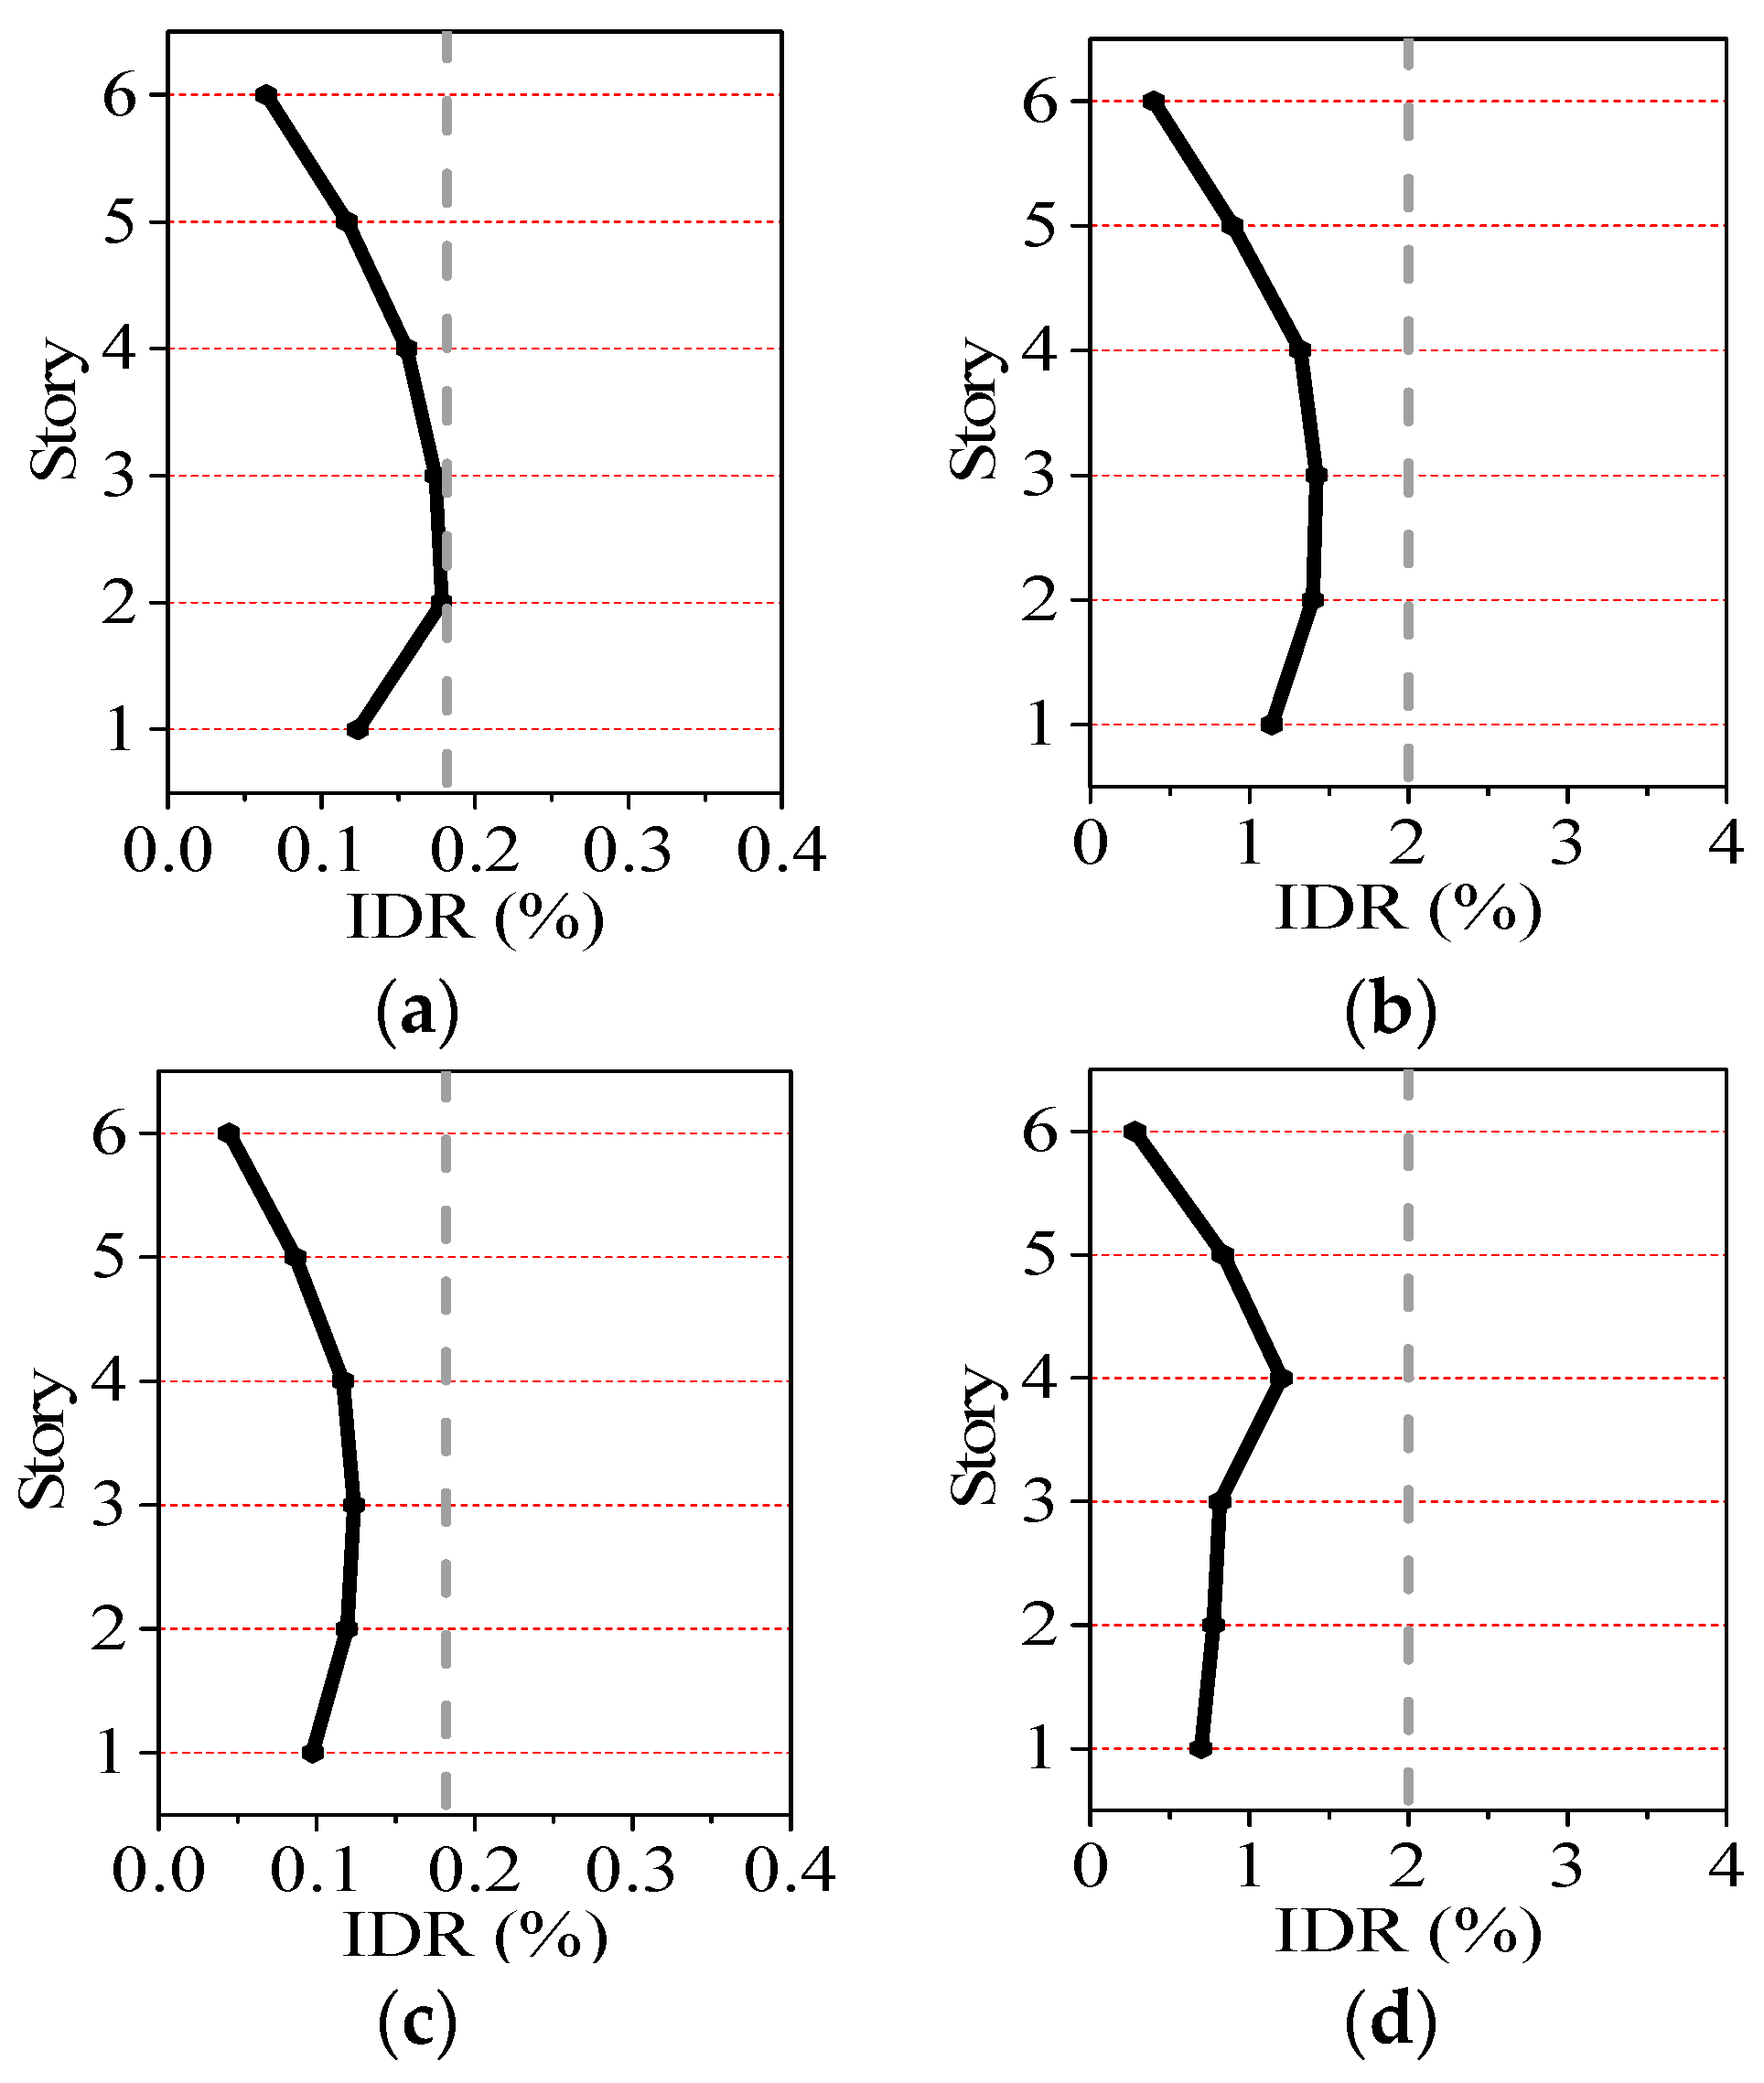
Since the distributions of the story lateral stiffness and story strength of the 3D frame are similar to those of the planar frame used in Section 2, the distribution patterns of additional story damping coefficients can be the same as those in the 2D case, and the values can be proportional to the results obtained by using the 2D case. As stated in Section 2.2.3, scheme 5 in Table 6 is the optimum scheme in the 2D case. Table 7 provides the damping coefficients used in the retrofitting in X direction and Y direction, respectively. Note that these values are for one of the planar frames in the 3D frame; i.e., 1/4 of the total damping coefficient used in X direction and 1/2 of the total damping coefficient used in Y direction. The damping coefficients in X direction are calculated as 1.5 times the values obtained in the 2D case. For the damping coefficients in Y direction, the distribution pattern is fixed but the values need to be determined. By using a trial-and-error method, the total damping coefficient is determined to be 8,875,000 N·(s/m). The ground motions are applied in both X direction and Y direction. Figure 11 shows the average inter-story drift ratios under the frequent earthquake and the rare earthquake in X direction and Y direction, which indicate that the structural performance satisfies the code-specific requirements (1/550 under frequent earthquake and 1/50 under rare earthquake). Collapse fragility analyses are also conducted on the initial retrofitted frame and optimum retrofitted frame in X direction and Y direction which reveal that, with the same retrofitting cost, the optimum retrofitted frame has a larger collapse-resistant capacity with about 15% increases compared with the initial retrofitted frame.

4. Economic Analysis for the Proposed Method

The above study focuses on the seismic performance of the retrofitted frame. The economic benefit should be determined, as it has an impact on whether the retrofitting can be conducted or not. Therefore, this section discusses the economic benefit of the retrofitting of existing frame structures from low to high seismic hazard regions. The methodology proposed in FEMA P-58 and the PACT software [49] are used to conduct the economic analysis. Note that we have not investigated any other retrofitting solution, such as seismic isolation, and so the economic benefit analysis is only assessed for retrofitting with viscous dampers.

4.1. Performance Group of Structural and Non-Structural Members

The replacement cost is calculated as (249.03 × 441 × 6)/104 = 65.9 MUD (MUD represents one million/100 US dollars), in which 249.03 US dollars is the statistical construction cost of 1 m2 at the building location [50], 441 m2 is the slab area of one story (see Figure 1), and 6 is the number of stories. The total replacement cost includes the core, shell, and all tenant improvements and contents [49]. Considering that the building’s function is a middle school, the total replacement cost is finally determined to be 76.7 MUD, including the cost due to structural replacement 65.9 MUD, and costs due to the damage of electronic teaching platforms, projectors, tables and chairs, blackboards, and computers (numbers and costs are provided in Table 8). Regarding the replacement time, including the foundation, upper structure, decoration, and elevator installation, etc., Table 9 provides the required workdays for each task according to the quota of construction information [51].
In the PACT software [49], members cataloged in the same performance group correspond to the same fragility curve. Table 10 provides the statistical structural and non-structural member information of the building. For the structural members, only the beam-column joint is set as a performance group because damage commonly occurred at the beam and column ends of the frame structures. Table 10 also gives the EDPs (Engineering Demand Parameters) used in the evaluation. IDR means that the member damage is sensitive to the inter-story drift ratio, and PFA means the member damage is sensitive to the peak floor acceleration. The fragility ID shows the fragility curves selected from the PACT software corresponding to the performance group. The costs of the performance groups in Table 10 are determined by using the built-in data in PACT software. Note that the performance groups in Table 8 are not built-in data in the PACT software, only similar fragility IDs are used and the costs are determined by their market prices.
The cost of viscous dampers is proportional to the damping coefficient. After inquiring with several damper companies, the costs for viscous dampers in a single bay along the structural height in X direction were determined to be 4085, 3400, 1395, 127, 0, and 0 (a total of 9006 US dollars), and the costs for viscous dampers in a single bay along the structural height in Y direction are 6807, 5666, 2326, 211, 0, and 0 (a total of 15010 US dollars). Therefore, the total cost of all viscous dampers is (9006 × 2 × 4 + 15010 × 3 × 2)/105 = 16.2 MUD. The installation of a viscous damper needs 2 workers with 1 workday, and the cost is estimated as 45 × 2 = 90 US dollars, in which 45 US dollars are estimated as the salary for 1 worker per day at the building’s location. The estimated total number of required viscous dampers is 56, hence the total installation cost is (90 × 56)/104 = 0.5 MUD. Therefore, the total retrofitting cost of the 3D structure is 16.2 + 0.5 = 16.7 MUD.

4.2. Economic Benefit Analysis

Since the structure is retrofitted considering an increase of seismic hazard, according to Chinese seismic codes, from Region 6 to Region 8 [3], the economic benefit is calculated for both the original and the retrofitted frames under the earthquake intensity corresponding to Region 8 (PGA = 0.07 g, 0.2 g, and 0.4 g for the frequent earthquake, the occasional earthquake and the rare earthquake). Note that the results of a large number of analyses would provide a smoothed distribution for the probabilistic evaluation of earthquake results. However, with the current state of modeling capability, such a method would be infeasible for implementation in practice. Instead, the PACT software uses the Monte Carlo procedure to evaluate possible outcomes given a limited set of inputs [49]. In this procedure, limited suites of analyses are performed by using actual GMs to derive a statistical distribution of demands using many of building response states for a specific intensity of motion. In the present study, 1000 Monte Carlo realizations were conducted for a GM intensity level. The GMs selected in Section 2.1 are used here.
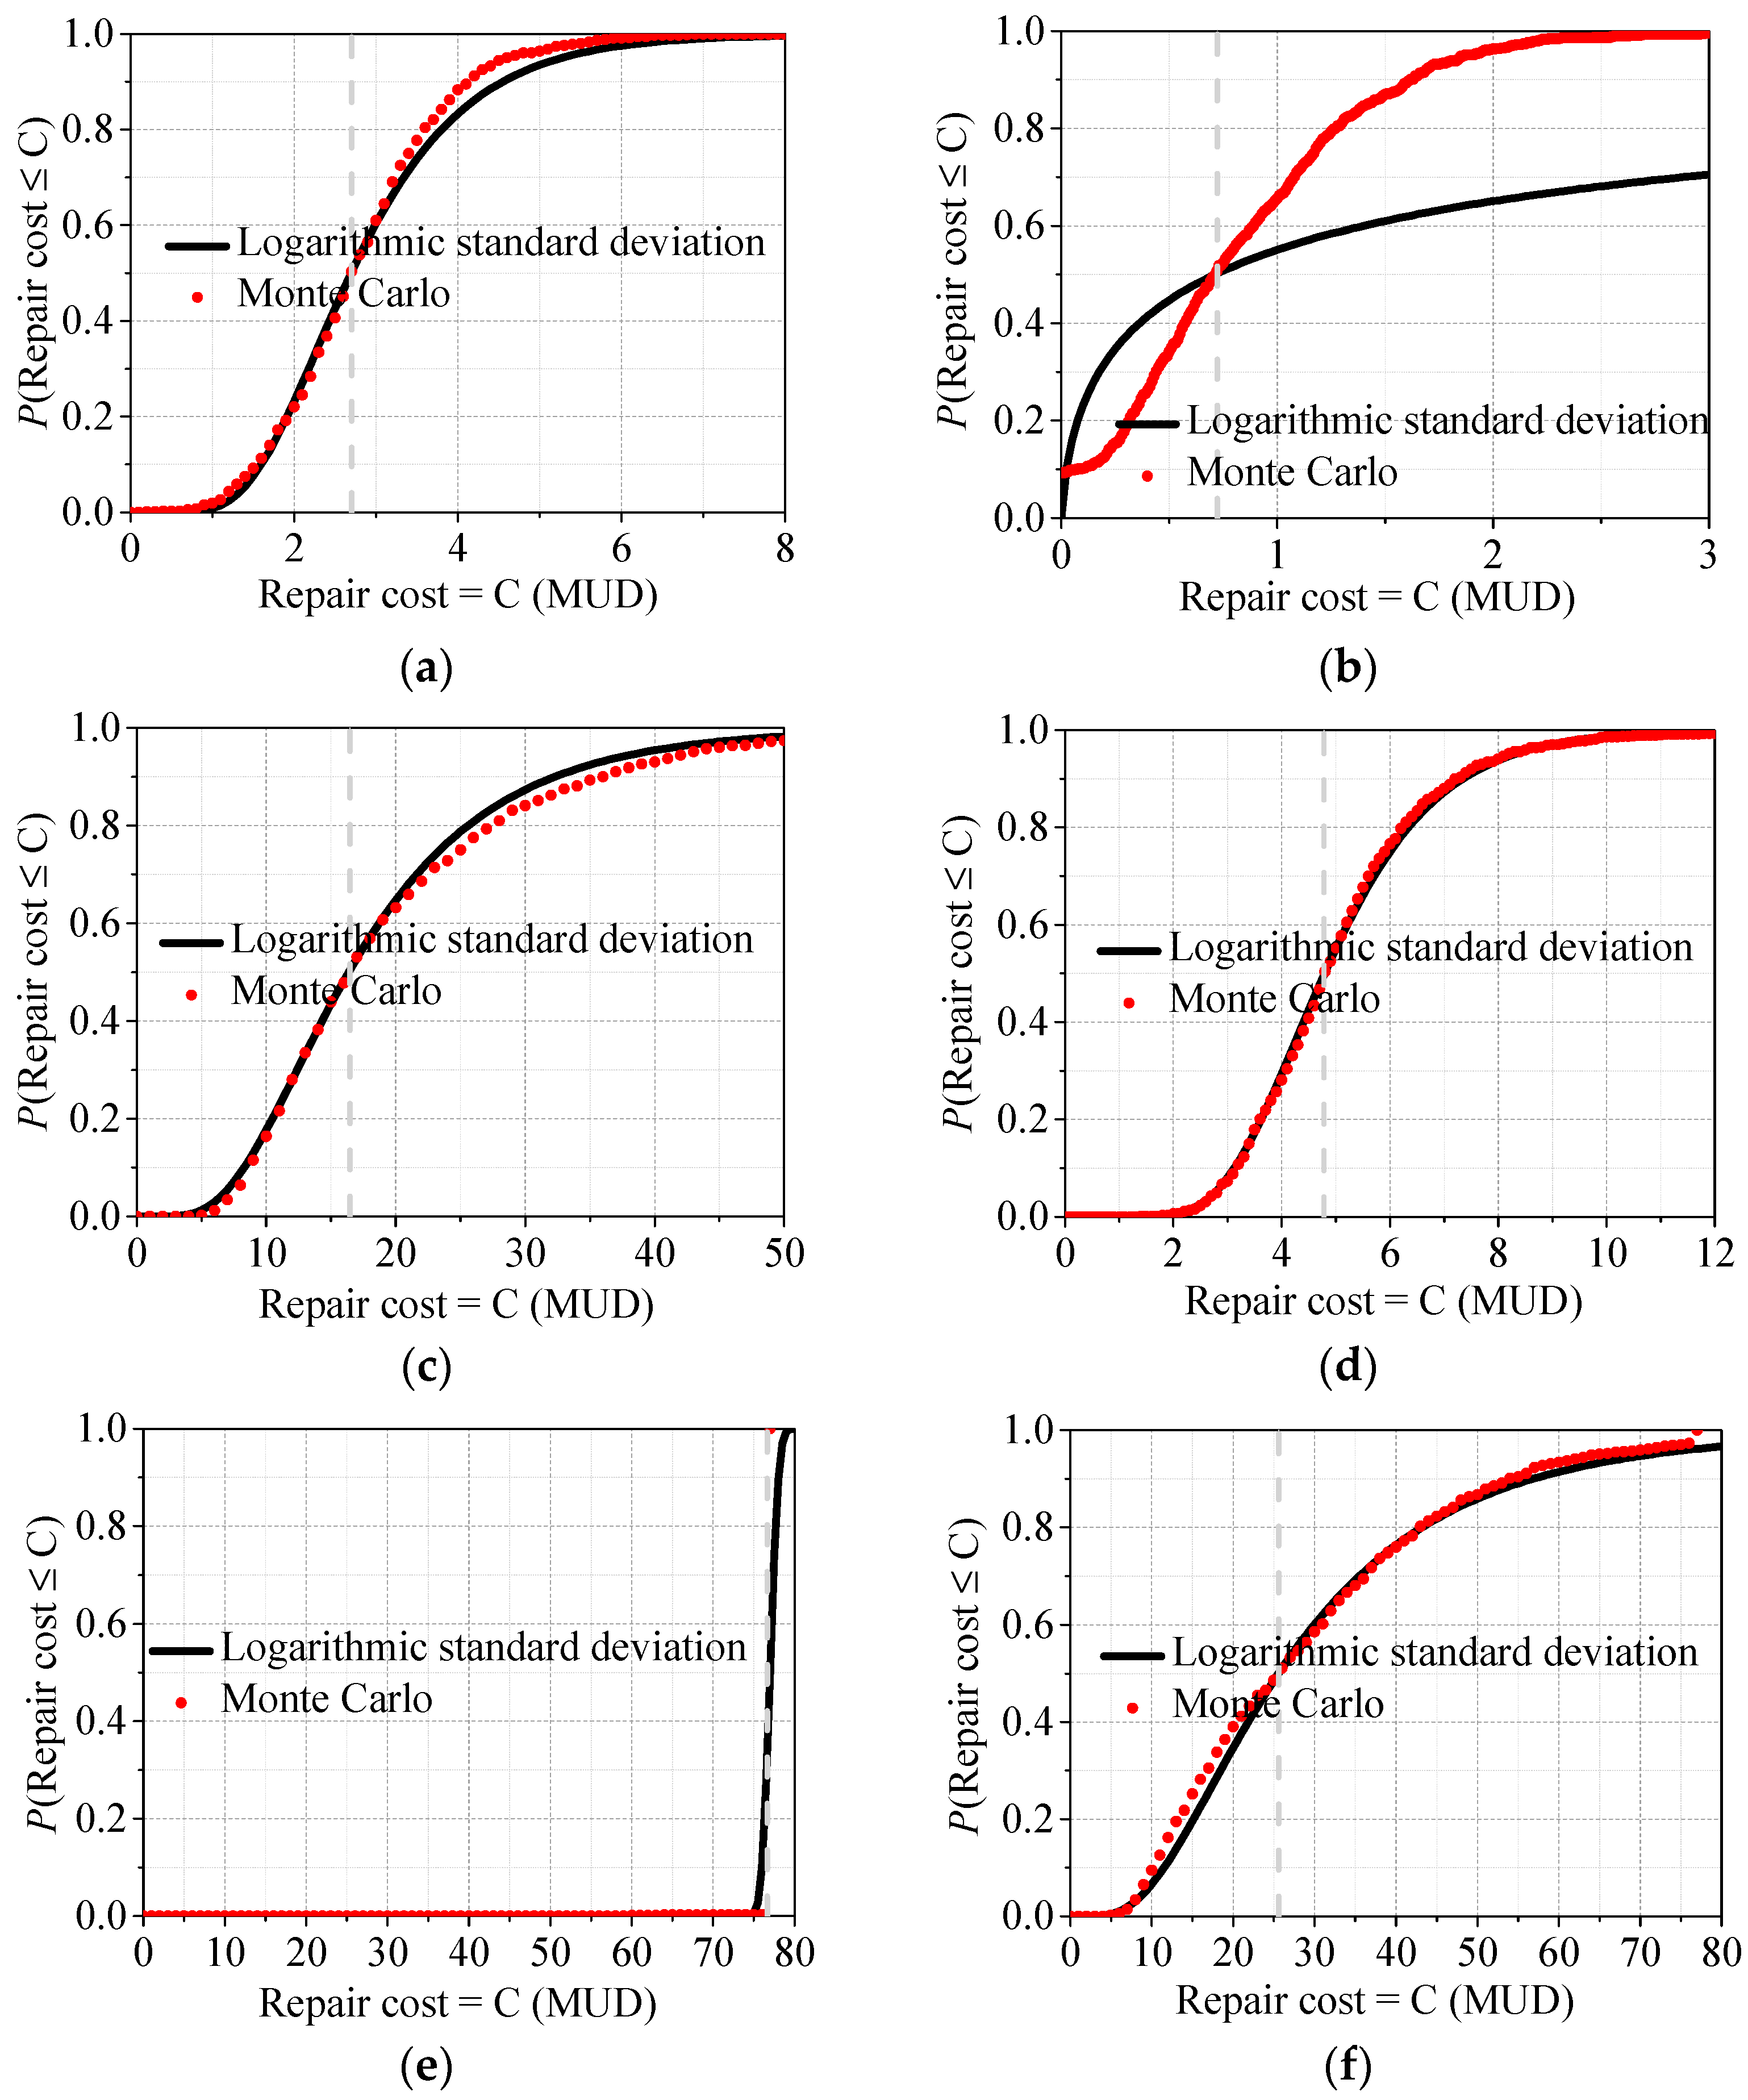
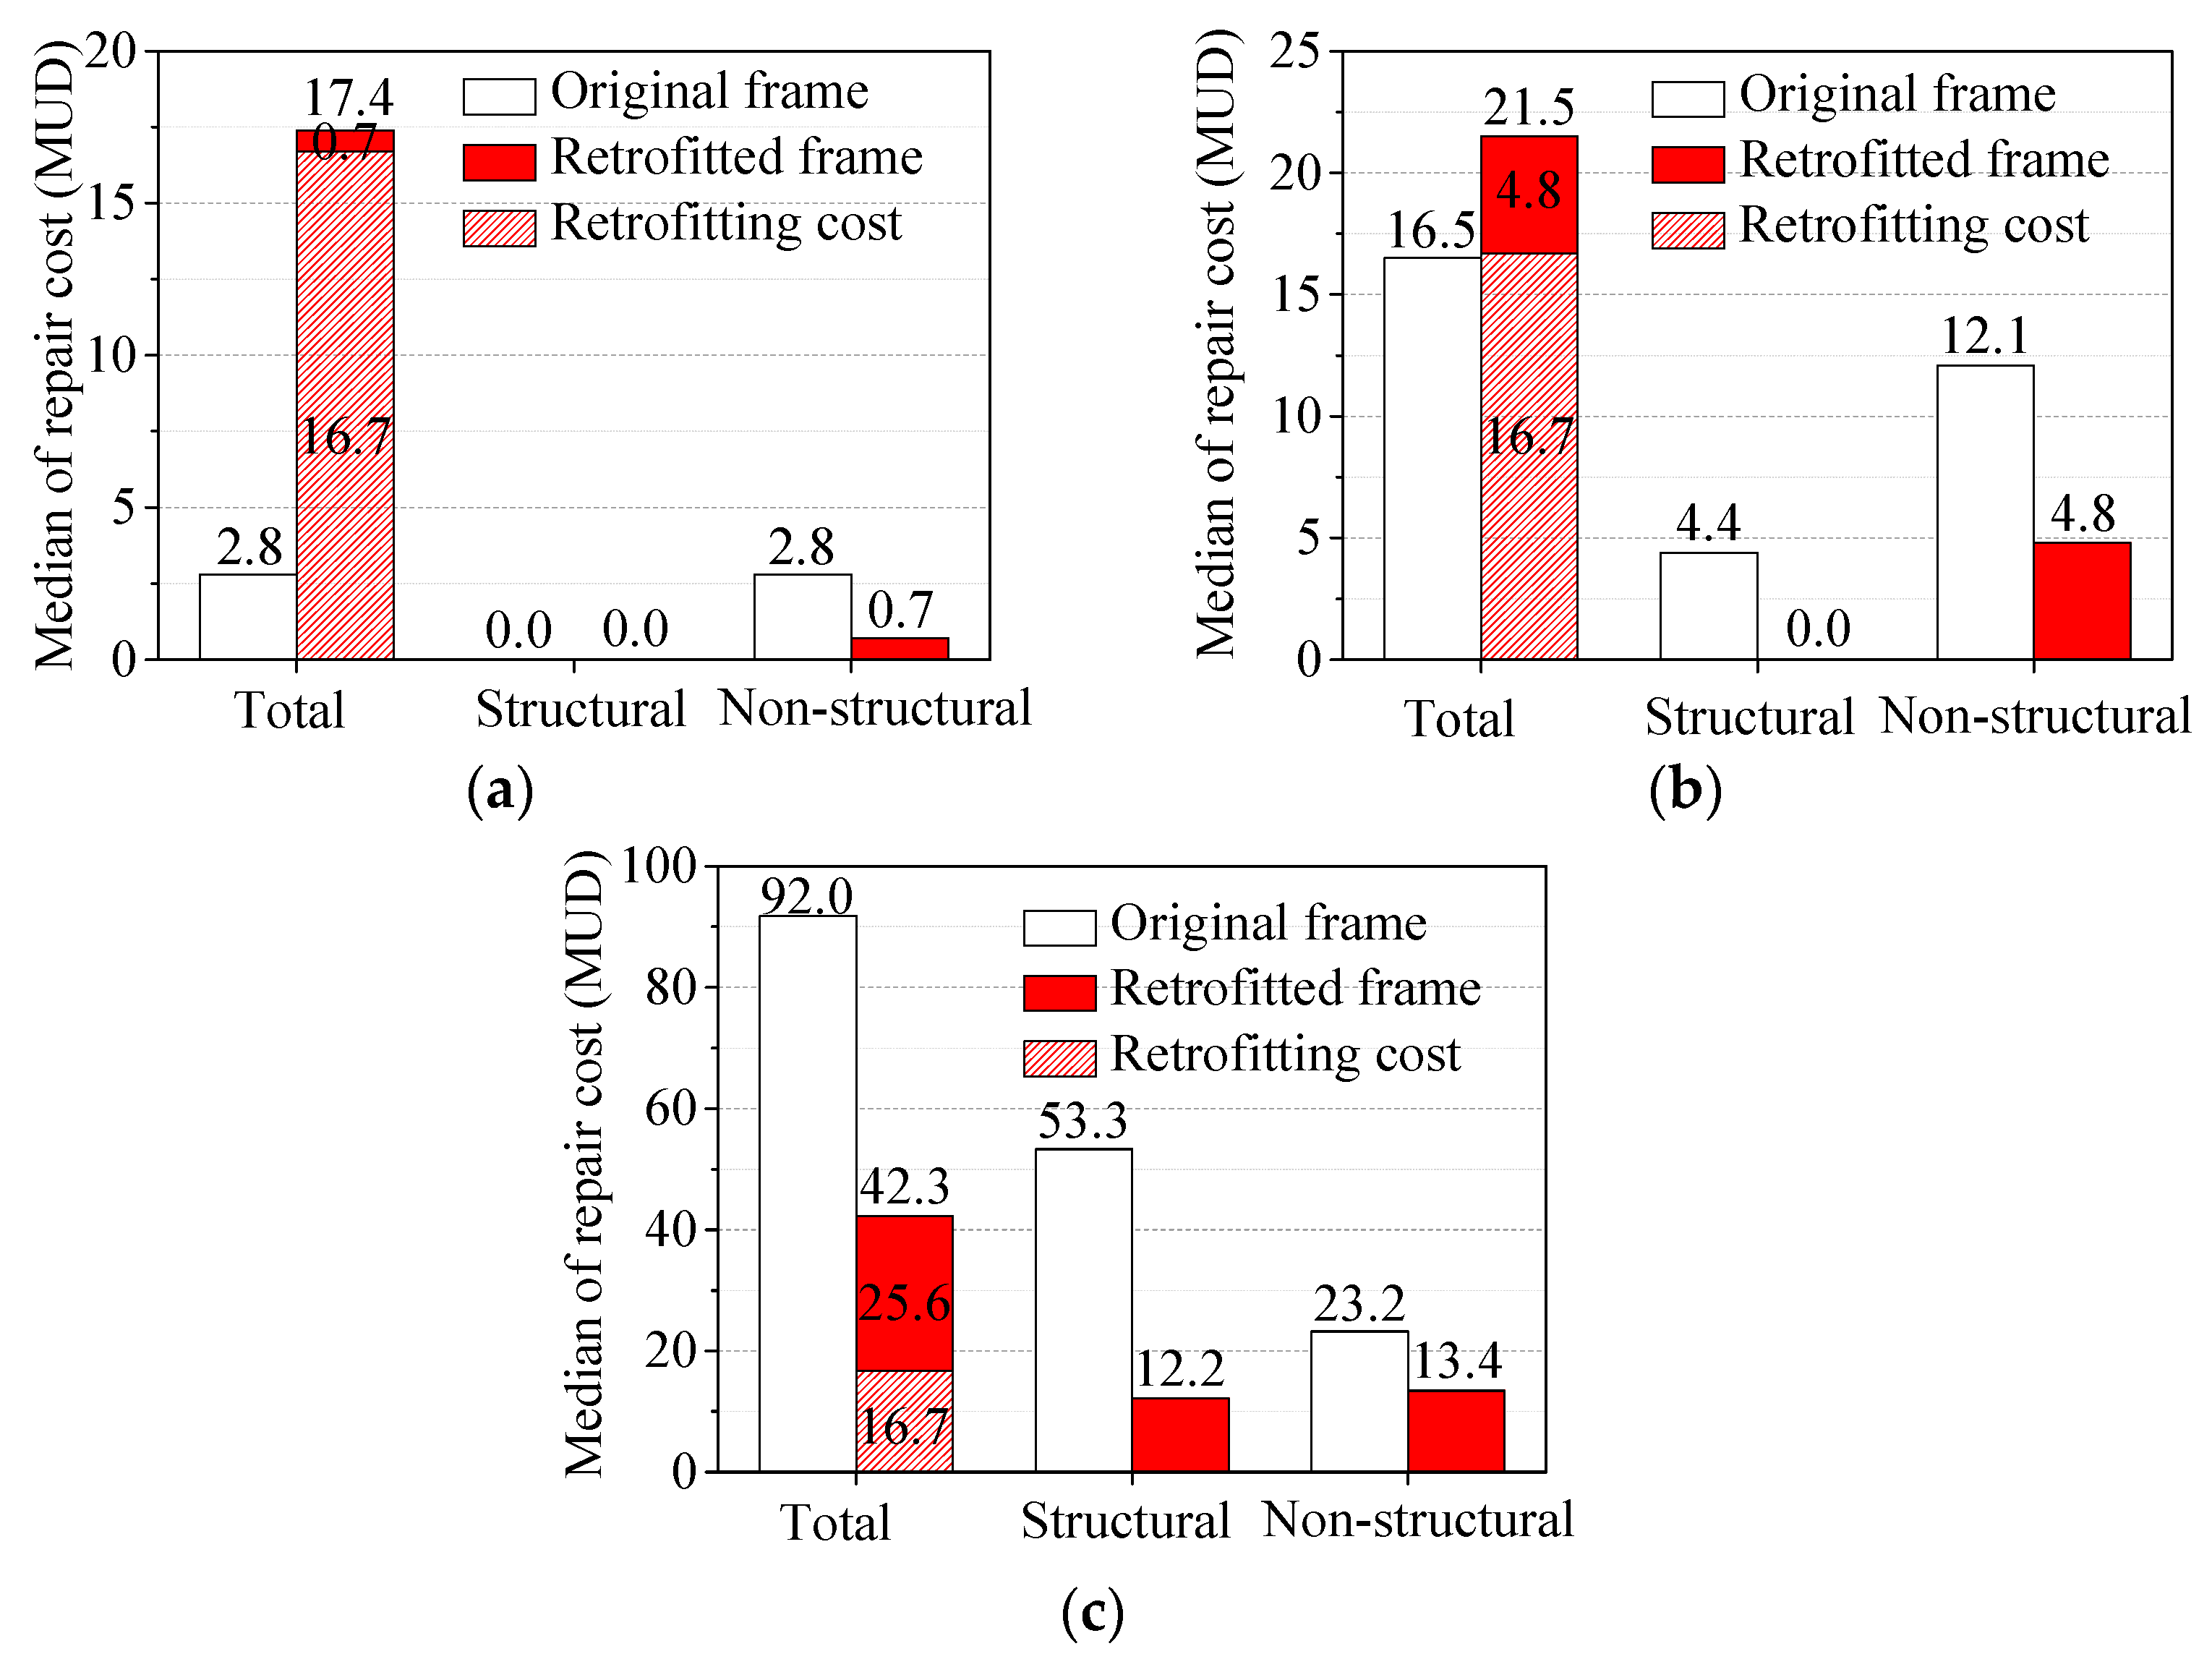
Figure 12a–f compares the repair costs between the original frame and retrofitted frame. These figures show that the probabilities are smaller than the specific repair cost levels. Figure 13 shows the median repair costs, which are the values corresponding to a probability of 50% in Figure 12. In the figure, we added the retrofitting cost (16.7 MUD) into the total repair cost in order to compare the economic benefit. The figure also compares the repair costs of structural members and non-structural members, respectively. According to FEMA P-58 [49], when the structure is seriously damaged, as in the case shown in Figure 13c, it is necessary to demolish the structure and remove it from the site. Hence, the repair cost (or the replacement cost, which is more rational here) includes the cost to demolish the damaged structure and clear the debris in addition to replacing the structure “in-kind”. Demolition and site clearance will increase structural repair costs by up to 20–30%. Under the rare earthquake excitation, the original frame collapses; therefore, the total repair cost increases by 20% in the calculation, i.e., 76.7 × 120% = 92.04 MUD. Hence, the ratio between the cost of complete replacement and the cost of retrofitting is about 45%.
The following observations can be made from these figures. (1) Under a frequent earthquake, for both the original and retrofitted frames, the losses are due to non-structural members, while the structural members’ damages are negligible. (2) Under an occasional earthquake, losses are due to both the structural and non-structural members in the original frame, in which the loss due to non-structural members makes up a large proportion. The retrofitted frame suffers no loss due to the structural members. If the initial retrofitting cost is not considered, the loss of the retrofitted frame is smaller than that of the original frame. (3) Under a rare earthquake, for both the original and retrofitted frames, the losses are due to both the structural and non-structural members. The repair cost due to structural members accounts for a large proportion. (4) Generally, the total repair cost, repair costs of structural members and non-structural members increase with the increase of GM intensity. If the retrofitting cost is considered, the economic benefit of the retrofitting is not favorable when a future earthquake has a frequent earthquake intensity, the economic benefit of the retrofitting is still not favorable (but acceptable) when a future earthquake has an occasional earthquake intensity, and the economic benefit of the retrofitting is favorable and can save life when a future earthquake has a rare or larger earthquake intensity.
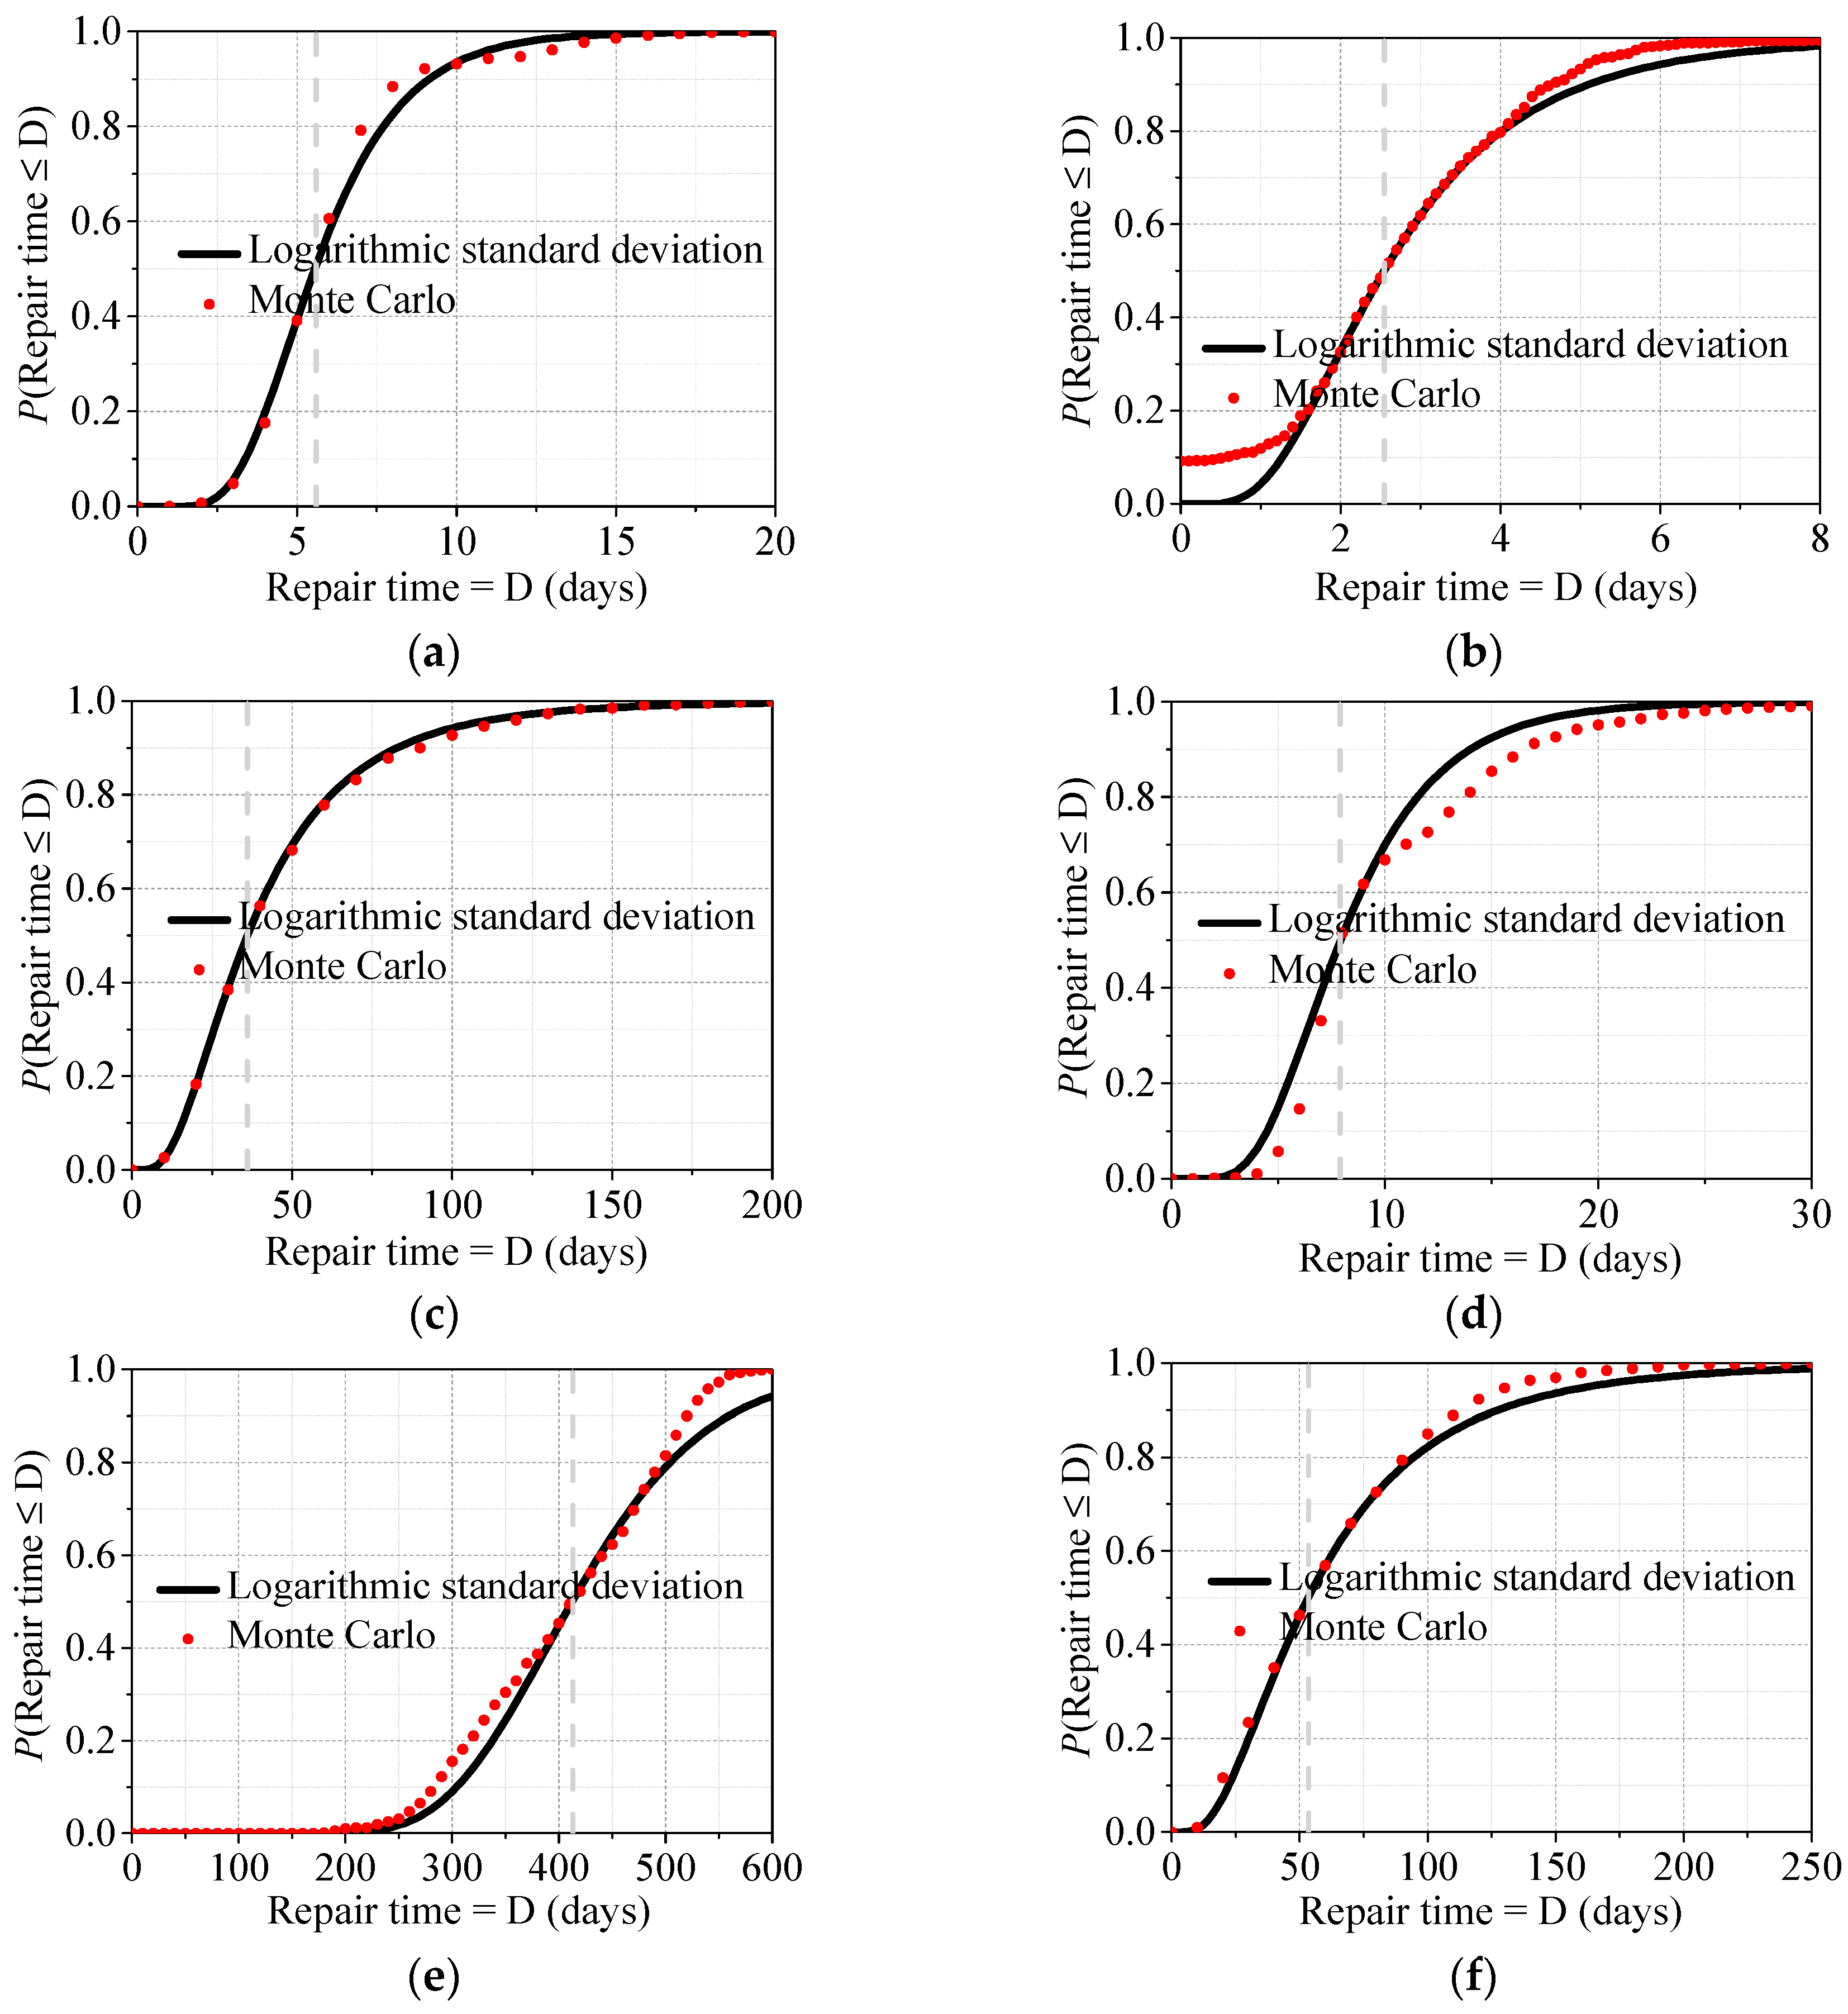
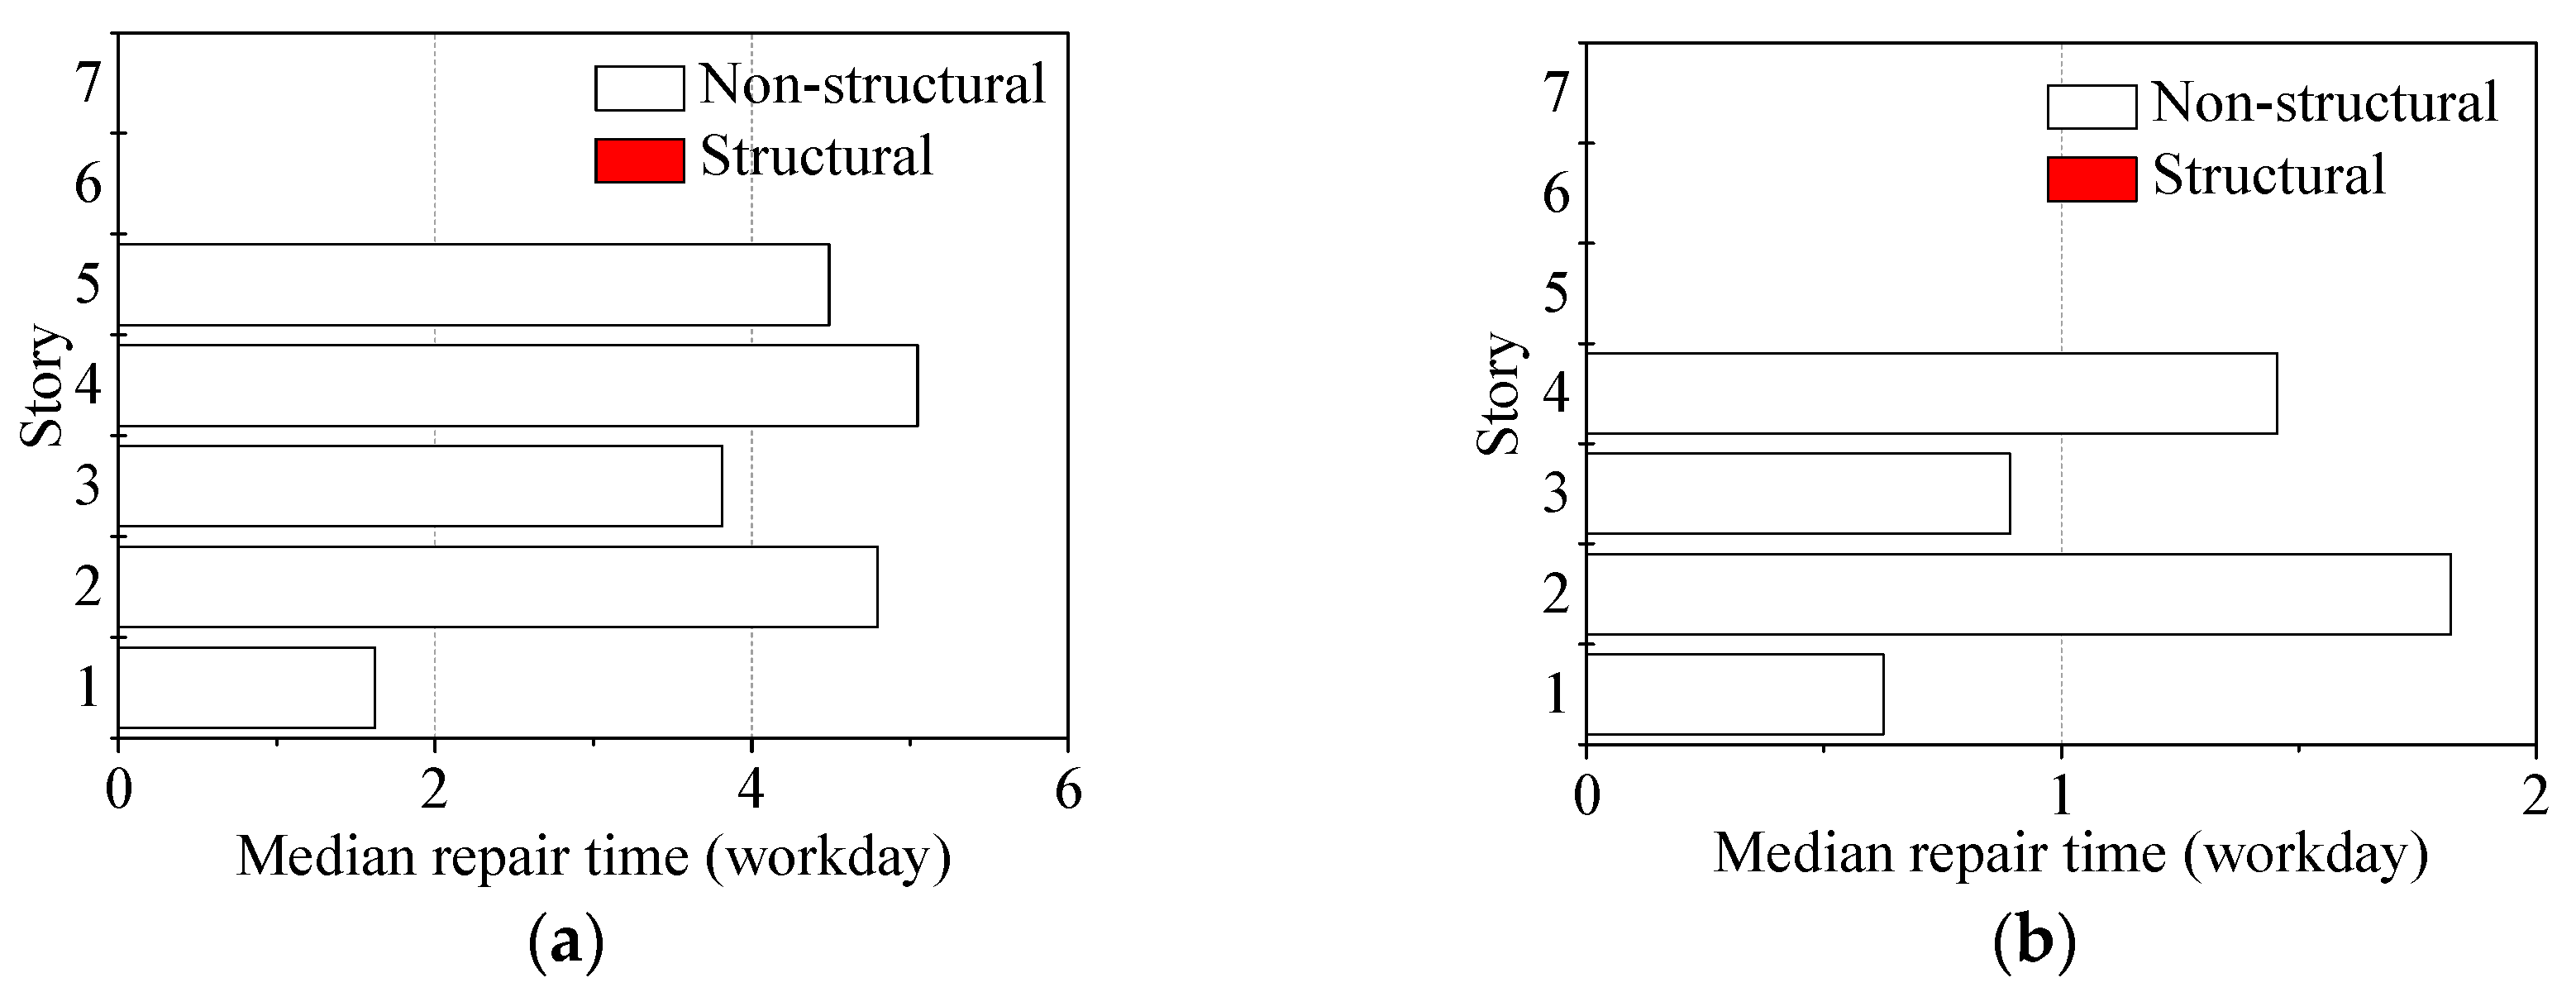
Figure 14a–f compares the repair times between the original frame and retrofitted frame. These figures show that the probabilities are smaller than the specific repair time levels (using the number of workdays as an index). Figure 15 shows the median repair times, which are the values corresponding to a probability of 50% in Figure 14. Table 11 shows the total median repair times of the original frame and the retrofitted frame under a frequent earthquake, occasional earthquake and rare earthquake. The observations are that (1) There are no obvious differences when the two frames are hit by a frequent earthquake, in both cases the repair times are within one week. (2) The repair time for the retrofitted frame is shorter than that of the original frame under an occasional earthquake, requiring 7 workdays for the retrofitted frame and 34 workdays for the original frame. (3) The repair time for the retrofitted frame is obviously shorter than that of the original frame under a rare earthquake, where 53 workdays are required for the retrofitted frame and 402 workdays for the original frame. In this case, the original frame collapses and needs reconstruction. Similar to the calculation of repair cost, demolition and site clearance will increase the structural repair time by up to 20–30%; therefore, the total repair time under rare earthquakes increases by 20%, i.e., 402 × 120% = 482 workdays. Therefore, the ratio between the repair time of retrofitting and the repair time of complete replacement is about 10%. Note that the shorter the repair time to a building, the less the impact of environmental problems.

5. Sustainability Analysis for the Proposed Method

Besides the economic analysis, environmental sustainability is also an important factor nowadays to influencing retrofit planning. Carbon emission is a commonly used index relevant to the ecological environment. The carbon emission calculation for a building can be divided into four stages: material preparation, construction, building use and demolition. The carbon emission model in the life-cycle period is [52]
P L C = P 1 + P 2 + P 3 + P 4
where PLC is the carbon emission in the life-cycle period; and P1, P2, P3, and P4 are the carbon emissions during material preparation, construction, building use and demolition, respectively.
P1 positively correlates to material usages, their carbon emission factors, and their hauling distances. P2 positively correlates to the amount of required equipment and their carbon emission factors, and the number of workdays. In this study, the carbon emission during the building use (P3) for the original frame and for the retrofitted frame is assumed to be almost the same, so P3 is not further discussed later in the calculation. P4 positively correlates to P1 + P2, and so usually 10%(P1 + P2) is adopted in the calculation.
The specific estimation process of carbon emission is as follows. P1 can be calculated using the following equation
P 1 = i = 1 n M i × ( E F c l , i + L i × E F j t , i × 10 4 )
where Mi is the total usage of ith material; EFcl,i is the emission factor of ith material (about 0.2 for steel and 0.15 for concrete [52]); Li is the hauling distance of the ith material; EFjt,i is the emission factor of ith material during hauling (about 0.07 for railway hauling, 1.65 for highway hauling, and 0.15 for waterway hauling [52]); and n is the number of used material types.
P2 can be calculated using the following equation
P 2 = j = 1 n N j × E F s g , j + R × 0.012
where Nj is the amount of equipment of type j; EFsg,j is the emission factor of jth equipment; R is the number of workdays; 0.012 is the estimated value of carbon emission of a person per day; and n is the number of equipment types.
The original frame is collapsed and the retrofitted frame is in a repairable state under a rare earthquake. Therefore, the original frame needs complete replacement, which leads to extra demolition (P4) and much more material usage (P1) for rebuilding than for retrofitting. According to Equation (8), if the hauling type is the same, P1 for original frame will be much larger than P1 for the retrofitted frame, because the Mi for the original frame (in the case of total replacement) will be much larger than that of the retrofitted frame (in the case of repair). It is a difficult thing to estimate how much equipment will be used in the replacement process without a detailed construction organization analysis. However, it is easy to see that more equipment needs to be used in the replacement process than in the repair process. As shown in Table 11, R is 482 days and 53 days for the original frame and retrofitted frame, respectively. Therefore, according to Equation (9), P2 for original frame will be much larger than P2 for the retrofitted frame. Since P3 = 10% (P1 + P2) is adopted in the calculation, P3 for original frame is larger than P3 for the retrofitted frame. In summary, if we want to recover the building function after rare earthquakes, the carbon emission for the original frame will be larger than that for the retrofitted frame in the repair process.

6. Conclusions

For a structure with insufficient earthquake resistance, this study proposed a retrofitting method based on an optimum placement of viscous dampers. The following conclusions can be drawn:
(1)
The proposed retrofitting method can be applied both to satisfy the requirements of design codes and to enhance the structural collapse-resistant capacity of existing structures. An advantage of the proposed method is that the retrofitted structure has a larger earthquake collapse-resistant capacity compared with an ordinary retrofitting method entailing the same retrofitting cost. For a regular 3D frame, the computational cost is low because a 2D frame model can be adopted to determine the optimum placement pattern of the viscous dampers. Similar to other design methods for the placement of dampers, the proposed method is also a procedure based on a series of time-history analyses. However, for the 6-story RC frame structure used in this study, one time-history analysis commonly only takes about three minutes (for the 2D frame model). Therefore, the computational cost of the proposed method is acceptable.
(2)
The economic benefit analysis is conducted to check the convenience of the proposed retrofitting method. The owners can clearly know the economic benefits under different earthquake intensities that may happen in the future. For the 6-story RC frame structure used in this study, during its lifetime cycle, the economic benefit of retrofitting is not favorable if the structure only suffers an earthquake with a frequent earthquake intensity, while the economic benefit of retrofitting is favorable if the structure suffers an earthquake with an occasional earthquake intensity (depending on the building functions which influence the economic loss by downtime/repair time. The example building used in this study is a middle school, meaning that downtime/repair time will not induce much economic loss. However, the economic loss will be higher if it would be a commercial building.), and the economic benefit of retrofitting is significantly favorable if the structure suffers an earthquake with a rare intensity (the ratio between the cost of retrofitting and the cost of complete replacement is about 45%; the ratio between the repair time of retrofitting and the repair time of complete replacement is about 10%); in this case, the retrofitting will save householders’ lives in case of earthquake. This economic benefit analysis results can be provided to householders who may decide whether to perform retrofitting or not. Besides the economic benefit, environmental sustainability is also discussed by way of a carbon emission calculation. Under a rare earthquake, the original frame needs replacement, which leads to more carbon emissions than a retrofitted frame in the repair process.

Author Contributions

Conceptualization and funding acquisition, Writing—review and editing: S.L. Methodology and formal analysis: J.Z.

Funding

This research project was supported by the National Key R&D Program of China (Grant No. 2016YFC0701500), National Natural Science Foundation of China (Grant No. 51578202), and Natural Science Foundation of Heilongjiang (Grant No. YQ2019E021). The financial supports are greatly appreciated by the authors.

Conflicts of Interest

The authors declare no conflict of interest.

References

  1. Stone, R. Wenchuan earthquake—Lessons of disasters past could guide Sichuan’s revival. Science 2008, 321, 476. [Google Scholar] [CrossRef] [PubMed]
  2. Yi, F.X.; Tu, Y. An evaluation of the paired assistance to disaster-affected areas program in disaster recovery: The case of the Wenchuan earthquake. Sustainability 2018, 10, 4483. [Google Scholar] [CrossRef] [Green Version]
  3. Code for Seismic Design of Buildings, GB50010-2010; Ministry of Housing and Urban-Rural Development of P. R.: Beijing, China, 2010.
  4. Smyth, A.W.; Altay, G.; Deodatis, G.; Erdik, M.; Franco, G.; Gulkan, P.; Kunreuther, H.; Lus, H.; Mete, E.; Seeber, N.; et al. Probabilistic benefit-cost analysis for earthquake damage mitigation: Evaluating measures for apartment houses in Turkey. Earthq. Spectra 2004, 20, 171–203. [Google Scholar] [CrossRef]
  5. Di Sarno, L.; Manfredi, G. Seismic retrofitting with buckling restrained braces: Application to an existing non-ductile RC framed building. Soil Dyn. Earthq. Eng. 2010, 30, 1279–1297. [Google Scholar] [CrossRef]
  6. Masi, A.; Santarsiero, G.; Chiauzzi, L. Development of a seismic risk mitigation methodology for public buildings applied to the hospitals of Basilicata region (Southern Italy). Soil Dyn. Earthq. Eng. 2014, 65, 30–42. [Google Scholar] [CrossRef]
  7. Xiang, P.; Nishitani, A. Seismic vibration control of building structures with multiple tuned mass damper floors integrated. Earthq. Eng. Struct. Dyn. 2014, 43, 909–925. [Google Scholar] [CrossRef]
  8. Johnson, J.G.; Pantelides, C.P.; Reaveley, L.D. Nonlinear rooftop tuned mass damper frame for the seismic retrofit of buildings. Earthq. Eng. Struct. Dyn. 2015, 44, 299–316. [Google Scholar] [CrossRef]
  9. Ghiani, C.; Linul, E.; Porcu, M.C.; Marsavina, L.; Movahedi, N.; Aymerich, F. Metal foam-filled tubes as plastic dissipaters in earthquake-resistant steel buildings. IOP Conf. Ser. Mater. Sci Eng. 2018, 416, 012051. [Google Scholar] [CrossRef]
  10. Porcu, M.C.; Vielma, J.C.; Panu, F.; Aguilar, C.; Curreli, G. FRP seismic retrofit of existing buildings led by dynamic non-linear analyses. Int. J. Saf. Secur. Eng. 2019, 9, 201–212. [Google Scholar] [CrossRef]
  11. Porcu, M.C. Partial floor mass isolation to control seismic stress in framed buildings. Int. J. Saf. Secur. Eng. 2019, 9, 157–165. [Google Scholar] [CrossRef] [Green Version]
  12. Pekcan, G.; Mander, J.B.; Chen, S.S. Design and Retrofit Methodology for Building Structures with Supplemental Energy Dissipating Systems; 99-0021; Technical Report MCEER: Buffalo, NY, USA, 1999.
  13. Uriz, P.; Whittaker, A.S. Retrofit of pre-Northridge steel moment-resisting frames using fluid viscous dampers. Struct. Des. Tall Spec. Buil. 2001, 10, 371–390. [Google Scholar] [CrossRef]
  14. Silvestri, S.; Trombetti, T. Physical and numerical approaches for the optimal insertion of seismic viscous dampers in shear-type structures. J. Earthq. Eng. 2007, 11, 787–828. [Google Scholar] [CrossRef]
  15. Impollonia, N.; Palmeri, A. Seismic performance of buildings retrofitted with nonlinear viscous dampers and adjacent reaction towers. Earthq. Eng. Struct. Dyn. 2018, 47, 1329–1351. [Google Scholar] [CrossRef]
  16. Karavasilis, T.L. Assessment of capacity design of columns in steel moment resisting frames with viscous dampers. Soil Dyn. Earthq. Eng. 2016, 88, 215–222. [Google Scholar] [CrossRef] [Green Version]
  17. Kim, J.; Choi, H.; Min, K.W. Performance-based design of added viscous dampers using capacity spectrum method. J. Earthq. Eng. 2003, 7, 1–24. [Google Scholar] [CrossRef]
  18. Lin, Y.Y.; Tsai, M.H.; Hwang, J.S.; Chang, K.C. Direct displacement-based design for building with passive energy dissipation systems. Eng. Struct. 2003, 25, 25–37. [Google Scholar] [CrossRef]
  19. Habibi, A.; Chan, R.W.K.; Albermani, F. Energy-based design method for seismic retrofitting with passive energy dissipation systems. Eng. Struct. 2013, 46, 77–86. [Google Scholar] [CrossRef]
  20. Palermo, M.; Silvestri, S.; Landi, L.; Gasparini, G.; Trombetti, T. “A direct five-step procedure” for the preliminary seismic design of buildings with added viscous dampers. Eng. Struct. 2018, 173, 933–950. [Google Scholar] [CrossRef]
  21. Zhou, Y.; Lu, X.L.; Weng, D.G.; Zhang, R.F. A practical design method for reinforced concrete structures with viscous dampers. Eng. Struct. 2012, 39, 187–198. [Google Scholar] [CrossRef]
  22. Vesna, T.; Stephen, M.; Mary, C.C. Comparative life-cycle cost and performance analysis of structural systems for buildings. In Proceedings of the NCEE 2014—10th U.S. National Conference on Earthquake Engineering: Frontiers of Earthquake Engineering, Anchorage, AK, USA, 21–25 July 2014. [Google Scholar]
  23. Zhang, R.H.; Soong, T.T. Seismic Design of Viscoelastic Dampers for Structural Applications. J. Struct. Eng.-ASCE 1992, 118, 1375–1392. [Google Scholar] [CrossRef]
  24. Singh, M.P.; Moreschi, L.M. Optimal seismic response control with dampers. Earthq. Eng. Struct. Dyn. 2001, 30, 553–572. [Google Scholar] [CrossRef]
  25. Cimellaro, G.P. Simultaneous stiffness-damping optimization of structures with respect to acceleration, displacement and base shear. Eng. Struct. 2007, 29, 2853–2870. [Google Scholar] [CrossRef]
  26. Apostolakis, G.; Dargush, G.F. Optimal seismic design of moment-resisting steel frames with hysteretic passive devices. Earthq. Eng. Struct. Dyn. 2010, 39, 355–376. [Google Scholar] [CrossRef]
  27. Aydin, E. Optimal damper placement based on base moment in steel building frames. J. Constr. Steel Res. 2012, 79, 216–225. [Google Scholar] [CrossRef]
  28. Martinez, C.A.; Curadelli, O.; Compagnoni, M.E. Optimal design of passive viscous damping systems for buildings under seismic excitation. J. Constr. Steel Res. 2013, 90, 253–264. [Google Scholar] [CrossRef]
  29. Shin, H.; Singh, M.P. Minimum failure cost-based energy dissipation system designs for buildings in three seismic regions—Part I: Elements of failure cost analysis. Eng. Struct. 2014, 74, 266–274. [Google Scholar] [CrossRef]
  30. Pollini, N.; Lavan, O.; Amir, O. Minimum-cost optimization of nonlinear fluid viscous dampers and their supporting members for seismic retrofitting. Earthq. Eng. Struct. Dyn. 2017, 46, 1941–1961. [Google Scholar] [CrossRef]
  31. Parcianello, E.; Chisari, C.; Amadio, C. Optimal design of nonlinear viscous dampers for frame structures. Soil Dyn. Earthq. Eng. 2017, 100, 257–260. [Google Scholar] [CrossRef]
  32. Lavan, O.; Amir, O. Simultaneous topology and sizing optimization of viscous dampers in seismic retrofitting of 3D irregular frame structures. Earthq. Eng. Struct. Dyn. 2014, 43, 1325–1342. [Google Scholar] [CrossRef]
  33. Wang, S.; Mahin, S.A. High-performance computer-aided optimization of viscous dampers for improving the seismic performance of a tall building. Soil Dyn. Earthq. Eng. 2018, 113, 454–461. [Google Scholar] [CrossRef]
  34. De Domenico, D.; Ricciardi, G. Earthquake protection of structures with nonlinear viscous dampers optimized through an energy-based stochastic approach. Eng. Struct. 2019, 179, 523–539. [Google Scholar] [CrossRef]
  35. Li, S.; Yu, B.; Gao, M.M.; Zhai, C.H. Optimum seismic design of multi-story buildings for increasing collapse resistant capacity. Soil Dyn. Earthq. Eng. 2019, 116, 495–510. [Google Scholar] [CrossRef]
  36. Li, S.; Kose, M.M.; Shan, S.D.; Sezen, H. Modeling methods for collapse analysis of reinforced concrete frames with infill walls. J. Struct. Eng. 2019, 145, 04019011. [Google Scholar] [CrossRef]
  37. Open System for Earthquake Engineering Simulation (OpenSees). 2016. Available online: http://opensees.berkeley.edu/wiki/index.php/Command_Manual (accessed on 9 January 2018).
  38. Li, S.; Zuo, Z.; Zhai, C.; Xu, S.; Xie, L. Shaking table test on the collapse process of a three-story reinforced concrete frame structure. Eng. Struct. 2016, 118, 156–166. [Google Scholar] [CrossRef]
  39. Code for Seismic Design of Building, GB50011-2010; Ministry of Housing and Urban Rural Development: Beijing, China, 2010. (In Chinese)
  40. Seismic Evaluation and Retrofit of Existing Buildings, ASCE/SEI 7–16; American Society of Civil Engineers: Reston, VA, USA, 2016.
  41. Part 1: General rules, seismic action and rules for buildings. In Eurocode 8. Design of Structures for Earthquake Resistance; European Committee for Standardization: Brussels, Belgium, 2004.
  42. Vamvatsikos, D.; Cornell, C.A. Incremental dynamic analysis. Earthq. Eng. Struct. Dyn. 2002, 31, 491–514. [Google Scholar] [CrossRef]
  43. FEMA 350, Recommended Seismic Design Criteria for New Steel Moment-Frame Buildings; Applied Technology Council: Redwood City, CA, USA, 2000.
  44. FEMA 356, Prestandard and Commentary for the Seismic Rehabilitation of Buildings; Applied Technology Council: Redwood City, CA, USA, 2000.
  45. Benavent-Climent, A.; Cahis, X.; Vico, J.M. Interior wide beam-column connections in existing RC frames subjected to lateral earthquake loading. Bull. Earthq. Eng. 2010, 8, 401–420. [Google Scholar] [CrossRef]
  46. Benavent-Climent, A.; Cahis, X.; Zahran, R. Exterior wide beam-column connections in existing RC frames subjected to lateral earthquake loads. Eng. Struct. 2009, 31, 1414–1424. [Google Scholar] [CrossRef]
  47. Masi, A.; Santarsiero, G. Seismic tests on RC building exterior joints with wide beams. Adv. Mater. Res. 2013, 787, 771–777. [Google Scholar] [CrossRef]
  48. Zareian, F.; Krawinkler, H. Assessment of probability of collapse and design for collapse safety. Earthq. Eng. Struct. Dyn. 2007, 36, 1901–1914. [Google Scholar] [CrossRef]
  49. FEMA P-58, Seismic Performance Assessment of Buildings, Volume 1—Methodology; Applied Technology Council: Redwood City, CA, USA, 2012.
  50. China Engineering Cost Network. 2019. Available online: http://www.cecn.gov.cn/ (accessed on 2 January 2019).
  51. TY 01-89-2016. Quota for Days of Construction of Structures; Ministry of Housing and Urban Rural Development: Beijing, China, 2016. (In Chinese)
  52. Dong, K.H. Study on Carbon Emission Caculation from the Life-Cycle of Large-Scale Complex Building in the South. Master’s Thesis, South China University of Technology, Guangzhou, China, 2018. [Google Scholar]
Figure 1. Layout of frame structure (unit: mm).
Applsci 09 05486 g001
Figure 2. Selected GMs compatible with the design spectrum.
Applsci 09 05486 g002
Figure 3. Placement layout of viscous dampers in the structure (planar frame for illustration).
Applsci 09 05486 g003
Figure 4. Variation of the collapse resistance in the optimum procedure (using Initial scheme 1 as an example; IDR: Inter-story drift ratio): (a) 1st story, IDA (incremental dynamic analysis) curves; (b) 2nd story, IDA curves; (c) 3rd story, IDA curves; (d) 4th story, IDA curves; (e) 5th story, IDA curves; (f) 6th story, IDA curves.
Applsci 09 05486 g004
Figure 5. Comparison between the structural collapse resistance of the initial retrofitted scheme and the optimum retrofitted scheme.
Applsci 09 05486 g005
Figure 6. Average inter-story drift ratio (IDR) under frequent and rare earthquakes: (a) Frequent earthquake; (b) Rare earthquake.
Applsci 09 05486 g006
Figure 7. Locations of yielding in columns of initial retrofitted frame (Initial scheme 5): (a) GM 1; (b) GM 2; (c) GM 3; (d) GM 4; (e) GM 5; (f) GM 6; (g) GM 7.
Applsci 09 05486 g007
Figure 8. Locations of yielding in columns of optimum retrofitted frame: (a) GM 1; (b) GM 2; (c) GM 3; (d) GM 4; (e) GM 5; (f) GM 6; (g) GM 7.
Applsci 09 05486 g008
Figure 9. Collapse fragility curves of the 2D frame.
Applsci 09 05486 g009
Figure 10. Placement of viscous dampers in X and Y directions (placed at shadow bays).
Applsci 09 05486 g010
Figure 11. Average inter-story drift ratio (IDR) under frequent and rare earthquakes: (a) X direction, frequent earthquake; (b) X direction, rare earthquake; (c) Y direction, frequent earthquake; (d) Y direction, rare earthquake.
Applsci 09 05486 g011
Figure 12. Exceedance probabilities of economic loss under different earthquake intensities: (a) 3D original frame, frequent earthquake; (b) 3D retrofitted frame, frequent earthquake; (c) 3D original frame, occasional earthquake; (d) 3D retrofitted frame, occasional earthquake; (e) 3D original frame, rare earthquake (frame is collapse in this case); (f) 3D retrofitted frame, rare earthquake.
Applsci 09 05486 g012
Figure 13. Median values of repair costs under different earthquake intensities: (a) Frequent earthquake; (b) Occasional earthquake; (c) Rare earthquake.
Applsci 09 05486 g013
Figure 14. Exceedance probabilities of repair time under different earthquake intensities (Parallel construction): (a) 3D original frame, frequent earthquake; (b) 3D retrofitted frame, frequent earthquake; (c) 3D original frame, occasional earthquake; (d) 3D retrofitted frame, occasional earthquake; (e) 3D original frame, rare earthquake; (f) 3D retrofitted frame, rare earthquake.
Applsci 09 05486 g014
Figure 15. Median values of repair times under different earthquake intensities (parallel construction): (a) 3D original frame, frequent earthquake; (b) 3D retrofitted frame, frequent earthquake; (c) 3D original frame, occasional earthquake; (d) 3D retrofitted frame, occasional earthquake; (e) 3D original frame, rare earthquake; (f) 3D retrofitted frame, rare earthquake.
Applsci 09 05486 g015aApplsci 09 05486 g015b
Table 1. Dimensions of beams and rebars (X direction).
StorySize (mm × mm) Width × HeightArea of Longitudinal Rebars (mm2)/Stirrup
Side BayMiddle BaySide BayMiddle Bay
Beam EndsMidspanBeam EndsMidspan
1200 × 50200 × 3002250/ϕ8@1001600/ϕ8@2002250/ϕ8@1001350/ϕ8@200
2200 × 50200 × 3002200/ϕ8@1001600/ϕ8@2002200/ϕ8@1001250/ϕ8@200
3200 × 50200 × 3002050/ϕ8@1001600/ϕ8@2002050/ϕ8@1001100/ϕ8@200
4200 × 50200 × 3001800/ϕ8@1001650/ϕ8@2001800/ϕ8@100850/ϕ8@200
5200 × 50200 × 3001450/ϕ8@1001650/ϕ8@2001450/ϕ8@100750/ϕ8@200
6200 × 50200 × 300850/ϕ8@1001400/ϕ8@200850/ϕ8@100600/ϕ8@200
Note: Beams in Y direction have the same usage of rebars as that in X direction.
Table 2. Dimensions of columns and rebars.
StorySize (mm × mm)Area of Longitudinal Rebars (mm2)/Stirrup
Side ColumnMiddle ColumnSide ColumnMiddle Column
1400 × 400400 × 4002000/ϕ8@1001400/ϕ8@100
2400 × 400400 × 400800/ϕ8@1001000/ϕ8@100
3400 × 400400 × 400800/ϕ8@1001000/ϕ8@100
4400 × 400400 × 400700/ϕ8@100700/ϕ8@100
5400 × 400400 × 400700/ϕ8@100700/ϕ8@100
6400 × 400400 × 4001300/ϕ8@1001000/ϕ8@100
Table 3. Selected ground motions (GMs).
TagEarthquakeNGA ID and ComponentYearMagnitude
1San Fernando, USARSN68 SFERN PEL09019716.61
2San Fernando, USARSN93 SFERN WND14319716.61
3Tabas, Iran, USARSN143 TABAS TAB-T119787.35
4Imperial valley—06, USARSN161 IMPVALL.H H-BRA31519796.53
5Imperial valley—06, USARSN178 IMPVALL.H H-E0323019796.53
6Imperial valley—06, USARSN180 IMPVALL.H H-E0514019796.53
7Imperial valley—06, USARSN183 IMPVALL.H H-E0814019796.53
Table 4. Initial placements of dampers to satisfy code-specific requirements (unit: N·(s/m)).
Retrofitting Scheme C 1 C 2 C 3 C 4 C 5 C 6 i = 1 6 C i
Initial scheme 1300,00020,000250,000250,00020,00020,000860,000
Initial scheme 2150,000150,00050,00050,00020,00020,000440,000
Initial scheme 31,300,0001,300,0001,000,000500,00050,00020,0004,170,000
Initial scheme 41,000,0001,000,000800,000250,00020,00020,0003,090,000
Initial scheme 51,200,0001,300,000750,000200,00050,00050,0003,550,000
Initial scheme 6800,000750,000600,000100,00020,00020,0002,290,000
Initial scheme 720,00020,000500,00050,00020,00020,000630,000
Table 5. Variation of damping coefficients in the optimum procedure (using Initial scheme 1 as an example) (unit: N·(s/m)).
Optimum TimesCollapse Resistance C 1 C 2 C 3 C 4 C 5 C 6 i = 1 6 C i
Initial scheme 10.16 g300,00020,000250,000250,00020,00020,000860,000
1st time0.18 g499,23032,883185,666127,18678577178860,000
2nd time0.19 g849,74014765545332900860,000
Optimum scheme 10.19 g849,74014765455332900860,000
Table 6. Damping coefficients in the optimum retrofitted scheme (unit: N·(s/m)).
Strengthen Scheme C 1 C 2 C 3 C 4 C 5 C 6 i = 1 6 C i
Optimum scheme 1849,74014765455332900860,000
Optimum scheme 2262,542115,89931,76520,79651723826440,000
Optimum scheme 33,335,742543,619164,958125,681004,170,000
Optimum scheme 42,741,236186,395101,96660,403003,090,000
Optimum scheme 51,610,2471,339,753553,54146,459003,550,000
Optimum scheme 61,604,274412,497139,411133,818002,290,000
Optimum scheme 7602,094365922,695155100630,000
Table 7. Optimum damping coefficients of 3D frame (unit: N·(s/m)).
3D Frame C 1 C 2 C 3 C 4 C 5 C 6 i = 1 6 C i
X direction2,415,0002,010,000825,00075,000005,325,000
Y direction4,025,0003,350,0001,375,000125,000008,875,000
Table 8. Performance groups considered in the loss estimation of 6-story RC (reinforced concrete) frame.
GroupFragility ID [49]EDPCost/Each (Unit: US Dollar)Number in Each StoryTotal Number
Teaching platformE2202.020PFA194.31060
ProjectorC3033.002PFA448.41060
Table and chairE2022.020PFA14.93001800
BlackboardE2022.021PFA29.91060
ComputerE2022.022PFA448.41060
Table 9. Construction periods of key items of the 6-story RC frame.
Construction ItemsConstruction Period (Unit: Workday)
Foundation project30
Upper structure project305
Decorate project60
Elevator system installation50
Heat-supply system installation50
Air conditioning system installation65
Electric power substation project40
Total required workdays600
Table 10. Statistical data on the performance groups of the 6-story frame.
Performance GroupFragility ID [49]EDPCosting Based Upon in PACT [49]Number in Each StoryTotal Number
Structural memberBeam jointsB1041.101bIDR1 EA24144
Non-structural memberCurtain wallsB2022.001IDR30 SF34.82208.92
PartitionsC1011.001aIDR100 LF5.3231.92
Wall finishesC3011.001aIDR100 LF1.348.04
Cold water pipingD2021.011aPFA1000 LF0.070.42
Hot water pipingD2022.011aPFA1000 LF0.402.40
D2022.021aPFA1000 LF0.160.96
Sanitary waste pipingD2031.011bPFA1000 LF0.211.26
HVAC equipmentD3041.011aPFA1000 LF0.241.44
D3041.031aPFA10 EA2.3714.22
Variable Air Volume (VAV) boxD3041.041aPFA10 EA1.9011.4
Concrete tile roofB3011.011PFA100 SF32.2832.28
Recessed ceiling lightingC3033.001PFA1 EA71.21427.26
Independent pendant lightingC3034.001PFA1 EA71.21427.26
Sprinkler water supplyD4011.021aPFA1000 LF0.855.1
D4011.031aPFA100 EA0.382.28
StairsC2011.001aIDR1 EA2.0012
Low voltage switchgearD5012.021aPFA225 AMP1.006
ElevatorD1014.011PFA1 EA1.001.00
Motor control centerD5012.013aPFA1 EA2.002.00
Note: HVAC, Heating Ventilation Air Conditioning.
Table 11. Median repair times of the original frame and retrofitted frame (unit: workday).
FrameFrequent Earthquake PGA = 0.07 gOccasional Earthquake PGA = 0.2 gRare Earthquake PGA = 0.4 g
3D original frame534482
3D retrofitted frame2753